
Abstract
A fuzzy prediction model has been built based on hydrogen peroxide concentration, bleaching temperature, and time of bleaching as the input variables and knitted cotton fabric bursting strength as the output variable. Fuzzy expert systems can map efficiently in nonlinear domains with minimal experimental data. The model developed in the present study has been validated by new experimental data. The root mean square, mean absolute error percentage, and coefficient of determination (R 2 ) between the predicted and experimental values were found to be 4.89, 0.707, and 0.965 respectively. The results confirm that the model can be applied successfully for the prediction of fabric bursting strength in textile dye houses.
Introduction
Bursting strength is one of the major fundamental mechanical properties of single jersey knitted cotton fabric. Tensile and tearing strength tests are usually done for woven fabrics, which are not appropriate for knitted fabrics due to their structural properties. For that reason, testing bursting strength is highly important, especially for knitted fabrics. The fabric needs to go through different multi-axial forces during wet processes and wear. Therefore, the test is generally performed to assess the fabric's ability to survive multi-axial stresses without breaking.1-4
There are some variables, like fabric density and yarn properties, which are the basic elements affecting the strength of knitted fabric. These includes type, count, tenacity, breaking elongation, breaking strength, twist, and evenness of yarn, areal density, loop length, and cover factor of fabric. Nevertheless, peroxide bleaching, which is one of the foremost pre-treatment processes of knitted fabrics, has a significant effect on bursting strength due to formation of oxy-cellulose under alkaline condition.5-7
Hydrogen peroxide is popular among bleaching agents as it can bleach both cellulose and protein fibers effectively. 8 It is stable in acidic medium, but bleaches under alkaline conditions. It liberates per-hydroxyl ion (HO2−), which acts like a weak dibasic acid. Per-hydroxyl ion is very unstable and, in the presence of oxidizable materials (e.g., colored impurities in cotton), decomposes and initiates the bleaching process. 9 However, this process is generally applied at near boiling temperatures in a pH range between 10.5 and 12, which encourages possible radical reactions of peroxide with cellulose fibers. These reactions cause loss of degree of polymerization in cellulose and, therefore, become responsible for reducing the fabric bursting strength. 10
Attempts were made by Haque et al. to optimize bleaching parameters to achieve a balance between bursting strength and whiteness index.6,11 Some non-linear parameters (i.e., concentration of bleaching agent, temperature, and time duration) that are interrelated in bleaching are found to be significant in affecting bursting strength at constant pH. Prediction of bursting strength before bleaching starts is important as the fabric will need to undergo different dyeing and finishing processes afterward.
Predicting the bursting strength of knitted fabrics was done by a few researchers with artificial neural network and adaptive neuroinference system models. Jamshaid et al. used an adaptive neuroinference system model for the prediction of bursting strength of knitted fabrics, with stitch length, yarn tenacity, and fabric areal density as input variables. 1 Both artificial neural network and adaptive neuroinference system models were used by Ertugrul and Uçar for predicting the bursting strength of knitted fabrics as a function of yarn strength, yarn elongation, and fabric areal density. 3 Unal et al. predicted bursting strength by an artificial neural network model as a function of yarn count, yarn strength, yarn elongation, yarn twist, yarn evenness, and fabric wales and courses. 4 There were other reports of using the artificial neural network model for predicting bursting strength of knitted fabrics, as well as the strength of woven fabrics.12-13 However, artificial neural network and adaptive neuroinference system models require large amounts of input-output data to optimize model parameters, which is difficult, time consuming, and labor intensive.1,14 In addition, an artificial neural network does not suggest the core logic on which decisions can be made. 15
In contrast, the fuzzy expert system is a capable modelling tool that can overcome the gaps in artificial neural network and adaptive neuroinference systems, as well as statistical regression. It is based on fuzzy logic and can easily translate the experience of experts into a set of inference system-based rules, focusing on modes of reasoning that are approximate rather than exact. Fuzzy expert system implementation is simpler than other models because it is able to perform well with a small amount of experimental data in non-linear, ill-defined, trial-and-error, and complex textile domains. Moreover, the fuzzy expert system is more logical, less expensive in design and cost, and easy to apply.5,14,16-18
Fuzzy models have been applied to many kinds of textile research, including predicting strength of ring-spun cotton yarn, spirality of knitted fabric, tactile sensory properties of knitted fabric, fabric areal density from yarn parameters, needle penetration force in denim fabric, and shrinkage properties of knitted fabric.16,19-22 Fuzzy logic models were also considered for the prediction of bursting strength of knitted fabric, where stitch length, yarn count, and yarn tenacity were considered as the input variables. 5 However, the prediction of bursting strength of knitted fabric from varying bleaching parameters has not been previously reported.
Fuzzy logic is an extension of crisp logic derived from fuzzy mathematical set theory laid down by Zadeh.18,22-24 This is artificial intelligence (AI) possessing a multi-valued logic structure. It contains four principal modules, which are shown in Fig. 1.21,25
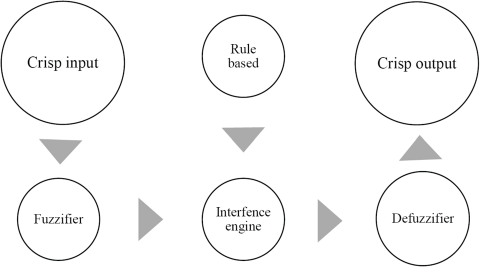
Basic units of fuzzy expert system.
Fuzzification, using the Fuzzifier module in Fig. 1, converts all numerical input and output variables into linguistic fuzzy sets (i.e., high, medium, low) within the range from 0 to 1 by membership functions. 22 Different forms of membership functions are available, such as triangle, trapezoid, and Gaussian, of which the triangle membership function is the simplest and most frequently used due to its exactness. 26 It is defined in Eq. 1.
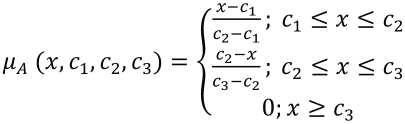
c2 is the most promising value, and c1 and c3 are the left and right spread (the minimum and maximum value that x can take).
The knowledge base is comprised of a database as well as a rule base. In the fuzzy knowledgebase system, knowledge is characterized by if-then rules.27,28 Fuzzy rules are the core of the fuzzy expert system and regulate the relationship between input and output of the model.15,16 The rule base can be classified as either Mamdani or Sugeno models.18,27 In the Mamdani model, both antecedent and consequence parts are included in fuzzy set form. In the Sugeno model, the antecedent part remains in the form of a fuzzy set and the consequence part becomes a linear equation or constant. The expression of fuzzy inference rules, while consisting of two inputs and one output, are shown in Eqs. 2 and 3.


x1, x2, and y are linguistic variables, A1, A2, and C1 are the consequent fuzzy numbers that represent the linguistic states, and b0, b1, and b2 are the linear equation parameters.18,22
The inference engine is a control mechanism that plays a dominant role in fuzzy modelling for its capacity for human decision making and gathering fuzzy control actions by the fuzzification module. Generally, the Mamdani model is used to combine the fuzzy sets into a single fuzzy set.22,27
For a two inputs and single output fuzzy system, the fuzzy inference method is expressed as in Eqs. 4 and 5. 29


I1, I2, and O1 are the input and output variables, αi is the weighting factor as a measure of the influence of i-th rule to the fuzzy control action, and μAi, μBi, μCi, and μC are the membership functions associated with fuzzy sets Ai, Bi, Ci, and C respectively.
The defuzzification module transforms the fuzzy output into a nonfuzzy numeric value (Z) as control actions. Among the methods of defuzzification, the center of gravity method is most regularly used, which is calculated from Eq. 6. 22
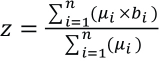
bi represents the position of the singleton in the i-th universe, whereas μi is equal to the membership function of rule i.
In industrial scale bleaching processes, the amount of bleaching agent, temperature, and time required are determined by the total weight of fabric used in the process. The possible influence of yarn count, type of stitches, or areal density of a fabric are hence merged with the influence of total weight of a fabric, which represents the amount of total material present in a bleaching process and is irrespective of the internal properties. Thus, the developed fuzzy model in this experiment is likely to cover all plain single jersey knitted fabric bleaching, as its input variables correspond to the total fabric weight used in the process. However, the influence of internal properties of a fabric, like yarn count and type of stitches, are likely to affect the fabrics strength properties. Therefore, future research is required to understand those influences on this model.
Experimental
Fabric and Chemicals
Single jersey knitted cotton fabrics (Impress-Newtex Composite Textiles Ltd.) of 130 g/m2 were used for the experiment. Sodium hydroxide (NaOH) and hydrogen peroxide (H2O2) of commercial grade and supplied by Samuda Chemical Complex Ltd. were used for the bleaching. In addition, Kappazon H53 peroxide stabilizer (Kapp-chemie) was used.
Bleaching
Bleaching of the fabric samples was done in a Mathis Labomat sample dyeing machine. Fabrics were treated according to a set of values for H2O2 concentration (1.6 to 2.6 g/L), temperature (78 to 108 °C), and time (20 to 60 min). Sample weight was 12.5 g, with a 1:10 material liquor ratio (LR). The concentrations of NaOH and Kappazon H53 were kept 2 g/L and 1 g/L, respectively, for each bleaching process. After-treatment was performed using a hot wash (70 °C), followed by a cold wash (27 °C), squeezing by hand, and drying (70 °C, 30 min). A total of 192 bleached samples were collected (four replicates for each of the 48 test parameters) for the bursting strength test.
Bursting Strength Measurement
The bleached fabrics were tested in a SDL Atlas bursting strength tester following the ISO-139388-1 method. 5 Each test was conducted four times and an average value was calculated. The results are shown in Table I along with the standard deviations.
Experimental Results of Bursting Strength a
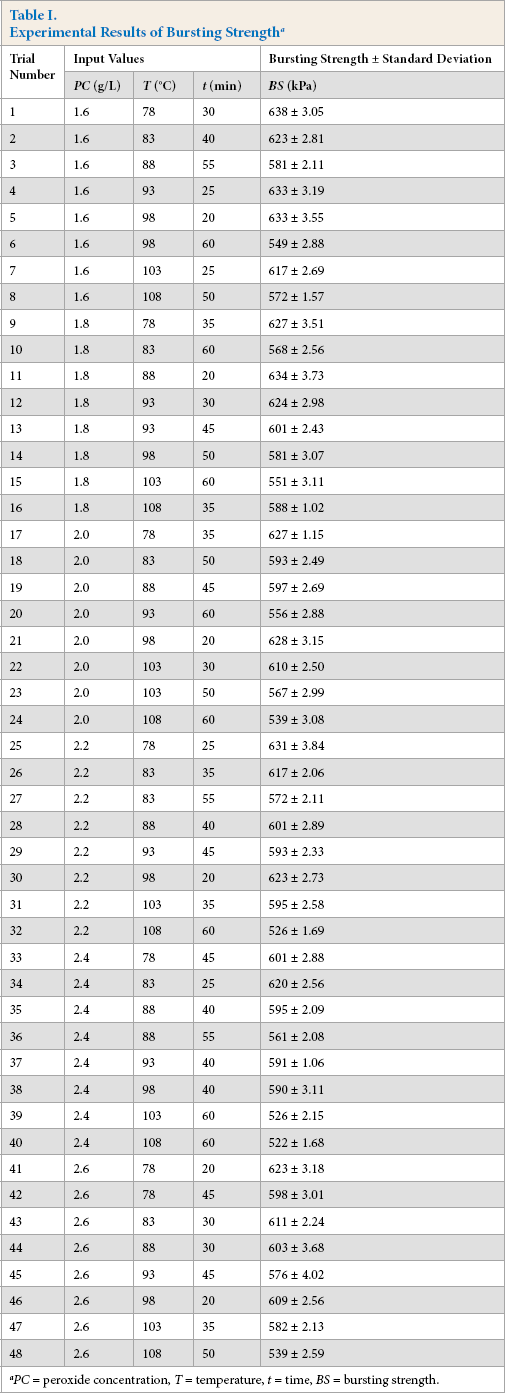
PC = peroxide concentration, T = temperature, t = time, BS = bursting strength.
Development of Fuzzy Prediction Model
Bleaching process parameters, such as hydrogen peroxide concentration (PC), temperature (T), and time (t) were used as input variables and bursting strength (BS) of the bleached fabrics as the output variable for the development of the fuzzy prediction model. A MATLAB Fuzzy Logic Toolbox (version 7.10.0) was used to develop the proposed fuzzy prediction model of bursting strength. For fuzzification, the input variable PC was specified by five possible linguistic fuzzy sets, namely very low (VL), low (L), medium (M), high (H), and very high (VH). Four fuzzy numbers, T1, T2, T3, and T4 were used for the input variables of T and for t, six fuzzy numbers t1, t2, t3, t4, t5, and t6 were considered. For the output variable BS, eight linguistic fuzzy sets, namely L1, L2, L3, L4, L5, L6, L7, and L8 were used. These linguistic fuzzy sets covered the complete range of inputs and output parameters for the cotton bleaching process. The linguistic fuzzy sets for input-output parameters are shown in Table II.
Linguistic Fuzzy Sets for Input-Output Parameters
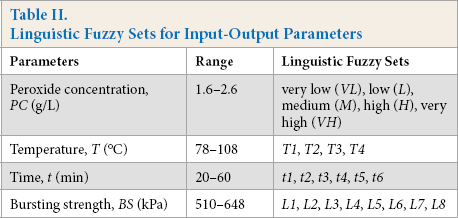
For this fuzzy prediction model, triangular-shaped membership functions were considered for both input and output variables as it was accurate among other all membership functions. 26 The triangular-formed membership functions for the fuzzy variables PC, T, t, and BS developed with the MATLAB Fuzzy Toolbox are shown in Figs. 2–5.
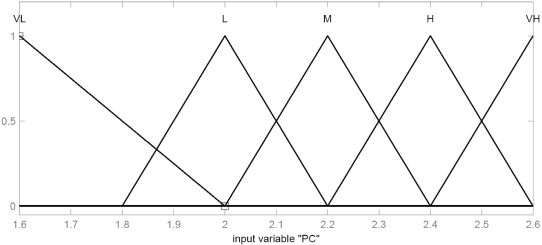
Membership function of input variable PC.
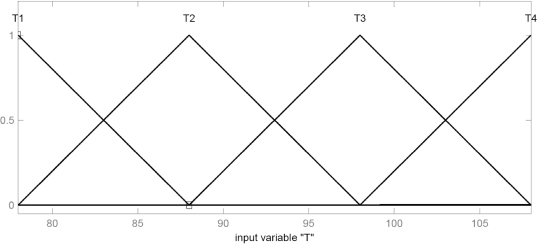
Membership function of input variable T.
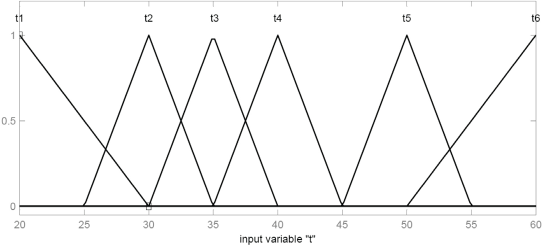
Membership function of input variable t.
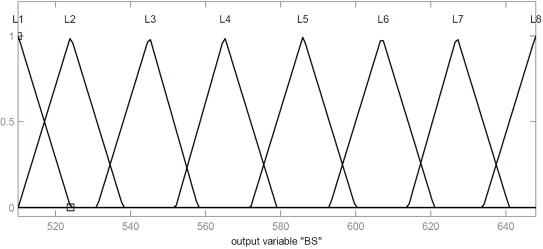
Membership function of input variable BS.
Following fuzzification, a total of 120 rules were formed for the input and output parameters based on expert knowledge and previous experience. A Mamdani max-min inference approach was used to collectivize the fuzzy sets into a single fuzzy set. Lastly, the center of gravity defuzzification method was applied to transform the fuzzy output into a non-fuzzy crisp numeric value using Eq. 6. 22 The schematic diagram of the modelling is shown in Fig. 6.
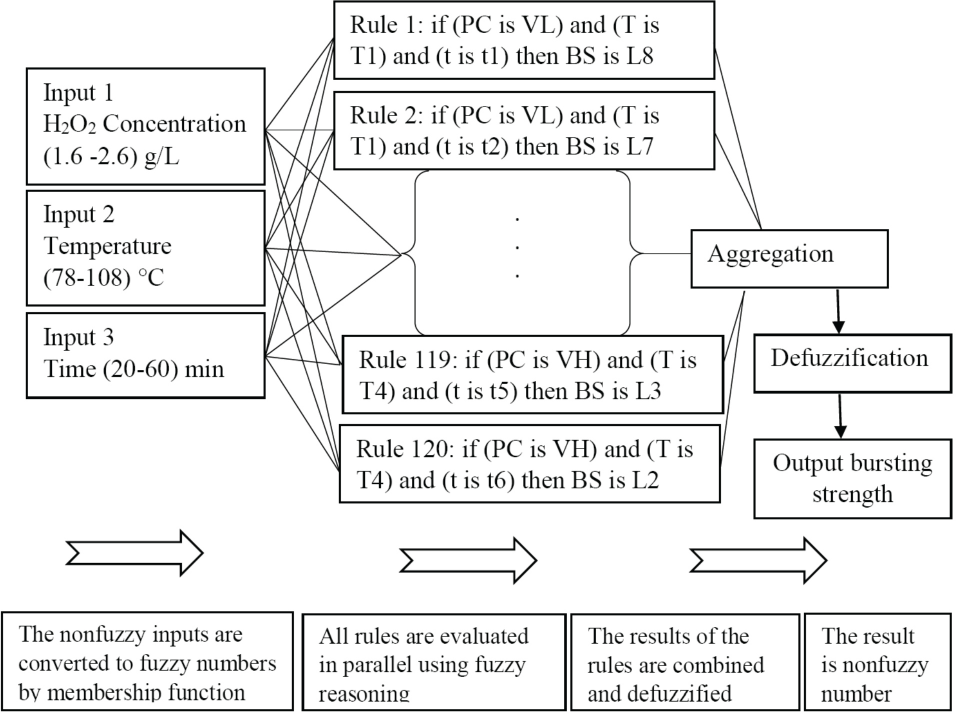
Schematic diagram of fuzzy modelling for predicting BS.
Prediction Performance Analysis
The prediction performance was analyzed by coefficient of determination (R 2 ), root-mean square, and mean absolute error percentage to assess the fuzzy logic results.
The formulations are given in Eqs. 7–9, respectively.
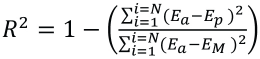
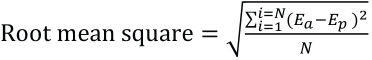

Ea is the actual result, Ep is the predicted result, Em is the mean value, and N represents number of patterns.
The coefficient of determination (R 2 ) is likely to compare the accuracy of a given model with the accuracy of a trivial benchmark model, whereas the root mean square becomes small (close as zero) for good accuracy of prediction. The mean absolute error percentage shows the deviation between the predicted and investigational values and is required to reach zero.
Results and Discussion
Fuzzy Prediction Model Operation
An example of the graphical operation of the fuzzy logic model is shown in Fig. 7. Only one fuzzy rule (Rule 10) out of 120 is shown in the image for simplicity. According to Rule 10, when the H2O2 concentration was very low (VL), the temperature was T2, time for bleaching was t4, and bursting strength was L6. For instance, if PC was 1.8 g/L, T was 88 °C and t was 40 min. All 120 fuzzy rules were reviewed simultaneously to get the fuzzy output bursting strength (BS). After aggregation and defuzzification, the ultimate crisp output bursting strength of the fuzzy set was found to be 627 kPa.
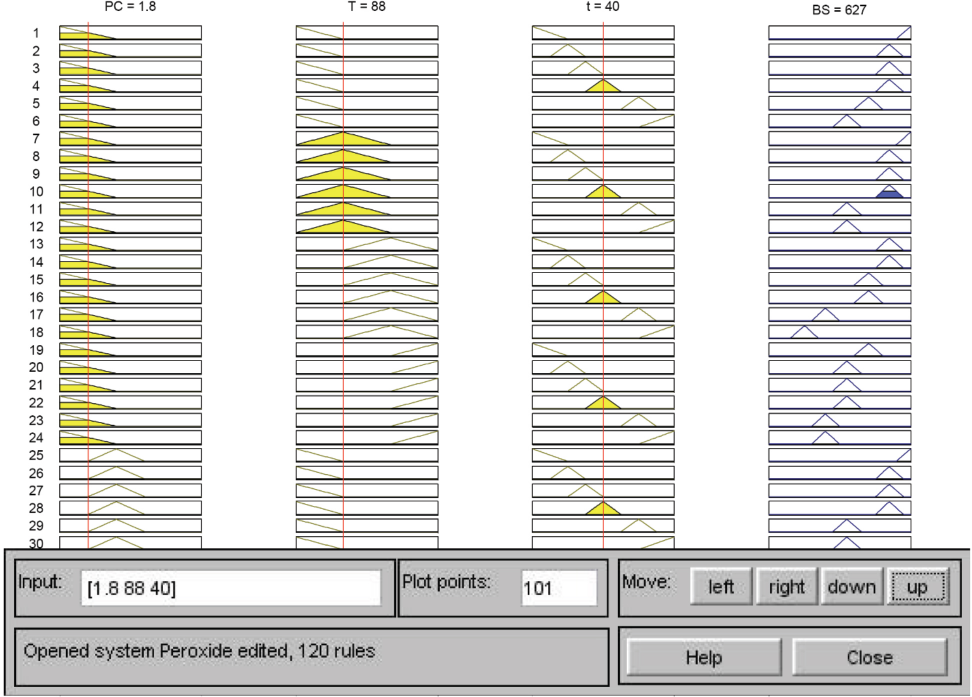
Graphical operation of fuzzy logic model.
Influence of Input Variables on Bursting Strength
The fuzzy control surfaces were developed using MATLAB as shown in Figs. 8–10. The images show the relationships between H2O2 concentration (PC), temperature (T), and time (t) on the input side, and bursting strength (BS) on the output side.
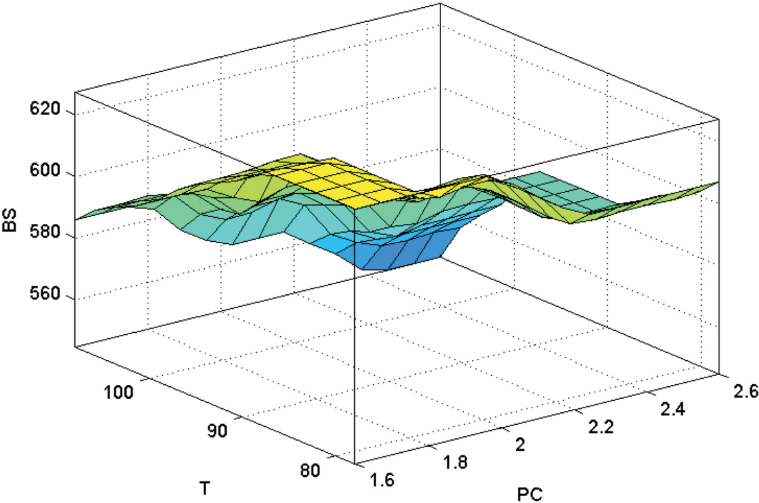
Surface plot showing the effect of PC and T on BS.
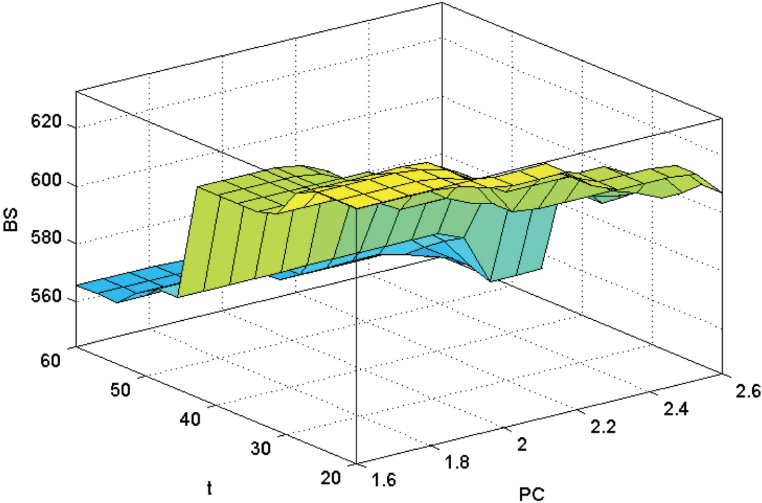
Surface plot showing the effect of PC and t on BS.
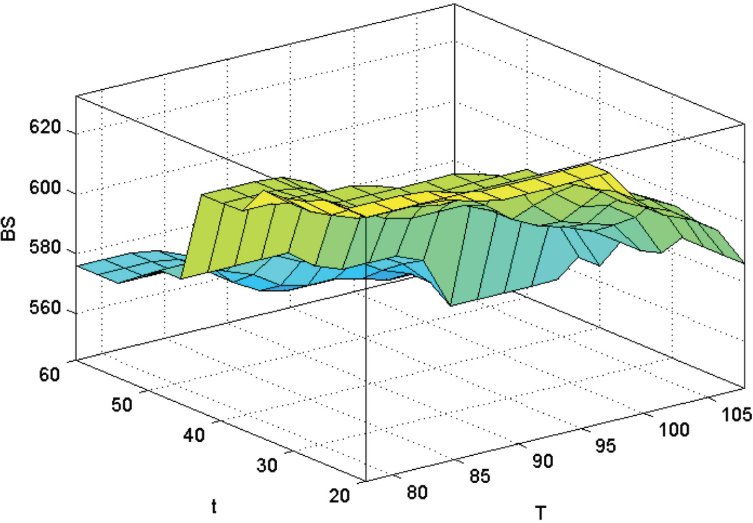
Surface plot showing the effect of t and T on BS.
Fig. 8 shows that BS decreased with increased PC and T, and vice versa. At the start, the decline in BS was slow, but after a certain value of T, it decreased rapidly. In contrast, the decline in BS was less than that of T with the increased value of PC. BS decreased ∼3.80% with a 62.5% increase in PC whereas BS decreased 6.13% with a 38.46% increase in T. This indicates that bursting strength was affected by temperature significantly, even at a fixed concentration of H2O2.
A similar phenomenon was observed for t and PC on BS as shown in Fig. 9. BS decreased slowly at first with the increase in t. But after a certain value of t, the BS decline became sharp. BS decreased ∼9.21% on a 200% increase in t.
From Fig. 10, at a certain PC, BS decreased 2.25% from 78 to 98 °C, but a greater percentage of strength was lost (3.97%) from 98 to 108 °C. BS decreased 3.98% from 20 to 45 min, but it decreased 5.45% when t was increased from 45 to 60 min. The rapid decrease in BS after certain T and t values was most likely due its gradual decline in strength during the process by oxy-cellulose formation, which lowered its resistance to the bursting force.
Moreover, if t remained constant at 20 min, BS decreased 12.29% from 1.6 g/L to 2.6 g/L PC when T was also raised from 78 to 108 °C. If T remained constant at 78 °C, BS decreased 13.56% for the change of PC from 1.6 g/L to 2.6 g/L, as well as increasing time duration from 20 to 60 min. However, BS decreased only 3.80% for the PC variation if the temperature and time were kept constant at 78 °C and 20 min respectively. If the temperature, time, and peroxide concentration were considered at their maximum values (108 °C, 60 min, and 2.6 g/L), the loss of strength was 21.23% from the initial condition (78 °C, 20 min, and 1.6 g/L), which suggests that all the three variables have synergistic effects on the decline of bursting strength. The H2O2 concentration had a negative influence on bursting strength, which decreased significantly at greater temperature and time.
Validation and Comparison of Fuzzy Model
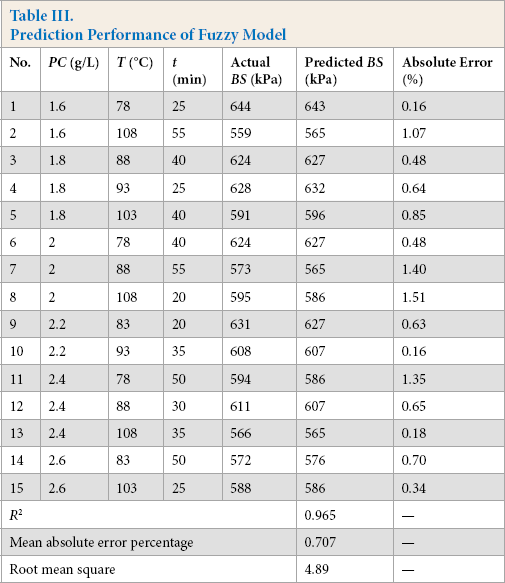
The fuzzy prediction model was validated by some new inves-tigational data. 15 Fabric samples were bleached again using random parameters to validate the fuzzy model. The correlation between the actual bursting strength and that predicted by the fuzzy logic model is illustrated in Fig. 11. The root-mean square, mean absolute error percentage, and coefficient of determination (R 2 ) between the predicted and experimental values of knitted fabric bursting strength were found to be 4.89, 0.707, and 0.965, respectively, in close conformity to the developed model. The results are shown in Table III, showing the excellent prediction performance of the developed model.
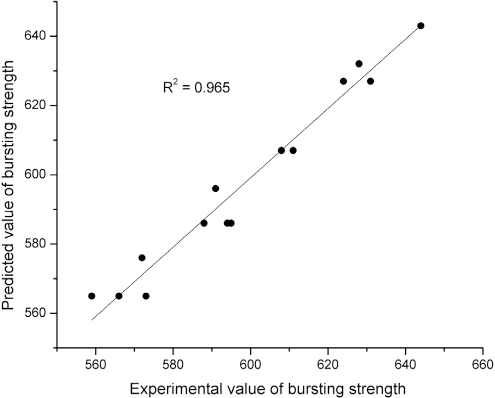
Correlation between actual and predicted values of BS.
Prediction Performance of Fuzzy Model
Conclusions
A fuzzy model was developed for the prediction of the bursting strength of single jersey knitted cotton fabric based on bleaching parameters. The model was generated by taking three bleaching process parameters (peroxide concentration, temperature, and time) as the input variables and fabric bursting strength as the output variable. The model presented a robust perspective on the interaction between bleaching process variables, as well as their influences on bursting strength. All three variables had synergistic effects on the loss of bursting strength. The concentration of H2O2 had a negative impact on bursting strength, which decreased significantly with greater temperature and time. The fuzzy model derived in this research was verified from new experimental data. The root-mean square, mean absolute error percentage, and coefficient of determination (R 2 ) between the predicted and experimental values of bursting strength were found to be 4.89, 0.707, and 0.965 respectively. The results showed an outstanding prediction performance of the developed fuzzy model. The model is highly suitable for predicting the bursting strength of single jersey knitted cotton fabric.