
Abstract
This study compared three brands of T-shirts for selected structural and performance attributes. The impact was examined by brand and frequency of washing. Six null hypotheses were developed and tested using one-way ANOVA and
Keywords
Introduction
Customer satisfaction is a critical factor in marketing and promotion of products because it drives sales. Consumer decision making to purchase or not to purchase any apparel merchandise depends on its structural and performance attributes. Product quality is a function of its appearance, performance, and usefulness for intended purpose. Previous research shows that customer satisfaction for durable goods is directly related to the performance of the product. 1 Quality and consumer decision making go hand in hand. 2 Due to the vast variability in garment prices and quality, the consumer may be confused and needs criteria on care and performance of merchandise. Fabric characteristics, including construction and care as factors that impact consumer decision making, help to determine whether to buy apparel products or not. 3 Predictors of quality impact sales. 4 Overall product evaluation is the combined effect of positive and negative factors that can impact consumer decision making. 5 Textile testing is an important tool in determining the quality of textile products. 6
Although previous literature provides information on the importance of apparel performance on consumer decision making regarding purchase/non-purchase decisions, none of the previous work was discussed in the context of textile testing. The conceptual context to demonstrate the relationship between customer satisfaction and textile testing are demonstrated through two flow models (Figs. 1 and 2). Additionally, it is important to recognize inconsistencies and gaps in the previous literature on the topic. Most of the previous dimensional stability research reported that fabrics do not change dimensionally after the fifth wash. However, experience suggests that dimensional changes could go beyond the fifth wash.
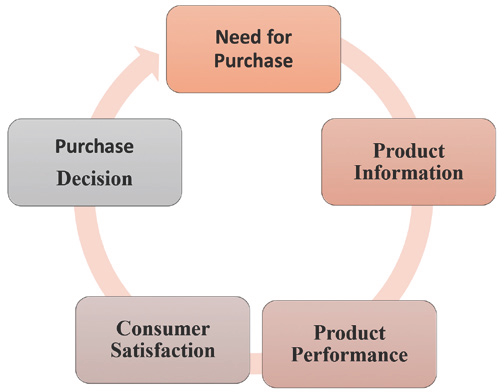
Consumer decision-making model for apparel consumer.
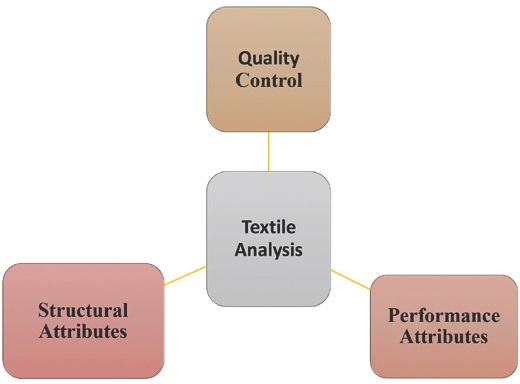
Textile analysis: structural and performance attributes.
Therefore, the present study was undertaken to compare three brands of cotton T-shirts for their structural and performance attributes after multiple launderings. Previous research studies using five washes claimed no further shrinkage after the fifth wash. The present study washed them 25 times and recorded dimensional stability after the 5th, 10th, 15th, 20th, and 25th washes.
Both appearance and comfort are important for any apparel items. Therefore, studying related textile attributes was deemed important. The present study tested colorfastness to color change and staining as well as horizontal wicking and pilling. Knitted T-shirts were selected because they are worn universally and have several brands in different price ranges. None of the previous research tested the performance of apparel for both structural and performance attributes that impact appearance, care, durability, and performance of T-shirts. The present study also compared the impact of standard and commercial detergents (powdered form), which is supported in the literature. 7 The present study is significant because it interprets data from the consumer perspective, rather than the advancements in equipment and processes perspective.
Literature Review
Importance of Standardized Conditions
The importance of conditioning for textile testing is reinforced by many textile researchers and studies.6,8–11 Conditioning is defined as the process of equilibrating specimens within standard atmospheric conditions. 6 In general, textiles should be conditioned at a temperature of 21 ± 1 °C and relative humidity (RH) of 65% ± 2%. Conditioning fabrics before testing enhances the reliability of results for textiles. 9 Previous research provided the significance of standardized conditions on testing results.8,9 Conditioning textiles under standard conditions prevent problems occurring due to differences in moisture regain potential of some fiber contents.6,8Keeping textiles under standardized conditions for the recommended time brings them to “moisture equilibrium.” 11
Structural Attributes and Quality
The structural attributes of textiles impact textile performance. These include fabric count, fabric thickness, and fabric weight. Plain stitch knits showed more weight loss than tuck stitch knits from the relaxation shrinkage method. 12 Fabric weight is a more accurate predictor when shrinkage is controlled. Fabric count (wales times courses) can increase during dyeing and printing. 13 Fabric density is the product of fabric weight and fabric thickness and impacts comfort. 11 Lightweight, thicker fabric will be more comfortable in winter than thinner fabric of the same weight.
Cotton is used universally for comfort. 14 Cotton fabric thickness impacts comfort. 15 Overall, structural attributes contribute toward the textile's bulk, comfort, quality, resilience, and warmth. 6 They offer infrastructure that influences quality and performance of fabrics and allow consumers to make appropriate choices for various intended uses. 6
Performance Attributes
It is assumed that machine washed/machine dried cotton casual wear garments will withstand a reasonable degree of laundering and wearing over time. Colorfastness to laundering, dimensional stability, pilling, and wicking are important attributes for garments.
Colorfastness to Laundering
Colorfastness to laundering refers to the resistance of color to transfer to a crock square or multi-fiber strip as a result of laundering.
6
Colorfastness refers to “the resistance of a material to change in any of its color characteristics, to transfer of its colorant(s) to adjacent materials or both, as a result of the exposure of the material to any environment that might be encountered during the processing, testing, storage, or use of the material.”
7
Laundering refers to “a process intended to remove soils and/or stains by treatment(s) with an aqueous detergent solution and normally including subsequent rinsing, extracting and drying.”
7
One study reported that use of a lower percentage of mordants gave better values in color change and staining than the higher percentage for colorfastness.
16
In other words, the smaller the amount of mordant in the collective load of laundry, the less likely there is for color transfer to other items in the wash. The passing grade suggested for seamless knit garments is a minimum of 4 for color change and a minimum of 3 for staining based on ASTM D7268-14.
10
Literature also discusses measuring color change with a spectrophotometer for CIELAB and Δ
Dimensional Stability
Dimensional stability refers to shrinkage or growth in fabric after it has gone through the recommended care procedure. The procedure could include dry cleaning, hand washing, or laundering. For cotton T-shirts, laundering is considered the optimal choice. Technically, dimensional change is “a generic term for changes in length or width of a fabric specimen subjected to specified conditions. The change is usually expressed as a percentage of the initial dimension of a specimen.” 7
A study on post-laundering (five washes) impact on structural and performance attributes revealed that white, washed T-shirts had higher fabric count, higher thickness, and fabric weight than the unwashed T-shirts. 18 For performance attributes, abrasion resistance was higher for washed than unwashed T-shirts for two of the three brands, horizontal wicking was higher for washed than unwashed T-shirts, and was also true for pilling. 18 The passing grade suggested for dimensional stability for seamless knit garments was 5% maximum based on ASTM D7268-14. 10
Dimensional stability of T-shirts, when washed with standard and commercial detergents, differed significantly in both length and width directions after the first, third, and fifth washes. 19 This previous study used changes in different parts of T-shirts collectively. Examining data for each of the six measurements separately provided better insight for determining specific changes in a sewn garment. In other research, raw materials had the worst dimensional stability when compared to dyed and treated knits. 20 Plain jersey was reported to have lower dimensional stability after laundering in length than width. Shrinkage was reported to be 4.2% in length and 25.8% in width. These researchers did not report the number of washes used in their study.
Cotton knit fabrics were reported to have a high degree of dimensional stability. 14 Jersey had higher shrinkage (12.5%) in width, and double pique in the length direction (11.25%) in one study. 21 Knitted fabrics treated with resin reduced shrinkage to 5.1% in length and 3.2% in width. 21 Hussain et al. used Lacoste pique from 100% cotton, 30 courses and 24 wales/in., and a fabric weight of 5.014 oz/yd 2 . 22 This report noted that an increase in resin concentration decreased the shrinkage of cotton pique knits.
Five launderings were used to determine wicking and drying properties of seamless garments. 23 Other studies recommended recording dimensional changes after the first, third, and fifth launderings for woven fabrics.24,25 Another report stated that a casual wear garment should last for at least five launderings. 26 A study on workwear found that fabric did not shrink more than 1% after twenty wash and dry cycles. 26 Workwear is expected to be durable. Therefore, Doty and Easter 26 used twenty instead of the five launderings reported by other researchers.23–25
Pilling
Pills refer to bunches or balls of tangled fibers held on the fabric surface by one or more fibers temporarily or permanently.10,26,28 Pilled fabrics reflect change in a fabric's appearance, color, and hand. Knitted fabrics pill more than woven fabrics due to their open construction. Pilling is the result of friction experienced by garments during wear and care over time. Staple fibers pill more than filament fibers.11,29Yarns made with staple fibers having low twist are likely to create more pills than highly-twisted yarns. 11 Pilling can adversely affect appearance, feel, texture and service of the textile material and, therefore, its quality. 30
Pilling was reported to be higher for plain jersey than Lacoste and two thread fleece and increased with successive launderings. 31 Another study reported that wet fabric softeners caused higher pilling on flannel fabrics than those treated with cellulase enzymes and that cellulase enzymes reduced the fuzziness of pilling. 32 Yarn type can impact pilling resistance. Compact spun yarns had 40-50% less pilling than ring spun yarns. 33 Knitting patterns such as “links-links, seed stitch, and moss stitch” showed the least pilling resistance. 34 In one study that examined workwear and active wear, negligible pilling was observed for workwear. However, pilling was none to severe for the active wear tested. 27 The same study noted that pilling was more severe between 11th and 20th wash. Another study reported that interlock fabric, dyed material, and compact spun yarns had higher pilling resistance than jersey, raw fabric, and ring-spun yarns. 35 Pilling was related to yarn hairiness for woven fabrics in another investigation. 36
The various weft densities of woven fabric and pilling were studied. 37 Increasing the weft density increased pilling resistance. Knitted cotton fabrics had reduced pilling when treated with ultraviolet radiation. 38
Although previous research relates pilling resistance to several textile mechanical properties, none of the work focused on testing it for a garment with 25 launderings. Nor did it focus on testing different brands. Therefore, the current study was undertaken to examine pilling resistance for 5th and 25th washes.
Wicking Behavior
Moisture transportation in a fabric is an important factor that provides comfort for the wearer. Clothes serve as the interface between body and environment. Therefore, they impact body heat and moisture loss depending on the structural attributes of the textiles. Moisture management is of critical importance for active and sportswear. The wicking ability of textiles can create a comfortable microclimate next to the skin. Cotton yarns show greater moisture migration than hydrophobic fibers. 39 Fluoro-surfactants inversely impact the wicking ability of fibers. 7 Liquid transportation impacted textile performance in several applications, such as athletic apparel, casual wear, dyeing, finishing, and printing.40,41 Morent et al. reported a wicking rate of 80 mm2/s for conventional cotton. 40 Moisture management was best with float stitches when compared with plain and tuck stitches. 42 It was also found that tighter structures decreased air permeability, but increased wicking ability. Loosely-knitted fabrics exhibited high air permeability, but low moisture management ability. 43 It was also noted that an increase in fabric count decreased air permeability, but improved moisture management ability. Wicking ability enhances fabric performance. Moisture management properties have gained popularity in socks, shirts, and active wear. 44
Higher wale count resulted in less shrinkage in the width; the reverse was true when courses were higher in number than wales. 45 The UHD (Upward-Horizontal-Downward) wicking test was determined to be valid for making predictions. 42 Another study compared single jersey, 1 × 1, and 2 × 2 rib knits, and interlock knitted fabrics, for wicking height, weight, transfer wicking ratio, evaporation rate, and contact angle. 46 Results revealed that the water evaporation rate (WER) was lower for tighter than for slack fabric structures. Additionally, WER increased with a decrease in fabric thickness. The stitch length of knits impacted its shrinkage. 12 Conflicting results were reported for the impact of knit structure on water absorption. Water absorption was higher for the single jersey knit that for the double pique fabric. 47 However, the results from another study were just the opposite. 48 Double pique knit was reported to have shrunk more in width than in length. 49 Fabric conditioners impacted the wicking behavior of cotton terry. 50 Compressed fabrics had a lower wicking rate than non-compressed fabrics. The horizontal wicking rate for 100% cotton jersey ranged between 32-68 mm2/s. 7
Previous work on colorfastness to laundering and pilling focused only on textiles in general, and gave conflicting results and did not compare different brands. The current study tested T-shirt dimensional stability for 25 washes, more indicative of actual consumer use. Previous studies reported that woven fabrics do not shrink after five wash-es.23,24 None of the previous works tested growth/shrinkage for knitted fabrics, investigated laundering for 25 washes, and measured different garment dimensions. Some prior work reported on sewn products combined dimensional change across six categories based on ASTM D6321-14. 18 The present study analyzed changes for each of the six measurements separately to understand dimensional changes in length, width, and curved areas of the garment.
Previous research on wicking behavior and moisture management provided sparse information on the impact of finishes, fiber contents, and yarn structures. None of the previous work examined garments and brands for wicking behavior. Fabrics and garments do not perform similarly at all points because different sections of the garment receive different pressures during wear and care. Therefore, it is important to examine the wicking behavior of garments rather than fabrics alone.
Overall, the purpose of the current study was to compare the post-laundering impact on selected structural and performance attributes for three brands of colored T-shirts.
Hypotheses
Based on the literature review, the following six hypotheses were developed.
Additionally, extended analysis was done to understand color change after 25 launderings using a spectrophotometer.
Experimental
Materials
Tree brands of colored knitted T-shirts were evaluated for their structural and performance attributes after laundering them with standard and commercial detergents. Five T-shirts were used for each test (for a total of 15 (3 brands × 5 shirts) shirts per experiment, plus one extra T-shirt per brand for testing that required cut fabric samples)—the minimum number suggested by prior research.
25
AATCC Standard and commercial detergents were made by the same company and had similar pH values. The commercially-available detergent stated its ability to remove stains. All three brands of T-shirts were XL jersey knits: red in color, 100% cotton, medium weight, and pre-shrunk. The structural variables tested for the study were fabric count, fabric thickness, and fabric weight.
Other performance attributes included colorfastness to laundering, dimensional stability, horizontal wicking, and pilling. Hypotheses were tested using ANOVA, followed by
Dimensional stability was tested with both standard and commercial detergents. Specimen numbers were increased from 3 to 5. Laundering was done using normal wash and dry cycles in a top-load Kenmore 700 series washer. The wash temperature was 40 °C.
Procedures
The following 11 tests were used for testing and data collection. AATCC Test Methods (TMs) 61-2013, 150-2012, 172-2010, and 198-2013, and ASTM methods D1776-08, D1777-2011, D3776-2013, D3776-2013, D3887-2008, D6321-2014, and D7268-2014. Laundered garments, rather than fabric, were pilled in the random tumble pilling tester and the sample size was increased to five for every test to maintain consistency. Home laundering, instead of the accelerated, methods were used.
Analytical Methods
The hypotheses were tested using ANOVA and
Results and Discussion
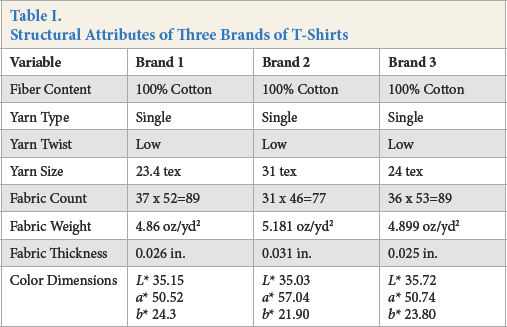
Structural attributes of the three T-shirt brands tested are presented in Table I. All three T-shirts were made from 100% cotton, single yarns with low twists per inch. Yarn size was medium for two brands and heavy for the third brand. Fabric count was 89 for two of the three brands and 77 for the third brand. Fabric weights for all three fabrics were classified as medium. Fabric thickness ranged from 0.026 in. to 0.031 in. Additionally, all three brands were prewashed by the manufacturer at the point of purchase.
Structural Attributes of Tree Brands of T-Shirts
Results from the six hypotheses are provided below. The statistics displayed in tables only represented significant results. In Tables II–VII, numbers shown for
Percent Dimensional Change by Frequency of Washings for Brand 1 Using Standard Detergent a
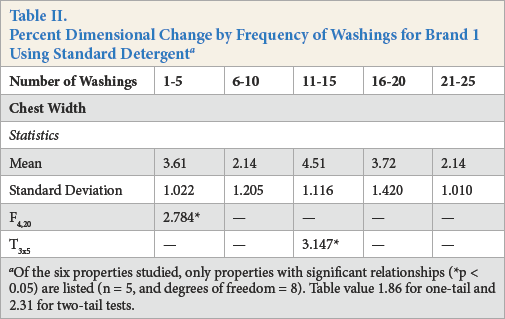
Of the six properties studied, only properties with significant relationships (*p < 0.05) are listed (n = 5, and degrees of freedom = 8). Table value 1.86 for one-tail and 2.31 for two-tail tests.
Percent Dimensional Change by Frequency of Washings for Brand 2 Using Standard Detergent a
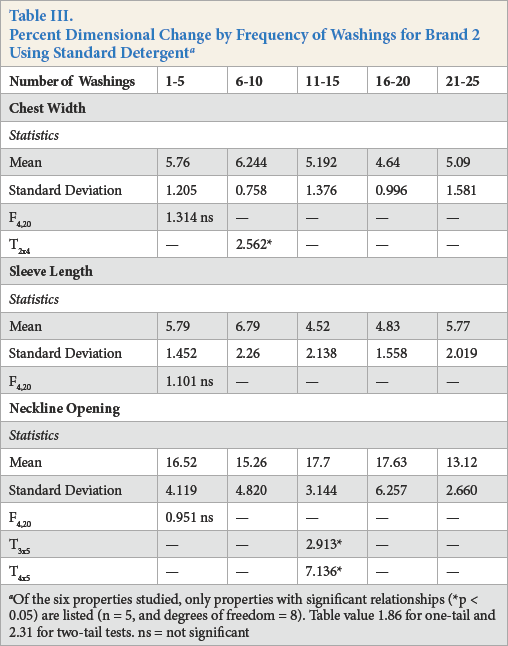
Of the six properties studied, only properties with significant relationships (*p < 0.05) are listed (n = 5, and degrees of freedom = 8). Table value 1.86 for one-tail and 2.31 for two-tail tests. ns = not significant
Percent Dimensional Change by Frequency of Washings for Brand 3 Using Standard Detergent a
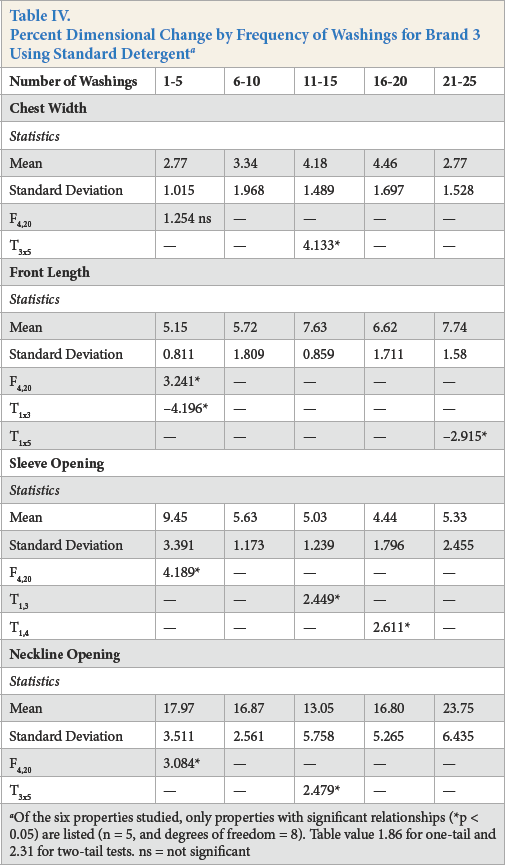
Of the six properties studied, only properties with significant relationships (*p < 0.05) are listed (n = 5, and degrees of freedom = 8). Table value 1.86 for one-tail and 2.31 for two-tail tests. ns= not significant
Percent Dimensional Change by Frequency of Washings for Brand 1 Using Commercial Detergent a
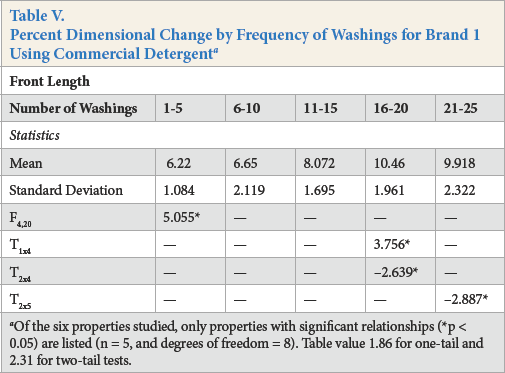
Of the six properties studied, only properties with significant relationships (*p < 0.05) are listed (n = 5, and degrees of freedom = 8). Table value 1.86 for one-tail and 2.31 for two-tail tests.
Percent Dimensional Change by Frequency of Washings for Brand 2 Using Commercial Detergent a
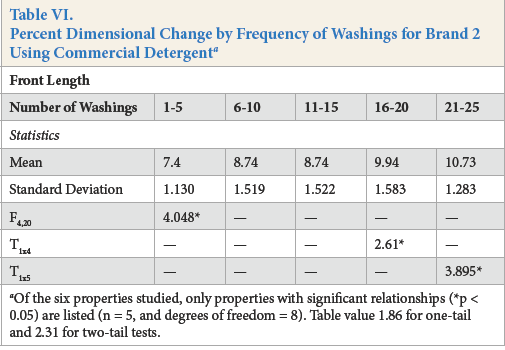
Of the six properties studied, only properties with significant relationships (*p < 0.05) are listed (n = 5, and degrees of freedom = 8). Table value 1.86 for one-tail and 2.31 for two-tail tests.
Percent Dimensional Change by Frequency of Washings for Brand 3 Using Commercial Detergent a
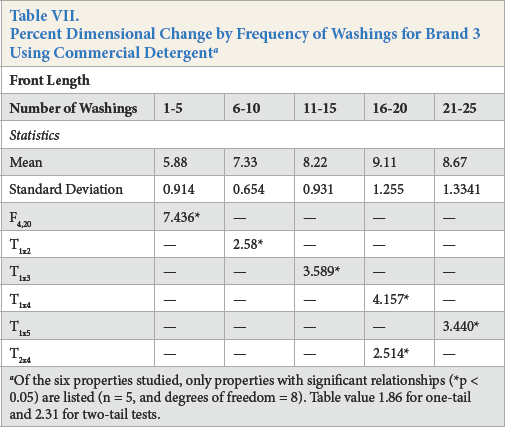
Of the six properties studied, only properties with significant relationships (*p < 0.05) are listed (n = 5, and degrees of freedom = 8). Table value 1.86 for one-tail and 2.31 for two-tail tests.
1-5 launderings = 1
6-10 launderings = 2
11-15 launderings = 3
16-20 launderings = 4
21-25 launderings = 5
For example, T3x5 means that differences were significant for dimensional stability between 11-15 and 21-25 washes for chest width. Tables II–IV show dimensional change when laundered with standard detergent and Tables V–VII display results when washed with commercial detergent.
Hypothesis I
Based on the data provided in Tables II–IV, Hypothesis I was rejected. For brand 1 (Table II), differences were significant only for chest width (F4,20 = 2.784, p < 0.05). The
Brand 3 (Table IV) had significant differences for front length (F4,20 = 3.241, p < 0.05), sleeve opening (F4,20 = 4.189, p < 0.05), and neckline opening (F4,20 = 3.084, p < 0.05). Front length also differed between washes 1-5 and 11-16 (t8 = –4.196, p < 0.05); and washes 1-5 and 21-25 (t8 = 2.915, p < 0.05). Sleeve opening shrinkage differed significantly for washes 1-5 and 11-15 (t8 = 2.449, p < 0.05) and washes 1-5 and 16-20 (t8 = 2.611, p < 0.05). For neckline opening, significance was found to be different only for washes 11-15 and 21-25 (t8 = 2.479, p < 0.05). Even though chest width did not have a significant F-value, significant differences prevailed for washes 11-15 and 21-25 (t8 = 4.133, p < 0.05).
It was obvious that there were performance differences between brands, as well as frequency of washing. These differences could be a function of fabric construction; previous research examined only woven fabrics and the T-shirts in the current study were knitted. Findings from the current study were consistent with Singh et al., 12 who reported that knits with plain stitches are likely to shrink more than those with tuck stitches. Even though the current study did not compare knits with tuck stitches, jersey knits do have plain stitches. Even though chest width did not have significant F-values, significant differences prevailed for washes 11-15 and 21-25 (t8 = 4.133, p < 0.05).
One of the three T-shirts brands revealed significant differences between launderings in front length, sleeve opening, and neckline opening. Sleeve opening means were reduced from 9.45% to 5.33% by the 25th wash for brand 3. For necklines opening, this percentage dropped from washes 1-5 to 11-15 and increased from washes 11-15 to 21-25. It was interesting to note that the knitted T-shirts shrank more than 5% despite being pre-shrunk. Consumers should be advised to go for one size larger than required for other garments. The findings also showed different different levels of dimensional change for different parts of the T-shirt. Changes in sleeve and neckline openings could be a function of seams that were present in the garment. This could not be said for chest width, because the tested T-shirts were seamless. Further research is needed to confirm these observations.
Hypothesis II
Based on the data provided in Tables V–VII, Hypothesis II was rejected. With commercial detergent, all brands differed only in front length of the T-shirts for the six measurements. F-values for brand 1 were F4,20 = 5.055, p < 0.05, for brand 2 were F4,20 = 4.048, p < 0.05, and for brand 3 were F4,20 = 7.436, p < 0.05. Front length for brand 1 (Table V) varied significantly between washes 1-5 and 16-20 (t8 = 3.756, p < 0.05), 6-10 and 16-20 (t8 = –2.639, p < 0.05), and 6-10 and 21-25 (t8 = –2.887, p < 0.05). For Brand 2 (Table VI), the differences were significant only for washes 1-5 and 16-20 (t8 = 2.61, p < 0.05) and washes 1-5 and 21-25 (t8 = 3.895, p < 0.05). For brand 3 (Table VII), differences were significant for washes 1-5 and 6-10 (t8 = 2.58, p < 0.05), washes 11-15 (t8 = 3.589, p < 0.05), washes 16-20 (t8 = 4.570, p < 0.05), washes 21-25 (t8 = 3.440, p < 0.05), and between washes 6-10 and 16-20 (t8 = 2.514, p < 0.05).
Mixed results in shrinkage after the 5th wash were noted for different frequencies of launderings with both standard and commercial detergents. This finding refutes previous researchers’ contention that cotton fabric stops shrinking/growing after the 5th wash. Additionally, dimensional change for most measurements was greater than 5%, which was higher than the 5% maximum recommended by ASTM D7268-2014 for knitted fabrics. 10 With standard detergent, changes were observed for chest width, sleeve front length, sleeve opening, and neckline opening. However, using commercial detergent, only the front length showed significant differences. The commercial detergent could have some chemicals or enzymes added that might prevent shrinkage.
Hypothesis III
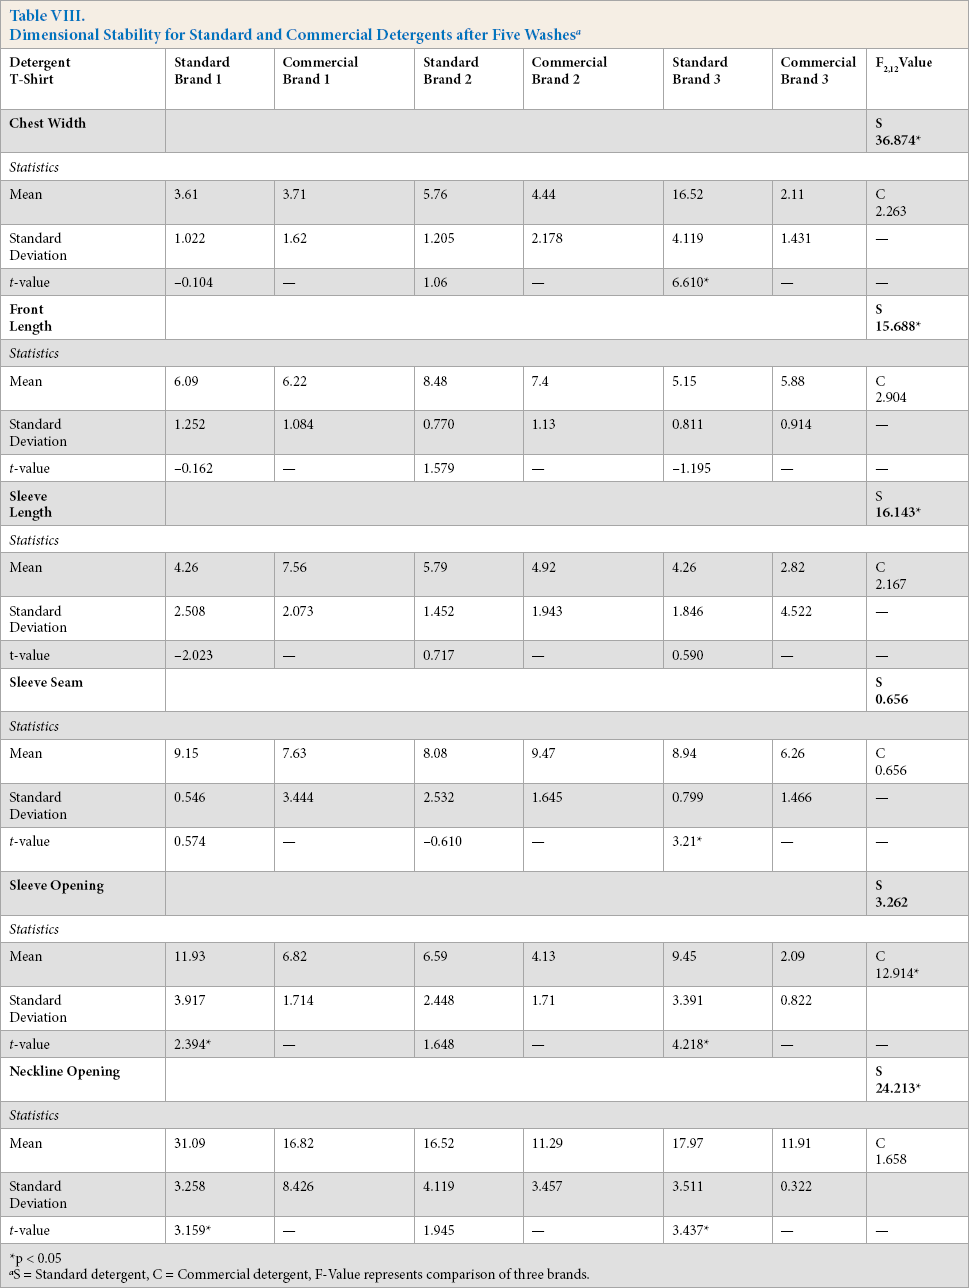
Data in Table VIII suggests that differences were more pronounced among the three brands of T-shirts in use of standard versus commercial detergents for four of the six measurements. Commercial detergent showed significance only for one of the six measurements. Hypothesis III was therefore rejected.
Dimensional Stability for Standard and Commercial Detergents after Five Washes a
p < 0.05
S = Standard detergent, C = Commercial detergent, F-Value represents comparison of three brands.
ANOVA revealed that the three brands differed significantly using standard detergent for chest width (F2,12 = 36.874, p < 0.05), front length (F2,12 = 15.688, p < 0.05), sleeve length (F2,12 = 16.145. p < 0.05), and neckline opening (F2,12 = 24.213, p < 0.05). Commercial detergent showed higher dimensional stability for sleeve opening (F2,12 = 12.914, p < 0.05) than standard detergent. Brand 3 had significantly higher shrinkage with standard versus commercial detergent for chest width (t8 = 6.61, p < 0.05) and for sleeve seam (t8 = 3.21, p < 0.05). For neckline opening, brands 1 (t8 = 3.16, p < 0.05*) and 3 (t8 = 3.44, p < 0.05) showed higher shrinkage with standard versus commercial detergent.
Overall shrinkage was higher using standard versus commercial detergent for most garment parts of all three brands. However, brand 2 had higher shrinkage for sleeve seam and brand 3 showed higher shrinkage in front length with commercial, rather than standard, detergent. This finding may have implications for consumers, who do not use standard detergent. Care instructions should be adjusted to prevent excessive shrinkage. Additionally, attention should be paid to the additives used in commercial detergents, including those for freshness, odor, softening, or stain removal. Both standard and commercial detergents were compared because standard detergents are believed to cover a broad range of market detergents. However, commercial detergents from same brand may not be the same from one place to another and from one year to another. 7
Hypothesis IV
The findings revealed significant differences among all three brands and fabric weight. There-fore, hypothesis IV was rejected (Table IX).
Change in Fabric Weight for Tree Brands of T-shirts before 1st and after 25th Wash with Commercial Detergent
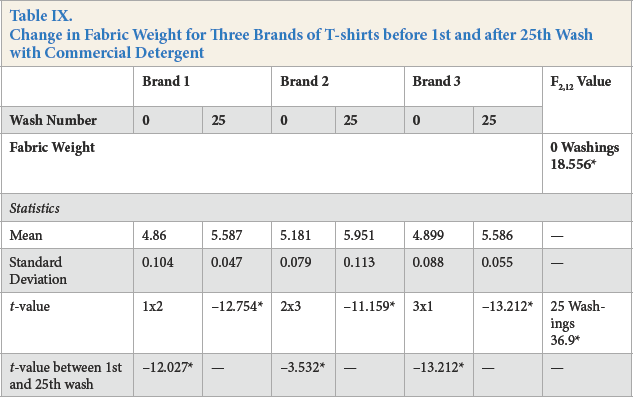
Fabric weights (using 5 × 5 in. square samples) increased significantly for all three brands between the original and the 25th wash. It might be assumed that fabric thinning from abrasion resulting from wear and care would decrease the weight. However, this was not the finding of the current study. Increased weight could be attributed to shrinkage, as well as to left over residue from successive washes. It was interesting to note that weight change was consistent for all three brands (F2,12 = 18.556*) for unwashed and (F2,12 = 36.9*) washed forms.
Hypothesis V
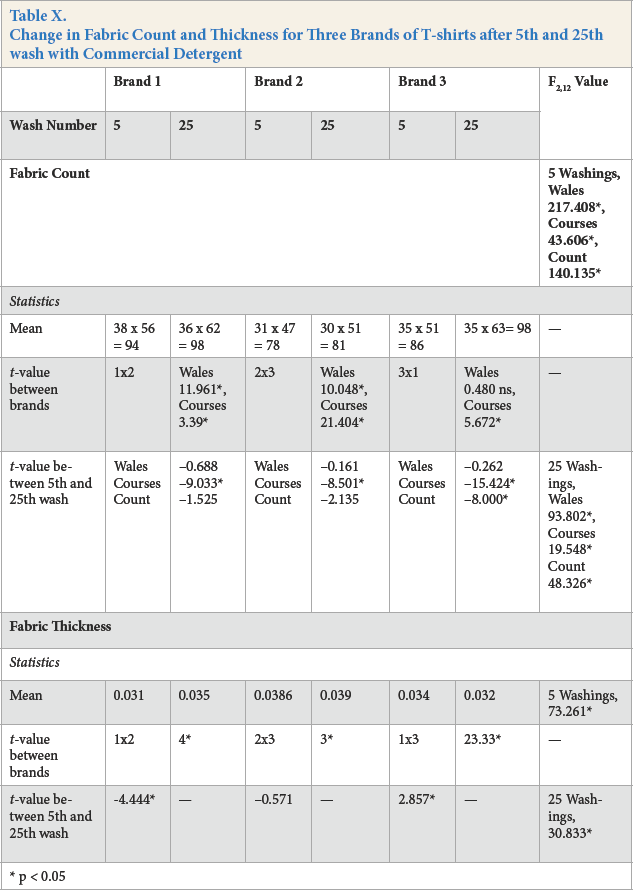
ANOVA results revealed that the three brands differed significantly (Table X) for fabric count after the 5th (F2,12 = 217.408* for wales, F2,12 = 43.606* for courses, and F2,12 = 140.135* for fabric count) and 25th washes (F2,12 = 93.802* for wales, F2,12 = 19.548* for courses, and F2,12 = 48.326* for fabric count). Hypothesis V was therefore rejected.
Change in Fabric Count and Thickness for Tree Brands of T-shirts after 5th and 25th wash with Commercial Detergent
p < 0.05
The 5th and 25th washes were also significantly different for each brand in courses and fabric count. Shrinkage resulting from repeated laundering could have resulted in an increased fabric count. For fabric thickness, the three brands differed significantly after 5 (F2,12 = 73.261*) as well as 25 washes (F2,12 = 30.833*). A closer look at the data revealed that thickness increased for brand 1, stayed the same for brand 2, and decreased for brand 3. Therefore, no conclusive statement could be made. Nevertheless, the differences between brands were significant for all three pairings.
Hypothesis VI
Inferential statistics executed to test hypothesis VI disclosed that the three brands differed significantly after the 5th wash (F2,12 = 104.645*), but were not significant after the 25th wash for horizontal wicking (Table XI). Brand 3's maximum increase differed significantly after the 25th wash from brand 1 (t8 = –19.749*). The wicking values were much lower than those listed in the 2016
Comparison of Tree Brands of T-shirts for Horizontal Wicking Pilling, and Colorfastness to Laundering in Unwashed and Post 25th Wash with Commercial Detergent (n = 5)
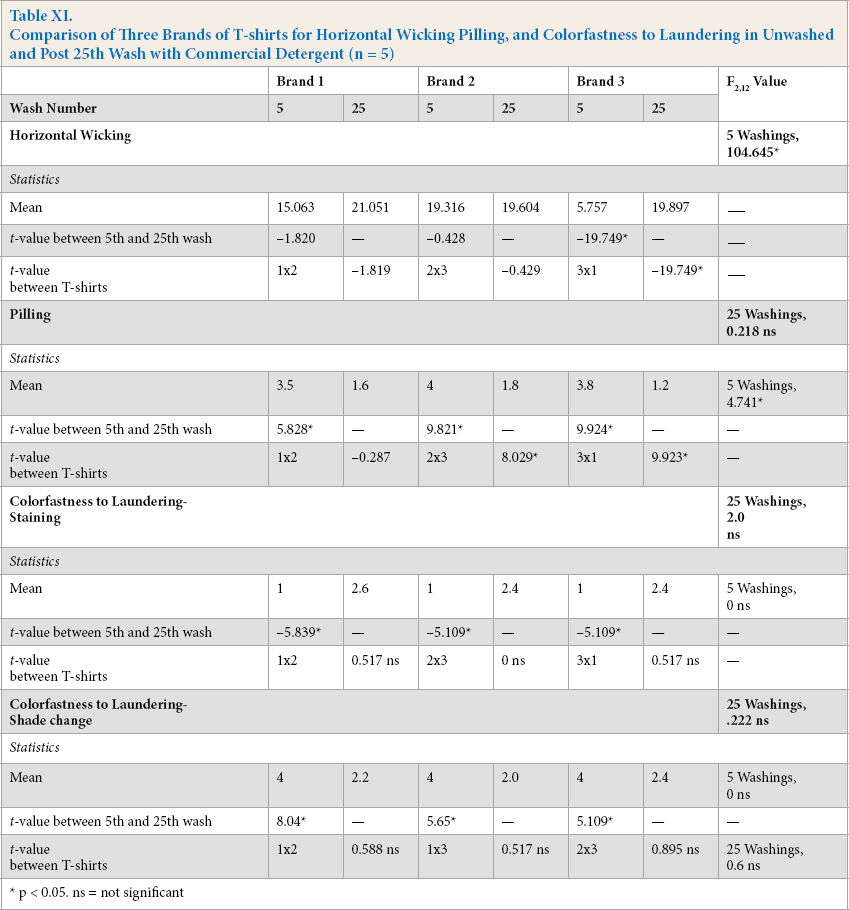
p < 0.05. ns = not significant
ANOVA results for pilling revealed that the three brands differed significantly after the 5th wash (F2,12 = 4.741*), but not after the 25th wash (Table XI). However, all three brands showed worse pilling in the 25th wash. Differences were significant between the 2x3 (t8 = 8.029*) and 3x1 (t8 = 9.923*) T-shirts, but not significant for the 1x2 T-shirts. Increased pilling and reduced pilling resistance were consistent with previous research. 31
For color change and staining tests, differences were not significant among the three brands (Table XI). However, they were significantly different for each brand between the 5th and 25th washes when tested exclusively. Staining change was highest after the 5th wash and lowest after the 25th wash. It is worth noting that all T-shirts did not meet the color change for staining (> 3) and color change (> 4) standards. It is normal to see color loss in dyed and printed garments through wear and care over time. However, none of the reviewed literature examined this relationship. There-fore, no comparisons could be made.
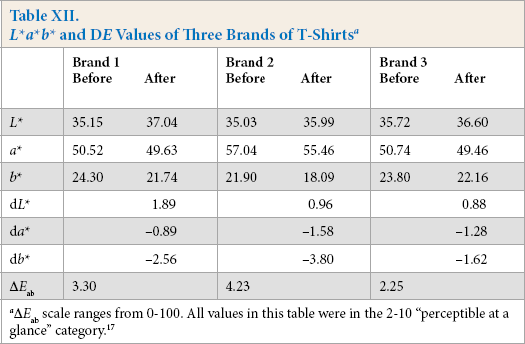
Testing color change between unwashed and washed T-shirts revealed that all three brands became lighter; less red and less yellow after washes. D
Conclusions
This study compared three brands of weft-knitted red T-shirts for the impact of laundering on colorfastness, fabric count, fabric thickness, fabric weight, horizontal wicking, and pilling. AATCC and ASTM methods and standards were used to design the study and perform the tests. Adaptations were made as necessary to set up the research experiments. Findings revealed both consistencies and inconsistencies with the previous research. Results yielded information that could deepen understanding of textile analysis for both professionals and informed consumers. Even though T-shirts were preshrunk, they showed more than the recommended change percentage based on ASTM D7268-2014. Therefore, it is necessary to address the issue either by adding finishes, changing to a more effective pre-shrinking method, or using a different mode of washing.
This topic is important because today's consumers wear T-shirts beyond five washes. Fabric count, fabric weight, and fabric thickness increased with increase laundering frequency. This challenges previous arguments that textiles do not shrink after the 5th wash. The existing literature contends that the higher the count, the better the quality.6,27 However, this contention did not hold up for the textile performance attributes reported in this study. Increased pilling with successive washing was consistent with the previous findings.
Moisture management, dimensional stability, pilling, and color change are important textile attributes because they contribute to appearance, comfort, and durability. These performance attributes cut across several apparel categories, and may be examined for both woven and knitted fabrics. Extending this research to other types of knits, woven and nonwoven fabrics, and garments will deepen our understanding of quality. Evaluating apparel performance can deepen our understanding of textile use for various intended purposes.
Color is the first thing the consumer sees while shopping for apparel. The same color could look different under different lighting conditions. Significant changes in T-shirt color may be acceptable to consumers shopping for a cheaper product. Consumer tolerance may not be so high for other categories of apparel. Therefore, the need to extend these studies to other types of textiles and apparel categories can make a useful contribution to understanding the phenomenon of concept to consumer.
Footnotes
Acknowledgements
The author would like to acknowledge the College of Education and Human Services and the Department of Human Environmental Services at Central Michigan University for funding this project. She would like to thank Sabrina Marsha for assistance with data collection, as well as Su An, Maureen MacGillivary, and AATCC reviewers for constructive feedback.