
Abstract
The wicking performance of fabrics is crucial for the thermal comfort of the human body and significantly affects the fabric’s overall moisture management properties. This study aims to illustrate the impact of varying liquid temperatures on the wicking performance of Plant-Cool knitted fabric from experimentally and numerically. Experimental results indicate that as the liquid temperature increases (from 5°C to 65°C), the wicking height in the fabrics consistently increases. However, different fabric compositions exhibit varying sensitivities to temperature changes. The fabric with the best wicking performance (Fabric A) shows the least sensitivity to temperature changes, with wicking curves at different temperatures being very close to each other. The fabric with moderate wicking performance (Fabric B) has a moderate sensitivity to temperature changes but shows insensitivity under low-temperature conditions. The fabric with the poorest wicking performance (Fabric C) is the most sensitive to temperature changes, although its sensitivity is less pronounced under high-temperature conditions. The Laughlin-Davies model has proven to be successful in describing the wicking process of fabrics. Additionally, simulations conducted using COMSOL have been effective, offering a deeper understanding of the wicking process in fabrics.
Introduction
The vertical wicking height reflects the wicking ability of the fabric and is a measure of the capillary effect of the fabric, which is defined as the height at which water rises along the textile material within a certain time when one end of the vertically suspended textile material is wetted by water through capillary action.1,2 It has a great influence on the physiological comfort of the human body. Plant-Cool knitted fabric is a unidirectional moisture transport fabric with a new structure, and unidirectional moisture transport fabrics with excellent moisture absorption and sweat expulsion are widely used in the development of sportswear and underwear.3–5 It is very necessary to study the liquid water transport performance of this fabric.
In both everyday life and specific occupational environments, such as firefighters, chefs, and cold chain logistics personnel, individuals are frequently exposed to liquids at extreme temperatures. Under certain temperature conditions, prolonged contact may lead to irreversible cold burns or frostbite. Given the role of clothing as the second skin of the human body, it plays a critical role in protecting the skin from such injuries. For the purpose of developing functional fabrics that provide effective moisture management in extreme temperature environments, this study will delve into the core-absorption behaviours of fabrics at different temperatures to provide a theoretical basis for the development of fabrics adapted to different environmental requirements. Therefore, the study of the liquid water transfer properties of fabrics under various liquid temperature conditions is not only theoretically valuable but also of practical significance. This research is instrumental in the development and enhancement of functional and comfortable clothing materials that provide effective thermal protection, adapting to a diverse range of work and environmental needs. Additionally, the investigation of the transfer behavior of liquid water at different temperatures is conducive to the study of smart textiles capable of responding to temperature or environmental changes. The transport performance between fabrics and liquid water is influenced not only by fabric factors such as fabric construction, yarn type, and finishing treatments,6–9 but also significantly by external environmental factors, such as liquid water temperature, ambient temperature and humidity, and applied external forces.10–12 For instance, Sena 7 studied the relationship between the wicking height of silver-modified polyamide fabrics and their moisture absorption and antibacterial treatments, demonstrating that silver-modified polyamide fabrics exhibit higher wicking heights after treatment. Wang et al. 10 discussed the impact of controlled liquid temperature and environmental humidity on the liquid water transfer properties of cotton/spandex blended fabrics, concluding that higher water temperatures lead to higher wicking heights, while higher relative humidity results in reduced wicking heights.
Combining the intrinsic factors of the fabric and the external environmental factors, there is very little research on the discussion of the liquid water transport performance of the fabric. This paper will take the Plant-Cool knitted fabric as the research object, systematically discuss the impact of the composition of the fabric and the temperature of liquid water on the liquid water transport capacity of the fabric, and establish the fitting relationship between wicking time and wicking height. At the same time, with the help of the COMSOL simulation software, the intrinsic connection between permeability and the maximum wicking height of the fabric within 30 minutes is studied. In this study, it is hypothesised that an increase in temperature will significantly enhance the core-absorption height of fabrics, and that different fabric compositions will show different sensitivities to changes in temperature. The above work can provide theoretical and practical support for a better understanding of the liquid water transport process and internal mechanism of knitted fabrics.
Experiment
Plant-cool knitted fabrics
Coolmax fibers have garnered widespread attention since their introduction due to their superior moisture-wicking and breathability properties.13,14 The unidirectional moisture transfer fabric utilized in this study is primarily composed of Coolmax and polyester fibers, invented by patent.
15
This fabric features a two-layer structure, with the inner layer formed by the loop structure created through the use of one needle in every other stitch on the needle cylinder, connecting the inner and outer layers, which include the inner layer and the junction between the inner and outer layers, as shown in Figure 1(a). The outer layer is knitted with full-needle configuration, where the cylinder needles are divided into long and short needles, arranged in “long-long-short-short” pattern, as depicted in the texture shown in Figure 1(b); ultimately presenting an inner layer with a textured undulating surface and an outer layer with a plain structure. (a) Back side (inner layer) of the unidirectional moisture transfer fabric; (b) Front side (outer layer) of the unidirectional moisture transfer fabric; (c) Wicking height testing experimental setup.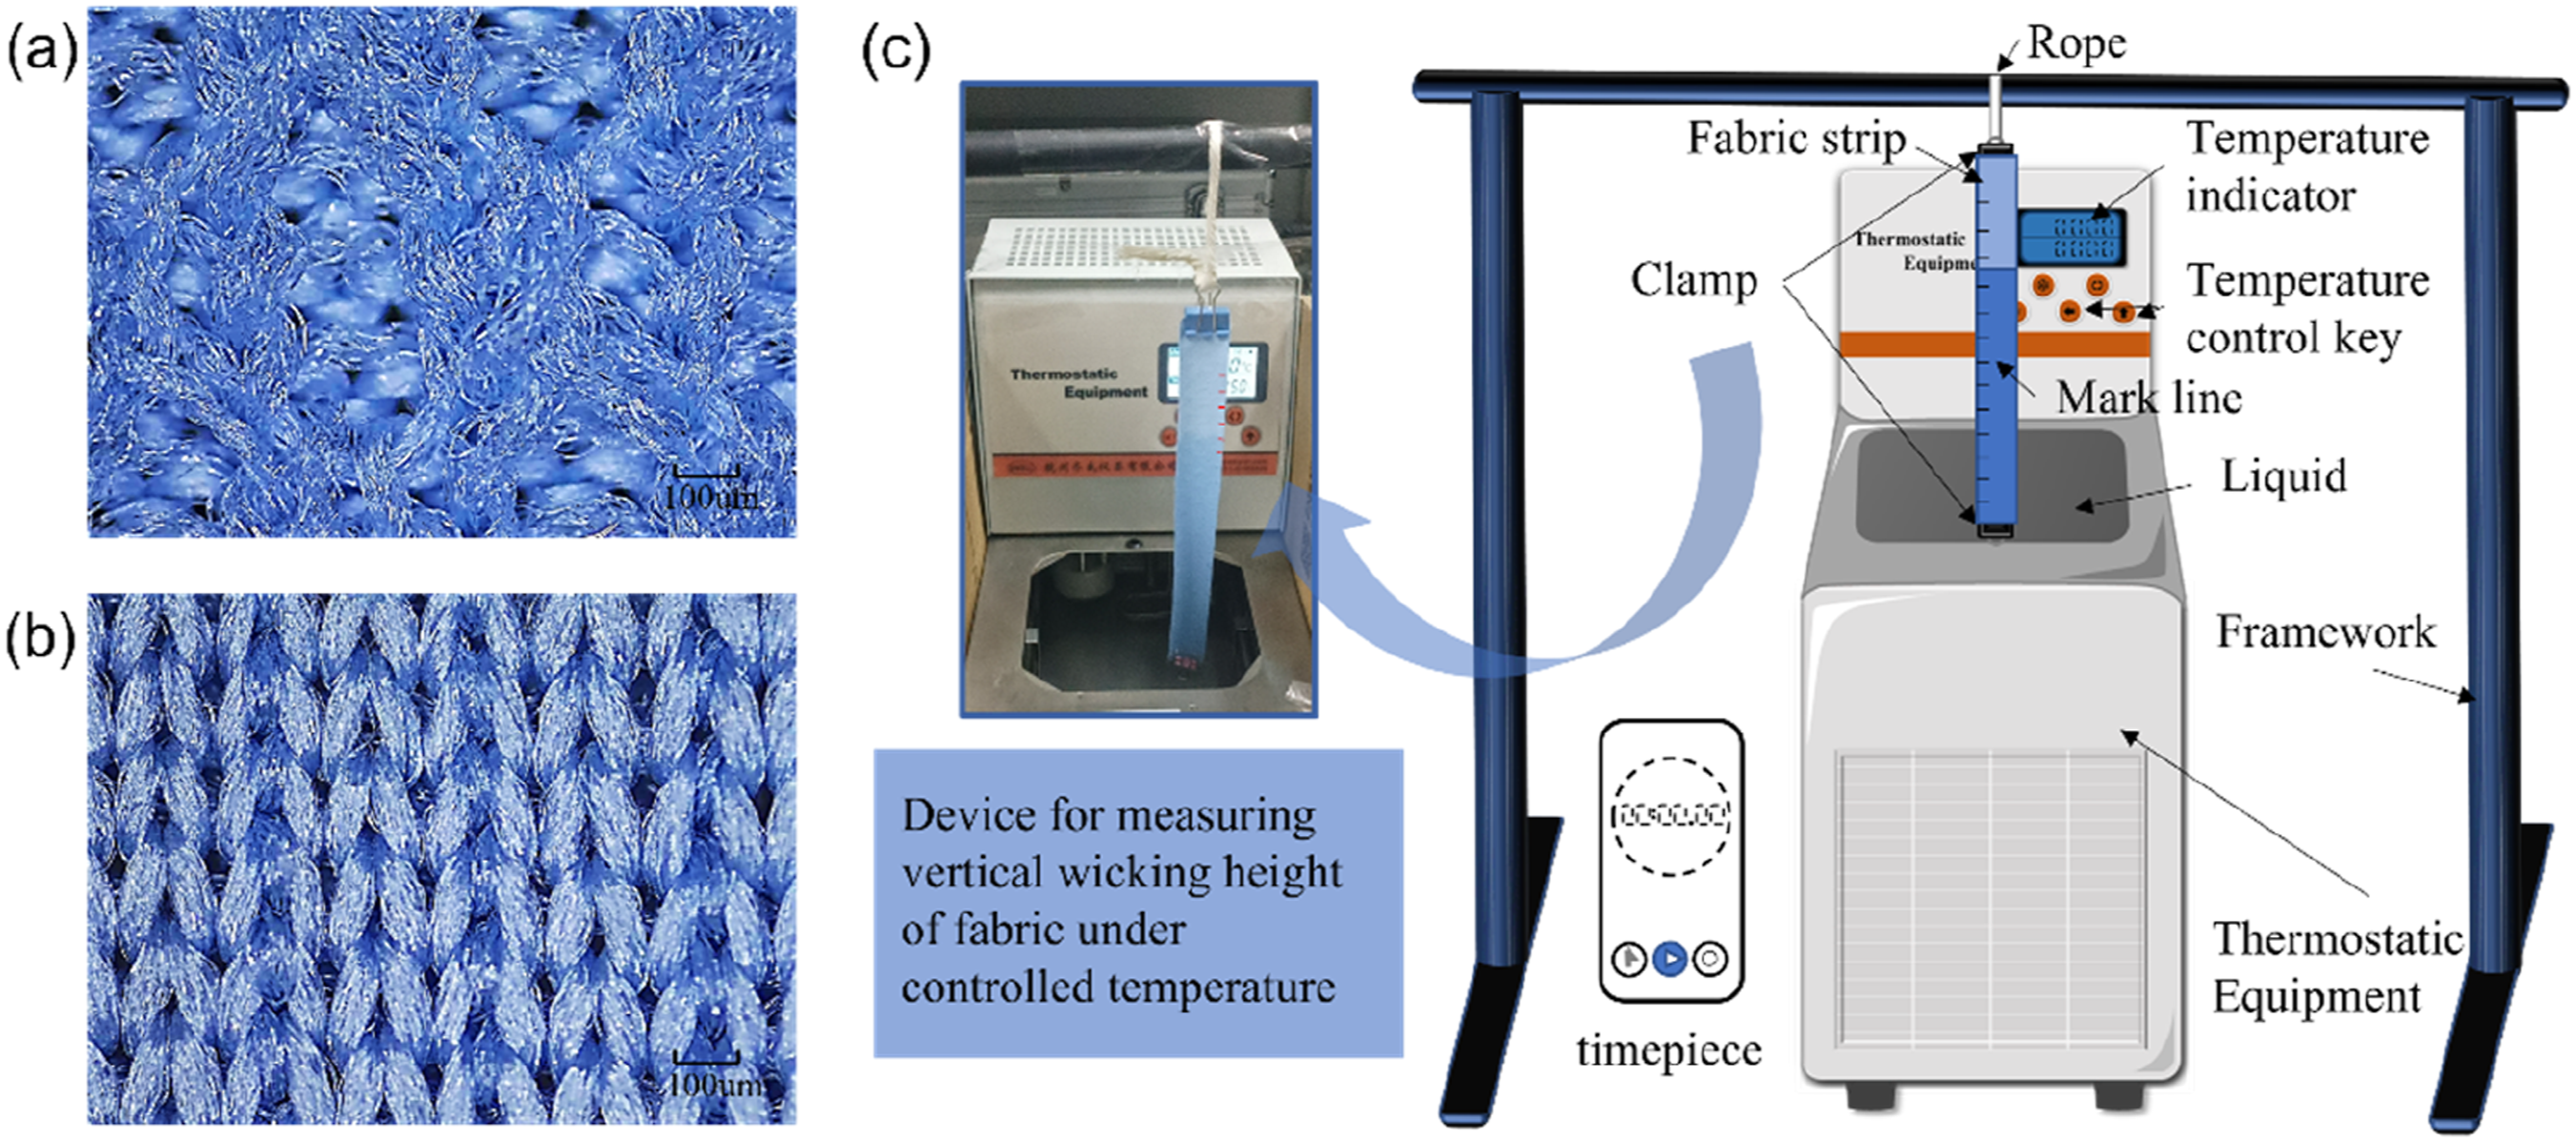
Plant-cool knitted fabric parameters.
Wicking experiment
In accordance with the standard “Textiles—Evaluation of absorption and quick-drying—Part 1:Method for combination tests”, 1 this study used fabric dimensions of 25 cm in length and 3 cm in width to test the wicking height at different liquid temperatures (5°C, 25°C, 45°C, 65°C) under environmental conditions of 25 ± 2°C temperature and 65 ± 3% relative humidity, as shown in the experimental setup depicted in Figure 1(c). The longest wicking time is set to 30 minutes, with a low-temperature water bath used to control the liquid temperature. Note that, unless otherwise specified, the term “temperature” in this paper refers to the liquid temperature, not the ambient temperature. Markings are made at 1 cm intervals to record time within 30 minutes, and the wicking height after 30 minutes is also recorded. Each condition is tested three times, and the results are averaged. The low-temperature and constant temperature sink in the figure was purchased from Hangzhou Qiwei Instrument Co., Ltd.
Fabric wicking theoretical model
Commonly, the widely used wicking model is the Lucas-Washburn equation,
16
which indicates that wicking time is directly proportional to the square root of height. However, due to the irregular morphology of fibrous fabrics, this equation generally does not hold. To achieve a better fit with the experimental curve, a time constant k (k > 0) is introduced to optimize the Lucas-Washburn equation, referred to as the Laughlin-Davies equation.
17
The wicking expression is as follows:
In the equation, h represents the vertical wicking height, t represents the wicking time, C denotes the constant, and k is the height exponent.
Numerical simulation of the wicking model was conducted in the Origin software, and the fit appropriateness was further evaluated using the coefficient of determination (R2) and the root mean square error (RMSE).

In the formula,
The theoretical model and numerical simulation by COMSOL
Pore radius
The pore radius (a) Schematic of triangular fiber arrangement; (b) Schematic diagram of water transfer between fibers.

In the formula,
Porosity
The porosity 
In the formula,
Entrance capillary pressure
The entrance capillary pressure 
In the formula,
Permeability
Since the expression for the wicking time 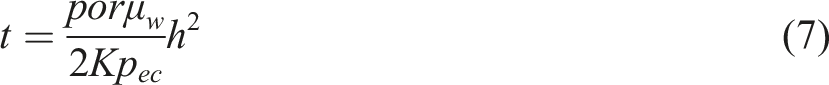
In the formula,
Considering the fabric as an isotropic porous medium, and not taking into account deformation during the experiment, equation (7) can be rewritten as 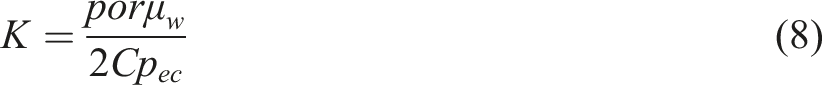
COMSOL multiphysics coupled model
The ‘Porous Media Phase Transfer' interface adheres to the independent equations of the volume fraction 
In the formula,
Since the sum of the volume fractions of the two phases is 1, the remaining volume fraction can be calculated based on equation (10):
The capillary pressure 
In the formula,
The relative permeabilities of the wet phase and the non-wet phase are given by the following equations:

The ‘Darcy’s Law' interface combines Darcy’s Law with the continuity equation
25
:
In the formula, the density
Results and discussion
Experimental data analysis
Maximum wicking height within 30 minutes
The maximum wicking heights achieved by three types of unidirectional moisture transfer knitted fabrics (A, B, C) with different compositions after 30 minutes of wicking experiments at four different liquid temperatures (5°C, 25°C, 45°C, 65°C) varied, and there were significant differences in the warp and weft directions (The terms ‘warp' and ‘weft' are used to denote the directional water absorption variability in knitted fabrics, referring to the longitudinal and transverse axes of the fabric, respectively. ‘warp':it refers to the course of loops running along the length of the knitting machine’s needle bed, similar to the warp direction of woven fabrics; ‘weft':it refers to the courses of loops that are perpendicular to the warp direction.), as shown in Figure 3. Overall, the wicking height in the warp direction was greater than that in the weft direction; the ranking of the maximum wicking heights for the three types of fabrics was A > B > C. As shown in Figure 3(d), at 25°C, the maximum wicking height in the warp direction for fabric A was 19.7 cm, and in the weft direction was 16.9 cm; for fabric B, the maximum wicking height in the warp direction was 17.3 cm, and in the weft direction was 15.7 cm; for fabric C, the maximum wicking height in the warp direction was 13.3 cm, and in the weft direction was 10.9 cm. When the liquid temperature increased (from 5°C to 65°C), the maximum wicking heights for all three types of fabrics generally increased, but the increase for fabric A was relatively small, with a temperature difference range of 0– 0.9 cm, as shown in Figure 3(a); for fabric B, the temperature difference range was 0– 1.9 cm, as shown in Figure 3(b), and for fabric C, the temperature difference range was 0– 2.5 cm, as shown in Figure 3(c). Furthermore, from the perspective of the magnitude of temperature variation, the maximum wicking height of fabric A in both the warp and weft directions exhibited minimal changes across the four tested temperatures, with almost no variation observed between 5°C and 25°C. Between 25°C and 65°C, the maximum wicking height increased more uniformly, with growth percentages of 1.52% for the warp direction and 5.33% for the weft direction. Fabric B’s warp and weft directions, as well as fabric C’s warp direction, followed a similar trend to fabric A, but with slightly larger changes in magnitude. The growth percentages for fabric B were 10.40% for the warp direction and 12.18% for the weft direction. Fabric C’s warp direction showed a growth percentage of 9.77%. However, for fabric C, the maximum wicking height in the weft direction continued to rise consistently from 5°C to 65°C, with a growth percentage of 25.25%. (a) The vertical wicking heights in the warp and weft directions of fabric A after 30 minutes; (b) The vertical wicking heights in the warp and weft directions of fabric B after 30 minutes; (c) The vertical wicking heights in the warp and weft directions of fabric C after 30 minutes; (d) The vertical wicking heights in the warp and weft directions of fabrics A, B, and C at 25°C after 30 minutes.
Relationship between wicking time and wicking height
The relationship curves between wicking time and wicking height for the warp and weft directions of fabrics A, B, and C at different liquid temperatures (5°C, 25°C, 45°C, 65°C) are shown in Figure 4. Overall, all curves exhibited a transition from a smaller to a larger curvature, indicating that in the initial phase, the wicking height increases rapidly with time, while in the later phase, the increase in wicking height slows down over time. As the liquid temperature rises, the relationship curves between wicking time and wicking height generally exhibit a “rightward shift” (which means that less time is required for the wicking height to reach the same value, also implying that the fabric can achieve a higher wicking height in a shorter period). The rightward shift is least pronounced for fabric A, with the warp curves at different temperatures nearly overlapping, as shown in Figure 4(a) and (b); the rightward shift is most pronounced for fabric C, with the weft curves at different temperatures showing the greatest difference, as shown in Figure 4(e) and (f); fabric B is in between, with the rightward shift in the weft being slightly greater than in the warp, as shown in Figure 4(c) and (d). Additionally, we observed that the wicking time and height curves did not exhibit uniform changes with temperature variations across different fabrics. A distinct comparison can be drawn between fabrics B and C. For fabric B, the wicking time required to reach the same height was relatively consistent when the temperature varied from 5°C to 25°C, with an average difference in time of 11.7 seconds in the warp direction. However, as the temperature increased from 25°C to 65°C, the time corresponding to the same wicking height decreased rapidly. For instance, when the temperature was raised from 25°C to 45°C, the average difference in time required to reach the same wicking height was −135.2 seconds, and from 45°C to 65°C, it was −44.6 seconds.In contrast, fabric C showed a slightly different pattern of change. The time required to reach the same height was significantly reduced when the temperature varied from 5°C to 45°C. Taking the warp direction as an example, the average difference in time required to reach the same wicking height was −88.7 seconds when the temperature changed from 5°C to 25°C, and −119.9 seconds when it changed from 25°C to 45°C. However, when the temperature was raised from 45°C to 65°C, there was only a slight change in wicking time, with an average difference in time of −11.7 seconds in the warp direction. (a) Wicking curve of fabric A in the warp direction; (b) Wicking curve of fabric A in the weft direction; (c) Wicking curve of fabric B in the warp direction; (d) Wicking curve of fabric B in the weft direction; (e) Wicking curve of fabric C in the warp direction; (f) Wicking curve of fabric C in the weft direction.
Experimental data fitting results.

Analysis of wicking mechanism
Under varying liquid temperatures, the overall trend of wicking height changes for the three types of fabrics is consistent, yet the patterns of change exhibit differences. The fabric with the best wicking effect (Fabric A) is the least responsive to temperature, with wicking curves at different temperatures being very similar; the fabric with moderate wicking effect (Fabric B) has a moderate response to temperature changes, but is insensitive to low temperatures; both Fabric A and Fabric B have a contact angle of 0°, indicating complete wettability. In contrast, Fabric C has a contact angle of approximately 66°, exhibiting hydrophobic properties, and it is also the fabric with the poorest wicking effect. It is the most sensitive to temperature changes, but its sensitivity to high temperatures is relatively low.
Fabric A exhibits superior maximum wicking height within 30 minutes and is least affected by temperature changes, which can be attributed to its microstructure. An increased number of fibers within the yarn cross-section can lead to a better capillary effect. 8 In contrast, fabric C, which uses a waterproof material, hydrophobic polyester, on the reverse side, not only has the lowest maximum wicking height within 30 minutes among the three but also shows a change in its wicking height curve with temperature. As the temperature increases, the wicking height over the same period increases due to the influence of temperature on the surface tension and viscosity of liquid water. 26 The capillary absorption coefficient, which is highly related to surface tension and viscosity, is directly proportional to the temperature of liquid water. 27 However, the effect of temperature on the wicking height curve of fabric C diminishes at higher temperatures (45°C–65°C). As for fabric B, its maximum wicking height within 30 minutes is between A and C, due to the absence of hydrophobic effects and a lower number of fiber filaments within the yarn compared to fabric A. It is important to note that the wicking height curve of fabric B is less affected by temperature changes at lower temperatures (5°C–25°C).
COMSOL simulation
Since the experiment revealed a certain proportional relationship between the maximum wicking heights in the warp and weft directions within 30 minutes, the ratio of the average maximum wicking heights between the warp and weft for fabric A is 1.15:1; for fabric B, it is 1.1:1; and for fabric C, it is 1.24:1. The following discussion will focus solely on the simulation results of the warp direction using COMSOL.
By coupling multiphysics, the ‘Porous Media Multiphase Flow' and ‘Darcy’s Law' interfaces were coupled, and relevant parameters such as fabric dimensions, contact angle, pore radius, and other fabric information, as well as environmental information like water density and dynamic viscosity, were input. Subsequently, the simulation experiment was conducted in the order of building geometry, defining materials, defining pressure boundaries, selecting the capillary pressure model, defining initial values and mass flux, constructing mapped meshes, and finally studying and defining the solution. The simulation process of the fabric is shown in Figure 5, where four time points of the warp direction for the three types of fabrics are displayed, including the simulation results of wicking heights at 1 minute, 5 minutes, 15 minutes, and 30 minutes. Presentation of COMSOL simulation results.
A comparison between the experimental and simulation results of the maximum wicking height in the warp direction after 30 minutes is shown in Figure 6. First of all, it can be found that the simulation results of all fabrics at any temperature are lower than the experimental real value, and the difference between the two is (1.5 cm-2.7 cm), which is due to the fact that the fabric is a double-sided knitted fabric, and the structure and composition of the front and back are different. The structure diagram of the front and back of the fabric can be seen that the density of the two sides is different, and the front side is tighter, which plays a major role in the actual wicking experiment. Due to the sparse structure of the back side, the wicking ability is obviously not as good as the front side, and the C fabric is also affected by the hydrophobicity of the back side; However, in the simulation, we simplify the fabric to a two-dimensional graphical representation, without taking into account the difference between the front and back structures. Or it can also be understood that the simulation represents the comprehensive wicking height of the fabric, ignoring the front and back structural difference, because the data input to the simulation are all comprehensive fabric data, and there is no distinction between front and back. But in the actual test, what we observe is the value of the front wicking height, so the simulation value is less than the experimental value. However, the accuracy of most simulation results is above 85%, which can be considered generally good. Among them, fabric B shows the best overall simulation accuracy with an average accuracy of 90.56%, fabric A is slightly lower (88.77%), and fabric C performs relatively weaker (83.89%), which may be related to the hydrophobic yarn on the reverse side of fabric C. Characterizing the fabric with only the contact angle may not meet the needs of the fabric’s double-sided structure. At the same time, the differences between simulation results at different temperatures for fabric C are the greatest, with the lowest simulation accuracy at high (65°C) and low (5°C) temperatures, indicating that the model’s simulation performance under extreme conditions needs improvement. Analysis of COMSOL simulation results.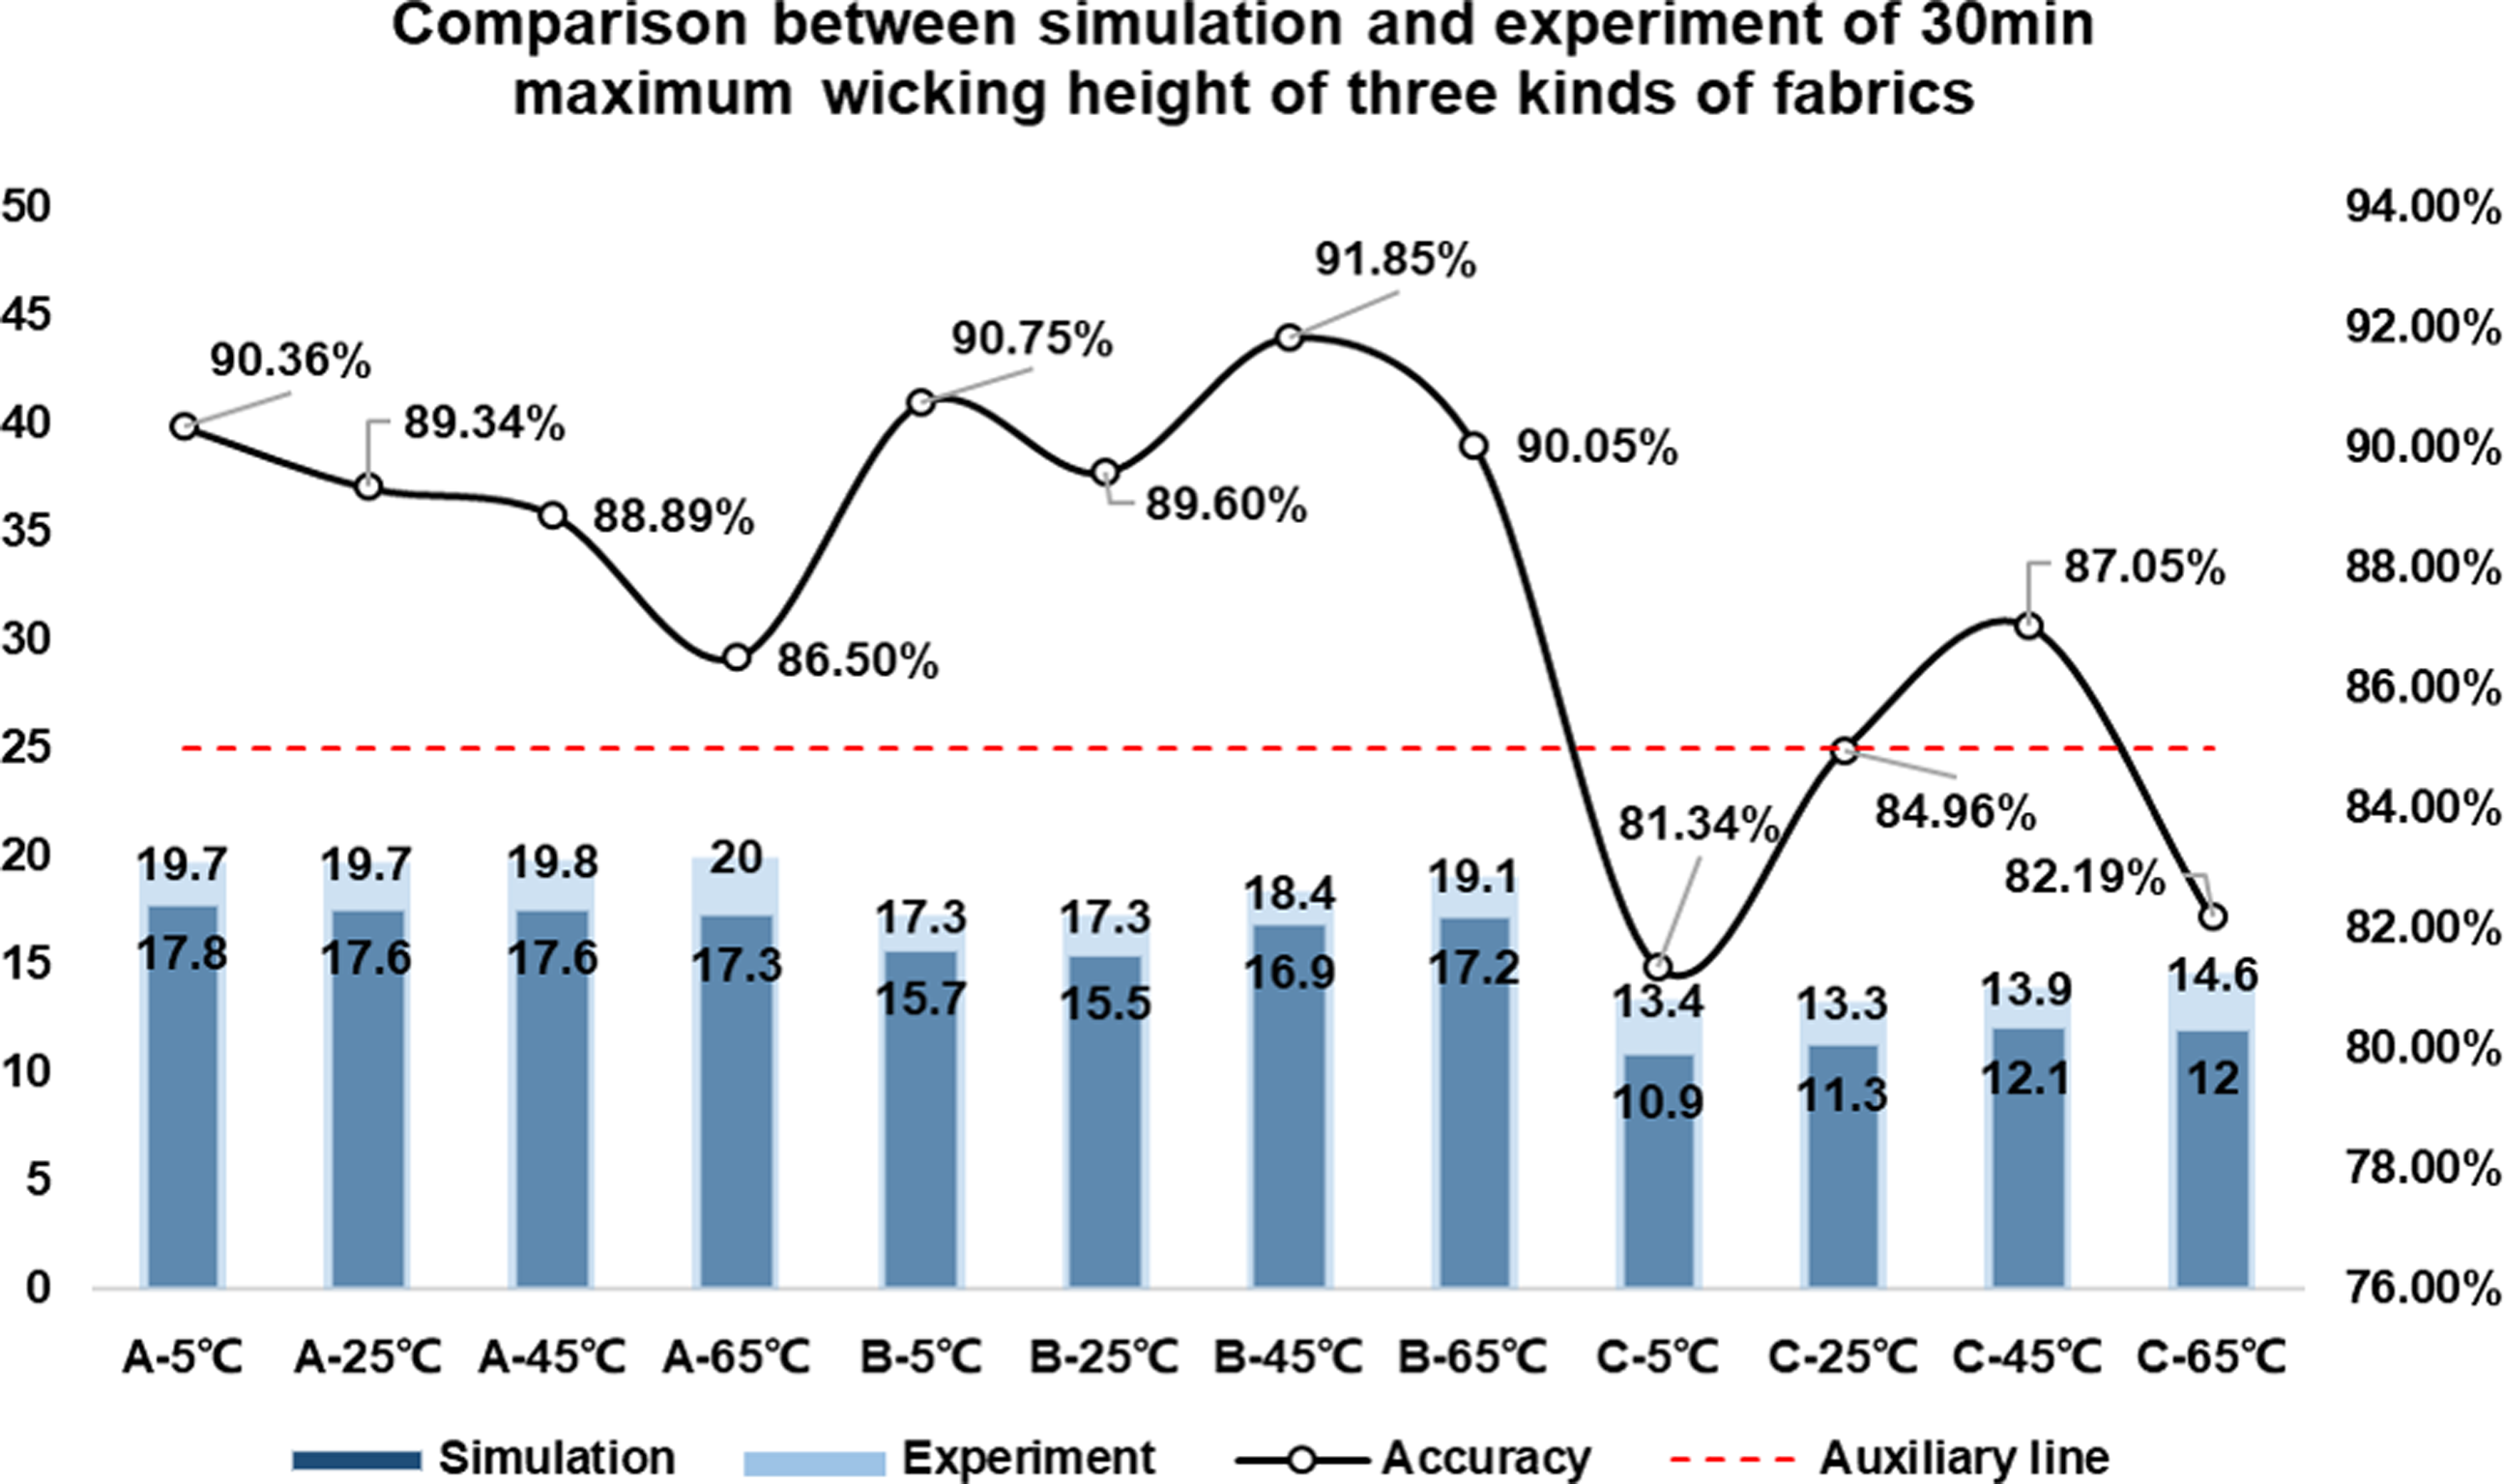
Conclusions
In this study, the core-absorption properties of Plant-Cool knitted fabrics at different liquid temperatures were systematically discussed, and COMSOL simulation was successfully applied to analyse the process, which fills the gap in the study of the temperature-responsive properties of knitted fabrics. This study investigated the vertical wicking performance of Plant-cool knitted fabrics with three different back components at various liquid temperatures and reached the following conclusions: Through experimental research and simulation, the wicking behavior of Plant-cool knitted fabrics was systematically described. The maximum wicking height within 30 minutes was influenced by the composition of the fabric; an increased number of fibers in the yarn cross-section enhanced the wicking height, while the addition of hydrophobic materials reduced it. As the liquid temperature increased, the wicking height of the three types of fabrics at the same time showed an upward trend, but the change curves of wicking time and height were not uniform. Additionally, the Laughlin-Davies equation could fit the change curves of wicking time and height very well, with R2 values all exceeding 0.99. Meanwhile, the maximum wicking height in the warp direction of the three types of fabrics within 30 minutes was simulated in the COMSOL software, and the simulation results were all lower than the experimental results, affected by various factors such as fabric structure and composition. However, the overall simulation effect is good, with the highest accuracy reaching up to 91.85%. The simulation effect for fabrics with added hydrophobic materials is slightly worse.
Further research is needed to deeply elaborate on the moisture transport and management of sports knitted fabrics with unidirectional moisture transfer functions, similar to Plant-cool knitted fabrics. The study will further explore the core-absorption behaviour of fabrics with different fibre structures in more complex environments, including the effects of external pressure, different humidity conditions and fibre surface treatments. It is necessary to use software like COMSOL to establish other wicking models for Plant-cool knitted fabrics, in order to better promote the development of more textiles with sports functionality.
Footnotes
Declaration of conflicting interests
The author(s) declared no potential conflicts of interest with respect to the research, authorship, and/or publication of this article.
Funding
The author(s) disclosed receipt of the following financial support for the research, authorship, and/or publication of this article: this work was supported by the Innovation and Technology Fund; ITS/315/21, National Natural Science Foundation of China; 52376079, Natural Science Foundation of Shanghai Municipality; 21ZR1400100 and the Research Grants Council of the Hong Kong Special Administrative Region, China; PolyU152052/21E; PolyU152196/23E.