
Abstract
Certain levels of the carbohydrates melezitose and trehalulose deposited on cotton surfaces are indicative of either whitefly or aphid contamination, which may cause problems during cotton processing. Raffinose and sucrose are isomers of melezitose and trehalulose, respectively, making it difficult to fully separate them via ion chromatography (IC), especially when analysis time is shortened. We have successfully developed an IC method to separate the retention peaks of melezitose from raffinose and trehalulose from sucrose, with baseline resolution and improved quantitation of these sugars. This improved separation may elucidate useful information about constituent sugars on cotton, aiding in the identification of carbohydrates possibly contributing to stickiness.
Introduction
Across the textile trade, stakeholders are constantly striving to better understand the quality and characteristics of their cotton products and, because of this, excess surface sugars are important. Surface carbohydrates may give information about the developmental stage of cotton, as well as carbohydrate metabolism differences among different cotton varieties.1,2
Cotton stickiness is a phenomenon whereby sugar deposits, the source of which may be the plant itself (physiological) or invading insects (entomological), cause the cotton fibers to physically stick to the processing equipment.3,4 The extent of stickiness relies on many factors, and is likely a complex interaction between intricate physical and chemical properties. These include the type of sugar contamination (plant and/or insect honeydew deposits), the type of insect responsible for contamination—whitefly (
Both aforementioned pests metabolically produce the sugars melezitose and trehalulose, but in different ratios. Melezitose is the dominant entomologically-produced carbohydrate from aphids (
Although there is still no test method that definitively diagnoses a stickiness problem across all bales of a particular crop, the need still exists to determine if and how excess sugars and sugar ratios could create a future problem during processing for a particular cotton crop.7,8 Therefore, through better peak separation, accurate determination of the ratios (relative amounts) of melezitose and trehalulose offers a definitive chemical analysis approach to identifying the offending pest (or known mutation of a pest) for later comparisons to other contemporary stickiness test methods.
High performance ion chromatography (IC) is the primary method of sugar analysis on cotton that is accepted by the scientific community, and it is the technique most effective for both identification and quantitation of individual carbohydrates.3,9,10 The long analysis time and instrumentation costs associated with IC still call for a cheaper, faster approach to determining the surface sugars present on cot-ton.11,12 Other physical and chemical stickiness tests, such as the Minicard, thermodetectors, and the Benedict test, do not produce the qualitative precision, quantitative accuracy, and overall consistency that IC offers.3,11,13,14
Some IC methods used to gain better separation take longer than 30 min for a single sample run. 9 Researchers have also used gas chromatography (GC) to obtain quantitative and qualitative results in a shorter amount of time, however GC requires pretreatment of the extracted sugars and cannot be performed in a water matrix. 11 Previous articles have deemed the high performance liquid chromatography (HPLC) or IC methods expensive and slow in deducing cotton surface sugars; however recent developments in the precision, ease of use, and fine-tuning the methodology for chromatographic measurements call for reconsideration.5,15 A separation technique under 30 min in duration is worthy if it provides information to pinpoint the sugar contamination source. 1 This information might save stakeholders thousands of dollars in lost crops, discounts, processing downtime, late-stage stickiness remedies, or future business losses. 1
We attempted to use methods and modified methods previously established by others, but we found that the melezitose peak overlapped with the raffinose peak (which was not shown in those previous works), as well as other unidentified peaks in the samples. 12 These studies illustrate how IC data can mislead pest contamination identification if the separation of certain sugars was not accurate. By comparing more reliable melezitose concentration values to improved treh-alulose concentration values, obtained via the IC separation presented herein, a dependable ratio of the pest sugars can be obtained to reveal the most likely cause of sugar contamination. This method can be used in tandem with physical testing methods to better identify contaminated cotton; thus potentially allowing for treatment, if at all possible, before full-scale problems arise at the processing mill. It is important to keep in mind that overall cotton processing performance may still be affected by surface and fiber properties other than stickiness, such as fiber morphology, length, fineness, static electrical forces, waxes, metal ions, and salts.16,17
Materials and Experimental
Materials
Inositol (98+%) was obtained from Acros Organics. D-(+)-trehalose dehydrate, D-(+)-glucose), D-(-)-Fructose, Sucrose, Melezitose (α-D-Glucopyranosyl-[1→3]-β-D-Fructofuranosyl-[2→1]-α-D-Glucopyranoside) hydrate, 99+%), D-(+)-Rafnose pentahydrate, and maltose monohy-drate were purchased from Sigma-Aldrich Corp. Trehalulose (1-O-alpha-D-glucopyranosyl-D-fructose, 90%) was purchased from Chem Service Inc. Sodium hydroxide solution (50%) and sodium acetate (anhydrous) were obtained from Fischer Scientific.
Acrodisc syringe filters with 13 MM PVDF membranes (13-mm diameter, 0.2-μm pore size) were obtained from Thermo Scientific. The Corning LSE Vortex Mixer was purchased from Corning Inc. Water was distilled, deionized, and then further purified with a Millipore Direct-Q 3UV, 8 system from EMD Millipore Corp.
Cotton Samples
Five raw cotton samples exhibiting a range of stickiness, as determined by physical Minicard testing, were obtained from the USDA Southern Regional Research Center (USDA-ARS). The five samples were named Low A, Low B, Low C, Moderate, and Heavy denoting the level of stickiness determined by the previous Minicard physical testing. These terms do not reflect any information regarding the sugars present. All samples were measured in triplicate.
Two separate raw cotton samples, Samples 1 and 2, were also obtained from USDA-ARS to be used independently and solely for testing the efficiency of the water extract sample preparation via a vortex agitation technique, rather than manual agitation.
Cotton Sample Preparation
For carbohydrate analysis via IC, 1 g of cotton was obtained by pinching small aliquots from the total sample to increase efficient sampling. The raw cotton sample was placed in a centrifuge tube and 20 mL of ultrapure deionized water was added. The cotton/water sample was capped and vortexed at ∼5000 rpm for 30 s, then again for 5 min at ∼3500 rpm. The water extract from the vortexed samples was then filtered through a 0.2-μm syringe filter to remove any cotton fibers and particulate, and then placed in a 1.5-mL auto-sampler glass vial for analysis on the ion chromatography instrument.
Vortex Tests
Tree, 1-g aliquots of Samples 1 and 2 were placed separately into centrifuge tubes, and 20 mL of ultrapure deionized was added to each. The cotton/water samples were capped and vortexed at >5000 rpm for 5 min. Separately, 1 g aliquots were also taken from Sample 1 and Sample 2, placed in separate beakers, and 20 mL of ultrapure deionized was added to each. Those cotton aliquots were manually agitated for 5 min via manual stirring and pressing down the cotton (this was previously the standard method for agitating the cotton). All water extracts were collected and filtered through a 0.2 μm syringe filter to remove any cotton fibers and particulates. The water extracts were then placed in a 1.5 mL auto-sampler glass vial for analysis on the IC instrument.
IC
IC was performed on a Dionex DX-5000 instrument using pulsed amperometric detection and two Dionex CarboPac PA-1 (4 × 250 mm) columns connected in series. The analytics software used was Dionex Chromeleon 7.2 CDS (Thermo Scientific). Two instrumental methods were used for comparison.
Gradient IC Method
Elution was carried out at a flow rate of 0.75 mL/min. A sig-moidal gradient was established using the following mobile phase solutions: (A) 200 mM NaOH, (B) 200 mM NaOH / 500 mM sodium acetate and (C) 50 mM NaOH. Eluent A was decreased from 100% A / 0% B to 50% A / 50% B during the span of 0 to 6 min. The gradient continued from 50% A / 50% B to 100% C over the span of 6 to 12 min. Column and compartment temperatures were set at room temperature (RT, ∼22 °C).
Improved IC Method
Elution was carried out using at a flow rate of 0.80 mL/min. An isocratic eluent delivery of 200 mM NaOH for 28.5 min was used. Column and compartment temperatures were set at 30 °C.
A stock standard matrix of eight sugars (inositol, trehalose, glucose, fructose, sucrose, melezitose, raffinose, and malt-ose) was created by dissolving the sugars in water. The stock standard solution was diluted further to create a standard calibration curve via the IC. Individual standards of raffinose and melezitose were also made separately as 0.1 mg/mL solutions. The trehalulose standard stock was prepared and run on the IC separately, since the trehalulose syrup was only 90% pure and contained levels of glucose, fructose, and an unidentified component.
It is important to note that the 0.1, 0.025, 0.01, and 0.005 mg/mL concentration standard solutions were run and calibration curves were created every time samples were analyzed throughout the experiments. These calibration curves maintained linearity, with R 2 values of greater than 0.98. Also, every time a sample was used for comparison, a new water extract was created for that sample, as microbial activity may have degraded some of the sugars washed of of the cotton over time. A 5 min equilibration time after every sample run and blank solutions run intermittently between standards and samples confirmed that there were no residual higher molecular weight carbohydrates eluting from the column in the next sample run. Results of the nine primary constituent sugars found in the cotton fiber water extracts were reported in mg/mL relative to 1 g of cotton for all samples.
Results and Discussion
Vortexing for Sample Consistency
To ensure sample preparation consistency, it was our intention to move away from the previously published manual agitation during the cotton sample's water extract preparation phase. 7 Cotton stickiness is based on the influence of “sticky spots” throughout the cotton fibers, which lend some inconsistencies. Our aim was to keep the analytical testing as thorough as possible to inhibit further irregularities. For this reason, we analyzed for glucose in the water extract (instead of melezitose or trehalulose), which should be fairly consistent across the cotton sample.
Past publications differ slightly in the preparation of the water extract on which the chromatography was performed. Some researchers have called for manually agitating the cotton sample in water for an unspecified amount of time. 7 Some articles have noted that the cotton sample was periodically agitated for 30 min before HPLC analysis. 11 Manual agitation consists of pressing and stirring the cotton in a beaker with 20 mL of water present. We have noted that, depending on the force exerted by the researcher and the time the cotton is allowed to sit in the water, the mg/mL of the sugar extracted from the cotton's surface can vary. By introducing vortexing as the method of agitation, the chances for user discrepancy is lessened.
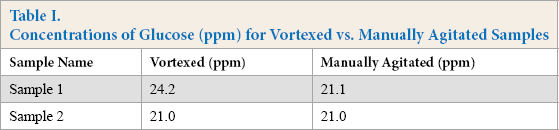
Aliquots from two cotton samples, Samples 1 and 2, were processed via the vortexing method and analyzed for glucose levels via IC. Two additional aliquots were taken from the cotton samples and agitated via a manual method and the water extracts were also analyzed for glucose concentration. As shown in Table I, vortexing for 30 s and then for 5 min yielded roughly the same ppm of glucose in the water extract as for samples that were manually agitated. The difference was that vortexing the sample cut the physical handling time for a sample (of three replicates) by 13.5 min.
Concentrations of Glucose (ppm) for Vortexed vs. Manually Agitated Samples
IC Instrumental Methods Comparison
The cotton aphid (
Some researchers have established faster IC instrumentation methods, having retention times as low as ∼11 min and ∼14 min for trehalulose and melezitose, respectively.3,12,20 One published method used a sigmoidal gradient eluent delivery consisting of a high pH basic solution (200 mM NaOH) and a buffer solution (200 mM NaOH/500 mM sodium acetate) at a flow rate of 0.75 mL/min.3,11 The run time was not listed, but it was inferred from the text and the chromatogram that the separations of interest (excluding raffinose) were accomplished in less than 15 min.
Although the ratio of pest sugars is extremely important, as well as the identification of other excess sugars, the IC separation is a demanding one. When the gradient method above was attempted in our current research for the separation of nine sugars (as opposed to only eight sugars in previous work), the method combined the melezitose peak with that of its isomer raffinose (a carbohydrate found in cotton seed meat) along with major overlaps of other peaks.3,11 Distinguishing between melezitose and raffinose is difficult because they differ only in sequence and linkage.21,22Trehalulose and the physiological sugar sucrose, which are also structural isomers, present similar separation concerns. 3
As a modification to the above gradient method, we decided to use a lower ionic strength solution of 50 mM NaOH toward the end of the sample run to resolve some peak overlaps. We were able to attain retention times more in line with previous methods and termed this modified gradient method Gradient IC.
In summary, previous separation methods did not allow for baseline resolution of the trehalulose/sucrose and melezi-tose/raffinose isomers. Without complete separation, it was difficult to correctly identify and calculate the ratio of sugars present in the sample.3,15,16,23 If the entomological sugar amounts were not accurate, the ratio that the IC data provided could mislead the researcher into diagnosing the wrong pest contamination, thus potentially quashing the success of a pest-specific treatment measure in the field. 24
New Gradient IC Method
To determine whether or not the entomological sugars were being fully separated using the new Gradient IC method, five raw cotton samples were subject to water extractions and analyzed on the IC. A sigmoidal gradient consisting of 200 mM sodium hydroxide, a solution of 200 mM sodium hydroxide/500 mM sodium acetate, and a 50 mM solution of sodium hydroxide were used over the course of 14.5 min. 3
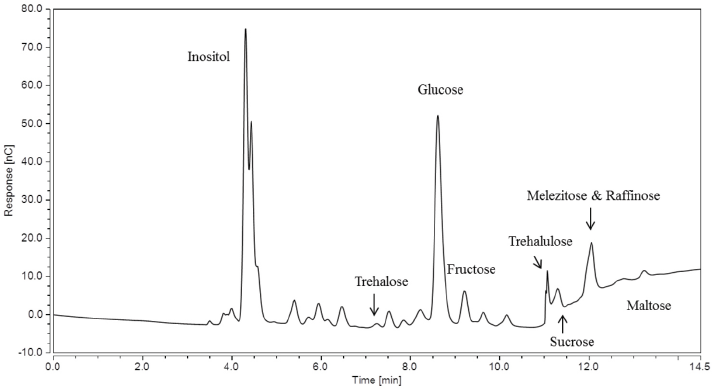
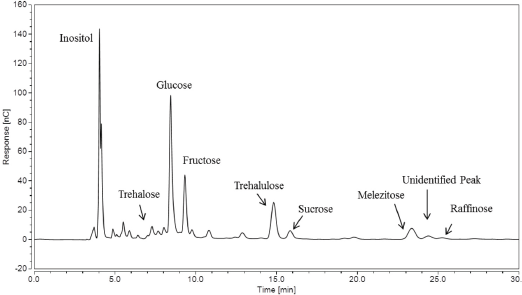
Fig. 1 shows the chromatogram of the nine carbohydrates (each present at 0.1 mg/mL) analyzed using the Gradient IC method. The method elutes all nine sugars of of the column within 12 min, however, the raffinose peak was missing. Raffinose, an isomer of melezitose, is also a trisaccharide sugar composed of galactose, glucose, and fructose; it can be found in many natural plant products such as whole grains, vegetables, and cotton seed.9,25 If cottonseed oils were released via crushing the seed coat during cotton processing, the raffinose in the oils could potentially act as a stickiness marker. The reasons for this are still unknown, but may be due to the relatively low melting point of raffinose in comparison to other surface sugars. 25 It is known that when cotton seeds break down, sucrose (the isomer of trehalulose) content increased on cotton fibers as a result of raffinose degradation.1,25,26 The trehalulose standard chromatogram, depicted as a dotted line, was overlaid. The dotted peak after sucrose was an unidentified component in the trehalulose syrup. Examining the chromatogram between the 11.0 and 11.5 min marks also shows the slight overlap of the trehalulose and sucrose peaks when using the Gradient IC method.
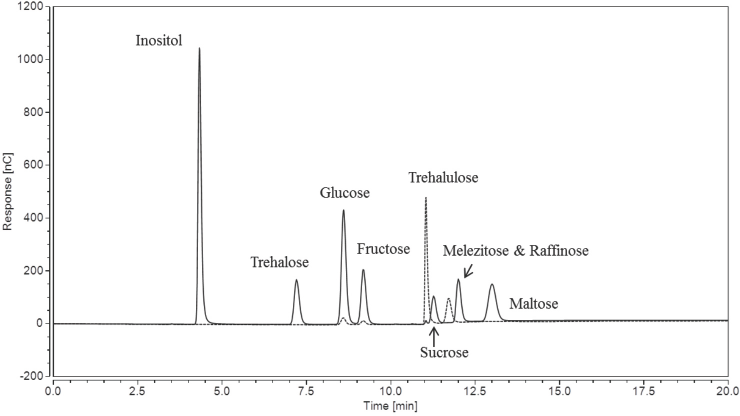
IC chromatogram of nine sugars at 0.1 mg/mL concentrations using the Gradient IC method.
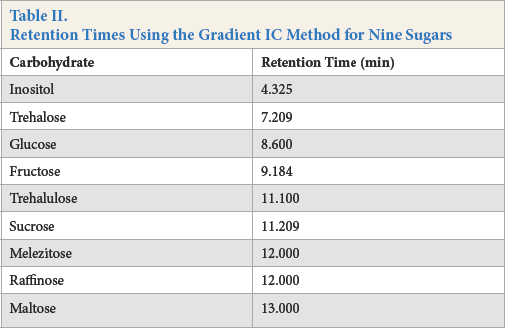
To further illustrate raffinose and melezitose peak overlap, the Gradient IC method was run on separate 0.1 mg/mL solutions of raffinose and melezitose, with the overlaid chromatograms shown in Fig. 2. The retention times for the nine sugars of interest are shown in Table II, where melezi-tose and raffinose co-elute at ∼12.0 min. This overlap may be easy to miss if a researcher is not testing for raffinose within a sample by including a raffinose standard.
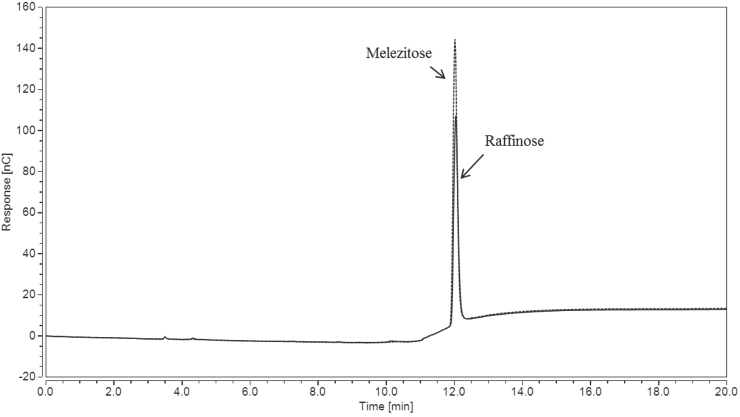
Overlaid IC chromatograms of 0.1 mg/mL solutions of raffinose and melezitose using the Gradient IC method.
Retention Times Using the Gradient IC Method for Nine Sugars
A chromatogram obtained via the Gradient IC method for sample Low A in Fig. 3 displays a peak for melezitose, where a peak shoulder caused by the underlying raffinose present, as well as any unidentified peaks, are visible. There is also a greater overlap of trehalulose and sucrose peaks present in the chromatogram.
IC chromatogram for sample Low A using the Gradient IC method.
Due to the bunching of the melezitose and raffinose peaks observed in Fig. 3, the amount of melezitose calculated from the calibration curve of melezitose standards was roughly 0.808 ± 0.097 mg. The amounts of the nine sugars present in the five cotton samples is available in Table III. Integrating the trehalulose and sucrose peaks using the IC Chromeleon 7.2 software gave a concentration of trehalulose that yielded an amount of 0.118 ± 0.021 mg in the 20 mL water extract. This sample has ∼6.8× more melezitose present in the water extract than trehalulose.
Amounts of Eight Surface Sugars in Five Raw Cotton Samples via the Gradient IC Method a
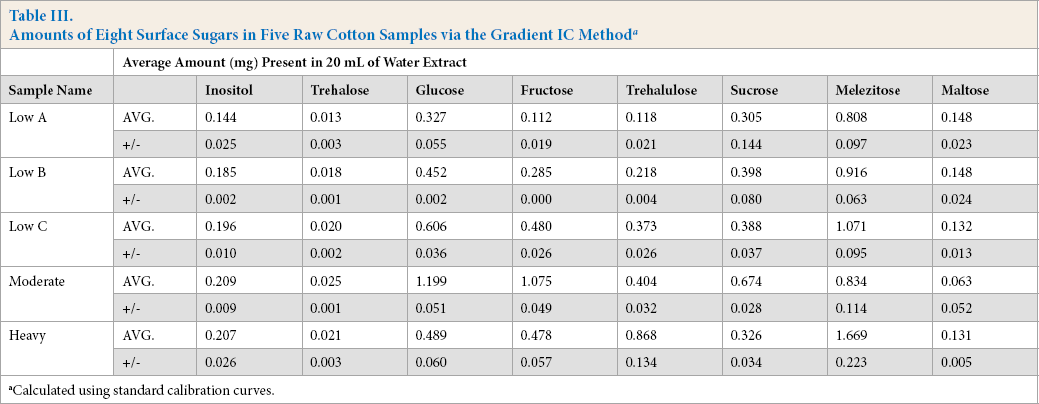
Calculated using standard calibration curves.
Indicative of potential aphid contamination when using this particular instrumental method, the melezitose made up ∼41% of the total surface sugars according to chromatographic calculations for sample Low A. Although there was aphid activity on this sample, the Minicard rating for it did not show a significant amount of stickiness during the physical testing methods. This finding further suggests that a certain amount, and perhaps a certain ratio, of sugars must likely be present for a processing issue to occur.
The rest of the cotton samples followed suit, with the melezi-tose accounting for more sugar present than trehalulose in every sample in Table III. With the exception of the Moderate sample, melezitose was present in higher amounts than any other sugar tested according the Gradient IC method chromatograms.
It is interesting to note that the chromatogram for sample Heavy in Fig. 4 showed a larger peak for trehalulose than the Low A sample (also more than the chromatograms for samples Low B, Low C and Moderate, which are not shown). Despite the high peak height, the area of the melezitose peak (which included the underlying raffinose peak) was greater than the trehalulose peak area, indicating aphid contamination.
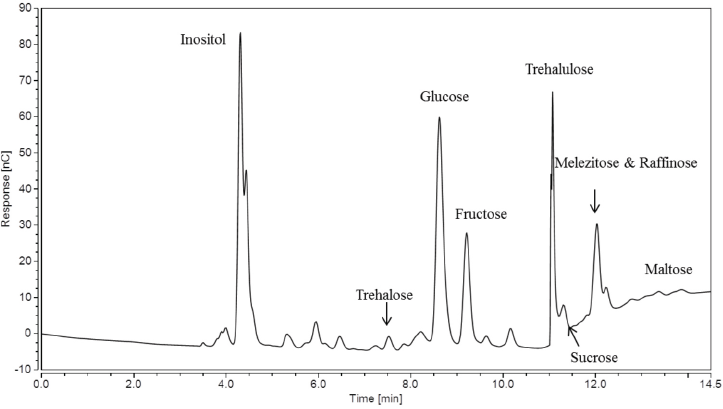
IC chromatogram for sample Heavy using the Gradient IC method.
Fig. 5 shows the sugar trends for the five cotton samples. Moving from left to right along the chart, after the bars depicting slightly greater amounts of glucose and fructose (compared to the other sugars), there was a dip in the relative trehalulose and sucrose values, and then an upswing in the melezitose values. Sample Moderate showed greater levels of glucose and fructose than any other sample, yet it did not have the greatest stickiness rating during the physical testing methods. Additionally, sample Low C possessed greater amounts of glucose and fructose than the stickiest Heavy sample. Samples Moderate and Low C's high reducing sugar content, but moderate physical stickiness, served as a warning that testing for reducing sugars may not be an indicator for cotton sample stickiness.
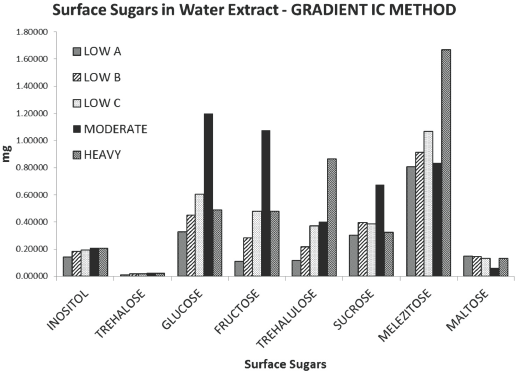
Amounts of the eight surface sugars in the five raw cotton samples.
Modified IC Instrumental Method
To remedy overlap of the major entomological sugar isomer contaminants present in the plant fiber, five raw cotton samples were subject to water extraction and tested on the IC using an updated, improved separation method, whereby an isocratic delivery of 200 mM NaOH was used over the course of 28.5 min at a flow rate of 0.8 mL/min, and 30 °C compartment and column temperature. It is well known that temperature can play an important role in IC and HPLC to help achieve optimal separations, along with analyte structures and eluent types/flow rates. Shorter retention times, greater peak separation efficiencies, and lower pressure can occur with increased column temperature, therefore, 30 °C was chosen for the method. Fig. 6 shows a sample chromato-gram of the nine sugar standards (all present at 0.1 mg/mL) with trehalulose, sucrose, melezitose, and raffinose fully separated with baseline resolution.
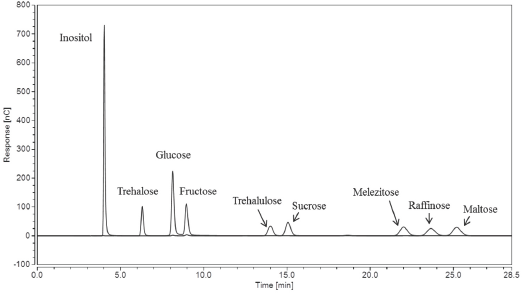
IC chromatogram of nine sugars at 0.1 mg/mL concentrations using the Improved IC method.
We were able to acquire raffinose concentrations for the five cotton samples because the melezitose and raffinose peaks were fully separated. The weight of the sugars present were then calculated. Fig. 7 shows another chromatogram of sample Low A obtained using the Improved IC method.
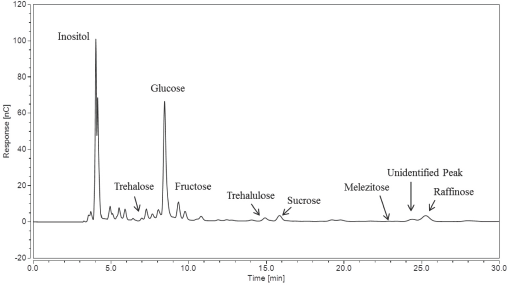
IC chromatogram for sample Low A using the Improved IC method.
When compared with the chromatogram of sample Low A obtained via the Gradient IC method (Fig. 3), it was further evident that the presence of raffinose caused an increase of the retention peak of melezitose since it was not fully separated. We believe that seed meat sugar may have been present in sample Low A, giving ∼0.183 mg of raffinose in addition to ∼0.004 mg of melezitose.
For sample Low A, the melezitose amount went from 0.808 ± 0.097 mg present in 20 mL of water extract (obtained using the Gradient IC method) to 0.004 ± 0.003 mg calculated from the chromatogram obtained using the Improved IC method. Sample Low A actually had less than 1% of the melezitose on the surface of the cotton than previously thought. The trehalulose present on the surface of sample Low A was previously found to be found to be ∼0.118 ± 0.021 mg in 20 mL of water extract using the Gradient IC method, as seen in Table III.
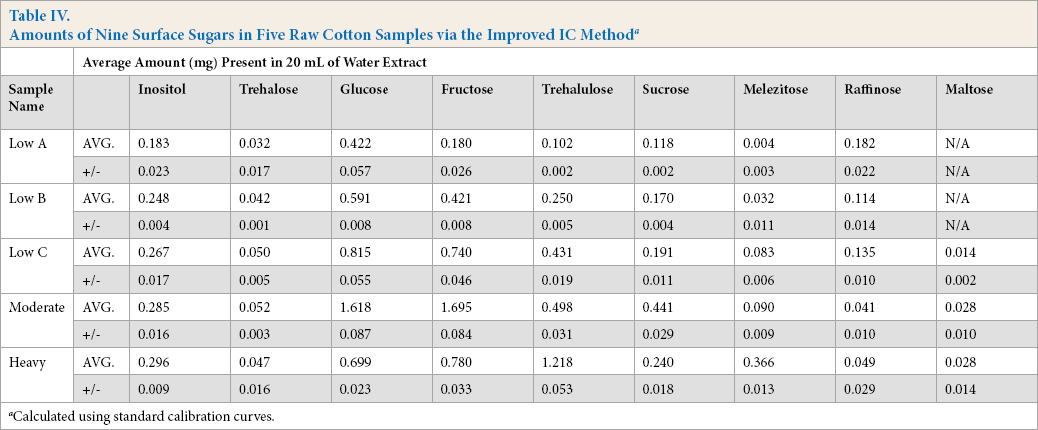
In Table IV, a more reliable value of 0.102 ± 0.002 mg was calculated from the Improved IC method chromatogram. Therefore, the trehalulose for sample Low A remained roughly 87% of the previous value, while the melezitose decreased dramatically, indicating that not only was there no aphid infestation evidence present for the sample, but the trehalulose amount was also low and not sufficient to indicate sugar contamination due to whiteflies.
Amounts of Nine Surface Sugars in Five Raw Cotton Samples via the Improved IC Method a
Calculated using standard calibration curves.
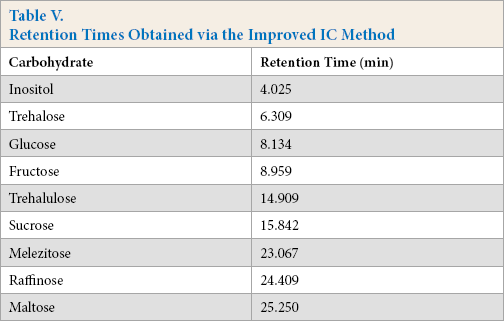
The sucrose amount also decreased from 0.305 ± 0.144 mg in Table III to 0.118 ± 0.002 mg in Table IV, indicating that there may have been an overlapping peak present at the sucrose retention time using the Gradient IC method. The amount of maltose also decreased to sometimes undetectable levels, showing that the separation method needs to be efficient and long enough to fully separate the sample components. Table V lists the new retention times for the nine sugars detectable using the Improved IC method.
Retention Times Obtained via the Improved IC Method
Another example of the increase resolution gained using the Improved IC method can be seen in the chromatogram for sample Heavy in Fig. 8. The melezitose amount decreased from 1.67 ± 0.22 mg in 20 mL of water extract using the Gradient IC method to 0.37 ± 0.01 mg using the Improved IC method. In this particular sample, the trehalulose amount increased from 0.87 ± 0.13 mg to 1.22 ± 0.05 mg in the 20 mL water extract; while the sucrose amount decreased from 0.33 ± 0.03 mg to 0.24 ± 0.02 mg using the Improved IC method. These changes are a clear indication that some sucrose was present under the trehalulose retention peak when using the Gradient IC method. Since the presence of sucrose is also a major indicator of contamination with physiological plant sugars, we must take into account the concentration of sucrose for the same cotton sample. 10
IC chromatogram for sample Heavy using the Gradient IC method.
When looking at the chromatogram obtained using the Improved IC method for sample Heavy (Fig. 8), the increase in trehalulose to 1.218 ± 0.053 mg from 0.118 ± 0.021 mg can be visualized in the change in the retention peak using the Gradient IC method (Fig. 4). The unidentified peak was also present in Fig. 8 at ∼24.5 min. Again, this peak was adding peak area, along with the raffinose peak, when the separation method was not sufficient to fully separate them. Since the trehalulose increased ∼16% and the melezitose decreased to ∼ 9% of its original value, the diagnosis for sample Heavy is a whitefly stickiness issue, rather than an aphid issue.
Table VI indicates the change in sugar weight (in percent) when changing the IC method from the previously used Gradient IC method to the Improved IC method. Across all samples, whether considered a low, moderate, or heavy stickiness rating by physical testing methods, each sugar changed in the same direction, up or down; with the exception of the trehalulose average weight in the Low A sample. Trehalulose showed greater increases (up to 40.4%) as the stickiness rating increased and sucrose showed decreases up to –61.3% of the original weight.
Comparison of Nine Surface Sugar Amounts in Five Raw Cotton Samples using the Improved versus the Gradient IC Method a
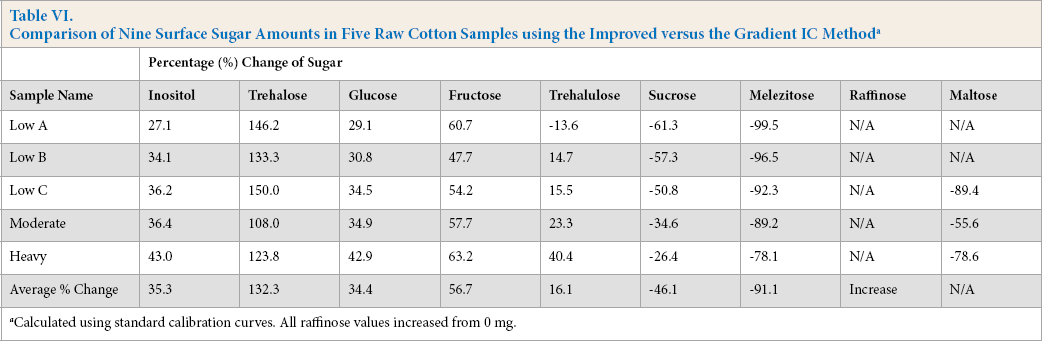
Calculated using standard calibration curves. All raffinose values increased from 0 mg.
Melezitose decreased as well, with the greatest amount of melezitose actually remaining in a sample that was only ∼22% of the original value. Raffinose increased from 0 mg in every sample via the Gradient IC method, therefore percentages could not be calculated. Because of the raffi-nose increases however, it is evident that the raffinose peaks were adding to the melezitose retention peaks to give false, increased weight values. The unidentified peaks at ∼24.5 min were exacerbating the false high weight values for melezitose in the samples as well.
Interestingly, some of the other constituent sugars showed increases as well, such as an average overall increase of glucose by ∼34%. At least two possible factors may have contributed to the concurrent changes of those sugars. First, every time a given sample was tested via a different IC method, new water extracts had to be created using new cotton aliquots from that particular sample, possibly resulting in some sugar amount differences per sample. Second, proper integration using the IC software was difficult when using the Gradient IC method as baseline shifts (both positive and negative in value) were an issue. Differences in baseline stability can be clearly seen when comparing Figs. 4 and 8. Ultimately, these sugar amount changes within a given sample cannot be fully ignored. However, we feel the extremely large decrease in the melezitose (∼91 %) and increase in trehalose (∼132%, which is created by whiteflies) can be used as a valid, qualitative indicator for insect identification. In summary, the sample water extracts analyzed using the Improved IC method were easier to integrate and showed better baseline resolution than the water extracts tested using the Gradient IC method. Additionally, the temperature modification in the improved method may have helped with analyte separations.
A bar graph was created showing the differences between the nine surface sugars for the five cotton samples (Fig. 9). There is a cluster of higher bars around trehalulose in the graph, with bar intensity removed from the melezitose bars due to overlap using the Gradient IC method. It is interesting to note that for this sample set, trehalulose and melezitose amounts increased as the physical stickiness rating went from Low to Heavy, while raffinose amounts decreased. This is an indication that seed meat contamination was possibly present in the Low stickiness sample that did not lead to stickiness, but would cause discrepancies in IC testing if the separation method was not sufficiently efficient. Also, the greatest amounts of the reducing sugars glucose and fructose both appeared in the Moderate sample (with the second greatest amount for glucose appeared in the Low C sample), giving validity to the proposition that the Benedict test alone was not sufficient for testing cotton stickiness.
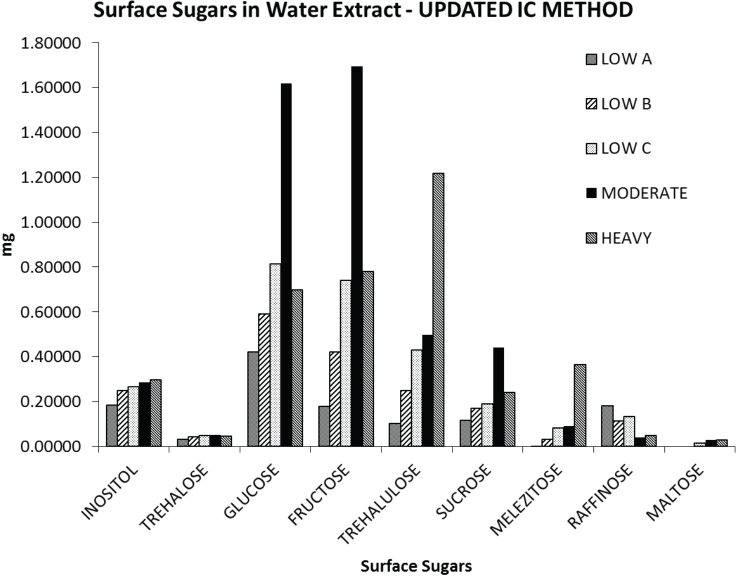
Amounts of the nine surface sugars present in the five raw cotton sample
Conclusions
A modified IC method used in separating entomological sugar contaminants from each other and physiological plant sugars in cotton was developed. Our improved sample preparation and instrumental technique allowed for more consistent sample handling, using vortexing before water extraction and through enhanced chromatographic differentiation between the melezitose and raffinose present on the cotton's surface.
By changing to the Improved IC isocratic method, we have shown baseline resolution of nine sugars for cotton samples, as well as the separation and quantitation of raffinose, a seed meat sugar that may be falsely identified as melezitose. These changes shifted the sugars of interest ratio-based determination from potential aphid contamination to potential whitefly contamination for the Moderate and Heavy samples tested. Our Improved IC instrumental method allows for more reliable analysis of entomological sugars. Although use of a gradient method may cut down on IC analysis time, retention peak overlaps can cause discrepancies in correctly identifying entomological and plant sugars.
For completely thorough sugar stickiness fingerprints, and thus predictive comparisons, of both water extracted and mechanically derived sugar profiles, an automated pretreat-ment of chromatographic profiles for pattern-recognition may be needed. 27