
Abstract
The marketability of cotton fiber is directly tied to the trash comingled with it. Trash can contaminate cotton during harvesting, ginning, and processing. Thus, the removal of trash is important from field to fabric. An ideal prerequisite to removing trash from lint is identifying what trash types are present. A relatively new and fast analytical technique has been gaining popularity among researchers is hyperspectral imaging. Coupling Fourier-transform infrared (FTIR) imaging with attenuated total reflectance (ATR) and a focal plane array (FPA) detector allows for larger samples to be analyzed with speed and little to no sample preparation. It is the goal of this study to identify botanical trash using hyperspectral FTIR imaging as a feasibility study to facilitate wider utility of this method in the textile field and to use this data to create a spectral library.
Introduction
Cotton has historically been a cash crop with many uses (e.g., as apparel, mattresses, and personal care products). 1 Moreover, the price garnered from the sale of cotton can be influenced by its appearance. Thus, many researchers have studied cotton trash and its effects when it comes in contact with cotton lint.2–10
Botanical trash includes but is not limited to hull, stem, seed coat, leaf, and bark. It is important to note that botanical trash types are largely composed of cellulose, but waxes, phenolics, and other minor constituents may be present. 9
Trash mixed with cotton lint can have deleterious effects on cotton fiber during all stages from field to the final fabric. Conventional methods for studying cotton trash, including the Shirley Analyzer and the Uster high volume instrument (HVI), have not yielded the origin of or the specific trash type present with cotton lint.11-12 The Shirley Analyzer, which involves aero-mechanical separation of cotton fiber from trash, is based on a gravimetric technique used when the cotton is opened at cleaning. 13 Rhe Uster HVI is a geometric technique that involves image analysis (in the visible spectral region) by taking a measurement based on the total surface area of cotton contaminants. 14
Earlier studies have classified trash using cluster analysis at high accuracy, but were time consuming. 10 Foulk and co-workers studied the effect of trash being collected in the rotor during spinning. The result of their study revealed that the origin of the trash (hull and shale, rather than seed coat fragments) was causing ends down and thick places in the rotor. 12
Previous studies have reported use of the attenuated total reflectance (ATR) accessory coupled with Fourier-transform infrared (FTIR) spectrometry (Fig. 1). 15 Briefly, an infrared beam comes in, impacts a mirror, and then hits the internal reflective element (IRE). From there, an evanescent wave penetrates the sample and is then directed back into the IRE, impacting the mirror below it. Finally, the signal is directed to the focal plane array detector. ATR is a surface analytical technique with a penetration depth of a few micrometers. An IRE with a high refractive index (e.g., diamond or ZnSe) mounted on top of a larger optical surface of similar refractive index makes up the sampling area. The IRE, along with the source, creates the internal reflection. 16
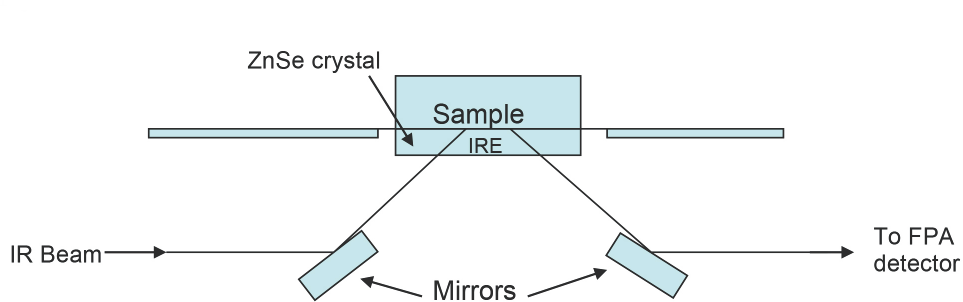
Schematic of ATR accessory.
Previous reports have identified cotton trash types with attenuated total reflectance- Fourier transform infrared (ATR-FTIR) spectroscopy. 17 This study was aimed at investigating the feasibility of using ATR-FTIR spectroscopy to identify botanical trash such that the analysis could be included in a spectral library used to match unknown trash with authentic trash standards. Use of ATR-FTIR imaging in the current study afforded both spectral and spatial information simultaneously.
ATR-FTIR imaging, specifically in the macro form, does not require a microscope, has been previously used to study large sample areas and dynamic aqueous solutions, and provides high throughput analysis. 18 The ATR accessory coupled with the FTIR imaging technique requires little to no sample preparation, provides sample characterization in a relatively short time, and handles sampling without the need for high spatial resolution. 19 In addition, compared to FTIR, FTIR imaging coupled with a focal plane array detector, allows for the measurement of spectral and spatial resolution information simultaneously. 20 This program was implemented to determine the viability of ATR-FTIR spectroscopic imaging in the analysis of botanical cotton trash types.
Experimental
ATR-FTIR Imaging
Raw cotton botanical trash types in the absence and presence of cotton were analyzed using a Bruker imaging macro-chamber (IMAC) fitted with an attenuated total reflection (ATR) accessory (Bruker Optics) and a Sony ExwaveHD color video camera. The cotton trash was laid on the ATR crystal surface and secured with a screw to maintain intimate contact with the sample. Also, attached to the IMAC was a focal plane array detector (FPA). Each pixel was hyperspectral, with an IR range from 900–3000 cm−1. The sample size of the ATR Zn-Se crystal was 1.4 mm in diameter. An air background subtraction was taken with 8 scans. Samples were analyzed with 8 scans in under 5 min. The resolution was 8 cm−1. Samples were analyzed with pure trash only and in the presence of cotton. Samples were integrated over the C-O fingerprint region (1500–1000 cm−1). The rationale behind this range selection is that it falls within the fingerprint region, which exhibits sharp bands. The trash is largely made of cellulose and to a smaller extent waxes and phenolics. Typically, the presence of non-cellulos-ics make it easier to identify one trash type from another.
Data were interpreted using Bruker OPUS software.
ATR-FTIR Spectroscopy
The trash types were in powder form (hull, leaf, seed coat, and stem). A Bruker FTIR Vertex spectrometer equipped with a focal plane array detector was used in this study. The resolution was 8 cm−1. The number of background and sample scans were both 32. The FTIR was fitted with a ZnSe-Diamond ATR accessory (PIKE Technologies). Data were interpreted using Bruker OPUS software.
Samples
The hull, leaf, seed coat, and stem trash types samples came from New Mexico.
The trash samples were cut to smaller samples sizes for the best coverage over the ATR crystal. The cotton samples were taken from bleached and scoured cotton balls.
Results and Discussion
Pure Trash Types
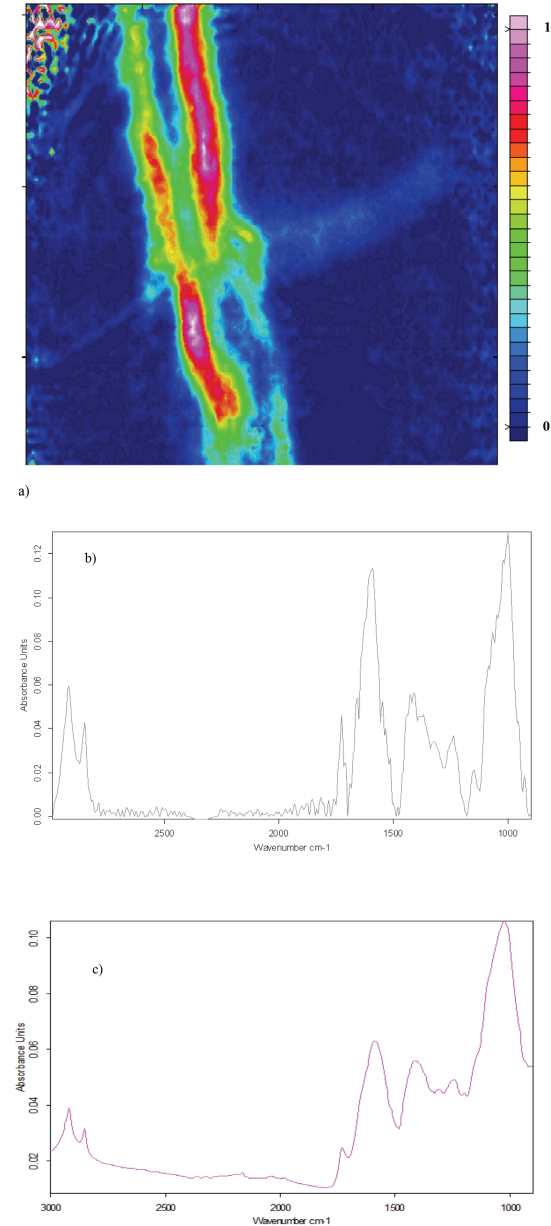
All spectral band assignments reported in this study are referenced from an Abidi and co-workers investigation of cell wall structure and cotton fiber development. 20 Although the bands in this study are for trash, the high cellulose content make cotton bands and trash bands similar. Fig. 2a depicts a 2D FTIR image of seed coat trash. The pink region of the 2D FTIR images in this paper show a high concentration of trash and the blue region suggest little or no presence of trash. The C-H stretching doublet is highly apparent over the 2900–2800 cm−1 range. A large peak with two smaller shoulder peaks correspond to the C=O stretching band was observed at 1730 cm−1 and absorbed water at 1633 cm−1. The region between 1500 and 1100 cm−1 include C-H vibrations that have overlapping contributions from many different sources, which may help explain differences in the seed coat spectra when comparing Fig. 2b to 2c. The bands in the 1160-1000 cm−1 range represent the C-O stretching frequency, and the C-O-H and C-O-C functional groups.
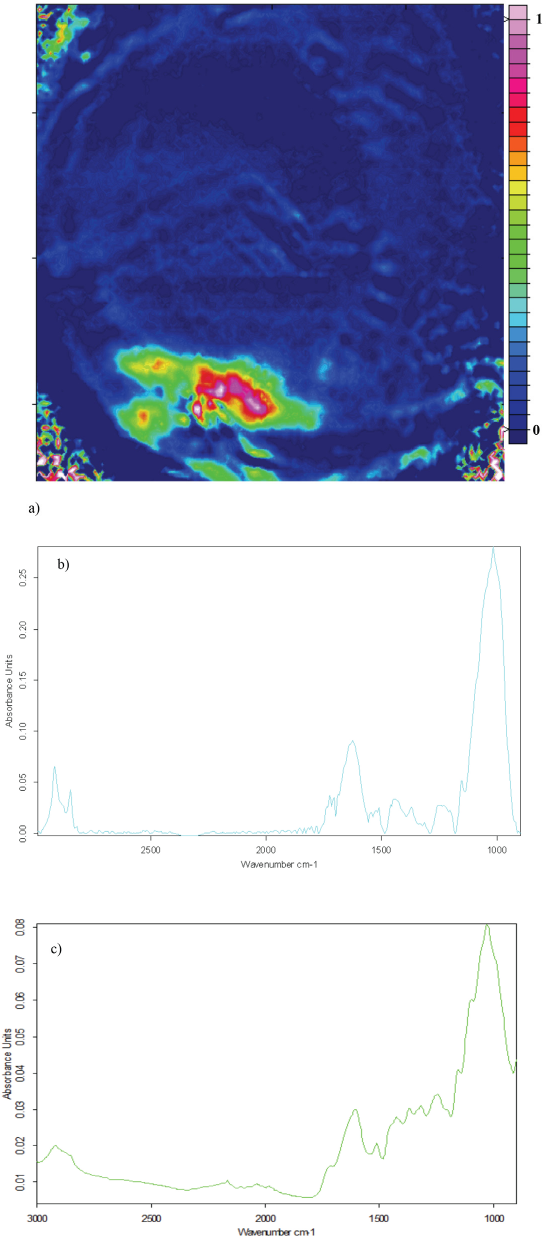
a) ATR-FTIR image showing the distribution of seed coat trash in the absence of cotton, b) average of five seed coat trash spectra extracted from ATR-FTIR image, and c) ATR-FTIR spectrum of seed coat trash.
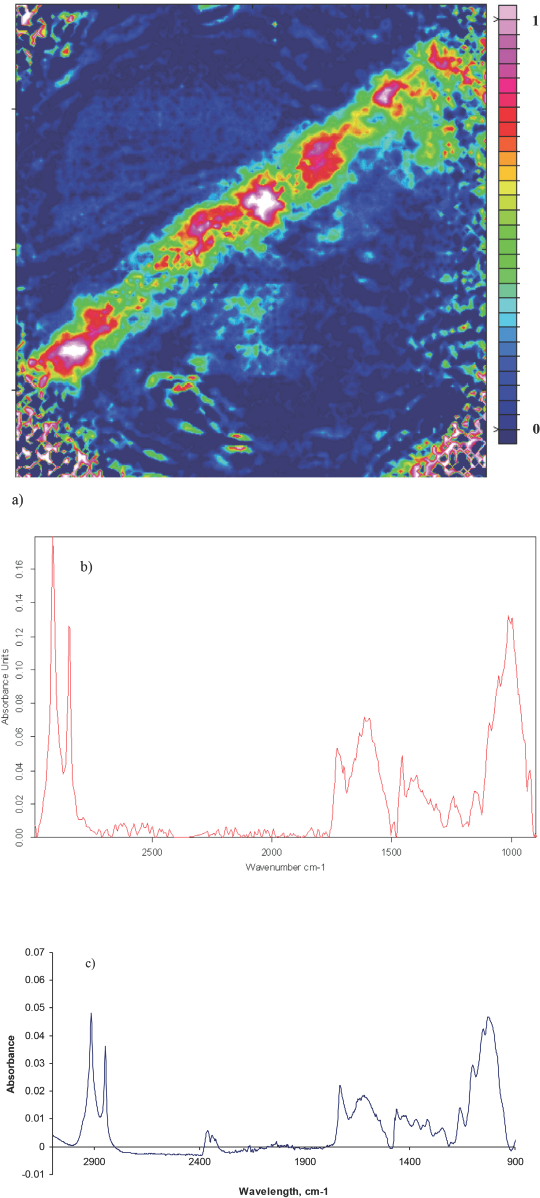
Fig. 3a is a FTIR hull trash image. The color distribution results from a non-uniform contact between the sample and the ATR accessory. However, the deep pink color signifies that the hull trash is indeed present. When comparing the hull spectra in Figs. 3b and 3c, the C-H stretch in the 2800–2900 cm−1 range is highly pronounced in Fig. 3b, but are more subtle in Fig. 3c. The C=O stretching doublet in the 1800–1500 cm−1 region matches quite well for both spectra. The region between 1500 and 1100 cm−1 both show fine structure increasing from left to right. The fine structure on the large peak at 1100 cm−1 for spectra in both Figs. 3b and 3c appeared slightly different, but yielded evidence of the C-O stretching frequency and the C-O-H and C-O-C functional groups.
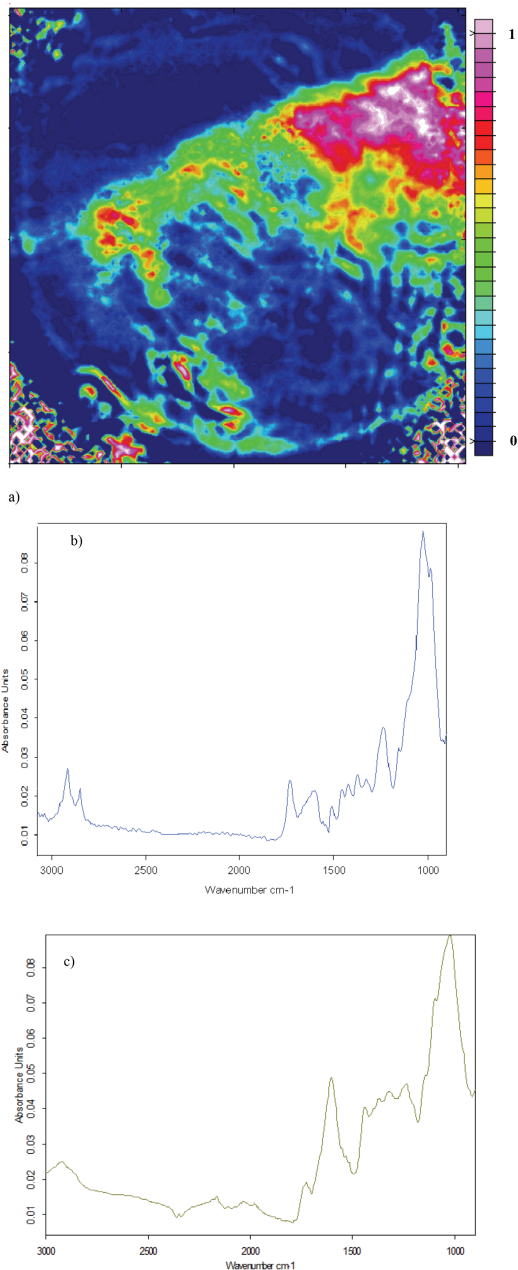
a) ATR-FTIR image showing the distribution of hull trash in the absence of cotton, b) average of five hull trash spectra extracted from ATR-FTIR image, and c) ATR-FTIR spectrum of hull trash.
Fig. 4a shows an FTIR image for stem trash. The stem was sampled with the outer layer up so the inner layer could be analyzed on the ATR accessory. The outline of the stem sample showed very clearly on the image, although the color distribution again suggested non-uniform contact between the ATR accessory and the sample. The stem trash average spectrum in Fig. 4b appeared quite noisy, even after many images were surveyed. The C-H stretching peak at 2900–2800 cm−1 that was present in the ATR-FTIR spectrum in Fig. 4c was absent in Fig. 4b. The peaks at 1000 cm−1 in Figs. 4b and 4c suggest the presence of the C-O stretching frequency. Peaks in the wavelength range between 1500 and 1200 cm−1 differ sharply. This may be due to C-H vibrations from different sources.
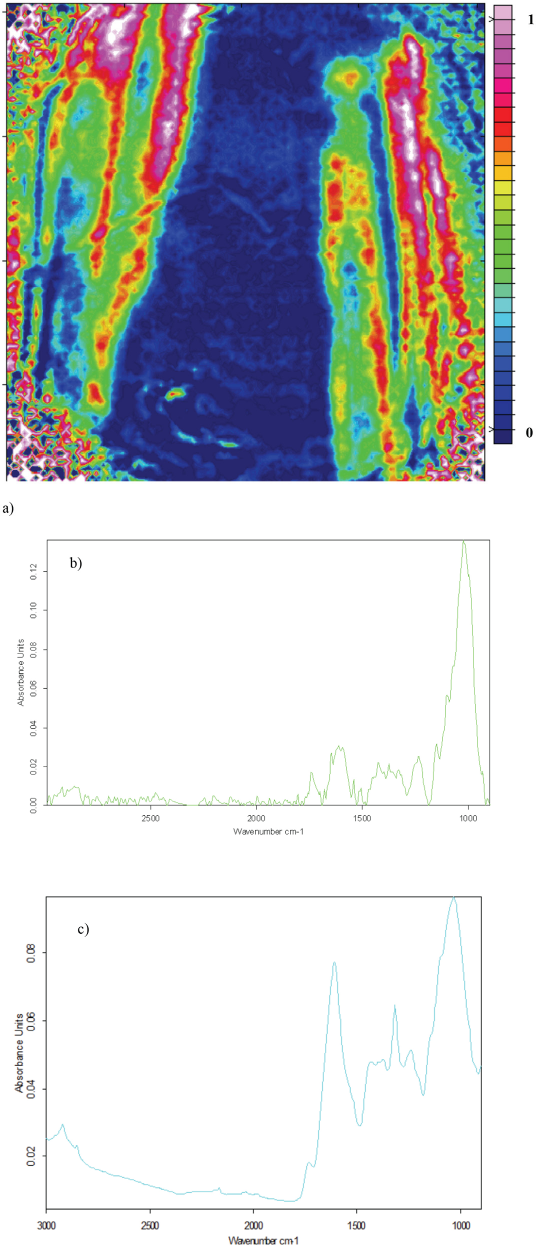
a) ATR-FTIR image showing the distribution of stem trash in the absence of cotton, b) average of five stem trash spectra extracted from ATR-FTIR image, and c) ATR-FTIR spectrum of stem trash.
Fig. 5a shows an ATR-FTIR image of leaf trash. It appeared that the edges of the leaf absorbed the greatest. Although Fig. 5b seemed noisier, the peaks represented in Figs. 5a and 5b agree quite well. There was some ambiguity and differences in the fine structure between 1500 and 1200 cm−1. This is not surprising since the other trash types showed differences in this C-H vibration region.
a) ATR-FTIR image showing the distribution of leaf trash in the absence of cotton, b) average of five leaf trash spectra extracted from ATR-FTIR image, and c) ATR-FTIR spectrum of leaf trash.
Fig. 6a shows an ATR FTIR image of bark trash. The image shows a highly uniform makeup for this bark trash as it is strongly absorbent in the center of the sample. Figs. 6b and 6c spectra are quite similar, which substantiates what was found in the FTIR image. The C-H vibrations and C-O stretching frequency were also represented in both of the spectra.
a) ATR-FTIR image showing the distribution of bark trash in the absence of cotton, b) average of five bark trash spectra extracted from ATR-FTIR image, and c) ATR-FTIR spectrum of bark trash.
Fig. 7 shows the representative ATR-FTIR spectra of cotton overlaid with cotton trash (hull, leaf, seed coat, and stem). There were distinct peaks for cotton different from the trash. In addition, peaks in the fingerprint region distinguished one trash type from another and from cotton. These trash types were very similar, since they are all cellulose based. However, there were some slight differences among them based on their non-cellulosic content, such as waxes, pectins, ash, and organic acids.
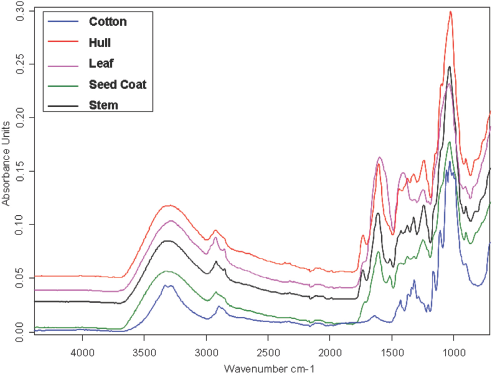
Representative ATR FTIR spectra of cotton and pure trash types.
Trash with Cotton
Fig. 8 shows an ATR-FTIR image of hull trash with cotton. The pink and red colors are associated with the presence of hull trash, but the cotton spectrum was not identified when numerous spectra were extracted. When the cotton was imaged with the trash, the cotton was not detected, so only the trash present was identified. Thus, it was a straightforward IR imaging technique for cotton trash detection. This result suggests that determining trash from cotton using ATR-FTIR imaging could be very straightforward and simple technique.
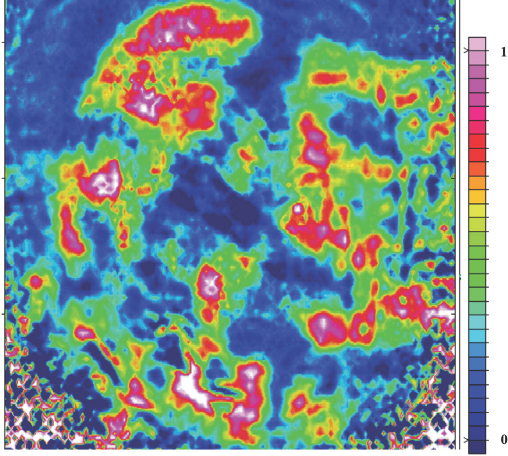
ATR-FTIR image showing the distribution of hull trash in the presence of cotton.
Conclusions
A feasibility study on the use of ATR-FTIR imaging to identify cotton trash was completed. By comparing ATR-FTIR imaging to ATR-FTIR spectroscopy derived spectra, botanical trash was identified. A “proof of concept” on identification of hull trash in the presence of cotton was demonstrated. The similarity, or lack thereof, for the ATR-FTIR imaging spectra compared to the ATR-FTIR spectra was directly influenced by the thickness of the sample. The raw imaging samples compared to the powder ATR-FTIR were noisier. This may be due to the reduced spectral resolution. The lack of overlapping spectra associated with cotton simplified the determination of cotton trash from cotton. The ATR sampling technique proved to be easy to use and required no sample preparation. The use of the FPA detector allowed for fast analysis time. Overall, the FTIR imaging technique shows promise for the cotton trash identification. A spectral library was created based on the data from this research.