
Abstract
Cotton maturity describes the thickness of the cotton secondary cell wall. There is a need for developing non-destructive methods for measuring maturity that also examine distribution. The current study seeks to expand reported infrared (IR)-based maturity determinations using an IR imaging system with a focal-plane array (FPA) detector. Adapted equations were used to examine the maturity of cotton standards and of a larger set of upland cotton varieties (30 total). Maturity values obtained with a Cottonscope and from IR determinations showed strong linearity, R2 = 0.95, while contour plots provided a visual representation of the maturity distribution in the samples. These results validate the use of IR measurement for examining cotton maturity and establish the use of the FPA IR system for examining and imaging cotton maturity distributions.
Introduction
Cotton fiber quality determinations are vital for marketing cotton crops in a global market, establishing their value, and in identifying appropriate end-product uses for the fiber. 1 Fiber properties can also aid cotton growers and breeders in their selection of cultivars to plant or help determine the commercial desirability of a new cultivar.
One important cotton fiber quality parameter is maturity. Cotton maturity measures the degree of fiber thickness that results from secondary cell wall deposition in a cotton fiber.2,3 Insufficient thickening of the secondary cell wall has been associated with commercially undesirable properties and reduced performance during fiber processing. 4 Direct fiber maturity measurements are rarely performed, given the tedious and time-consuming nature of the common standard tests. Instead, the cotton fiber industry often relies on measurements of cotton fiber micronaire, a composite measurement that provides a sense of fiber maturity and fineness. There is a need for developing quick, non-destructive methods for measuring fiber maturity. Methods that require small amounts of sample could be particularity useful in examining the development of cotton fibers and the evolution of their fiber properties.
The definition of cotton maturity directly relates the ratio between cell wall area (CWarea) and the fiber perimeter (P) (Eq. 1).3,5,6

Discussion of cotton fiber maturity can cause some level of confusion when the term maturity is used broadly to describe days or timelines of fiber growth rather than the extent of secondary cell wall growth. The descriptions are related; as the fiber develops its secondary cell wall the maturity of the fiber increases. 1 It is also important to consider that measurements of maturity are not uniform for cotton fibers. Maturity values can vary dramatically across samples of various fully-grown cultivars, across bolls harvested from the same plant, and even between fibers from a singular boll. 7 As a result, developing methods that provide a distribution of maturity values would be beneficial.
The standard method of measuring maturity (cross section image analysis) calls for the immobilization of fibers in a polymer resin, cutting cross sections of the fibers, and then directly measuring and averaging the parameters for Eq. 1 for a high number of fiber cross sections (∼400 points).3,8 This process is time-consuming and not performed as a routine measurement. Instead, an indirect measurement of maturity is provided by the Automated Fiber Identification System (AFIS). While the measurement is one of a larger set of parameters given by the system, AFIS maturity determinations can show bias outside a narrow range of values when a correction is not properly applied to the raw data or if the system is not properly monitored for these errors. 9 Other indirect methods for measuring maturity include caustic swelling, 10 differential dying,11,12 and use of the Fineness and Maturity Tester (FMT).1,2 More recently, two methods for examining fiber maturity have emerged, measurements using the Cottonscope instrument (BSC Electronics, Ardross, Western Australia)2,6 and measurements that rely on infrared (IR) spectroscopy equipped with an attenuated total reflection (ATR) accessory.13-18 The Cottonscope is an automated, polarized light-based microscope that examines a large number of cotton fiber cuttings suspended in an aqueous solution to estimate average fiber fineness and maturity. Maturity values are measured by relying on the differential interaction of polarized light with the fiber samples. Ticker cell walls register a red appearance, while thin fiber cell walls register a dark or translucent appearance; thus, the redder in appearance, the higher the maturity of the fiber. 19 Cottonscope determinations are mostly automated, and only require the operator to perform fiber cuttings using a designated sample knife.2,6 Notably, Cottonscope analysis provides a distribution of the sample maturity values. While the instrument requires little in the way of sample, cutting of the sample compromises and limits its use for other examinations, such as fiber length studies.
IR examinations of cotton fiber development date back several decades. While examining KBr pellets of Wiley-milled cotton samples, USDA scientists observed changes in the IR band shapes and positions for fibers harvested at different developmental stages, and with varying degrees of crystallinity. 20 While informative, these early studies did not use IR spectroscopy to measure fiber maturity. Widespread adoption of ATR brought renewed attention to the IR examination of cotton fiber samples. ATR-based sampling is nondestructive, requires a small amount of sample, and minimal sample preparation. 21 IR ATR studies of fibers harvested at various developmental stages confirmed changes in the spectral bands and positions, changes that correlated to variations in fiber maturity and crystallinity. 16
In a series of reports, Liu and collaborators used ATR Fourier transform infrared (FTIR) and a simple three-band ratio algorithm to discriminate between mature and immature cotton fibers. 13 The three-band algorithm relied on intensity changes to cotton IR bands observed at 956 and 1032 cm−1; a third band with a minimal absorbance observed at 1500 cm−1 was also used in the algorithm. A second equation converted the algorithm into an infrared maturity index for measuring cotton maturity. Infrared maturity index determinations with the equation showed a strong linear correlation with measurements from maturity standards as determined with image analysis of cross sections of cotton standards and with AFIS maturity determinations. Subsequent studies have validated the use of the algorithm and IR index for performing quick and reliable IR maturity determinations.13-18
In this study, we further explore the use of ATR IR spectroscopy for measuring cotton fiber maturity while also examining maturity distributions in the cotton fiber samples. The work presented in this study also builds on prior imaging work performed with a single reflectance ATR unit equipped with a mid-IR focal plane array (FPA) detector.22,23 This particular set-up provides spatial resolution to the simple equations used for calculating maturity as cited above. The present study adapted the cited equations to correspond to the spectral changes observed with the FPA detector. In addition, the FPA IR system is used for creating visual images that provide a sense of the spatial distribution for the cotton samples. IR maturity determinations with the FPA system are simple, require little in the way of sample or preparation, and readily provide a sense of the sample maturity distribution.
Experimental
Plant Materials
A total of 30 samples from 22 upland cotton varieties were included in this study. Eight of the varieties—Stoneville 474 (STV474), Stoneville 825 (STV 825), FiberMax 966 (FM966), Deltapine Acala 90 (DP90), M-240 RNR (M240), Cooker 315 (Cooker), Acala Ultima, and Suregrow 747 (SG 747)—were grown in Stoneville, MS, USA in 2015 under standard field conditions.
22
Cotton samples of the germ-plasm line MD 90 and MD 52 were grown in 2009 under standard field conditions in New Orleans, LA, USA. Each of these was harvested at different developmental time points, 20, 24, 28, 32, and 36 days post anthesis (DPA) (total of 10 samples).
24
The development of the line was previously described.
24
Micronaire standards (GM-39, GU-39, DP-9, 28814, and 39414) were supplied by the Agricultural Marketing Service (AMS). Seven additional samples designated D4, D8, D9, D12, D13, D17, and D26 were also included. This subset of cotton materials was obtained by crossing Deltapine Acala 90 (DP-90, PI 564767) with the
FTIR Examination
Cotton fiber bundles were examined with an IMAC macro sampling chamber (Bruker Optics, Billerica, MA, USA) attached to a Vertex 70 Fourier transform infrared (FTIR) spectrometer. The sampling chamber was outfitted with an FPA detector and a FastIR single reflection ATR unit (Harrick Scientific Products, Pleasantville, NY, USA). During examinations, the FPA detector was cooled to 86.7 K with liquid nitrogen. The sampling chamber and ATR unit were operated at room temperature (RT) and used as provided by the manufacturer. The integration of the detector was set between 0.75 and 0.50 milliseconds, and a frame rate of 1610 Hz was used. For each examination, a small bundle of fibers was randomly selected from the whole sample. The bundle samples were combed, and a small aligned sample (∼250 mg) was placed atop the ATR crystal. The cotton bundles were secured with a metal clamp and metal plate in a manner that assured consistent pressure for all samples. All IR data was collected in reflectance mode. Samples were examined with 32 scans with a resolution of 8 cm−1 between 3300 and 900 cm−1, unless otherwise noted. Collected spectra were discarded if they displayed saturation artifacts, or very low intensities (<0.02 a.u. for the prominent C-O bands near 1024 cm−1). Pixels were grouped (co-addition of adjacent pixels) into 16 × 16 binned pixel groups. At the examined binning level used in this study (16 × 16), there were 8 columns and 8 rows of binned pixels (a total of 64) with a spatial resolution of 2.5 × 2.5 mm per binned pixel. However, low signals in the outer edge of the binned pixels results in spectra with high noise and spectral features. As a result, spectra from the binned pixels in the outer edge were not used. Thus, as used in this study, the system provides 6 columns and 6 rows of binned pixels for a total of 36 binned pixels. An air background was acquired prior to each examination. Spectra for each sample were baseline-corrected using the OPUS 3D spectroscopy software (version 6.5) (Bruker Optics, Billerica, MA) using the concave rubber-band correction, with the option to exclude CO2 bands selected. Atmospheric CO2 bands were removed using a straight-line generation from ∼2395 to 2333 cm−1. Individual spectral points from each binned pixel were extracted using OPUS and collated using the OriginPro software. A minimum of four replicates were examined per cotton sample.
Maturity intensity ratios and maturity values were calculated for each binned pixel using Eqs. 2–4 (in the Results and Discussion section) and Excel. OriginPro was used to prepare distribution maps and surface distribution plots. Line and Gaussian fits were calculated with the OriginPro curve fitting functions. When average values for the maturity intensity ratios and maturity values are listed, these were calculated by first averaging determinations for binned pixels in each replicate (average of ∼36 values), and then averaging the replicates. The standard deviation of the average of the replicates is reported as the error.
Conventional FTIR examination of cotton samples was performed with a Vertex 70 (Bruker Optics, Billerica, MA, USA) equipped with an ATR sampling accessory (Pike Technologies, Madison, WI, USA) and a diamond-ZnSe reflective crystal. Cotton samples were placed on top of the ATR crystal and secured with a metal clamp. A total of 8 scans were measured between 3300 and 900 cm−1 for each sample point with a resolution of 4 cm−1. Spectra were presented with baseline correction, but without ATR correction or atmospheric compensation. For area studies, ∼50 sampling points in sample area of a 25-mm diameter were studied. Samples were moved with care to minimize oversampling of points. Individual spectral points were extracted using OPUS and collated using the OriginPro software. OriginPro was used to prepare distribution maps and Gaussian fits.
Cottonscope Measurements
Cottonscope maturity measurements were performed as described previously.2,6 Briefly, a small bundle sample was randomly selected from the total sample and placed into a cutting accessory. The sample was sliced several times until ∼50 mg of sample was obtained. The cuttings were placed into the Cottonscope water compartment and the measurement performed. Tree sample replicates were taken and examined per cotton sample, and each replicate was examined in duplicate. Maturity values are reported as the average of these six determinations.
Fiber Analysis
Cotton bundles were analyzed on the advanced fiber information system 2 (AFIS 2) (Uster Technologies AG, Uster, Switzerland). For each examination, a sample in sliver form is fed into the fiber individualizer, which separates the matrix into individual entities composed of fibers, neps, trash, and dust. Cotton slivers for each sample weighed 0.5 g and were arranged into 30-cm long slivers of randomly selected fibers. Five replicates of each sample were analyzed.
Results and Discussion
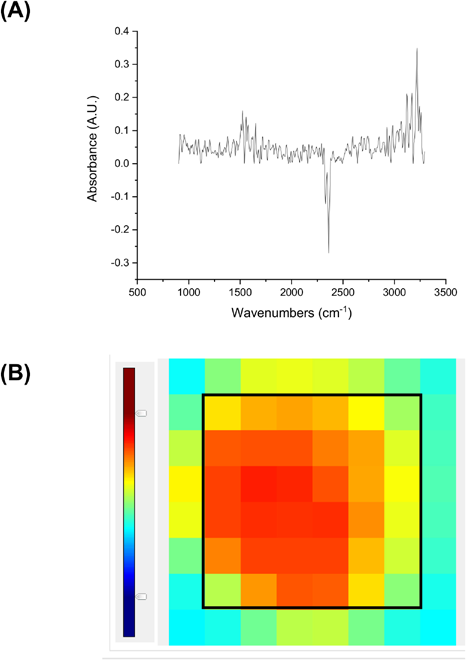
Fig. 1A shows the FTIR spectra of an immature (center) and a mature cotton fiber bundle (top trace) taken with a single reflectance ATR accessory and a FPA mid-IR detector. The spectra show typical bands associated with cotton. The observed cotton bands can be separated into four important sections: the O-H stretching region (3700-3000 cm−1), the C-H stretching region (3000-2700 cm−1), the O-H bending region (1800-1300 cm−1), and the fingerprint region (1250-900 cm−1).23,25 A portion of the fingerprint region between 900 and 600 cm−1, commonly observed with diamond ATR crystals, falls outside the spectral window of the FPA detector and were not included in the current study.
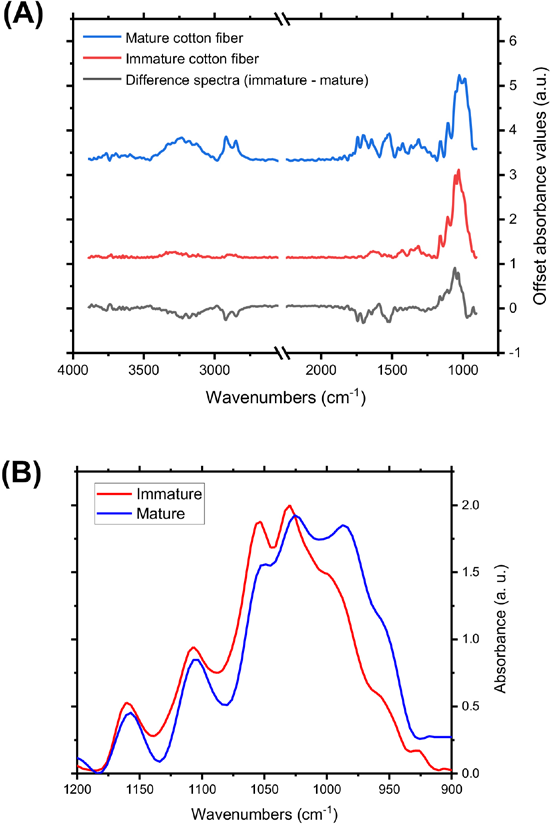
(A) Infrared spectroscopy (IR) spectra of a bundle of mature cotton fiber (top trace) and a bundle of immature cotton fiber (middle trace) as determined with a single reflection ATR accessory and an FPA mid-IR detector. The difference spectrum is shown in the bottom trace (immature - mature). (B) Highlight of the IR fingerprint region for the mature and immature fibers bundles. FPA IR spectra are shown shifted along the y-axis (normalized absorbance) in A. Spectra are presented with a smoothing correction that used nine points.
The fingerprint region of cotton spectra shown herein is composed of several combination bands that are often described as C-O and C-C vibrations.17,18,23,25,26 Previous studies have shown significant changes in the intensity of cotton fingerprint region bands indicative of the secondary cell wall development in the fiber. These changes were also observed with the spectra acquired from the system used in this study.17,18,26 The immature fibers showed prominent bands centered at 1160, 1107, 1055 and 1029 cm−1, with the 1029 cm−1 peak showing the most intense band (Fig. 1B). An unresolved shoulder band was also observed centered at 986 cm−1, and an infection point was at 956 cm−1. As the fiber matures, the band at 1055 cm−1 underwent a small shift to 1051 cm−1, and the 1029 cm−1 band shifted and widened to include the area between 1029 and 1019 cm−1. Notably, the broad shoulder band observed near 986 cm−1 for the immature fibers increased in relative intensity and resolved into a peak centered at 987 cm−1. In addition, the infection point observed at 956 cm−1 for the immature fiber grew in relative intensity into a wide shoulder band spanning 963-934 cm−1. The difference spectra between the immature and mature cotton fibers aids in highlighting these changes (Fig. 1A; bottom trace). While the 1034 cm−1 peak was predominant in the difference spectra, the largest negative intensity in the fingerprint region was observed in two regions, 956 and 970 cm−1.
IR distribution maps can be used to visualize changes in the secondary cell wall development of cotton fiber bundles. Fig. 2 shows the IR distribution maps of the mature and immature cotton samples described in Fig. 1. Each distribution map covers an area of about 20 × 20 mm, where 64 binned pixels are studied simultaneously with a spatial resolution of about 2.5 mm per binned pixel. The IR distribution maps display the integration of the 1034 cm−1 peak for the immature and mature fibers (Figs. 2A and C, respectively), and the integration of the 956 cm−1 band, normalized to the intensity of the 1034 cm−1 peak, for the immature and mature fibers (Figs. 2B and D, respectively). The 1034 cm−1 distribution maps are normalized to their respective intensity; thus, the distribution maps mostly display red and orange distributions for both the immature and mature fibers (Figs. 2A and C, respectively). In contrast, the distribution maps marking the intensity of the 956 cm−1 shoulder band area showed a prominent difference. While the distribution map of the mature fiber showed mostly areas of high integrations (Fig. 2D; pink and red tones), the immature fiber displayed areas with moderate integrations (yellow and green tones, Fig. 2B). Notably, areas near the corners of the distribution map tended to fall outside the most common tones observed in the map. 22 Examining some of these points (Fig. S1A) shows spectra with a high amount of noise and features that do not resemble cotton IR bands. This limitation appears to be instrumental. A display of spatial counts by the FPA detector showed low counts for many of the outer binned pixels in the array (Fig. S1B). The lower counts likely led to the depreciated detection and higher noise of these points. Still, even after discounting these edge points, each distribution map contains 36 sampling points that provided information on the composition and sample distribution in a cotton fiber bundle that covered an area of 15 × 15 mm. While these distribution maps are informative and could be used to follow fiber development, a quantitative determination of fiber maturity would be superior.
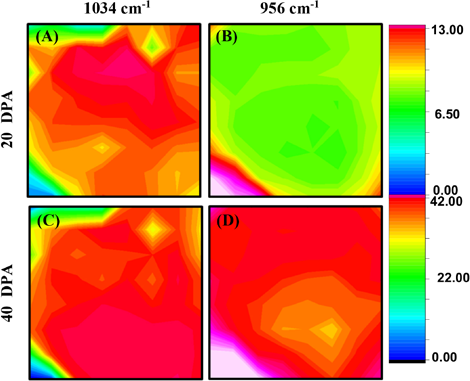
IR distribution maps for an immature (A, B; harvested at 20 DPA) and a mature (C, D; harvested at 40 DPA) bundle of MD90 fibers. Distribution maps show the intensity of the 1034 (A, C) and the 956 cm−1 (B, D) IR bands. The intensity of the maps displaying integrations of the 1034 cm−1 bands are scaled to the highest intensity region in each map (A, C); these scales are maintained for the 956 cm−1 maps (B, D, respectively). Red and pink tones correspond to high intensity integrations, while dark blue color corresponds to integrations near zero. Scale bar represents the width of two binned pixels, ∼5 mm.
IR Intensity Ratios
Intensity changes in the cotton IR fingerprint region can be used to determine fiber maturity IR intensity ratios. IR intensity ratios, typically calculated as the ratio of two or more spectral bands, have been previously used to mark relationships to cotton crystallinity or maturity.14,18,26,27 As described above, Liu and collaborators reported the use of IR intensity ratios for discriminating between mature and immature cotton fibers based on the intensity of fingerprints bands centered at 956 and 1032 cm−1.13,16,18 These bands were selected to maximize the observed intensity difference between mature and immature fibers. In the current study, bands that maximize the difference were observed in broader regions; for example the lowest point in the difference spectrum was observed in a range between 956 and 970 cm−1, while the maximum point was observed at 1034 cm−1 (Fig. 1). Small differences in band positions between this study and previous studies highlighted above were expected, and could arise from several factors, such as, differences in band calibration, spectral resolution of each FTIR system used, and the composition of the ATR crystal used. Liu and collaborators proposed a second IR intensity ratio based on bands centered at 730 and 718 cm−1. 13 Since these bands fall outside the spectral window of the FPA system, this second IR intensity ratio could not be explored in this study.
Following the reported protocol, 13 a third region was used in examining IR intensity ratios. Formulas for two different IR intensity ratios were proposed. Both formulas used the intensity for band regions centered at 956 and 1034 cm−1, with third band points centered at 2190 and 1500 cm−1 for I1 and I2, respectively. The 2190 cm−1 region should serve as a baseline reference point, whereas the 1500 cm−1 band was used in the referenced study. 13 While we used one point number to identify the bands, the intensity of each point used was averaged with two adjacent points. In doing so, the equation accounts for the broader spectral range and helps reduce impact from spectral noise (Eqs. 2 and 3).


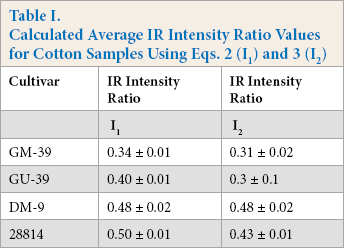
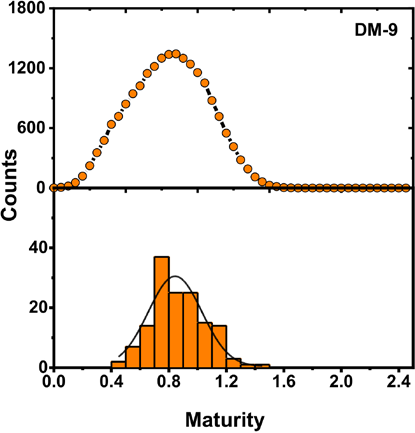
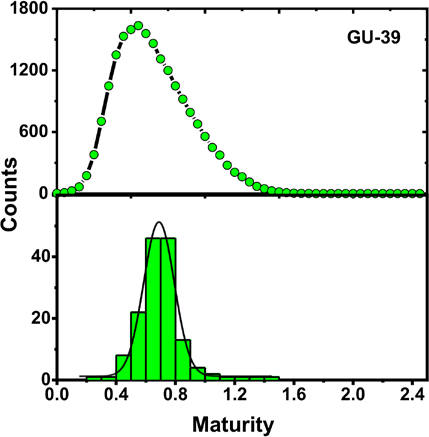
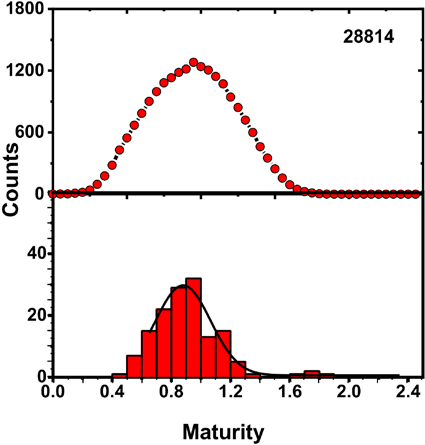
Fig. 3 shows the IR intensity ratios (I1) for four cotton fiber bundles (GM-39, GU-39, DM-9, and 28814) examined with the FPA-ATR system. The samples were selected due to their previous characterization using a Cottonscope and were acquired from AMS as Micronaire and Cottonscope standards. The samples were well blended and should be ideal in examining the capabilities of the method presented in this study. IR intensity ratios were calculated for each binned pixel in the examined spot, and each sample was examined with a minimum of four replicates. As discussed above, the spectra from binned pixels near the corner of the examination area strongly deviated from typical cotton IR spectra. As such, these abnormal points were removed from the distribution tally and other calculations presented in this study. While each distribution was somewhat limited in number (∼150 points for the four replicates); a Gaussian-type distribution was observed for all four samples. As the Cottonscope maturity for the samples increased, the calculated IR intensity ratios (I1) also increased (Table I). The I2 IR intensity ratios for GM-39, GU-39, DM-9, and 28814 were used to evaluate the use of I2. While values for I1 and I2 showed similar values and standard deviations for GM-39, DM-9, and 28814, the I2 value for GU-39 showed a disproportionately large standard deviation (Table I). There were two possible sources for the increased standard deviation for the GU-39 12 value, noise inherent to the system in the 1500 cm−1 region, or an impact from environmental gases. Determinations from the FPA system took about 6 to 8 min per sample. Changes in atmospheric moisture and CO2 might impact the intensity of the 1500 cm−1 absorbance, since water vapor absorbs near 1500 cm−1,28 In contrast, the baseline intensity for I1, 2190 cm−1, fell outside the range of prominent water vapor/ moisture bands. CO2 bands (2340 and 2360 cm−1) could impact I1 measurements. To minimize this impact, spectral baseline corrections excluded the CO2 region. Notably, these contributions from moisture and CO2 are less likely to impact IR maturity determinations with conventional ATR systems because the measurements as reported usually only take seconds and moisture or CO2 effects over baseline measurements should be minimal.
Calculated Average IR Intensity Ratio Values for Cotton Samples Using Eqs. 2 (I1) and 3 (I2)
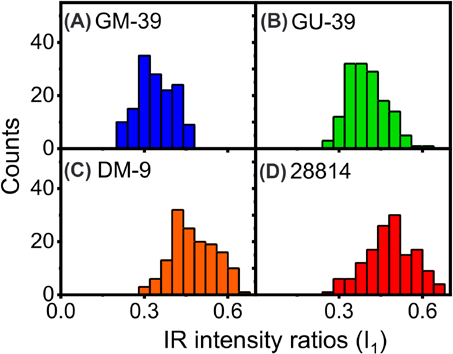
Distribution of IR maturity indices (FPA) for four cotton samples: (A) GM-39, (B) GU-39, (C) DM-9, and (D) 28814. IR intensity ratios (FPA) were calculated using Eq. 2 (I1).
Distribution of IR Intensity Ratios
The observed distribution in the IR intensity ratios requires further investigation. Is the distribution an artifact of the FPA-ATR system, an artifact associated with IR sampling, or is the observed distribution inherent to diversity in the maturity of fibers found within the fiber bundle itself? Fig. 4 shows the distribution in IR intensity ratios indices for three small bundles of GM-39 examined with a conventional ATR accessory. About 50 points per bundle were examined, with an examined area of ∼20 × 20 mm. Notably, there was a small difference in the average values between the conventional ATR and the FPA-ATR IR ratios, with the conventional ATR determinations showing overall smaller values and a smaller range of observed values. IR intensity ratios for the conventional ATR system averaged 0.277 and ranged between 0.187 and 0.329. Values observed with the FPA-ATR system averaged 0.338 and ranged between 0.191 and 0.472. The difference in the values was not entirely surprising, since as described above, several instrumental settings affected band positions. Still, it is notable that the conventional ATR system demonstrated a narrower range of values. Significantly, both methods displayed a normal distribution in values that suggests the distribution phenomenon was not an artifact unique to the FPA-ATR examinations.
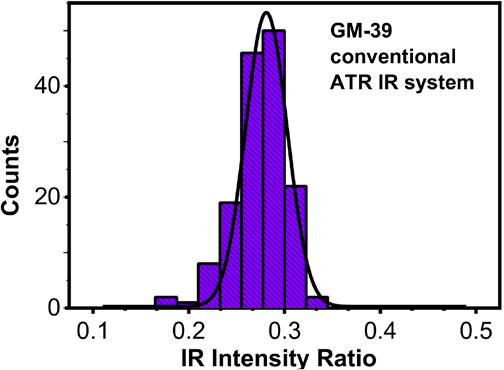
Distribution of IR intensity ratios for GM-39 obtained with a conventional ATR IR system. The histogram is shown with a representative Gaussian distribution overlay. IR indices (ATR) were calculated using Eq. 2 (I1).
IR Maturity Determinations
A formula for calculating infrared maturity values was developed for data obtained with the FPA-ATR system; the formula was adapted from the equation reported by Liu and collaborators (Eq, 4). 13

MFPA IR is the IR maturity calculated with the FPA IR data, I1 is the IR intensity ratio obtained from Eq. 2, while I1, large limit and I1, small limit represent the largest and smallest intensity ratios observed for examined samples, respectively. In the current study, these ratios were observed as 0.543 for the I1, large limit and 0.08 for I1, small limit. These values were observed from examining the 30 samples. Future studies might affect the values used in the equation. We note that in establishing I1, large limit, average I1 values of examined samples with known maturity of up to 1 were used. Thus, on occasion, individual pixels provided I1 values that exceed 0.54 (Fig. 3D). In contrast, I1, small limit was the smallest I1 value observed for an immature cotton fiber.
Table II shows the MFPA IR and Cottonscope maturity values (MCottonscope) for a series of cotton fiber varieties (GM-39, GU-39, DM-9, and 28814). Maturity values from AFIS (MAFIS) are also included in the table. We used these four varieties to examine the feasibility of using the FPA-ATR system for making fiber IR maturity determinations, displaying maturity distributions, and in creating surface plots displaying MFPA IR information. The set of samples displayed a range of MCottonscope values; 0.59 for GM-39, 0.66 for GU-39, 0.80 for DM-9, and 0.94 for 28814. These maturity values were close to those reported in a recent Cottonscope study. 7 Using Eq. 4 and FPA IR data, average MFPA IR values were determined as 0.56 for GM-39, 0.69 for GU-39, 0.86 for DM-9, and 0.91 for 28814. All four determinations showed standard deviations equal to or lower than ± 0.03. Notably, MFPA IR values for these four cotton varieties were similar in value to their respective MCottonscope values, with the largest difference between values found to be 0.06. MAFIS determinations compared well with only two of the four MFPA IR and MCottonscope determinations, with GU-39 and DM-9 values of 0.75 and 0.82, respectively. However, values for GM-39 and 28814, 0.83 and 0.82, respectively, were not comparable to the Cottonscope or ATR values obtained (Table II).
Average Maturity Values for Cotton Samples as Determined by FPA IR, Cottonscope, and AFIS 2 Instruments
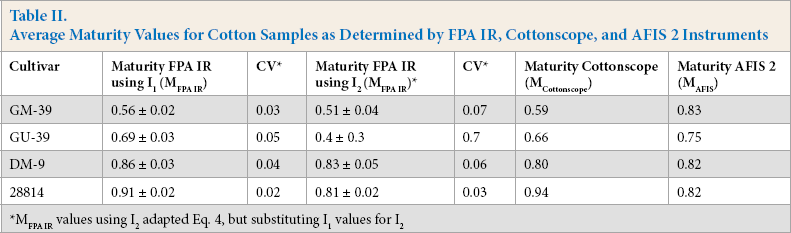
MFPA IR values using I2 adapted Eq. 4, but substituting I1 values for I2
We explored using I2 for maturity determinations. Eq. 4 was used as for the I1 maturity determinations, but instead of the intensity ratios of I1, the intensity ratios of I2 were used. The I1, large limit and I1, small limit were used (0.543 and 0.08, respectively). MFPA IR determinations using I2 for the four standards are presented in Table II. While two of the average maturity values were similar to those obtained with I1, the average maturity value for GU-39 showed a disproportionately high standard deviation (0.4 ± 0.3). This high standard deviation followed the one observed for the GM-39 I2 value. While further investigation is needed as to the use of the 1500 cm−1 band for FPA maturity determinations, given the large deviation we observed, all other FPA maturity determinations in the present study relied on I1.
The overall distribution in MFPA IR values observed for GM-39, GU-39, DM-9, and 28814 are shown in Fig. 5. As with Fig. 3, each distribution incorporated examined binned pixels from four small bundles that accounted for a total of ∼144 determinations per cotton sample. Each distribution displays a Gaussian best ft overlaid with the histogram. The ability to visualize maturity distributions of these IR determinations can give researchers a better sense of the overall makeup of their samples. For example, while GM-39 and GU-39 displayed a similar range of MFPA IR values, the peak height for GM-39 was observed at a lower portion of this range, namely between 0.4 and 0.5. Conversely, GU-39 had its largest share of maturity values between 0.6 and 0.8, and thus provided for a higher average maturity. A similar phenomenon was observed for the distribution of DM-9 and 28814; both samples displayed a similar range of maturity values, but DM-9 had its peak height in the range of 0.7 and 0.8, while 28814 had its peak between 0.9 and 1.0. Naturally, 28814 presented the higher average MFPA IR value (Table II).
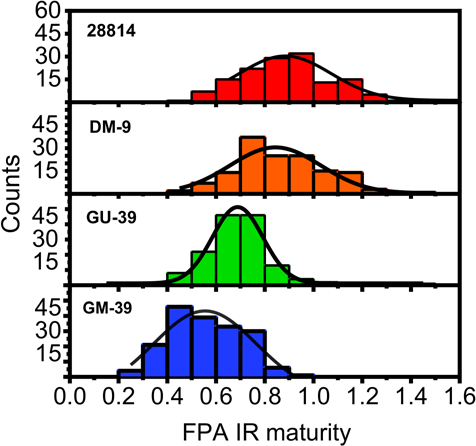
Distribution of MFPA IR values for four cotton varieties: GM-39 (blue histogram), GU-39 (green histogram), DM-9 (orange histogram), and 28814 (red histogram). Each histogram shown with a representative Gaussian distribution overlay. Each distribution collects maturity values as calculated with Eq. 4 from each binned pixel examined among four replicates of each sample for a total of about 144 points per distribution.
A comparison of the maturity distributions observed for GM-39 using the FPA-ATR system and Cottonscope instrument is displayed in Fig. 6. Both distributions appeared to follow a Gaussian distribution, with the Cottonscope distribution showing a wider range of values. The high number of sample points (>20,000 cotton fiber slices) examined with the Cottonscope likely accounted for the observed wideness of its distribution. Still, the plots suggest that the observed distributions in the MFPA IR determinations were indicative of the variability of the cotton bundles examined. Additional maturity distribution comparisons for GU-39, DP-9, and 28814 are shown in Figs. S2, S3, and S4, respectively. Similar results were observed, with the MFPA IR distributions showing a narrower distribution of values.
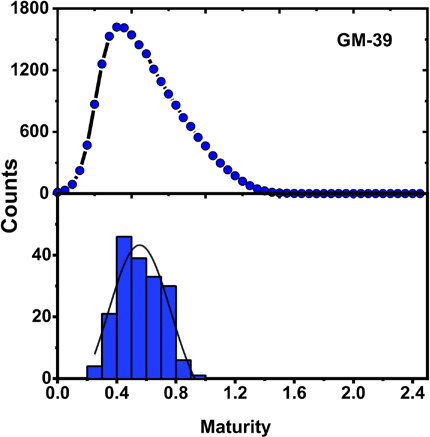
Distribution of MFPA IR for GM-39 as calculated with a FPA IR system (blue histogram, bottom) and a Cottonscope (black trace with blue circle marker, top).
(A) Representative IR spectrum of edge focal plane array binned pixels. (B) Representative display of FPA detector spatial counts by the binned pixels. The black square delimits the 36 binned pixels used in the current study for examining cotton fiber bundles and maturity distributions.
Distribution of MFPA IR for DM-9 as calculated with a FPA IR system (orange histogram, bottom) and a Cottonscope (black trace with orange circle marker, top).
Distribution of MFPA IR for GU-39 as calculated with a FPA IR system (green histogram, bottom) and a Cottonscope (black trace with green circle marker, top).
Distribution of MFPA IR for DM-9 as calculated with a FPA IR system (orange histogram, bottom) and a Cottonscope (black trace with orange circle marker, top).
Surface plots displaying MFPA IR values for single samples of GM-39, GU-39, DM-9, and 28814 are presented in Figs. 7A–D, respectively. Each plot is scaled to display maturity values from 0.2 to 1.3, with values higher than the upper scale limit displaying a strong pink/burgundy shade. In addition, orange and red tones correspond to areas with high maturity (1.0-1.29), while green and yellow shade correspond to moderate maturity values (0.65−0.95). GM-39 and GU-39 mostly displayed areas with blue and green shades, although GU-39 had small areas of yellow values. In contrast, DM-9 and 28814 contour plots showed a range of green and yellow shades, with small areas of red and pink shades. The wide range of tones observed for the samples follow the distributions observed in Fig. 5. The range of tones in the surface plots also suggested high variability in maturity values, even within a small bundle of fibers. Such variability in a small cotton bundle was not unique to the MIR FPA determinations. In all, the range in color tones for all four samples accessibly displayed the range and distribution of MIR FPA values for all four samples.
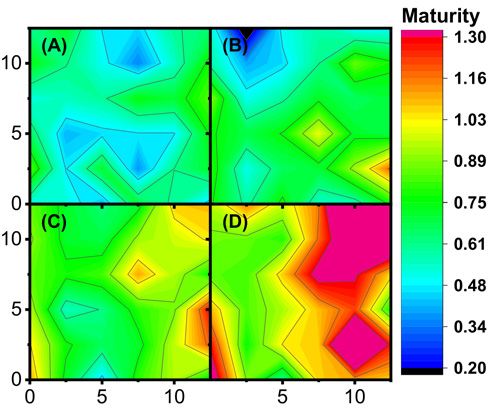
Surface contour plot for four cotton samples: (A) GM-39, (B) GU-39, (C) DM-9, and (D) 28814. The surface color of each plot indicates the observed MFPA IR as calculated with Eq. 4 and following the presented color scale.
Validation Set of FPA IR Maturity Determinations
Following our initial results with the four cotton varieties, work was expanded to make a larger set of 30 total cotton samples. While all samples were from upland cotton varieties, the additional samples were not as extensively blended as the micronaire standards used above (GM-39, GU-39, DM-9, and 28814). A plot comparing average maturity values from Cottonscope and FPA IR determinations shows strong linearity and a R2 value of 0.95 (Fig. 8). While the sample comparison was limited in size, the linear correlation suggests that the FPA IR maturity determinations were comparable to determinations obtained with a Cottonscope. The initial report detailing the use of ATR for the determination of cotton fiber maturity, 13 also demonstrated a strong linearity between the ATR determination method and the maturity reference method used in that study (image analysis) for a small sample group (R2 = 0.894 for the comparison between the ATR maturity determination and the image analysis determination; n = 50). In contrast, a plot comparing maturity determinations from AFIS and the FPA IR systems did not show a strong linear correlation (R2 = 0.45, Fig. 9). Of note, not all samples could be examined with AFIS due to sample size; hence the plot contained a limited number of points (n = 27). While the highest divergence between the AFIS and FPA IR values was observed for samples with low maturity values (<0.70), values also diverged 0.1 or more in a few of the fully developed cotton samples.
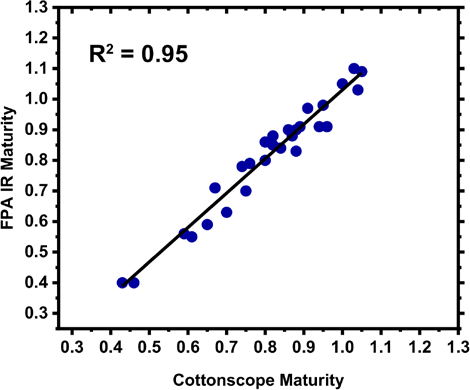
Comparison of average maturity values obtained with an FPA IR system (MFPA IR) and Cottonscope (MCottonscope) instrument.
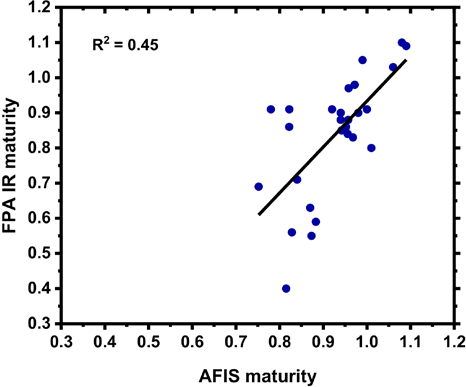
Comparison of maturity values obtained with an FPA IR system (MFPA IR) and AFIS instrument (MAFIS).
Conclusions
Recently, an IR-based method for determining cotton fiber maturity was reported. 13 The method relied on two equations; a simple three-point algorithm that tracked changes in the intensity of cotton IR bands known to change depending on the degree of secondary cell wall development of the cotton fiber sample, and a second equation that converted the algorithm into an IR maturity index.13,29 While notable in its simplicity, initial reports of the IR maturity index method did not plot maturity distributions of the examined samples. However, the method can be easily modified to make distribution determinations.
In this work, we sought to expand the use of IR maturity measurements by using an IR system capable of examining multiple sample points simultaneously. By using a modified equation 13 , 14,16-18 for determining FPA IR maturity intensity ratios and FPA IR maturity values (index), we explored cotton maturity values and maturity distributions in a series of cotton samples with a wide range of maturity values. While similar distributions could be created using a conventional ATR system, the spectra collected with the FPA ATR system can also be used to create surface plots with the spatial distribution of the sample (imaging). Histograms, distribution curves, and surface plots also provide a sense of the unevenness of fiber maturity even within a small area of a cotton fiber bundle. Validation of the FPA IR method for determining maturity with a limited sample set (n = 30) suggested a strong linear relationship between MFPA IR and MCottonscope determinations (R2 = 0.95). Individual measurements were relatively quick (each bundle can be examined in ∼6-8 min for 32 scans), required little in the way of sample preparation, and measurements did not compromise the integrity of the sample. The FPA system showed limitations, for example, low signal from binned pixels in the system limited the number of binned pixels that can be examined to 36 per run. Changes in atmospheric gases, like water vapor and CO2, can impact the FPA system, a limitation that was not observed with the conventional ATR system. Future use of similar technology would require the use of commercially-viable imaging systems.
While the examination time was comparable to studies with the AFIS fiber testing system, faster determinations would be needed to incorporate this maturity determination into high volume testing like the one provided by the High Volume Instrument (HVI) system. We note that while some cotton determinations of bulk samples tend to examine larger sample sizes than what was explored in this study, other maturity determinations (e.g., images analysis of cross sections and Cottonscope) use similar or smaller amounts of sample. The results presented in this study validated the use of IR measurement for examining cotton fiber maturity. Additionally, the results supported the use of the FPA IR system for examining and imaging maturity distributions in small cotton fiber bundles.
Footnotes
Trade names are used solely to provide specific information. Mention of a trade name does not constitute a warranty or an endorsement of the product by US Department of Agriculture to the exclusion of other products not mentioned.