
Abstract
In this study, a Fourier transform infrared (FTIR) microscope equipped with a focal plane array detector (FPA) was used for the identification of common cotton contaminants. The detector provided highly-sensitive and spatially-resolved spectra that allows sampling of microscopic samples (e.g., single fibers and small specks), and the chemical imaging of samples. Seven cases of contaminant identification were studied; in each case, examination with a FTIR spectrometer and a reflection accessory provided inconclusive determinations. Spectra of contaminants were easily obtained with the FTIR microscope. While small deviations were observed, comparison to reference spectra allowed easy contaminant identification. This proof-of-concept study indicates that the FTIR-FPA microscope was particularly useful for identifying minute contaminants. Spatial resolution of the system also allowed for the chemical imaging of samples.
Introduction
Cotton remains the most widely-used natural textile in the production of apparel and home furnishings.1,2While modern agricultural and textile machinery have simplified cotton cultivation, harvesting, and textile production,3,4 each cotton processing step has the potential of introducing contaminants to the fiber and its end products. 5 Contamination sources vary widely, but include agricultural sources from the field (e.g., fragments from the cotton seed, hull, bract, leaf, and stem) and industrial sources (e.g., plastics, synthetic fibers, oils, chemicals used in various machinery, and even processed cotton from a different production).6–9 A significant field contamination issue can drastically reduce the value of a bale of cotton, 10 in part because it can complicate subsequent processing steps and hamper the efficiency of the machinery used.11,12But even a small contaminant in a cotton fabric or end product can be financially damaging; fabrics and garments with contamination issues can be downgraded in value or outright rejected by a merchant. Identifying the types of contaminants and their sources might reduce the recurrence of downgrades.
Standard methods for identifying contamination issues in cotton lint (loose cotton) include the Shirley Analyzer 13 and the Uster HVI. 14 The Shirley Analyzer uses air to separate cotton fiber from the foreign contamination. In contrast, the Uster HVI uses image analysis to determine the area of a cotton sample that is contaminated with trash. Unfortunately, both methods face restrictions in identifying the type of contamination, are not applicable to cotton fabrics, and are better suited for classing larger contamination issues.
Recent studies have explored a variety of technologies for contaminant/trash identification in cotton by relying on imaging techniques9,15–18 or spectral examination.7,8,19,20 A number of these studies examined the use of Fourier transform infrared (FTIR) spectroscopy for contaminant identification. FTIR spectral analysis can be used to distinguish between common contaminants present in a cotton sample.7,8,10,20 The use of FTIR spectroscopy in contaminant analysis has benefited from the widespread adoption of reflection-based techniques such as attenuated total reflection (ATR). FTIR-ATR spectra are acquired rapidly, require little sample preparation, and do not consume the sample. While FTIR-ATR traditionally requires a small amount of a sample (micrograms), sampling miniscule contaminants in a cotton product (e.g., a single thread or small speck) can be challenging. For example, a typical ATR crystal is large enough to sample a small bundle of cotton fibers (> 0.05 g). While only a fraction of these fibers makes direct contact with the crystal, as long as the crystal is covered by the cotton sample, a good spectrum can be routinely acquired. In contrast, sampling a single thread or speck can result in spectra with low intensity and high interference from background noise or atmospheric bands. More selective and sensitive sampling FTIR techniques could aid in the identification of minute contaminants in cotton and its products.
FTIR microspectroscopy combines the identification capabilities of vibrational spectra with the imaging potential and spatial resolution afforded by a microscope. FTIR microscopes have been previously used for the identification of dyes and fiber types.21–24 Herein, we further explore the use of an FTIR microscope for the identification of common contaminants in cotton and its end products. Significantly, the microspectrometer used in this study is equipped with a focal plane array detector (FPA). 25 This detector provides vibrational spectra with high spatial resolution, which facilitates examining microscopic samples. The microspectrometer setup used in this study is also very fast, capable of simultaneously acquiring thousands of spectra in as little as eight minutes. This study was designed to highlights the use of a FTIR-FPA microscope in imaging and identifying small contaminants isolated from a cotton bundle or fabric. The test cases presented in this study were also examined by FTIR-ATR, but that technique did not provide conclusive contaminant identification.
Experimental
Contaminant Location and Isolation
Samples were sourced from cotton fabric, bundles, and botanical trash samples submitted to the US Department of Agriculture-Agricultural Research Service-Southern Regional Research Center (USDA-ARS-SRRC) for contaminant identification. Possible contamination sources were visually identified by observation with a standard optical microscope or in a Spectroline CL-150 UV lamp cabinet (Spectronics Corporation). The identified contaminants were manually isolated, as needed, with standard laboratory tweezers.
FTIR-FPA Analysis
Cotton samples and isolated contaminants were examined with a Hyperion 3000 FTIR microscope (Bruker Optics) equipped with an FPA detector and a Sony ExwaveHAD color video camera. Samples were individually placed either on a metal plate with a small opening or atop a disposable NaCl IR sample card (International Crystal Laboratories). FTIR microscope data was collected in the transmission mode. Sample scans ranged between 64 and 128 scans, and were measured with a resolution of 8 cm–1 (3800–900 cm–1). The resulting spectra were corrected against an air background. Each study examined a 340 × 340 μm sampling window. Spectra for each sample were corrected for atmospheric CO2 and baseline using OPUS spectroscopy software (version 6.5). Additional spectral manipulation was kept to a minimum. Tree- dimensional data analysis was performed with the 3D OPUS software package. Single spectra were exported to Microsoft Excel and plotted with IGOR Pro (version 6.2, Wavemetrics). Spectral library searches were performed with the OPUS program and the standard library provided by the manufacturer.
Macro sampling of fibers was performed with a Vertex 70 (Bruker Optics) equipped with an ATR sampling accessory (Pike Technologies) with a diamond-ZnSe reflective crystal. Samples were placed on top of the ATR crystal and secured with a metal clamp. A total of 64 scans were measured for each sample point with a resolution of 4 cm–1 (3800-900 cm–1). Spectra were presented without ATR correction or atmospheric compensation.
Results and Discussion
Blue Cellulose Fiber Contaminant in a White Cotton Fabric
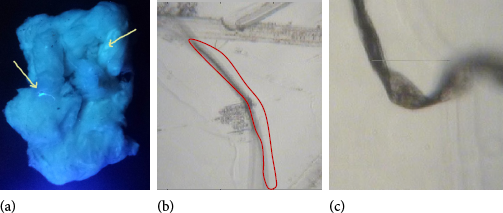
Fig. 1a shows the optical image of a dark blue contaminant found in a white cotton fabric. The dark blue contaminant was examined with the bright light setting of the FTIR microscope. The contaminant appeared as a single, evenly-dyed (blue) fiber entangled in the cotton fabric weaves.
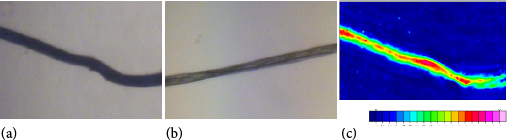
Optical image (20×) of (a) isolated blue contaminant, (b) cotton fiber isolated from the fabric as observed with a brighFtigfuereld1. microscope, and (c) FTIR microscope chemical image of the isolated blue contaminant. Red areas are those that showed intense cotton vibrational bands, while blue correspond to low intensity areas.
The contaminant was manually removed and further examined with the FTIR microscope (Fig. 2; lower trace). An average spectrum from various points along the contaminant closely matched a spectrum of a single thread extracted from the white portion of the cotton fabric (image shown in Fig. 1b; spectrum shown in Fig. 2, top trace). Both spectra displayed the typical vibrational bands observed in cotton and other cellulose-based fibers; a broad O-H band, O-H region (3600–3000 cm–1), the C-H region (3000–2700 cm–1), and part of the fingerprint region that typically showcases O-H and C-H bending modes (1500 and 1150 cm–1). A spectral library search also provided a match for cotton.
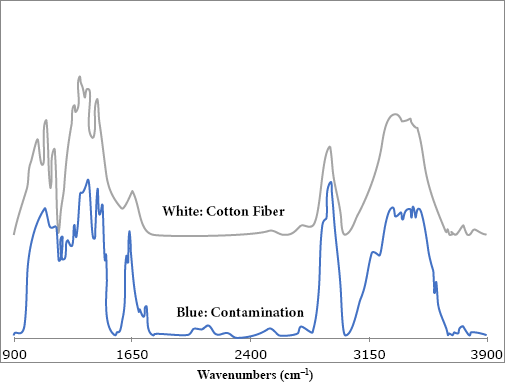
FTIR microscope spectra of a blue contaminant (fiber; lower spectrum) and a white cotton fiber (top spectrum).
Given the even blue color of the contaminant, it appeared
A chemical image of the blue, cellulose-based fiber is also shown in Fig. 1c. To obtain this image, the collected spectra were integrated to a key cotton vibrational band, the intense peak near 1053 cm−1. Areas that appear red indicated strong absorption, while yellow and blue areas corresponded to areas with moderate and low absorption, respectively. The areas of moderate and high absorption closely corresponded to the areas where the blue contaminant (fiber) was observed, thus confirming the contaminant as a cellulosic fiber.
Polyester Contaminant in a Cotton Fabric
A cotton fabric with a synthetic fiber contaminant was also examined. Fig. 3a shows the optical image of an isolated fiber thread taken from a cotton fabric. The isolated thread was evenly red and appeared noticeably glossier than the white threads in the cotton fabric. The isolated contaminant was examined with the bench-top FTIR-ATR. The resulting spectra (Fig. 4) showed a complex collection of bands, including O-H stretching bands (3600-3000 cm1) and other bands usually associated with synthetic fibers (O-H and C-H bending modes near 1500 and 1150 cm−1).
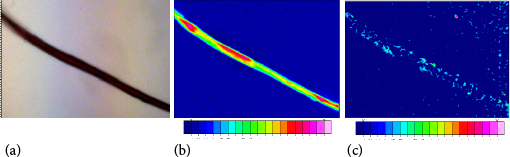
(a) Optical image (20X) of an isolated red contaminant (fiber) as observed with a bright field microscope. FTIR microscope chemical image of the isolated red contaminant showing the integration of (b) the 1728 cm–1 peak associated with polyethylene terephthalate, and (c) an O-H band centered at 3200 cm–1. In both cases, red shading represents areas with high integration, blue represents low integration.
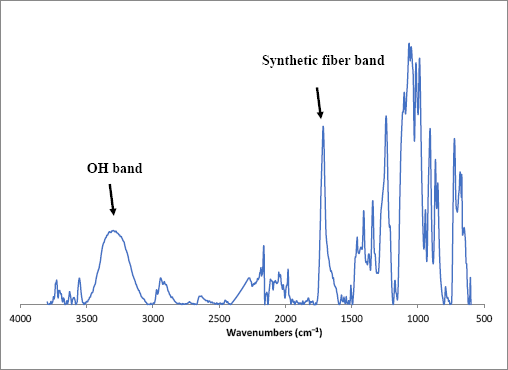
FTIR-ATR spectrum of a red contaminant (fiber) isolated from a white cotton fabric. The spectrum exhibits an O-H band and peaks typical of synthetic fibers. Further exploration was performed with the FTIR microscope.
At this point of the examination, it was unclear if the impurity was some sort of copolymer or if a small amount of the cotton fabric was sampled along with the impurity during the ATR experiment. To further clarify the identity of the contaminant, the sample was further examined with the FTIR microscope. An average spectrum from various points along the contaminant is shown in Fig. 5; it closely matches reference spectra of polyethylene terephthalate, a common polyester textile fiber. A spectral library search also resulted in a match with polyethylene terephthalate. As with the previous example, a red-dyed processed fiber could have been introduced at any point prior to the weaving of the cotton fabric.
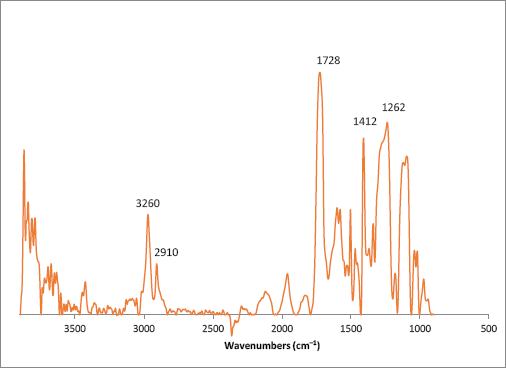
FTIR microscope spectrum of a red contaminant (fiber) isolated from a white cotton fabric. Indicated wavenumbers correspond to key polyethylene terephthalate vibrational bands.
Chemical images of the red fiber are shown in Figs. 3b and c. To obtain these images, the collected spectra were integrated based on the 1728 cm 1 band associated with polyethylene terephthalate (Fig. 3b) and a typical O-H band (area centered around 3200 cm−1; Fig. 3c). Areas of moderate and high polyester integration closely corresponded to the areas where the red fiber was observed. Notably, no strong O-H bands were observed in the sample (Fig. 3c). These findings clarify that the red contaminant was not a copolymer, but that the O-H band observed in the ATR spectrum (Fig. 4) likely arose from a co-sampled cotton fiber or even contamination.
Polypropylene Contaminant in a Cotton Fabric
Plastic bags and tarps used in the field or mills can often become a source of contamination. Here we highlight one such example. A blue contaminant embedded in a white cotton fabric was photographed with the FTIR microscope in its bright light mode (Fig. 6). The contaminant was much wider than other fibers we examined. It did not appear to be a synthetic or natural fiber. Examination of the contaminant while in the fabric with an FTIR-ATR only showed spectral bands common to cotton fabrics. The contaminant was then manually removed. Examination with the FTIR microscope provided a spectrum that closely matched a reference spectrum of polypropylene (Fig. 7). Taken together, our results suggest that the contaminant came from a blue polypropylene bag or tarp.
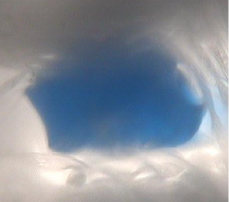
Optical image (20×) of a blue contaminant (plastic) embedded in a cotton fabric as observed with a bright field microscope.
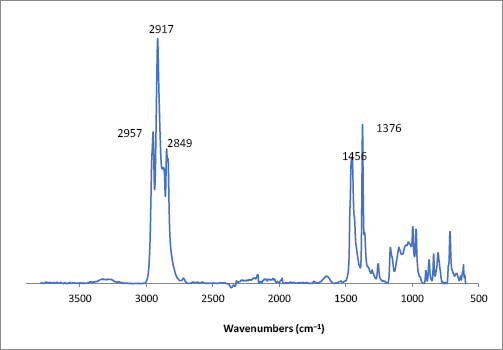
FTIR microscope spectrum of a blue contaminant isolated from a white cotton fabric. Indicated wavenumbers correspond to key polypropylene vibrational bands.
Fluorescent Contaminants in Loose, Unprocessed Cotton
A large cotton bundle with various fluorescent contaminant spots was also examined (Fig. 8a). Our examination revealed that various types of contaminants produced the observed fluorescence. While various contaminants were identified using standard FTIR techniques, a number of small fluorescent specks observed throughout the bundle were difficult to identify. Examination of two of these small specks using FTIR-ATR did not provide spectra with distinguishable bands or features.
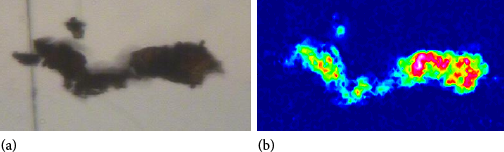
(a) Optical image of a cotton bundle under UV light displaying various fluorescent contamination spots. Two contaminants, (b) and (c), isolated from the bundle were placed on a NaCl plate and examined with the bright field microscope.
The specks were then placed on NaCl plates for FTIR microscope examination. At 20× magnification, the specks appeared to be very small portions of a fiber, much smaller portions than the ones reported elsewhere in this study (Figs. 8b and c). Average spectra from various points along each speck are shown in Figs. 9 and 10, and while distorted, both spectra exhibit bands that match reference spectra of polyethylene terephthalate. Given their size and composition, this contaminant appears to have been added to the cotton bundles during ginning.
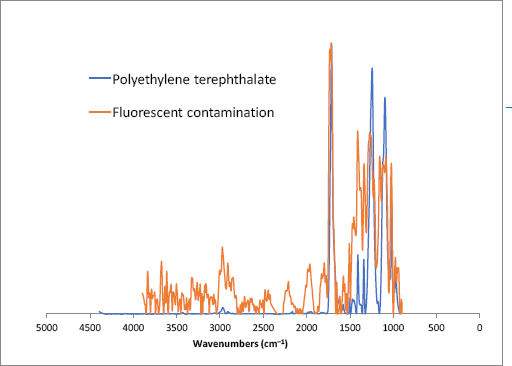
FTIR microscope spectra of a fluorescent contaminant isolated (see Fig. 8b) from a cotton bundle (red trace) and polyethylene terephthalate fiber.
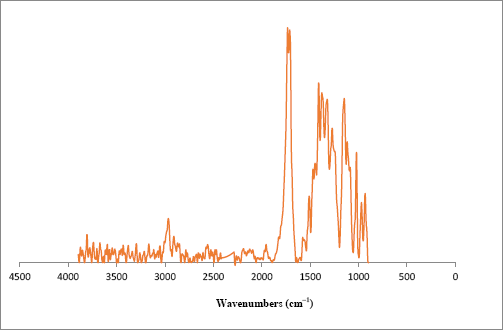
FTIR microscope spectrum of a fluorescent contaminant isolated (see Fig. 8c) from a cotton bundle.
Pepper-Sized Botanical Contaminants
Fig. 11a shows the optical image of a cotton seed coat fragment found as rotor dust in an industrial gin. Rotor dust results from the processing of cotton with trash contamination. Common rotor dust botanical contaminants include cotton seed coat fragments, leaf, stem, and hull. At times, dust particles can contaminate the cotton product. Identifying the source of the contamination can help identify the stage where the contaminant was incorporated into a cotton product (e.g., field, ginning, or processing).
Optical image (20×) of (a) isolated cotton seed fragment contaminant and (b) chemical image of the contaminant. Red areas are those that showed intense cotton seed vibrational bands, while blue corresponded to low intensity areas.
Given their reduced size, small samples of these contaminants can be difficult to identify using a benchtop ATR unit. Indeed, the rotor dust appeared very minute when observed with an optical microscope.
The dust contaminant was isolated and further examined with the FTIR microscope; its chemical image is presented in Fig. 11b. To prepare this image, spectra were integrated to the dominant band observed near 1060 cm–1. The intense red and yellow colors correspond to areas where the cotton seed dust was observed. An average spectrum from various points along the cotton seed dust contained spectral bands typically observed in cellulose-containing materials, however some distortions were observed (Fig. 12). In contrast, a spectrum of the isolated dust obtained with a bench top ATR unit was inconclusive (not shown). Still, a spectral library search also provided a match for cotton seed coat fragment. This result is not surprising since the spectral bands of cotton seed fragments are very similar to those of cotton fibers.
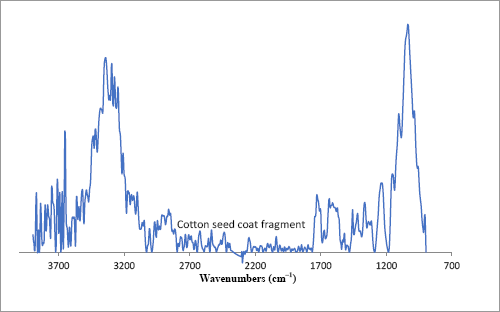
FTIR microscope spectra of a cotton seed coat fragment.
A similar study was performed on a cotton leaf trash sample. An optical image of the leaf trash sample is shown in Fig. 13a. Isolated leaf trash samples were very small and a study in a benchtop ATR was not attempted. Spectra were integrated to the bands in the C-O bending region and the resulting chemical image is shown in Fig. 13b. Isolated spectra showed bands associated with cellulose-containing products (Fig. 14). As before, a search of a spectral library matched spectra for leaf samples and cotton fibers. Another limitation of the system regards the size and thickness of the sample; since these experiments are performed in transmission mode, only small trash samples can be studied. Future studies will examine imaging protocols that rely on IR reflection accessories.
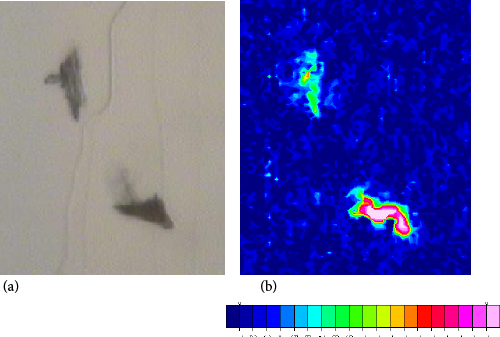
Optical image (20×) of (a) cotton leaf fragments and (b) chemical image of the contaminant. Red areas are those that showed intense cotton seed vibrational bands, while blue corresponded to low intensity areas.
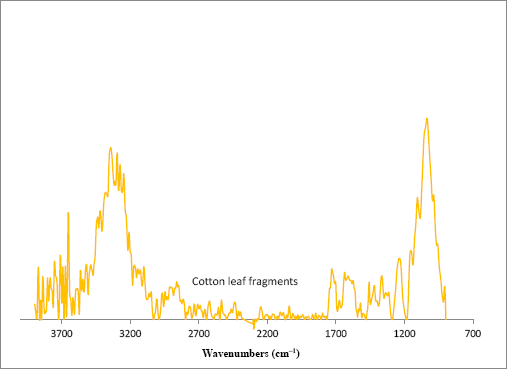
FTIR microscope spectra of cotton leaf fragments.
Conclusions
This study highlighted the use of a FTIR microspectrometer equipped with a high resolution FPA detector for the identification of microscopic contaminants in cotton fabrics or bundles, and in the identification of cotton botanical trash. The study emphasizes how microspectrometry with a FPA detector can be used in cases where contaminant identification would be difficult with more routine methods like FTIR-ATR. The FTIR microscope system is also capable of producing chemical images of the samples. These images can be effectively acquired in less than 10 minutes per sample, in part due to the high spectral resolution afforded by the FPA detector used. Hence, the system described herein seems particularly useful with minute samples, single fiber threads or specks, or when spatial resolution is needed to make a conclusive identification.
Footnotes
Acknowledgements
The authors thank Monica Concha of USDA-ARS-SRRC for her assistance in this project, and H. N. Cheng, Chris Mattison, and Krystal Fontenot for their suggestions on the manuscript. Partial funding for this research project was provided by Cotton Incorporated.