
Abstract
By extrapolating (exponential) plots of ammonium ion depletion rates (ADR) vs. water flow rate curves to the zero water flow rate, a new parameter called the intrinsic ammonia depletion rate (ADR(i)) has been defined. This parameter is helpful in understanding the ammonia/water bioremediation process. ADR(i), representing the ammonium ion depletion rate for bio-media under quiescent, equilibrium ammonia/water conditions, should be an inherent property of the bio-media material itself, and can serve as an ADR effectiveness rating index for various bio-media. In the reported work, flocked bio-media were shown to exhibit overall higher ADR(i) values than non-flocked media. The bio-reaction's physical (hydrodynamic) process mechanism appears to be different for non-flocked and flocked media classifications. A short term “live fish” aquaculture field trial was also carried out.
Introduction
Previous research has shown that textile flocked surfaces produce very effective bio-filter media materials for the bioremediation of ammonia-contaminated water.1–3 The bio-conversion bacterial species used in these studies were Nitrosomas and Nitrobacter bacteria. It was observed that the ammonia depletion rates (ADR) for various commercial and experimental bio-media materials were experimentally determined from the slope of least squares lines formed when ammonia concentration was plotted against elapsed time (days). This linearity signified that the kinetics of the ammonium ion (in water) bioremediation reaction was of zero order; the measured biochemical reaction rate was independent of ammonium ion concentration. Overall, ADR values of the various bio-media materials 1) decreased as the flow rate of ammonia-contaminated water through the bio-media increased, and 2) increased as the bulk surface area/ volume of the bio-media increased. The present work analyzed these previous data in terms of the physical and mechanistic aspects of the ammonia/water biore-mediation process. The goal of this extended work was to analyze the generated experimental data in terms of developing new parameters that might be more indicative of flocked bio-media material performance. The trickling bio-flter's operational process was also probed. Overall, these experimental bioremediation studies were carried out to gain more insight into the operational ammonia-in-water bio-media related processes in re-circulating aquaculture systems (RAS).
Experimental
The bioconversion measurements test apparatus and data collection procedures were reported in Part I of this series. 1 Highlights of the experimental study results of Part I are summarized in Table IV of reference 1 and are not reproduced here. In the Part I paper, 1 ammonia depletion rate (ADR) values for the various commercial and experimental (flocked) bio-media were presented at 1.9, 5.7, 9.5, and 13.3 L/min ammonia-containing water flowrates. 4
Results and Discussion
ADR and Water Flow Rate
Comparing all the Part I, Table IV ADR data 1 shows that the bio-film coated double-side flocked nonwoven (DSFN) medium produced the highest measured ADR values. DSFN was found to be superior to the various commercial bio-media materials tested. Furthermore, the Part I, Table IV data also show that ADR values generally increased as the bulk surface area of the bio-media increased.
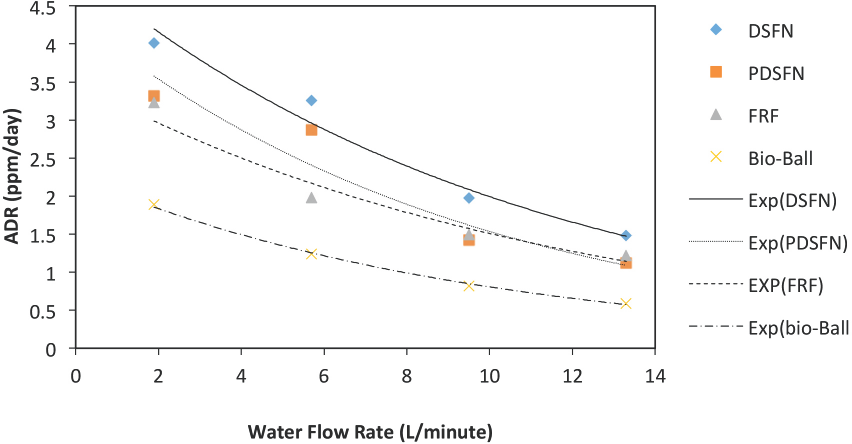
To further analyze these water flow rate data, Figs. 1 and 2 are plots of ADR vs. water flow rates. Examining these figures shows a clear downward trend in ADR values as the water flow-rate increases. However, the trend is not linear. After carrying out several curve-fitting trials, the ADR vs. water flow rate data in Figs. 1 and 2 were found to be best ft by the exponential function in Eq. 1.
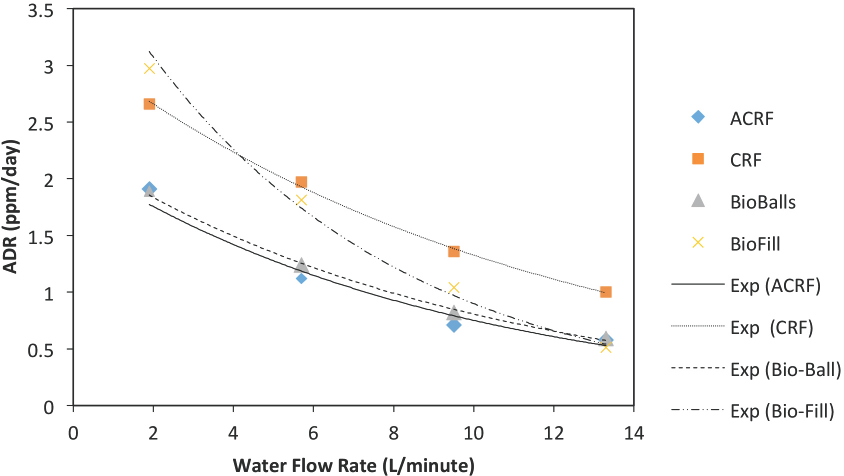
Plot of experimental ADR data (Table IV, Part I) to exponential function (Eq. 1) indicating apparent merging of ADR values at higher water flow rates for commercially-available bio-media.

α and β are numerical constants and Wf is the water flow rate. A summary of the various exponential equations developed from this empirical model is presented in Table I. From the R 2 values obtained, the empirical model can explain 93.5% to 99.8% of ADR by water flow rate. This review of water flow-rate data has led to the creation of a new bio-filter media material evaluation parameter, intrinsic ADR.
Fit of Experimental ADR Data to the Exponential Function, Eq. 1.
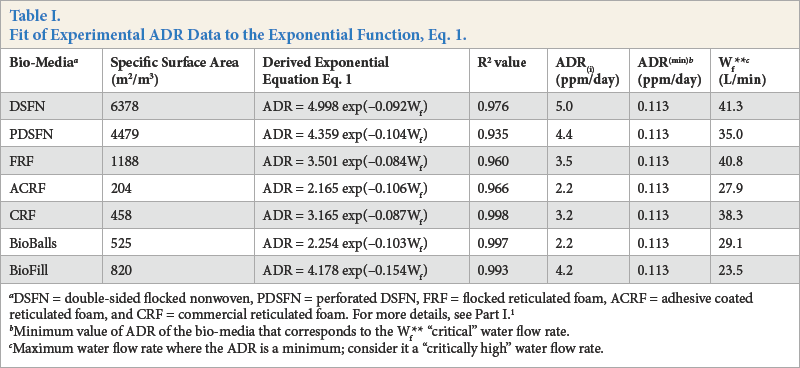
DSFN = double-sided flocked nonwoven, PDSFN = perforated DSFN, FRF = flocked reticulated foam, ACRF = adhesive coated reticulated foam, and CRF = commercial reticulated foam. For more details, see Part I. 1
Minimum value of ADR of the bio-media that corresponds to the Wf** “critical” water flow rate.
Maximum water flow rate where the ADR is a minimum; consider it a “critically high” water flow rate.
Intrinsic ADR Parameter
Interpreting Figs. 1 and 2 data in terms of Eq. 1, it was found that by setting Wf to a hypothetical zero flow rate, a new parameter denoted as the “intrinsic” value for the ammonia depletion rate could be established. This new parameter has been called the intrinsic ammonia depletion rate (ADR(i)); it is the α term in Eq. 1 when Wf equals zero. This intrinsic parameter can be regarded as the ADR value for a particular bio-media material when the flow of ammonia containing water past the bio-media has stopped. It represents the ADR of the bio-media in a non-flowing ammonia/water contact, quiescent equilibrium state. Determined ADR(i) values are summarized in Table I. Notably, among the bio-media materials studied, the heavily flocked DSFN experimental bio-media had the highest ADR(i) value. One would expect that this ADR(i) parameter could be used as a useful bio-media effectiveness rating parameter. Specifically, this ADR(i) parameter could be established as a means of rating various media materials in terms of how well they serve as bacterial support media in the ammonia/water bioremediation processes.
Bioconversion Behavior at High Water Flow Rates
All ADR values for all the bio-media studied appeared to be merging at some higher water flow rate (Figs. 1 and 2). This merge point does not seem to be at zero ADR. By differen-tiating Eq. 1, we can determine at which water flow rate the change in ADR value equals zero; this is the minimum in the ADR vs flow rate curve. By doing this, one can determine the mathematical merging point from these various ADR vs. water flow rate curves. Here a minimum ADR value, ADR(amin), and a maximum water flow rate value, Wf**, can be calculated. Choosing the Bio-Ball media as the “standard” and assuming in Eq. 1 that this “standard” media reaches its ADR(min) at a flow rate of (3/b), at which ADR reaches a value 5% above the terminal value. We can now fix the condition that for all media studied, this ADR(min) = 2.25 × exp (–3) = 0.113 ppm/ day is reached at Wf**. As noted in Table I, the Wf** for the various bio-media tested are different. This suggests that the associated bio-conversion process is different for the various media at lower water flow rates and at higher water flow rates. Table I shows that for the most part, the ADR values for the flocked bio-media level of at higher water flow rates than the non-focked media.
From this observation, it appears that bio-media material properties were more important determinants of a bio-media's ADR performance at lower water flow rates than they were at higher water flow rates. To explain, let's first assume that there are two forces at work in the described ammonia/water bio-remediation reaction: 1) the surface chemical attraction of the ammonium ion for a biochemical (bio-film) reaction site, and 2) the hydrodynamic force of the water pushing and pulling the adsorbed ammonium ion of the biochemical (bio-film) reaction site. These two opposing forces are always operating at bio-film surfaces in a trickling bio-filter system. One can then conclude that the only force that changes with water flow rate would be the hydrodynamic force; this push/pulling away force at the ammonium ion's reaction site would naturally be higher at higher water flow rates. Alternatively, at lower water flow rates, the hydrodynamic pull-away force would be low allowing the biomass/ammonia-water bio-reaction to proceed in more of a reversible or equilibrium bio-mass oriented surface reaction. When ammonium ion/water does not flow past the bio-media, as is the case for the extrapolated ADR(i) condition, a true equilibrium reaction condition can occur.
From the above analysis, we find from the Wf** data in Table II that the minimum ADR was fixed at 0.113 ppm/day and was assumed to be the same for all the various media tested. For the ADR(min) to be non-zero, another (non-bio-filter origin) ADR biochemical process must be operating at this Wf** condition. To explain, let us deduce that in trickling bio-filter operations, the ammonia nitrification bio-reaction process can occur at three possible locations: 1) within the bio-film attached to the media chamber's bio-media surface—the “primary” bio-reaction site, 2) on/within the bio-film that has grown on surfaces of the piping, instrumentation, and water holding tank walls of the test apparatus, and 3) on the loose bio-film or bacteria contained on the colloidal particles suspended in the tank water. If these three areas of bio-reaction surfaces exist, we can conclude that the ADR at the Wf** value should not be zero. The ADR should minimize at a reaction rate dictated by the non-bio-filter surface factors such as apparatus geometry and the system water volume itself. It can be concluded then, at lower water flow rates, the predominant reaction mechanism is the one that occurs on/in the bio-mass supported bio-media contained in the system's bio-media chamber. Logically then, the influence of the bio-media reaction site diminishes in importance as the water flow rate increases. Bio-conversion reactions occurring outside the media chamber should remain constant and independent of water flow rate. From this, one would expect that all ADR(min) values should depend upon the geometric size of and the total water volume contained in the trickling bio-filter apparatus/system.
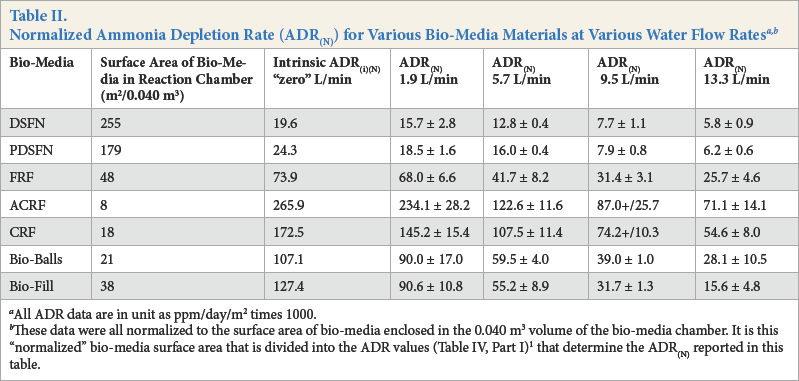
All ADR data are in unit as ppm/day/m2 times 1000.
These data were all normalized to the surface area of bio-media enclosed in the 0.040 m3 volume of the bio-media chamber. It is this “normalized” bio-media surface area that is divided into the ADR values (Table IV, Part I) 1 that determine the ADR(N) reported in this table.
Trends in ADR and Bulk Surface Area Behavior
ADR/Surface Area and Water Flow Rates
An attempt was made to analyze ADR data in terms of the overall surface area of the bio-media configurations presented in Table I. To uncover any possible relationships, ADR data (including ADR(i) values) vs. the bulk surface area of the media were plotted in Fig. 3 against the estimated bulk surface area. Here, the x-axis represents the surface areas cited in Table I for the various bio-media. This reported surface area is the amount of surface area normalized to one cubic meter of bulk bio-media. The y-axis in Fig. 3 is the ADR value at the various water flow rates, Wf, including the ADR(i) values (Table II). Overall, the bio-media's ADR behavior followed the expected trend that ADR values increase with an increase in bulk surface area. However, Fig. 3 indicates that this bio-media surface area effect was not linear; the data follow more of a logarithmic trend. However, it is obvious that ADR values depend on how much surface bio-film area a bio-media material is capable of supporting. In reality, however, one must also consider how much of the bio-media's (bio-film) surface area is accessible for bio-reaction. This suggests that the pore shape, position, and flexibility of the flock fiber in these flocked media may be important issues in bio-media design.
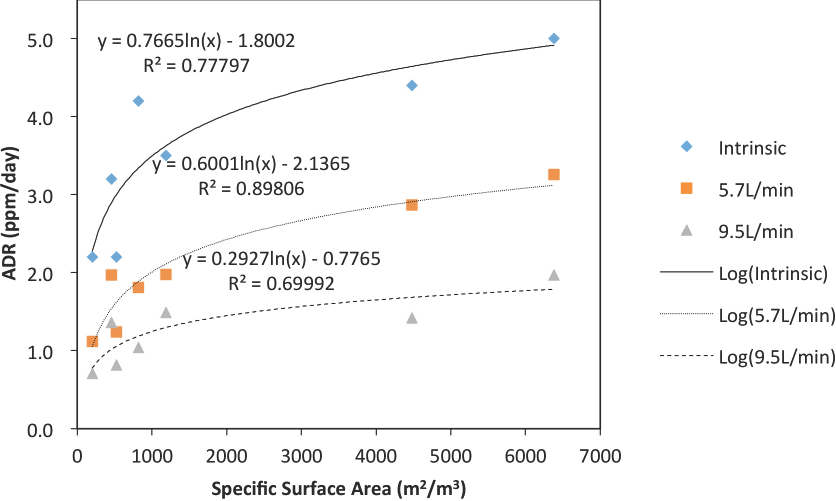
Ammonium depletion rate vs. specific (bulk) surface area. Refer to Table I.
One would surmise that there would be distinct differences in the process of flowing water past a DSFN flocked surface compared to a FRF (flocked foam) surface. One would expect the motion, mobility, and accessibility of the flock fibers to flowing water would be different for these two very different (flocked) bio-media. For the FRF media, one would expect that the flock fibers would move and perhaps bend in the direction of flow. Compared to DSFN flocked surfaces, the individual motion of each individual flock fiber in FRF media should be better for circulating the ammonia-bearing water in the vicinity of the flock fiber's bio-film coated surface. This flock fiber motion should help in increasing the ADR efficiency of these bio-media materials. Alternatively, while DSFN bio-media had a high surface area, the flock fibers creating high surface area were in tight proximity. It appears that, because of their close-packed geometry, all surface area of the DSFN bio-media's individual flock fibers would not be readily available for immediate and in open-equilibrium contact with the flowing ammonium ion-containing water. This would be especially true at higher water flow rates. Of interest, the data in Fig. 3 suggests that if one applied more flock fibers to the R-9 reticulated foam base support material, its bulk surface area would increase, thereby increasing its surface area much above its present value of 1088 m2/m3. It is predicted that adding more flock to an FRF type bio-media configuration would create a bio-media material having a much higher (perhaps optimized) ADR. Flocked reticulated foam may lead to the development of a superior, optimized bio-media material.
Normalizing ADR Values in Terms of Effective
Surface Areas
Tables I and II results were further analyzed by normalizing the ADR values in terms of the total bio-media surface area that is contained in the media containment chamber of the trickling bio-filter test apparatus. The normalized ammonia depletion rate or ADR(N) was calculated by dividing the ADR values by the bulk surface area (m2) of the respective bio-media materials contained in the 40-L experimental system's bio-media chamber. This, of course, represents the direct amount of bio-media surface area responsible for the experimentally-measured and reported ADR values.
Table II summarizes these bio-media-in-chamber surface areas and the calculated ADR(N) values for the various bio-media studied. These ADR(N) vs. specific surface area data are plotted in Fig. 4. Here we find that the lower the (bulk) surface area of the particular bio-media material, the higher the ADR(N) value. These data show that the bio-surface bio-conversion efficiency of the media was much higher for low-surface area bio-media than for high-surface area bio-media.
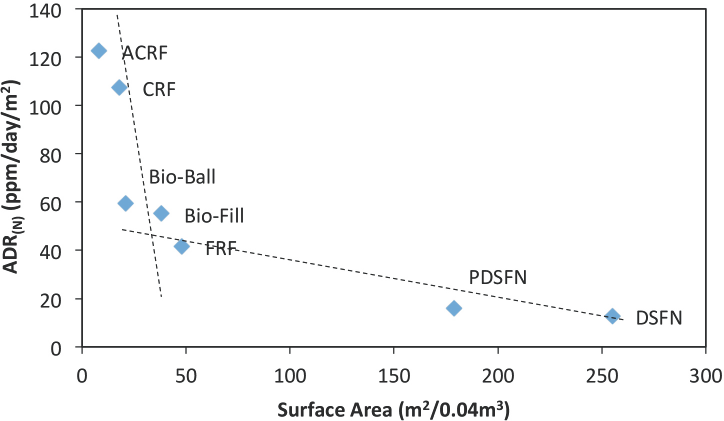
Specific ADR vs. specific surface area for various bio-media at 5.7 L/min.
Fig. 4 also shows that two different bio-reaction mechanisms seem to be operating: Mechanism 1-between above zero and 1500 m2/m3 bulk surface area (non-flocked bio-media) and Mechanism 2-above 1500 to 2000 m2/m3 bio-media surface area (flocked bio-media). This grouping fits with the two groupings that were observed for the Wf** values discussed earlier (Table I). This indicates that the bio-media material itself, the material's surface geometry, available ammonium concentration, and the media's available (effective) surface area were some major factors determining a media's ADR value.
A bio-media's material and geometric surface structure are important parameters in bio-media function. However, bio-film formation on the bio-media surfaces was not completed during the 2-3 weeks of exposure to the bio-remediation process. For example, only ∼30% of DSFN's available surface was covered with Nitrosomas/Nitrobacter thin non-continuous bio-films during this trial time period (2-3 weeks). We do not have long term data (over years) at this time, which may yield different outcomes. Bio-media types do not all possess the same bioremediation effective-ness; the choice of bio-media is an important factor in operating an efficient trickling bio-filter system, at least within the time frame studied.
Live Fish Aquaculture Environment Testing
A concluding study was carried out that addressed the question “How would flocked bio-media perform in a 'real world’ aquaculture tank system environment?” To this end, a trial project was carried out at the New Bedford (MA, USA) Vocational Technical High School's (GNBVTHS) Aquaculture Training facility. This GNBVTHS academic facility has been operational since 1996 and is a well-established center for aquaculture knowledge, technology, and training. DSFN bio-media was evaluated by the GNBVTHS group. The project's goal was to grow Blue Tilapia (Orechromis aureus) from “seedlings” in a laboratory scale, 1892-L (500-gal) fish holding tank system. Here, DSFN bio-media was used to bioremediate ammonia in the recirculating aquaculture water system. Troughout this field trial, with the exception of DSFN bio-media, all other standard aquaculture equipment and standard fish growing procedures with respect to trickling bio-filter aquaculture systems were followed by the GNBVTHS team.
In the project's implementation, water from the 1892-L fish holding tank system was continuously recirculated through a 66.2-L (17.5-gal) bio-media-holding chamber containing 3.3-L (0.87 gallons) of DSFN bio-media. This bio-media was configured by loosely rolling up upon itself a 0.91 × 7.3 m continuous sheet of DSFN bio-media. A total of 6.6 m2 of bulk DSFN bio-media resulted, representing a total of 13.3 m2 (142.8 ft 2 ) of bio-converting, two-side flocked media (areal) surface. This coil of media was then placed in the cylindrical 66.2-L bio-media containment tank through which the system's fish-tank water was continuously circulated. Troughout the run, the recirculating water flow rate was 3.8 to 9.1 L/min. The water temperature was maintained at 21.5 ± 1.5 °C, with the pH held between 6.5 and 7. An aquarium-type aerator was fitted to bubble air through the tank water to keep oxygen at the saturation level throughout the system's operation. No extra organic carbon nutrient was added to the system, since Nitrosomas/Nitrobacter are autotropic species. Overall, the DSFN bio-media was calculated to keep the ammonia concentration in the system below 2.0 ppm.
This live fish aquaculture run was followed for about seven months. Troughout this time, the flocked bio-media was found to maintain the tank's ammonia concentration steady from 0.0 to 0.2 ppm; the nitrite concentration was also held to a 0.0 to 0.05 ppm concentration.
During this run, at one time, the bio-media tank and media had become congested with operational debris. The roll of bio-media was quickly removed from its chamber, hosed down with a spray of water, and returned to the chamber with no complications. This demonstrated that DSFN bio-media can be easily and effectively rejuvenated and re-used. In many typical trickling bio-filter RAC practices, plastic shell-shaped plastic spheres (like BioBalls) are used as the bio-media. It is much easier to decontaminate or otherwise successfully rejuvenate a sheet of DSFN-type media than it is to clean/treat a mass-volume batch of individual, small convoluted plastic-shape type media. Overall, during the seven-month GNBVTHS trial run, the fish product appeared healthy, un-stressed, and were observed to be maturing at a normal constant rate. This short-term study suggests that DSFN flocked bio-media material should function well in a real world aquaculture application.
Conclusions
The intent of this reported research was to provide insight into what bio-media related factors are important in the bioremediation of ammonia from water in trickling bio-filter systems as encountered in aquaculture. Published experimental data have been analyzed resulting in the development of a better means of determining a bio-media's effectiveness in the bio-remediation ammonia from water.
Changes in water flow rates and ADR were found to follow a simple exponential equation given by Eq. 1. Using this equation, the ADR data were extrapolated to zero Wf, where an ADR value extrapolated to the zero water recirculation rate was obtained; this new ADR value has been called the intrinsic ADR or ADR(i). This new parameter is representative of a bacteria-inoculated bio-media's inherent ability to bio-react with the ammonia-contaminated water. This parameter should serve as a semi-analytical index for rating the bio-conversion effectiveness of various bio-media. From this ADR(i) rating scheme, it is concluded that flocked bio-media were among the most effective of ammonia bio-converting bio-media materials.
It was observed that ADR values for all media types decreased as the water flow rate increased. It was further shown that these ADR values tended to merge at high water flow rates. Fitting these data to the previously mentioned exponential equation resulted in the establishment of a critical water flow rate, Wf** value for each media material. These Wf** values were generally higher for the flocked bio-media than for the non-flocked media. This showed that flocked bio-media had a greater propensity to function at higher water flow rates than non-flocked bio-media.
A data analysis scheme comparing a normalized ADR vs. bulk surface area of the bio-media was carried out. This normalized ADR parameter (ADR(N)) was obtained by dividing the measured ADR value by the bulk surface area of bio-media contained in the 40-L bio-media holding chamber of the testing apparatus. While ADR values always increased with an increase in the media's bulk surface area, the trend was by no means linear. It was found that the most effective (per surface area) bio-media materials were the non-flocked media, having the lowest bulk surface area. It appears that bio-surfaces with smooth and lower surface areas have the characteristics to induce a more efficient bio-reaction.
From this review of ADR(N) data, it was found that the bio-media studied could be grouped into two categories: 1) non-flocked bio-media having a bulk surface area below about 1500 m2/m3, and 2) flocked bio-media having surface areas above 1500 m2/m3. This two-classification behavior was also observed in reviewing the values of the Wf** parameter discussed above.
Flocked bio-media was tested in a short term, live fish aquaculture RAS field-trial run. This was done to provide insight on how flocked bio-media would perform in an actual aquaculture system environment. This brief trial showed that flocked bio-media performed well during its 7-month test; the DSFN flocked bio-media kept the fish-holding tank water to the desired ammonia concentration of 2 ppm or less. Based on this limited duration field-trial experience, one would expect that flocked bio-media would function and perform very well in real world aquaculture operations.
This work provides direction for additional research dedicated to the development of superior bio-media materials. Optimized bio-media should lead to the establishment of new, very effective, more compact RAS installations having a smaller factory footprint. This in turn should lead to bio-media that are not prone to clogging and are cleanable, and therefore reusable. Introducing flock fibers onto base materials such as reticulated foam has good potential for creating this ultimate, optimized ammonia-contaminated water bioremediation bio-filtration system. This research also suggests additional possible opportunities for flocked bio-media such as a) the bioremediation of water contaminated with chemicals other than ammonia and b) the microbiotic oxidation of air pollutants such as hydrogen sulfide.5–7
Footnotes
Acknowledgements
The authors wish to thank the National Textile Center (Project No. F08-MD02) and the Massachusetts Clean Energy Center (MassCEC) for funding this project. We are also grateful to Raj Shah, President of Spectro Coatings, Inc., Leominster, MA for his generosity in fabricating and supplying the flocked media used in this study. UMass Dartmouth would finally like to thank the Greater New Bedford Vocational Technical High School (GNBVTHS) for their cooperation and field-trial effort relative to this project. We are grateful to GNBVTHS's Steven Walker, Science, Engineering, and Technology Cluster Coordinator, and Chris Pires, Environmental Science & Technology Instructor, for their valuable aquaculture experience and expertise.