
Abstract
Flocked textile surfaces have been investigated as high surface area, bio-filter materials for bioremediation of low concentration ammonia contaminated water. These conditions are encountered in fish-growing tanks used in commercial closed-system (recirculating water) aquaculture (fish farming). Nitrosomas and Nitrobacter bacterial species were used for bio-conversion. Ammonia depletion rates (ADR) for various commercial and experimental bio-media materials were experimentally determined. Overall, ADR values of various bio-media materials were found to 1) be 1.5x and higher for flocked surface bio-media than for non-flocked bio-media, 2) decrease as the flow rate of ammonia-polluted water through the bio-media increases (this effect was not linear), and 3) generally increase as the bulk surface area per volume of the bio-media increases. These observations suggest opportunities for further study of flocked bio-media materials.
Introduction
Bioremediation of ammonium ion from water is a routine process encountered in closed-system aquaculture (fish farming). During the fish growing process, ammonia byproducts from fish metabolism and decaying protein-aceous fish-food waste continuously contaminate the fish's holding tank-water with toxic-to-fish ammonium ion. Of necessity, this process-generated ammonium ion must be removed from the tank water to maintain fish health/ growth rate/survival. Consequently, all closed-system (water recirculating) aquaculture operations are fitted with a means of continuously removing ammonia from the fish water. The process of choice is called bio-filtration. Bio-filtration is done by continuously recirculating the ammonia-contaminated tank water through a porous medium, which is surface coated with a biochemically specific bacterial film (bio-film) that is in continuous dynamic contact with the contaminated water. During this continuous water-flowing contact, the ammonia is biochemically converted into non-toxic water soluble chemicals (e.g., nitrates). Porous bio-conversion media materials are called bio-media.
This paper presents results of an experimental study of the effectiveness of flocked surfaces as the bio-medium for the low concentration ammonia/water bio-conversion processes (bioremediation). Earlier studies have shown that nylon-flocked surfaces were much more effective in bio-converting low concentration water solutions of ammonium ions to nitrite and nitrate than other bio-conversion (bio-filtration) media.1,2 These initial findings led to a more complete study of flocked and other bio-media material configurations to learn more about how flocked surfaces function as bio-media materials.
Flocked surfaces are created by electrostatically depositing short monofilament fibers (e.g., 0.5- to 3-mm long) onto an uncured adhesive-coated substrate surface. During flocking, the imposed electric field orients and propels these short fibers out of a screened hopper such that when they impinge into the uncured adhesive layer, they adhere and orient themselves in an upright position. This upright fiber orientation is then locked into place by curing the adhesive. The resulting configuration is a unique fibrous composite having a velvet or velour surface texture. Flocking is a widely used textile process for upholstery, fashion apparel fabrics, automotive interior surfaces, and many other applications.
It was hypothesized that having an effective, high surface area is an important driving force in creating effective bio-media materials. High surface areas should provide the bio-media with greater amounts of bio-converting contact area (bio-film). In other words, the higher the available bio-film surface area the greater the area for ammonia-water/ bio-film contact. It is believed that the key to designing an effective bio-filtration system is to provide a bio-medium material capable of supporting a maximum amount of accessible bio-film.
Traditionally, wood chips, gravel, fine sand particles, fiber mesh pads, and packed polymer shapes like polyethylene, polypropylene, and polyvinyl chloride mesh/ribbon have been used as bio-filter media. 3 However, these media are bulky, have low specific surface areas per unit (bulk) volume, and are difficult to refurbish and reuse; some have a low porosity. Also, several of these media types can undergo compaction, leading to unwanted clogging. Consequently, some will tend to smell badly when used over long time periods. 4
Flocked surfaces are effective bio-media materials because they have a high and semi-open surface area. Furthermore, flocked media materials have been found to be easily cleaned and are reusable. 2 In continuing research, attempts were made to learn more about bio-media's operational features and to search for parameters that will lead to an optimally flocked bio-medium design. In the experimental studies reported herein, ammonia was selected as the model inorganic water pollutant.
In the bio-filtration of ammonia-in-water, nitrifying bacteria like Nitrosomas and Nitrobacter are used to oxidize ammonium ions to nitrite and then to nitrate ions. These are the traditional microbiological species used in bio-filtration devices for closed-system aquaculture operations and domestic aquariums.5,6 In aquaculture, live fish waste and unused feed cause a build-up of ammonia in the tanks water system. As mentioned earlier, ammonia is a toxic agent for fish survival and must be continuously removed during the growth and cultivation of fish product. In an operating aquaculture or aquarium system, ammonia-containing water from a fish holding tank is pumped into an ancillary bio-filtration tank where it comes in contact with a mass of porous bio-medium that is coated with a nitrifying bacterial film (bio-film). The bacteria inhabiting the bio-film then oxidizes the ammonium ions present into nitrite and further to nitrate ions. The overall biochemical nitrification reaction has been given by Eq. 1.7,8
Here, nitrifying bacteria metabolize the ammonium ions present in the water. Note that this reaction sequence states that for every mole of ammonium ion lost to bio-reaction, 0.98 moles of NO3− are produced as well as a small amount of bio-mass (0.021 moles) denoted as C5H7O2N. 7
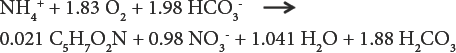
A bio-film/ammonia-water phase diagram is shown in Fig. 1a and b. Note here that the bio-medium/water interface is characterized by 1) a bacteria containing bio-film surface layer and 2) an absorbed/occluded water film.8–10 In a trickling bio-filter bioremediation system, the ammonia-bearing water is continuously re-circulated past/through/ over the bio-media's biofilm where the bioconversion reaction takes place, reducing and finally maintaining an ammonium ion concentration below the desired toxic level.
Biochemical dynamics and nature of a bio-medium/bio-film/ammonia-water interface. a) biochemical exchange at water/medium (bio-film) interface and b) substrate ammonia concentration profile at medium/bio-film interface.
In present studies, various flocked bioconversion media were obtained or prepared and tested for their effectiveness in terms of ammonium ion depletion rates. Here, two lab-scale (340-L system volume), closed-system, bio-filtration tank installations were constructed for the purpose of evaluating experimental bio-media. Effects such as bio-media's bulk volume surface area, flock density (number of flock fibers/mm2), base material structure, and the water flow rate were studied. Various media configurations were evaluated on how well they depleted ammonium ions from the apparatus's deliberately-added ammonium hydroxide containing water holding tank. The experimental media effectiveness parameter used throughout this study was referred to as the ammonium ion depletion rate (ADR). This ADR term has units of ppm/day (or mg/L/day) and represents the average daily drop in ammonia concentration of the system's ∼340-L ammonia-polluted-water holding tank system. Additionally, a constant bulk 40-L volume bio-media holding chamber (separate tank) was used for each of the ADR test data runs.
Prior to the work presented in this paper, a detailed study was carried out on the effect of organic carbon nutrients on a flocked bio-medium's ADR and the nature of the bio-film that was deposited on flocked bio-media surfaces. 2 Here, the effect of a flocked bio-medium's ADR under the conditions of a) included organic carbon nutrient and b) no included nutrient was determined. The carbon nutritive water contained 88 mg/L glucose and 6 mg/L of disodium phosphate, while for comparison, none of these chemicals were added to the non-nutritive water. The results showed that the ADR of flocked bio-media was 27% to 35% higher under the conditions of nutritive water compared to non-nutritive water. This result was further investigated by confocal microscopy, where the nature of the bio-film on the flocked medium's surface was examined. It was found that bio-film thicknesses were much greater when they were formed under the conditions of the organic carbon/phosphate nutritive water (11 microns); with no-nutrient, the bio-film thickness was 4 to 5 microns. Therefore, the bio-film was much thinner under non-organic carbon nutritive ammonia bearing tank water conditions.
To keep the laboratory-based study as chemically simple as possible, our present bio-media evaluation study was carried out under no-nutrient water conditions. From an experimental standpoint, the only nutrient for the bacteria in the tank water was ammonia. Thus, this current bio-media evaluation study was conducted with no added organic carbon in the ammonia bearing tank water. Therefore, it must be understood that the herein reported work does not comply with the “synthetic wastewater” composition standards used for evaluating bio-media materials as set by aquaculture industry practice. 11 Of importance then, the bio-conversion reaction kinetics reported in this document are for Nitrosomas and Nitrobacter bacteria reacting directly with ammonium ion where only a thin bio-film exists on the bio-media. It was felt that with a thinner bio-film, the geometric shape and morphology of the studied bio-media surfaces should be more performance dependent. It was felt that by doing this, the ADR behavioral differences among the various media types studied would be a better performance parameter.
Experimental
Bio-Media Material Testing Tank Systems
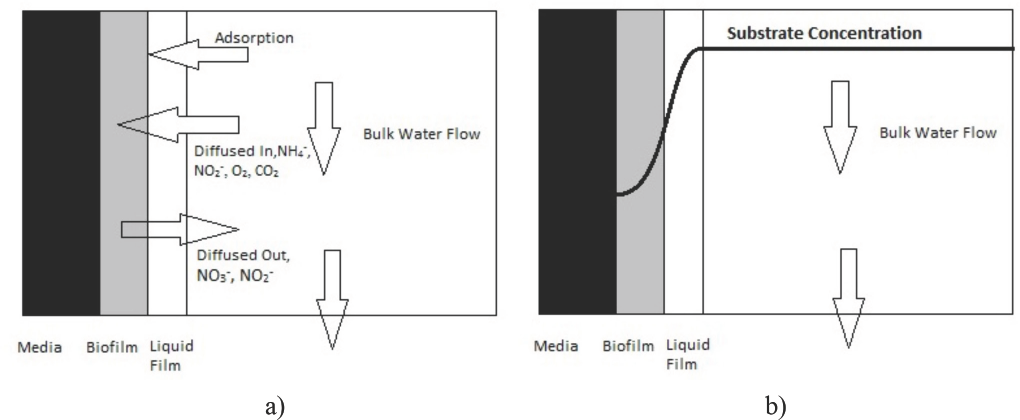
Because each set of ADR data required an average of 5 to 10 days running time, two identical tank systems (Fig. 2) were constructed to facilitate/accelerate data collection. Each of these tank systems operates by pumping ammonium ion-containing water from the bottom of the holding tank up to the top of the bio-medium chamber (40-L volume of bio-medium enclosed). The water used was freshly de-ionized municipal tap water; chlorination chemicals were removed before use. The total volume of ammonia-bearing water was contained in a 300-L (holding tank) plus a 40-L media chamber, for a total of 340-L volume for the complete system. Operationally, these holding tanks were continuously agitated with a mixing pump. The tanks also were oxygenated by fitting them with an aeration tube that would continuously bubble ambient temperature air through the mixed tank water. From this continuous aeration, the oxygen content in the tank water was maintained at 9 to 11 ppm. The pH was maintained at 7.5 ± 0.3 by adding sodium carbonate or acetic acid as needed. In addition to keeping these tanks well oxygenated, heaters and a thermostat were inserted in the tank water to maintain a water temperature of 25 ± 2 °C.
Schematic diagram of bio-medium material testing module. 2
In our initial runs, the flow rate of the ammonia-contaminated water through the media was kept at 5.7 L/min. This contaminated water was pumped to the top of the bio-medium chamber and allowed to flow by gravity down through the porous mass of the chamber's bio-medium. This process is referred to as “trickling.” Therefore, the complete description of the tank apparatus shown in Fig. 2 is best referred to as a “closed-system, recirculating, trickling bio-filter system.”
During various test runs, the water's ammonium ion concentration was periodically determined by measuring the ammonia concentration in the 300-L holding tank. The ammonium ion concentrations were measured using an analytical ion-selective electrode instrument obtained from Vernier Corp. The electrodes were interfaced with a computer using their Logger-Pro software and ammonium ion concentrations were read as the concentration of nitrogen (atoms) in the dissolved ions. Since the ammonia concentration was measured using non-acidified samples, the ammonia content of the water was interpreted as ammonium ion (NH4+) concentration. During the experimental runs, NH4+ concentrations were systematically recorded as a function of elapsed time (days). Plots of ammonia concentration vs. time were constructed and found to approximate straight lines. The slope of the resulting line was then taken as the ADR value (ppm/day/40-L volume of the particular bio-medium in the chamber).
In setting up these tank systems, the Nitrosomas and Nitrobacter bacteria mixture was first inoculated onto the bio-medium contained in the indicated chamber. The inoculation bacteria solution was obtained from a local aquarium store; it is sold under the name Seachem Stability. According to the Seachem website, this product is a synergistic blend of aerobic, anaerobic, and facultative bacteria formulated to help breakdown waste organics and ammonia in home aquariums and aquaculture tank systems. Nitrosomas and Nitrobacter bacteria are part of this bacterial mixture, as well as added nutrients that metabolize the live bacteria during the product's bottled storage life. 12 Following the Seachem Stability label instructions, the bacterial solution is injected over the top of the media chamber and allowed to spread and finally flow and grow onto the bio-medium material surface forming the bio-film bio-converting surface.
Commercial Bio-Media Materials
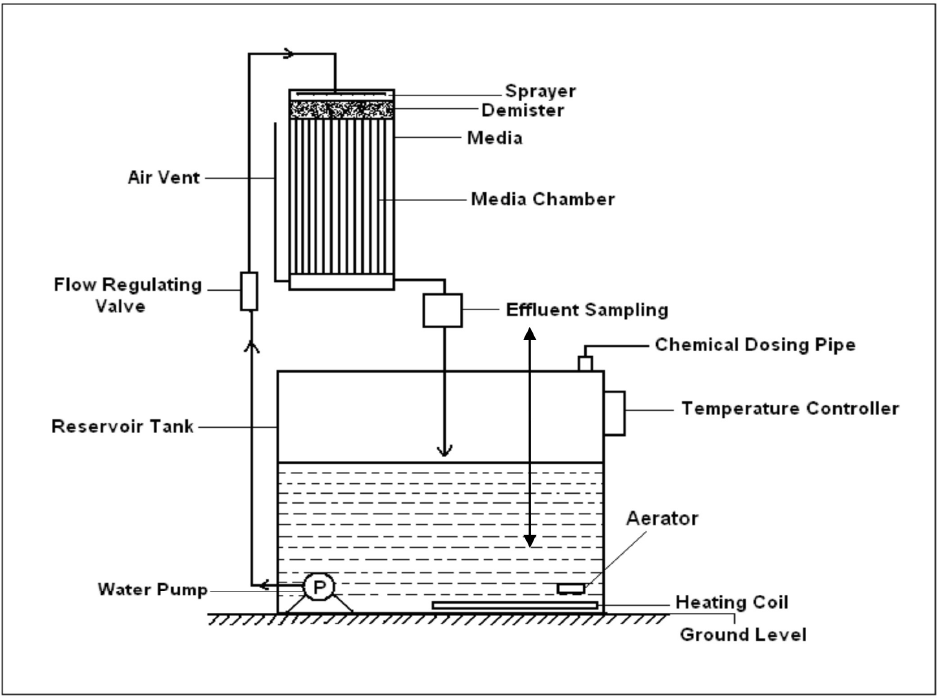
Commercially-available bio-filter media materials were studied to establish a baseline for our experimental bio-media evaluations. To this end, the first media studied were Bio-balls and Bio-fill available from Aquatic Eco-Systems (Fig. 3). The BioBall medium is contained in 2.54-cm diameter polyethylene, shaped open-structured “spherical” forms (with projections) reported to have a bulk volume surface area of 525 m2/m3. The BioFill medium is a tangled mesh of 1/8 in. wide, thin film, PVC ribbon having a reported bulk volume surface area of ∼820 m2/m3. Another bio-medium material obtained from Aquatic Eco-Systems was an open-cell reticulated foam designated as Commercial Reticulated Foam (CRF, not pictured). This CRF was estimated by visual dimensions and calculation to have a 458 m2/m3 bulk volume surface area. 13
Commercially-available bio-media. a) BioBalls (“spheres” are 1-in. diameter) and b) BioFill.
Experimental Bio-Media Configurations
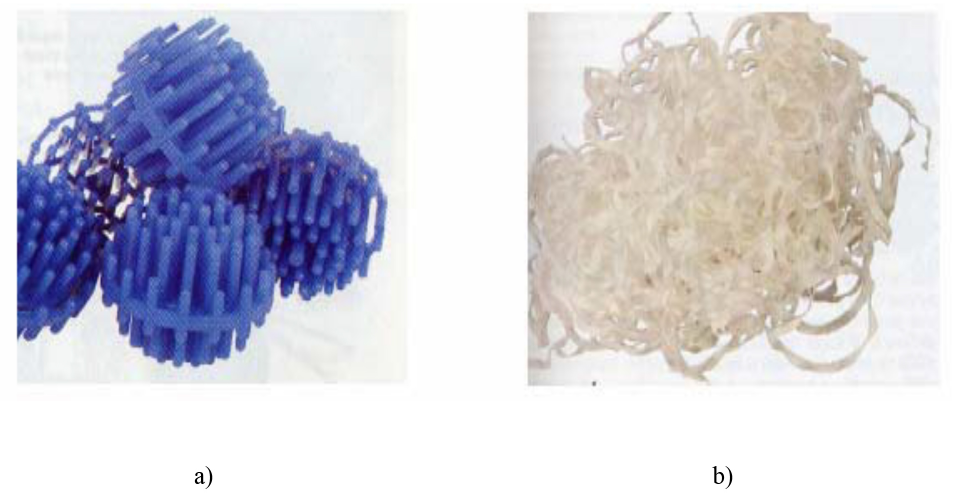
Two diverse flock-containing experimental bio-media materials were selected and fabricated for detailed study; a) flocked reticulated foam (FRF) and b) double-sided flocked nonwoven (DSFN) planar sheet materials. These bio-media were fabricated as prototype materials using developed laboratory procedures. Figs. 4 and 5 are close-up photographs of these experimental bio-media.
a) Adhesive coated reticulated polyurethane foam control with hole sizes of 4 ± 2 mm and b) experimental flocked reticulated polyurethane foam (magnified 20× by Olympus SD-STB3 video microscope; 1.2-mm long. Polyester flock fibers (2.4 denier) are shown.
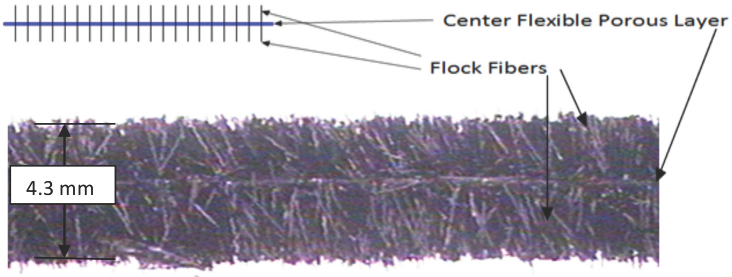
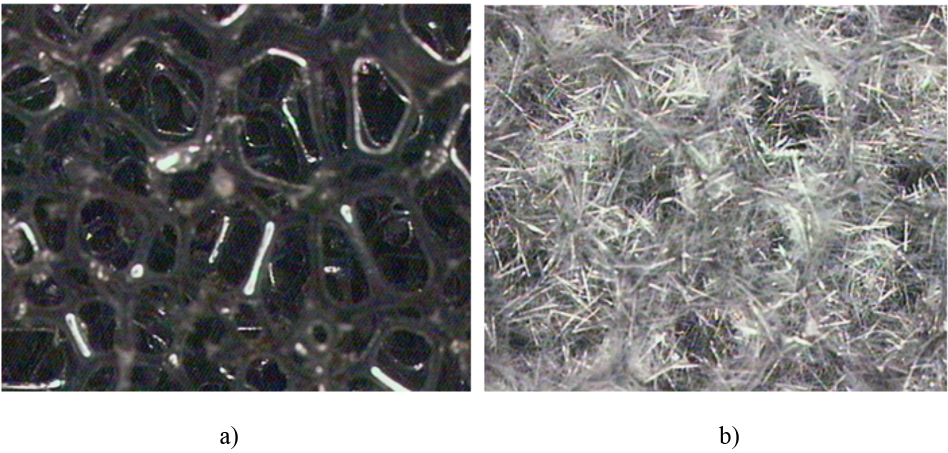
Cross-section photomicrograph of experimental double-side flocked nonwoven (DSFN). Center ply bio-medium material (20×); 2-mm long. Nylon flock fibers (20 denier) are shown.
FRF Material
FRF bio-medium material was fabricated from 30.5 × 30.5 × 2.0 cm thick sheets of open-cell reticulated polyurethane foam (Type RF-9) from Future Foam. The RF-9 designation signifies that it has cell openings at a 3-D density of 9 cells per square inch, which translated into a measured areal hole size of 4.1 ± 1.7-mm diameter. These 2.0-cm thick sheets of basic foam were first coated with a water resistant (when cured) acrylic adhesive, FL 1059B, obtained from Key Polymer Inc. While the adhesive was still wet, 1.2-mm long, 2.4-denier polyester flock fibers were flocked on both sides of this RF-9 foam. The assembly was allowed to dry overnight and then cured in an oven for 1 h at 80 °C. Photos of this flocked and un-flocked (control) reticulated polyure-thane foam are shown in Fig. 4. In the experiment, 24 sheets of this flocked reticulated foam were packed into the 40-L bio-medium chamber (Fig. 2). This formed a 30.5 × 30.5 × 45.7 cm bulk volume of FRF bio-medium. It should be noted that the base reticulated foam had a cell-size opening almost 3× that of the commercially-available CRF.
DSFN Material
DSFN bio-medium was fabricated by Spectro Coatings with guidelines from the University of Massachusetts-Dartmouth (UMD) research team. This new bio-medium material involved flocking 20 denier, 2.0-mm long nylon 66 flock fibers onto both sides of a porous, 100% polyester fiber-based, 120 g/m2 spun-bonded nonwoven fabric. A cross-sectional diagram and photomicrograph of this new medium is presented in Fig. 5. A 119 g/m2 adhesive coating was used to apply flock at a 170 g/m2 coverage on each side of the nonwoven center ply fabric. A variant of this DSFN bio-medium also was prepared whereby 6.4-mm diameter holes displaced 12.7 mm of staggered centers were punched into this DSFN material. The relevant properties of all bio-media studied in this project are summarized in Table I.
List and Description of the Various Bio-Media Materials Studied
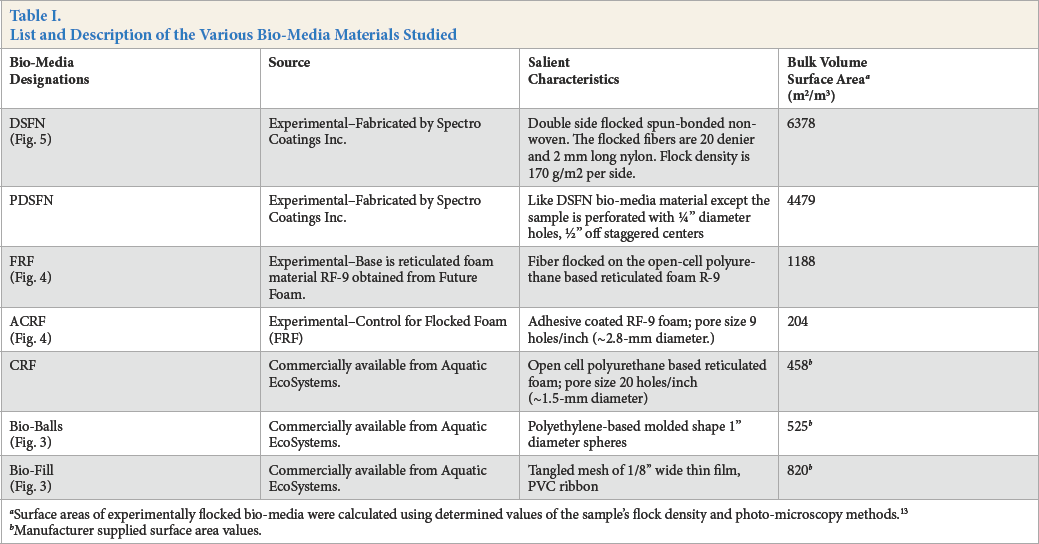
Surface areas of experimentally flocked bio-media were calculated using determined values of the sample's flock density and photo-microscopy methods. 13
Manufacturer supplied surface area values.
ADR Measurement Procedure
A typical run consisted of first, setting the concentration of ammonium ion in the holding tank in the range of 8 to 23 ppm by adding ammonium hydroxide to the fixed (total) volume of the system's 340-L deionized water volume. The system was then allowed to stabilize for two days by circulating the ammonia-containing water through the bio-filter medium without inoculating the medium. Once the tank water had stabilized to a pH of between 7 and 8, the first bio-inoculation of the medium was carried out. This inoculation cycle was usually completed within an eight-day period.
As instructed by the Seachem product literature, after the first inoculation, if the ammonia concentration does not start to drop after the first two or three days of operation, the bio-medium in the tank must be re-inoculated. A drop in ammonia concentration from the original 8 to 23 ppm concentration signals that medium's bio-film has been sufficiently established to start its proper biochemical conversion process. Once this happens, no more inoculations are needed.
During this time, the flow rate of water through the system was kept constant at 5.7 L/min. As tank water is recirculated through the bio-medium chamber, the ammonium ion concentration, nitrate ion concentration, pH, and temperature were measured on at least a daily basis using the ion-selective electrode instrument. The ammonium ion concentration was then continuously monitored until it reached a low value of 1 to 2 ppm. This constituted the end of a first-cycle run.
Then a second cycle run was started, For this cycle, another volume of ammonia (as NH4OH) was added to the 300-L reservoir holding tank until the ammonia concentration again reached the 8 to 23 ppm range. The ammonia concentration and other tank system properties were continually monitored. The experiment was continued for several ammonia addition and depletion cycles until several ADR runs were obtained. Usually, a total of at least three repeat runs were carried out for each experimental condition (medium type and water flow rate) tested. These ammonia/ water bio-remediation runs were not designed to study ammonia bio-remediation in the low ammonium ion concentration ranges encountered in practical aquaculture operations. In these practical systems, ammonium ion concentrations rarely get above 4 to 5 ppm.
Results and Discussion
ADR Determination
Plots of ammonia concentration change in the 340-L water holding tank/system capacity against time (days) ft a straight line, so the data points could be ft to a linear Eq. 2.
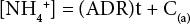
[NH4+] is the ammonium ion concentration, t is the elapsed time (days), and C(a) is a constant equal to the initial ammonia concentration.
From Eq. 2, the slope of the fitted line (least squares ft) was recorded as the ADR value for a particular medium run and water flow rate. This linear behavior signified that the bio-conversion-induced reduction in the water's ammonia concentration is a zero-order biochemical reaction. This means that the reaction rate is independent of the water's ammonia concentration. This linear behavior was unexpected, since it is well established that the kinetics of the ADR in water in the 0 to 4 ppm range has been shown to follow first-order kinetics. 14 The exact reason for the disparity between our observed zeroth-order rate results and the reaction kinetics reported in the literature is not known at this time. Nevertheless, we can conclude that under the special conditions of our experiments (no organic carbon nutrient and at the higher ammonia concentration range, 23-8 ppm down to 1-2 ppm), the bio-reactions in our experiments definitely followed zero-order kinetics.
To summarize, Table II lists the Eq. 2 parameters and the determined ADR (slope) values at a 5.7 L/min flow rate for all the various media materials studied.
ADR of Bio-Media a
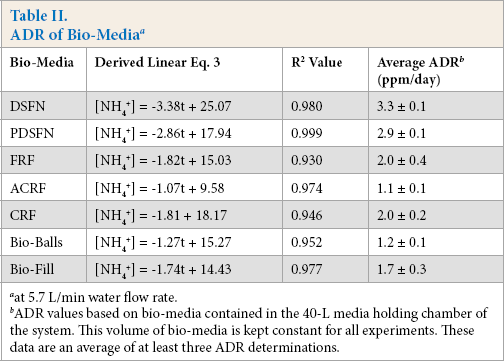
at 5.7 L/min water flow rate.
ADR values based on bio-media contained in the 40-L media holding chamber of the system. This volume of bio-media is kept constant for all experiments. These data are an average of at least three ADR determinations.
In an initial data analysis, the data in Table II were reviewed by averaging all the ADR values for the experimental, flocked bio-media (DSFN, PDSFN, and FRF) and comparing this average with the ADR value average for the commercial bio-filter materials (CRF, Bio-Balls, and Bio-Fill). The average ADR values for the experimentally-flocked bio-media were found to be greater than 1.5× higher than the ADR values of the commercial bio-media. This result confirms our earlier observations about the enhanced effectiveness of flocked surfaces as support media for ammonia/ water bioremediation reactions. Also of note is the approximate correlation between the ADR values in Table II with the surface area values in Table I. Generally, greater surface areas resulted in higher ADR values.
Confirming Bio-Reaction Stoichiometry
To confirm the stoichiometry for the biochemical nitrification reaction in Eq. 1, the increase in nitrate ion accompanying a one mole depletion of ammonium ion should correspond to 0.98 moles of nitrate ion. To check this, a review of plots showing the increase in nitrate ion concentration with time (days) was found to be approximately linear. Similar to the ADR parameter, a linear Eq. 3 was set up.
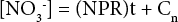
NPR is the nitrogen production rate, t is the elapsed time, and Cn is a numerical constant. From the Eq. 3 parameter summary in Table III, these nitrate vs. time data were quite scattered. This was the case even though the nitrate electrode was regularly calibrated. As a result of this scatter, a large experimental error in NPR values was observed. However, the expected upward trend in nitrate ion concentration was clearly displayed.
Typical Nitrate Production Rate (NPR) of Bio-Media a
at 5.7 L/min water flow rate.
NPR values based on bio-media contained in the 40-L media holding chamber of the system. This volume of bio-media is kept constant for all experiments. These data are an average of at least three NPR determinations.
As a check of the stoichiometry ratio, the slopes of the ADR and NPR lines for the DSFN experimental bio-medium at 5.7 L/min were compared. Here the average ADR was 3.26 ± 0.10 ppm/day and the average NPR was 3.9 ± 1.4 ppm/ day. From these averages, an NH4+/NO3− mole ratio of 3.2 ± 0.1/3.9 ± 1.4 equal to 0.8 ± 0.4 was calculated. Noting that Eq. 1 predicted a theoretical reactant/product mole ratio of NH4+/NO3− = 1.0/0.98 = 1.02, the experimentally determined value of 0.8 ± 0.4 was lower than theoretically predicted. However, the ratio still falls within the experimental data's scatter limits. How this NH4+/NO3− (reactant/product) mole ratio parameter changed with different water flow rates was examined next.
Ammonium/Nitrate Ratios vs. Water Flow Rates
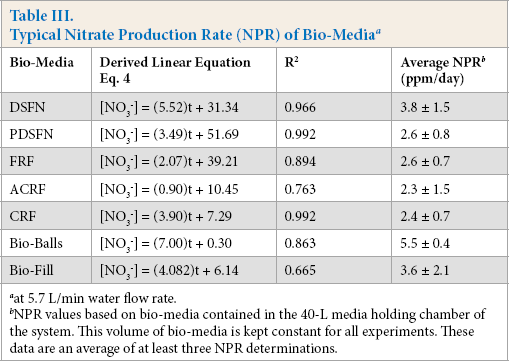
Using the previously-described procedure, ADR and NPR values for all studied bio-media were measured at various water flow rates. These results are tabulated in Tables IV and V. 13 As the water flow rate increased, the ADR decreased (Table IV). From this, it would be expected that this behavior would be accompanied by a decrease in NPR at higher water flow rates. This was indeed observed. Despite the large scatter in the NPR data, the NPR values were generally found to decrease as the flow rate increased (Table V). By combining data in Tables IV and V, the overall trends in NH4+/NO3−mole ratio values were plotted against water flow rates. The average mole ratio values for all bio-media studied tended to decrease as the water recirculation/flow rate increased (Fig. 6). Extrapolating these average ADR//NPR ratios, it was determined that, at zero water flow rate, the ratio was ∼0.95. This was well within the limits of experimental error relative the theoretical stoichiometric ratio of 1.02.
Trend of overall average ADR/NPR ratios and water flow rate.
Ammonia Depletion Rate (ADR) for Bio-Media Materials Tested at Various Water Flow Rates a
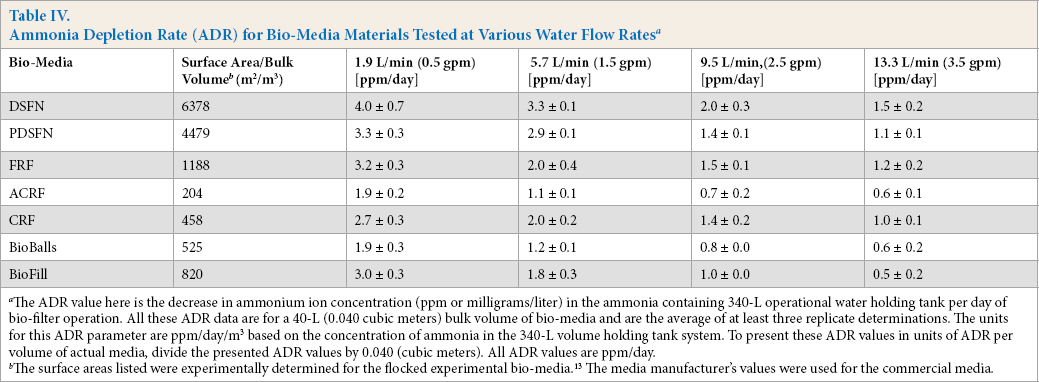
The ADR value here is the decrease in ammonium ion concentration (ppm or milligrams/liter) in the ammonia containing 340-L operational water holding tank per day of bio-filter operation. All these ADR data are for a 40-L (0.040 cubic meters) bulk volume of bio-media and are the average of at least three replicate determinations. The units for this ADR parameter are ppm/day/m3 based on the concentration of ammonia in the 340-L volume holding tank system. To present these ADR values in units of ADR per volume of actual media, divide the presented ADR values by 0.040 (cubic meters). All ADR values are ppm/day.
The surface areas listed were experimentally determined for the flocked experimental bio-media. 13 The media manufacturer's values were used for the commercial media.
Nitrate Ion Production Rate (NPR) of Bio-Media at Various Water Flow Rates a
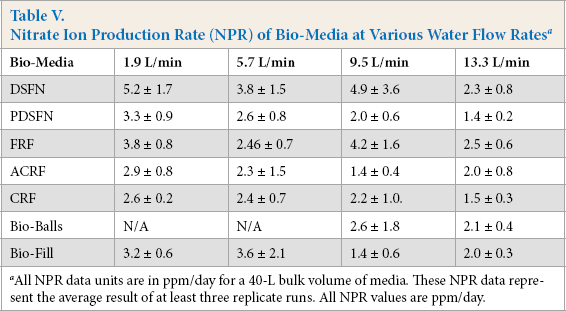
All NPR data units are in ppm/day for a 40-L bulk volume of media. These NPR data represent the average result of at least three replicate runs. All NPR values are ppm/day.
While there was wide scatter in the Fig. 6 data, it is believed that this general decreasing mole ratio trend at higher water flow rates was real. More precise and detailed and complete experimental studies will be needed to confirm and explain this observed trend. It is unfortunate that nitrite concentrations were not measured in this study. While Eq. 1 represents a simple steady-state biochemical process, it is known that this ammonium-to-nitrite-to-nitrate ion bio-conversion process is complex. This bio-conversion chemical reaction follows two steps involving two different bacterial species. The bio-reaction must therefore occur at two different metabolic reaction rates. A complicating factor in this two-step reaction is that our study was carried out under very limited nutrient concentrations. Perhaps this would lead to a different bio-reaction scheme than what is described by Eq. 1. Finally, the most puzzling observation in this work was the apparent slight decrease in the ADR/NPR ratio as the water flow rate increased (Fig. 6). We presently cannot speculate on why this happened. Contributing to this uncertainty too is that nitrite ion concentrations were not followed during any of these ADR and NPR measurements.
Conclusions
Laboratory scale closed-system recirculating water media material (trickling bio-filter) testing chambers were constructed for testing a variety of commercial and experimental bio-media materials. A medium's ammonia depletion rate (ADR) was determined by measuring ammonia concentration changes in the system's 340-L holding water tank system as a function of time (days). All ADR data were reported in units of ppm (ammonium ion) per day. Ammonia concentrations decreased linearly with time (days) in the 23 ppm to about 2 ppm ammonia concentration range studied. This linear relationship was indicative of a zero-order biochemical kinetic process. This means that the reaction rate was independent of chemical reactant (ammonia) concentration. This was unexpected and could be due to the higher ammonia concentration conditions that were studied and the fact that no organic carbon nutrients were used in the study. Therefore, the observed zero-order kinetic bio-reaction result most likely reflects the reaction rate order for the Nitrosomas and Nitrobacter bacteria/bio-film bio-reaction under the reported conditions; no additional carbon nutrient and at a comparatively high original ammonia concentration.
Experiments showed that flocked double-sided flocked nonwoven (DSFN) and flocked reticulated foam (FRF) experimental bio-media had greater ADR capabilities than the three studied commercial bio-media materials. Comparing the average of all the flocked bio-media ADR values and those from all three tested, commercially-available (non- flocked) bio-media materials, the flocked bio-media were over 150% more effective in the bioremediation of ammonia than the commercial media. The enhanced ADR effectiveness of flocked bio-media configurations was most likely caused by the added surface area resulting from the base media's added flock fibers. Added flock fiber contributed to increasing the surface area available for the growth of the media's bio-film. Greater biofilm surface in contact equilibrium with the ammonia-bearing water can lead to a more effective bio-conversion reaction.
The ammonia-to-nitrate biochemical remediation reaction studied was found to somewhat follow the expected stoi-chiometric trend. A plot of the NH4+/NO3− mole ratio values as a function of ammonia/water flow rate showed the ratio decreased as the flow rate increased. This result is presently unexplained. Following this observation, when NH4+/NO3−mole ratio values were extrapolated to a zero water flow rate, a mole ratio of 0.95 was found. While this value was below the expected ratio of 1.02, it was well within the limits of experimental error.
Footnotes
Acknowledgements
The authors wish to thank the National Textile Center (Project No. F08-MD02; 2008 to 2012) and the Massachusetts Clean Energy Center (MassCEC) for funding this project. The authors also wish to thank P. K. Sarda for his introductory assistance and bio-filtration tank setup. Dr. Frank Scarano of UMD's Medical Laboratory is thanked for his help with identifying and characterizing the media's bio-film and supplying the biological insight relative to inoculating the Nitrosomas and Nitrobacter bacteria onto the media. We also would like to thank Raj Shah and Jay Amin of Spectro Coatings Co. for supplying us with the flocked DSFN and PDSFN bio-media material. Thanks are also due to Steve Drap of Future Foam for supplying the RF-9 reticulated foam used in this study.