
Abstract
A commonly-used standard method for measuring cotton fiber moisture is the oven-drying method (moisture content equal weight loss). However, several commercial instruments are available for measuring fiber moisture content. A comparative evaluation program was implemented to determine the capabilities of laboratory moisture instrumentation/methods and to develop a standard format to quickly compare different units (logistical and technical attributes). Fifteen instruments were evaluated and compared to an oven-drying (reference) method. The best measurement agreements to the reference method were obtained for most small oven analyzers and near-infrared (NIR) analyzers, with few outliers and low residuals. A comprehensive comparative matrix was developed to assist the user decision-making process for selecting the best overall instrument to meet their fiber moisture measurement needs.
Introduction
The moisture content of cotton fiber is an important fiber property. 1 However, formal regulatory, conformance, and/ or compliance methods for moisture measurements of cotton fiber are not mandated. Fiber moisture levels and shifts due to environmental conditions and variety can impact the fiber's physical properties (e.g., strength and length), measured fiber quality, downstream textile processing, and marketing of the fiber in the global marketplace.2–4
Research by Anthony 5 and Baker et al. 6 demonstrated that high moisture levels in stored cotton bales could lead to changes in fiber color and, in some cases, to quality and processing issues at very high moisture levels. Further, different varieties can exhibit different moistures and different fiber-moisture responses under different environmental conditions (different slope or gain with increasing fiber moisture due to increasing location temperature and relative humidity (RH));7–9 this problem is a concern in locations (e.g., developing countries) that are not able to provide tight standard conditions for fiber quality measurements (e.g., high-volume instrument cotton fiber testing).
There were reports in the mid-2000s of cotton bales ginned with high-moisture levels that reached the marketplace. These and other concerns about bale moisture levels led to the US National Cotton Council recommendation and the USDA Farm Service Agency rule of a maximum moisture level in bales of 7.5% moisture for those bales to be used as collateral in the Commodity Credit Corporation loan pool.
There are many measurement methods and techniques for measuring cotton fiber moisture or water content. Bale quality and fiber property measurement concerns and the maximum moisture level rule have led to much industry interest in cotton fiber moisture level and fiber moisture measurements (e.g., if 7.5% bale moisture is the moisture maximum level, what is the expected agreement between various moisture measurements to protect this upper limit with the method/instrument used?).
The primary cotton fiber moisture measurement method, both in the United States and internationally, is the oven-drying method (or oven method; ASTM D2495-07 for the United States 10 ) in which the weight change upon drying is denoted as the fiber's moisture. 11 In this method, the fiber sample is heated at a specified temperature and time in an oven, cooled, and weighed (thermal/gravimetric method). Fiber moisture content can be calculated in two ways—from the “wet side” or “wet-based” and from the “dry side” or “dry-based.” In the wet-based measurement, the fiber weight loss due to heating is compared to the fiber weight before drying, as shown in Eq. 1.


Another moisture term commonly used is actual moisture regain. The sample is dried in the oven, placed in a standard condition room, and allowed to reach moisture equilibrium for a specified time period (e.g., 24 h). Moisture regain is calculated as shown in Eq. 3.

Although the oven-drying moisture measurement method for cotton fiber is very straightforward experimentally, several other laboratory moisture measurement methods/ instruments are commercially available that can measure fiber moisture and offer advantages in several areas. These include price, ease of use, analysis/turn-around time, and portability (to include at-line and on-line measurements). These instruments have been divided into four broad categories, based on measurement technique—weight loss, electric, spectroscopic, and chemical (Table I).
Comparison of Cotton Fiber Moisture Measurement Methods by Category
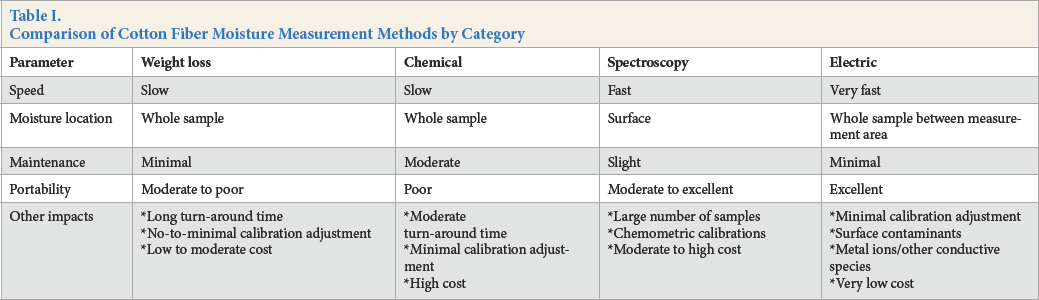
The weight-loss technique is a gravimetric method in which the sample's moisture is removed and the dried fiber weight measured to calculate moisture content. Sample heating can be accomplished by several means (e.g., thermal/heating, infrared/halogen lamps, and microwave). Many of these techniques use the well-known thermal heating method to heat the sample and contain essentially a small oven and analytical balance to heat and measure the weight loss of a single sample rapidly and accurately. Recently, new methods for sample heating were added (e.g., infrared or halogen lamps and microwave radiation) to remove water present in the fiber. The major advantages of these techniques are their close relationship to the reference oven moisture measurement method (ASTM D2495-07), measuring the moisture content of the whole sample. Normally minimal calibration adjustment, stability, minimal maintenance, and often moderate portability are also benefits. Major drawbacks include long turn-around and analysis time and moderate costs for some units.
The primary means for determining the moisture level using chemical methods is the use of a water-specific titration measurement to measure the water removed from the fiber during heating under a nitrogen atmosphere (e.g., the new Karl–Fischer reagent titration or KFT method using ASTM D7785-1215). Since the KFT method is specific to water detection and with a drying time of 5 min under nitrogen in a closed vial, oxidation is significantly minimized as is the loss of particulate matter contributing to weight loss upon heating. Although Karl–Fischer reagent water content measurements are known (e.g., in ASTM D1348-9416 and ASTM D6869-0317), the new KFT method was specifically developed for direct use on cotton fiber and designed to minimize the impact of heating and particulate matter on the water content results. The major advantages of this technique are specificity for only the water content in the fiber, measuring the water content of the whole sample, normally minimal calibration adjustment, and stability. Major drawbacks include moderate turn-around and analysis time, poor portability, moderate maintenance (to include disposal of chemical solvents), and high costs for some units if an auto-sampler is used to improve sample productivity.
Electric fiber moisture measurement methods primarily measure the fiber's electric charge/capacitance/conductance/resistance, which can change with changing fiber moisture content. The use of small, portable, low-cost, hand-held units are very well known. Recently, new instruments with larger surface measurement area and temperature compensation have been commercialized. The major advantages of these techniques are their low cost, measuring the moisture content of the whole sample (within the probe or surface measurement area), short turn-around and analysis time, minimal calibration adjustment, stability, minimal maintenance, and high portability. Major disadvantages include lack of specificity, which can impact accuracy, and the impact of surface contaminants and other conductive species (e.g., metal ions).
Spectroscopic fiber moisture measurements are common (e.g., NIR). Initially, these NIR techniques used large, laboratory research spectrometers. Rapid, rugged, and accurate portable NIR spectrometers have recently become available. Moisture quantity is determined by the intensity of the -OH group absorption peaks.18–20 Tree -OH spectral peaks are often associated with fiber moisture—1490, 1930, and 2100 nm. 20 Strong -OH peaks at 1490 and 2100 nm are due to both fiber moisture (water) and, primarily, cotton. Only the strong -OH absorption at 1930 nm is due primarily to fiber moisture and not cotton (Fig. 1). The inter-relationship between -OH bands for both cotton fiber and moisture (water) requires advanced chemometric analyses to discern accurately. The major advantages of these techniques are their speed (rapid turn-around and analysis time), direct calibration to the reference method, minimal calibration adjustment, stability, low maintenance, and moderate to high portability. Major drawbacks include intensive calibration development techniques (chemometrics), analysis of the fiber surface instead of the whole sample, and moderate to high cost.
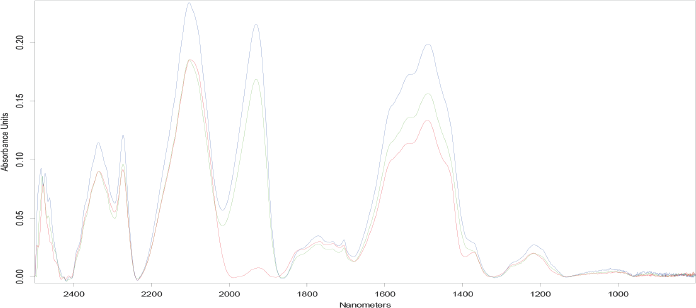
Baseline corrected NIR absorption spectra of lint cotton samples. Blue = original sample; red = original sample dried for 24 h; green = moisture regain of the sample 24 h after drying. 18
With the abundance of commercially available and diverse instruments for measuring fiber moisture, a common question of interest is: how well do the different instrumental fiber moisture measurement methods agree to the oven weight loss reference method and how well do they agree with each other? Thus, the need exists for a “head-to-head” comparison of various fiber moisture measurement methods/instruments to the reference oven-drying method. These comparisons should incorporate both new (e.g., microwave heating, water activity, KFT cotton-specific water content, and NIR) and well-known (e.g., oven and handheld resistance/conductance probes) moisture measurement techniques and methods. Results from this research could be used to assist users/customers interested in cotton fiber moisture (including technical, manufacturing, and marketing clients) in determining how well their selected method compares to the reference method and other techniques. This would assist users/customers in the selection of the method/instrument best suited for their operational, technical, and/or marketing requirements.
A program was implemented to 1) compare the method agreement between three Agricultural Research Service (ARS) thermal weight loss moisture measurement methods, 2) determine the capabilities of various moisture instrumentation and measurement methods, and 3) develop a standard format to compare the units quickly both for their logistical attributes and technical capabilities. The reference method for the comparative evaluation of different fiber moisture measurement methods/instruments was the best overall ARS oven-drying method. All measurements were performed at the Southern Regional Research Center (SRRC) of the Agricultural Research Service (ARS) of the US Department of Agriculture (USDA).
Experimental
Materials and Procedures
All cotton samples were saw-ginned lint (fiber). All samples were conditioned for a minimum of 24 h in the laboratory at the standard environmental conditions of 21 ± 1 °C and 65 ± 2% relative humidity (RH). All samples were weighed at standard conditions. All measurements were made at the USDA-ARS-SRRC.
For comparison of measured moisture levels/values from the ARS oven-drying methods, three domestic cotton samples were used (2001 FM-832, 2002 FM-832, and 2002 FM-966). All three cottons were measured in triplicate, using both static and forced draft air ovens. Fiber moisture measurement procedures and protocols for three ARS locations were compared: the Cotton Quality Research Station, Clemson, SC, USA (CQRS); the Cotton Ginning Research unit, Stoneville, MS, USA (CGR); and the Cotton Structure and Quality unit at SRRC, New Orleans, LA, USA (SRRC).
Methods details for each location are given in Table II. The oven-balance system at CGR was not available at SRRC, so the CGR method was modified slightly to include removal of the fiber perforated container from the oven, and cooling and weighing using the SRRC and CQRS method. The results from this evaluation were used to select the oven-drying protocol for the comparative evaluation of different fiber moisture measurement methods and instruments.
Comparison of ARS Cotton Fiber Moisture Methods at Each Location (n = 3)
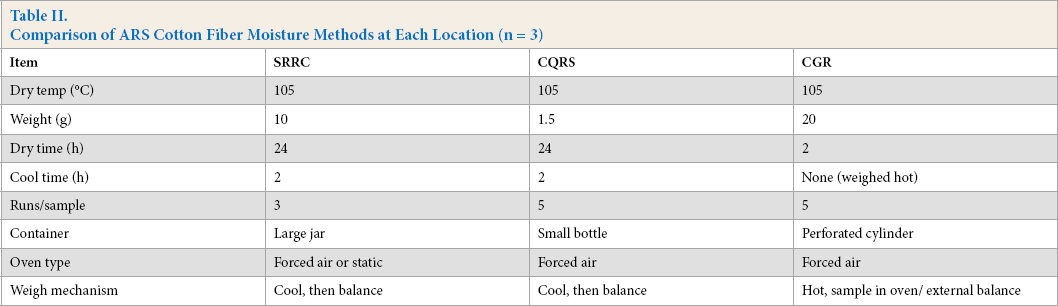
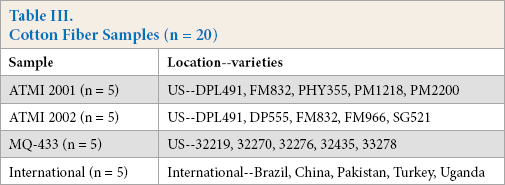
For comparison of the oven-drying method (reference) to the various fiber moisture measurement methods/instruments, a set of 20 diverse cottons, 15 from US sources and 5 from non-US international sources, were used (Table III). An ARS oven-drying method (a thermal/gravimetric method) was used as the reference fiber moisture method for the comparative investigations. For each sample, 1.5 ± 0.1 g of weighed fiber were placed into a weighing bottle, which was put into a forced air convection oven, heated at 105 ± 2 °C for 24 h, removed from the oven, cooled in a desiccator for at least 2 h, re-weighed, and the moisture content calculated using Eq. 1. Five replicates were performed per sample, and the five replicates averaged to obtain the average sample moisture. All samples by each procedure were run in the same static and forced air ovens under the same conditions.
Cotton Fiber Samples (n = 20)
Analytical Methods and Instruments
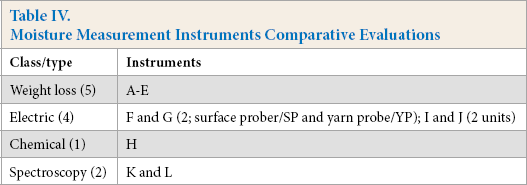
Fifteen moisture methods/instruments were evaluated and compared to the reference oven drying method for the 20 samples. However, three non-oven units yielded either significant measurement variability, operational concerns, and/ or significant slope/bias deviations, and were not included in the results. The 12 methods/instruments evaluated and reported are given, by category, in Table IV. Vendor recommended procedures for each instrument/method were used. These comparisons incorporated both new (e.g., microwave heating, water activity, KFT cotton-specific water content, and NIR) and well-known (e.g., oven and hand-held resistance/conductance probes) moisture measurement techniques and methods.
Moisture Measurement Instruments Comparative Evaluations
Data Analysis
For the ARS oven-drying methods evaluation, the primary comparison parameters and statistics were the mean (average values) and pooled within standard deviation (SDwp, analytical precision). For multi-moisture measurement methods/instruments comparisons, the primary comparison parameters and statistics were the multiple correlation coefficient R 2 , standard deviation of differences (SDD, a residual analysis; the standard deviation of the differences in moisture results between the designated reference method and the compared method for each sample) and outliers. Industry partners (e.g., Cotton Incorporated) were consulted for the desired measurement/method agreement between the evaluated method/instrument and the oven-drying reference method (outlier limit). Two outlier ranges were chosen—percentage of samples with differences between the reference and compared method/instrument of greater than ± 0.30% moisture (target agreement; very tight) and greater than ± 0.50% moisture (satisfactory agreement; a more typical method agreement between techniques). The lower the SDD and the lower the number of outliers, the better the method agreement.
Results and Discussion
Oven Measurements
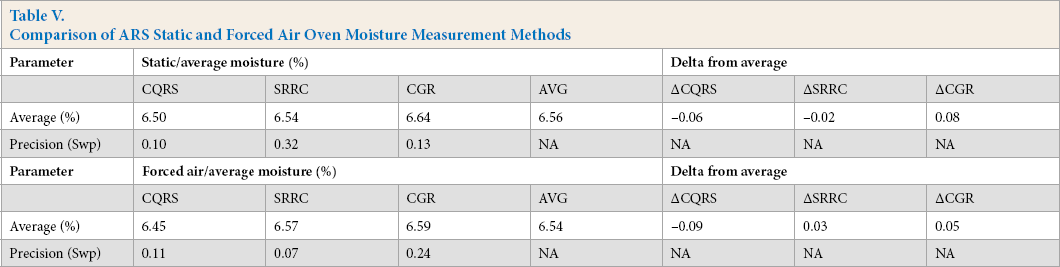
As mentioned previously, several ARS locations use the tenets of the oven-moisture (thermal weight-loss) method (ASTM D2495-07), but deviations between the location measurements are present (Table II). Prior to selecting the reference moisture measurement method for this investigation, a program was implemented to compare the method agreement between three ARS thermal weight-loss moisture measurement methods. Overall, very good fiber moisture agreement was observed between the three moisture methods. All methods agreed within ± 0.3% moisture for all cotton samples (Table V, Fig. 2). The CQRS method normally yielded slightly lower moisture results, and the CGR method normally yielded slightly higher moisture results (less than 0.15% of the moisture range). The CQRS method offered the key advantages of 1) use of the least amount of fiber, 2) best overall method precision, and 3) no values greater than ± 0.1% moisture from average. The moisture results for the static and forced air oven methods were very similar, but the best overall moisture agreement was observed with the forced air oven method for all cottons. Therefore, the forced air oven CQRS oven fiber moisture measurement method was selected as the oven reference method for the comparative analyses. In addition, the CQRS method was adopted by SRRC as its standard reference oven-moisture measurement method for all cotton fiber samples.
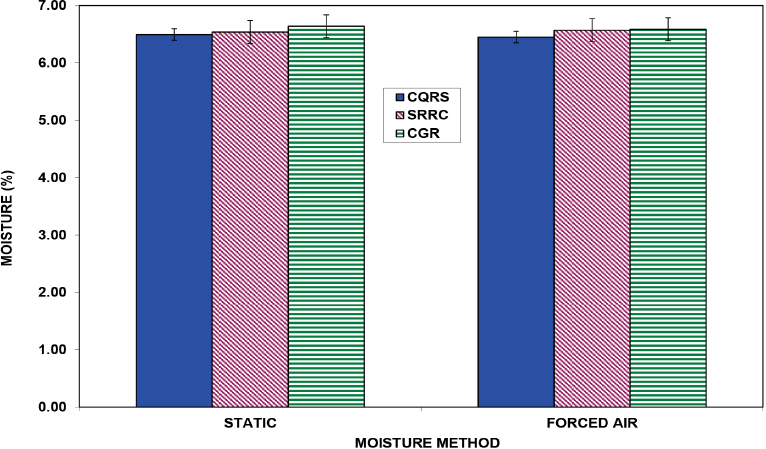
ARS moisture measurement comparisons. Static and forced air oven measurements at SRRC.
Comparison of ARS Static and Forced Air Oven Moisture Measurement Methods
Comparative Evaluations
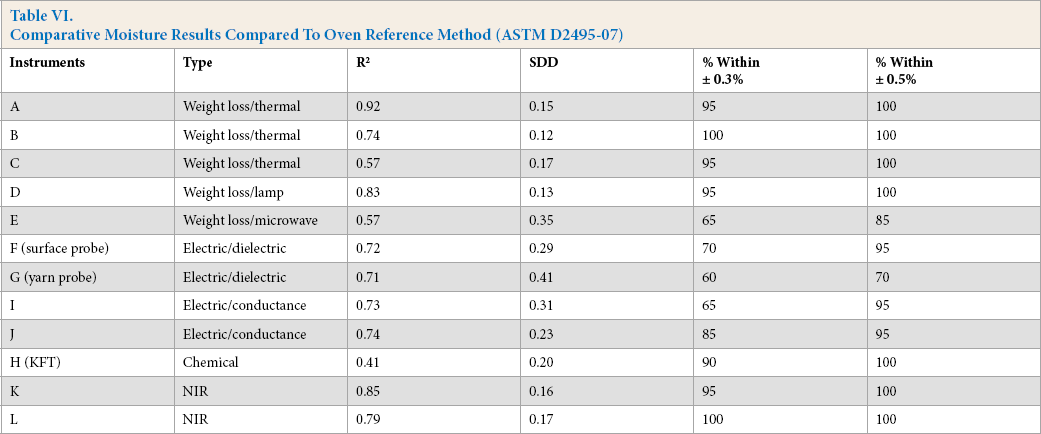
Using the CQRS oven fiber moisture measurement method as the reference method, comparative evaluations were performed with twenty cotton fiber samples using 15 diverse fiber moisture measurement instruments. Moisture measurements covered the four broad classes of instruments/ techniques—six weight loss (e.g., thermal gravimetric and oven), one chemical (e.g., colorimetric), two NIR spectros-copy, and six electric (e.g., conductance, dielectric, resistance, and capacitance). Fiber moisture calibrations were developed for the NIR instruments used in this evaluation. To reiterate, the primary parameters used to determine method agreement were R 2 , SDD residual analysis, and the percentage of outliers at the ± 0.3% and ± 0.5% level (percentage of samples for each instrument/technique which are greater than 0.3% and 0.5% moisture from the reference value). In general, moderate-to-very good method agreement results were observed for twelve evaluated units/methods (Table VI, Figs. 3 and 4).
Comparative Moisture Results Compared To Oven Reference Method (ASTM D2495-07)
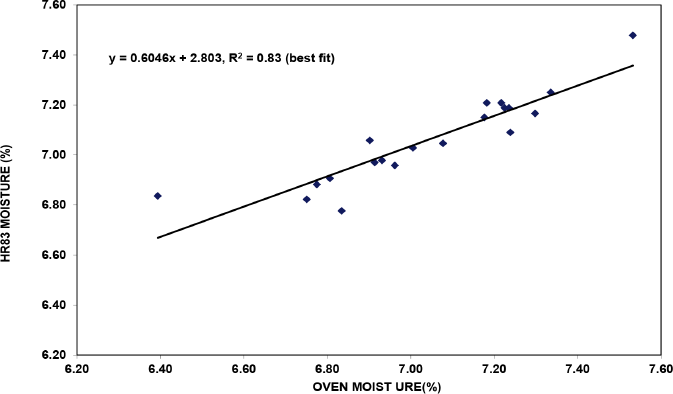
Moisture comparison of oven vs. Instrument D.
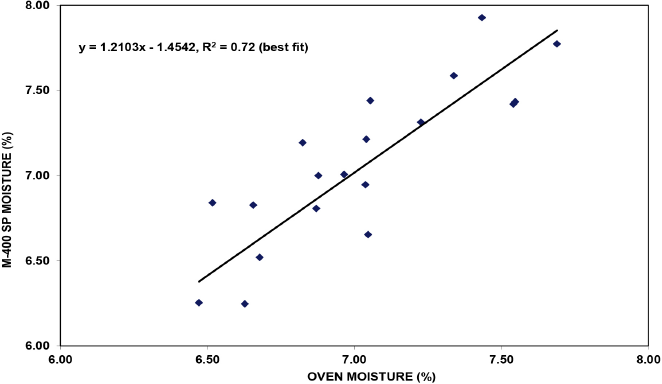
Moisture comparison of oven vs. Instrument F (with surface probe).
For most systems, a slight bias of ∼0.5% to 1.0% moisture was observed. It was encouraging to observe that the oven-instrument method agreements were within ± 0.5% moisture for at least 90% of the samples for all but two instruments. However, oven-instrument method agreements within ± 0.3% moisture for at least 90% of the samples were achieved by only seven units (four weight loss, two NIR, and KFT). Cotton fiber expands or “blooms” significantly when heated— a container is often required when heating the fiber to keep the fiber in the heating zone and to keep the fiber from contacting the heating element. For the weight-loss units, most incorporated the use of a small cage or container to hold the cotton fiber in place during fiber heating. Instrument E did not have a fiber container, and its results were impacted by this (highest SDD for the weight-loss methods). Overall, most R 2 values were greater than 0.70 but often less than 0.90, due primarily to the low moisture range for the samples (often near a 1.0% range). It was interesting to note that low R 2 values were observed for two units with low SDDs—Instrument C and KFT (Instrument H). The observed R 2 values for those units/methods were detrimentally impacted by a large outlier. For several of the evaluated instruments/methods, a definite skew in slope was observed.
Overall, the best technical results were observed for small weight-loss units (especially Instruments A and D) and the two NIR units (Instruments K and L). The small weight-loss units were of moderate price (potentially most cost effective) but with moderate analysis times, while the more expensive NIR units had low analysis times. The dielectric and conductance electric units performed satisfactorily but did not reach the level of at least 90% of samples agreeing within 0.3% moisture to the oven method. The hand-held, portable dielectric units were very cost effective (least expensive units), exhibited low analysis times, and of moderate method agreement. They are often used in production environments (e.g., gins). The results achieved for Instrument G (with yarn probe) was in good agreement with the results obtained by Byler et al. 21
Comparison Matrix
As noted previously, there are many commercial instruments/techniques for measuring fiber moisture, and the comparative results for several have been presented. These results demonstrate that an evaluation of the effectiveness of a particular fiber moisture unit compared to others depended on more than just the technical results of R 2 , SDD, and outliers. It is often confusing to a potential user as to which unit is the best for their application. For example, what will be the criteria for selection—accuracy to the oven method, maintenance, portability, cost, instrument size, analysis time/ turn-around time, or some combination of these and other factors? Thus, an overview/composite of instrument/methods characteristics is needed.
A comparison matrix was developed for the moisture measurement techniques evaluated. It contains a logistical/resource section and a technical section (Annex A). The components of the comparison matrix are given in Table VII. The matrix can be easily expanded as additional instruments/methods are evaluated. The matrix provides a tool that enables the potential user to quickly review several parameters of interest and to decide the best overall instrument/method for their use.
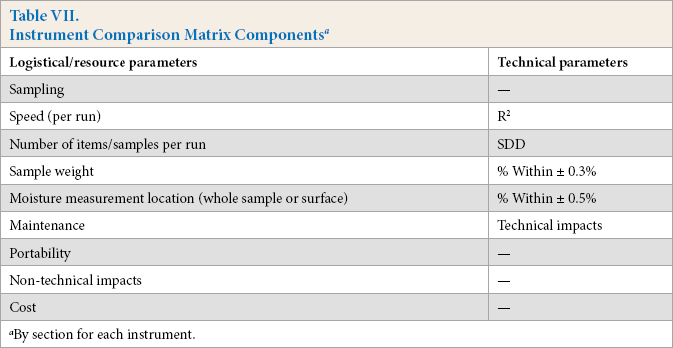
In addition, the matrix provides a more advanced and complex decision-making tool for instrument selection. Often, when a user makes a purchasing decision for an instrument, more than one parameter/variable are involved in the decision. In addition, not all parameters/variables are of equal importance—some parameters are more important than others depending on the needs or requirements of the user. In those instances, a decision matrix can be used, in which the parameters of interest for a user is weighted based on their importance to that user. 22
Conclusions
Cotton fiber moisture is an important quality parameter in the global marketplace. Although the oven-drying method (thermal weight loss or weight loss upon heating the fiber to determine fiber moisture) is the most commonly-used standard method for determining cotton fiber moisture, there are numerous and diverse commercial methods and instruments for measuring fiber moisture.
A program was implemented to 1) compare the method agreement between three ARS oven cotton fiber moisture measurement methods, 2) determine the capabilities of various moisture instrumentation and measurement methods, and 3) develop a standard format to compare the units quickly both for their logistical attributes and technical capabilities. The ARS moisture method from CQRS, using a forced-air oven offered key advantages over the other ARS methods (low fiber use, best precision, no outliers). It was selected as the oven reference method for the comparative analyses.
Moisture measurements/instruments were divided into four broad categories of weight loss, chemical, spectroscopy, and electric. A total of 15 instruments representing these categories were evaluated and compared to the ARS oven-drying method with a common set of 20 domestic and international cotton samples. Of the 15 instruments, 12 instruments/ methods yielded moderate-to-very good method agreement results. The best overall moisture measurement method agreement between the evaluated instruments/methods and the reference oven method was achieved with the small weight loss units (e.g., Instruments A and D) and the two NIR units (Instruments K and L). The hand-held, portable dielectric units (often used in production environments) were the least expensive units, fast, and exhibited moderate method agreement, but their technical performance/ method agreement was lower compared to the method agreements obtained for the small weight loss and NIR units. A comprehensive comparison matrix was developed to facilitate the instrument/method decision-making process for the potential purchaser/user.
Footnotes
Acknowledgements
The authors wish to acknowledge the outstanding work by Jeannine Moraitis and Sarah Lillis. This research was partially funded by Cotton Incorporated (Cary, NC) under project number 58-6435-1-568.
Disclaimer: The use of a company or product name is solely for the purpose of providing specific information and does not imply approval or recommendation by the United States Department of Agriculture to the exclusion of others.
Annex A
Includes comparison matrix and fiber moisture measurement instruments/methods (Tables A-I, A-II, and A-III).