
Abstract
This exploratory research evaluated the Karl Fischer Titration (KFT) reference method (ASTM D7785) to accurately measure water content of mechanically-cleaned greige cotton, a naturally-colored brown cotton, flax, and rayon at moisture equilibrium. Each sample was analyzed by KFT, standard oven drying in ambient air, and isothermal thermogravimetric analysis (TGA) using dry air and nitrogen carrier gases. Water content, as measured by KFT, was (%): mechanically-cleaned greige cotton, 6.82, brown cotton, 7.88, flax, 8.72, and rayon, 11.74. There was a significant difference between water and moisture contents by standard oven drying. Similar differences were observed between TGA in air and nitrogen and varied with ash content. The findings support the use of KFT to determine water content of these diverse cellulosic textile fibers.
Keywords
Introduction
To help the industry understand the actual amount of water in cotton conditioned to moisture equilibrium, an industry supported investigation led to the development of the American Society for Testing and Materials (ASTM) standard test method D7785 (Standard test Method for Water in Lint Cotton by Oven Evaporation Combined with Volumetric Karl Fischer Titration). 1 This method established the true value of the water content in white ginned lint (see glossary of terms, Table I). The method is based on Karl Fischer Titration (KFT) and has been applied to raw and processed lint. The system heats the cotton sample in a sealed container and transfers by dry nitrogen the released water vapor into a titration cell where it chemically reacts with a measured quantity of Karl Fischer reagent. The amount of reagent consumed is proportional to the water content in the lint.
Glossary of Terms
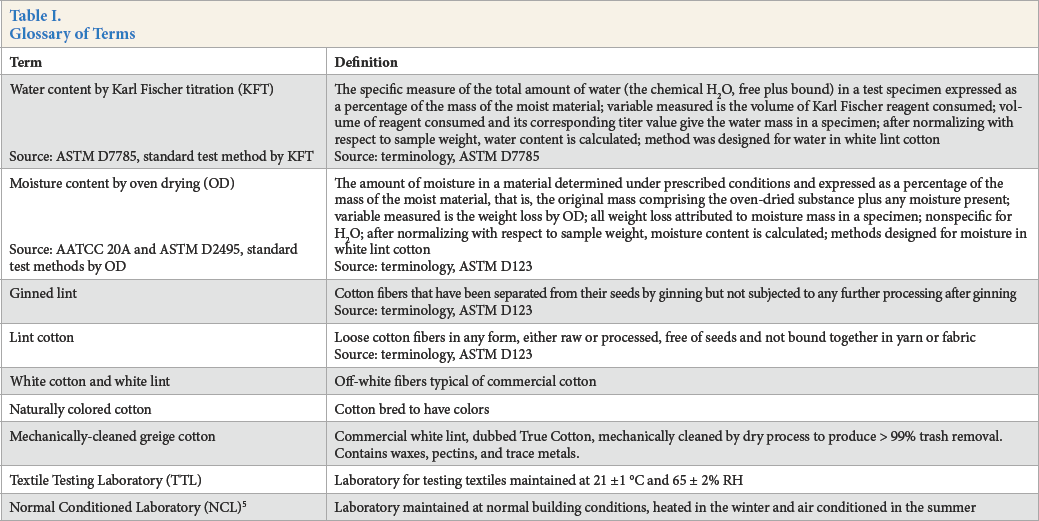
The fully automatic KFT system in D7785 includes a sample turntable that uses a fiber sample in a vial sealed with a septum cap and lowered into a single-sample oven. A double-walled needle forced through the septum allows for nitrogen to transport the evolved water vapor to a titration cell, where it is titrated with Karl Fischer reagent. Platinum electrodes monitor the titration and detect the end point. Results are displayed as percent water.
Documented accuracy studies of the KFT test method included meticulous experiments that investigated sensor response, selectivity to water, sequential analysis using the same working medium in the titration cell, checking for residual water after KFT analysis by near infrared reflectance (NIR) spectra, and comparing results to a new distillation procedure. 2 First, the sensor response was linear and accurate over the range of 5.5 to 8.5 mg water, which corresponds to 5.5 to 8.5% water in 100 mg cotton (recommended sample size). Second, optimal drying conditions were: KFT oven temperature, 150 °C and 270 s of drying. Third, Karl Fischer selectivity to water over interfering substances increased with the extent of cleaning: raw, mechanically cleaned, and scoured and bleached. Fourth, in sequential analysis of cotton using the same working medium in the titration cell, non-aqueous volatiles caused a negative bias trend in measured water contents. This was prevented by alternating six replicates of cotton and one replicate of: a blank vial, a water standard vial, or by adding fresh working medium to replace spent medium in the titration cell. Finally, method validation involved checking for residual water in white lint by NIR spectra taken through the bottom of the vial and com-paring results from a second reference procedure developed in this laboratory—Low Temperature Distillation (LTD). This LTD weight loss method slowly dries the specimen at a reduced temperature in a flowing stream of ultra-dry nitrogen. 2 Mean comparability values for KFT/LTD for the four cottons analyzed were (%): 6.61/6.57, 6.48/6.48 and 7.33/7.31 and 7.24/7.24; mean values were computed from a grand total of 96 replicates.
ASTM now has two types of standard test methods to measure moisture in lint cotton. The newer method is based on Karl Fischer Titration (D7785) to measure total water content. 1 The older methods (ASTM D24953 and AATCC Test Method (TM) 20A 4 ) are based on weight loss by oven drying (OD) in air at 105–110 °C to measure moisture content; all of the weight loss is attributed to water. In line with ASTM terminology, KFT results are called “water content” and standard OD test methods results are called “moisture content.”
The KFT method gives a more complete picture of the actual water content since the errors have been minimized for white lint. 2 Any difference between water and moisture contents originates from the OD method and this difference is noted as bias. The bias between water and moisture content may be > 0.5%. 5 Because the OD method will continue to be used worldwide due to its ease and economy of use, it is wise to explore the possible causes for the discrepancy in results.
To understand further the biases in OD, three comprehensive research projects explored the bias mechanisms. The first project focused on complementary thermal methods. 6 Using two laboratory ovens placed side-by-side, with analysis provided by thermogravimetric analysis (TGA) alone and thermogravimetric quadrupole mass spectrometry (TGA-QMS), it was observed that complicated reactions occurred during OD. The plots of OD results by successive weighings produced wavy mass versus time plots with greige cottons that were independently confirmed by TGA-QMS studies in Germany using synthetic air as the carrier gas. The study showed that smooth rather than wavy profiles were observed in all of the mass 18 (water) ion current profiles. It was also demonstrated that TGA-QMS runs using nitrogen as the carrier gas did not reveal wavy mass versus time plots. Unexpectedly, no specific organic molecules (volatiles) were detected by the mass spectrophotometer in any of the TGA-QMS studies. These results contradicted a commonly held view that organic volatiles are evolved in OD. 7 Additionally, TGA runs with air and nitrogen as carrier gases showed a significant reduction in weight loss in nitrogen when compared to air. Oxidative decomposition of the sample material from OD in air was suspected.
The second project investigated the oxidation products in the OD samples. 8 It is noteworthy that the attenuated total reflectance, Fourier transform infrared (ATR/FTIR) spectra of the synthetic standard of cellulose 2,3-dialdehyde strongly suggested that this oxidation product was formed during OD of cotton in air. The second derivative spectra revealed the extent of other oxidation products being formed in addition to the aldehyde products with band shifts observed. Note that the fourth derivative spectra shed light on the carbonyl products, along with unambiguous evidence of cellulose aldehyde formation.
In the third project, the first comprehensive study of the multiple causes of the errors in oven drying in air of white lint was reported. 5 The justification for this work is the literature review of oven drying methods. 7 The most relevant conclusion in this review is that measurement of moisture content in textile materials by OD was affected by significant sources of error that have not been identified or eliminated.
We now know that the origin of these biases is incomplete drying and weight change due to side reactions. 5 A list of six potential OD biases was developed when working with weighing bottles—residual water, moisture pickup after drying, change in weight of the blank bottle, mechanical transport of particulates out of the sample matrix, sample oxidation, and allowed tolerance in the standard practice for conditioning and testing textiles (ASTM D1776). 9 Using control cotton, the biases were measured at moisture equilibrium in four different OD procedures. For example, moisture pickup after drying due to opening the oven door, removing the heated container and then reseal the container varied as follows: seconds between opening and reseal, and percent gain in moisture content—10 s, 0.04%; 20 s, 0.09%; and 30 s, 0.13%. The corrections were applied to the moisture content data from a dozen Mississippi cotton samples analyzed by the four OD methods. Method grand mean results were 7.73% water compared to moisture content before/after bias correction, respectively (%): 7.19/7.80, 7.50/7.80, 7.42/7.69, and 7.79/7.92. In all four OD methods, moisture content was the result of a defined test procedure that specified: the type of drying oven (mechanical or gravity convection), size of oven and ambient air flow rate in the oven, ambient air temperature and relative humidity, number and size of weighing bottles in the oven at one time, and mass of sample in a weighing bottle. By changing OD features, it was possible to suppress one bias over the other. For example, for both gravity and mechanical convection ovens, decreasing the mass of cotton in the drying oven decreased the bias.
Thus, there are two main differences between the KFT and OD test methods. There is the difference in the heating up process between KFT and OD. There is also the difference between the specificity of the KFT and OD sensors. For those reasons, KFT is able to measure the water content in the fiber more accurately than does moisture content OD procedures. In the KFT method, the fibers are heated up at 150 °C for a few minutes in dry nitrogen. Water recovery is 100% and the Karl Fischer reagent is specific for water. 2 In the OD method, the fibers are heated up in moist air for several hours. Heating up the fibers in moist air produces incomplete drying. Also, side reactions (e.g., oxidation and particulate matter evolution) have an influence on the weight loss. Thus, the OD biases are incomplete drying and side reactions. 5
With the success of ASTM D7785, 1 collaborators and colleagues alike wanted to know if the method could be expanded for use with other cellulosic fibers. The primary goal of this preliminary research was to study the ability of D7785 to accurately measure the water content of a mechanically-cleaned greige cotton, naturally colored brown cotton, fax, and rayon.
The objectives of this paper are to (a) extend ASTM D7785 to measure the equilibrium water content in one sample each of mechanically-cleaned greige cotton, naturally colored brown cotton, fax, and rayon; (b) observe the selectivity of D7785 for water over the interferences in the materials; (c) using sequential analysis by D7785, observe if the evolved non-aqueous volatiles from oven evaporation cause a trend in titration and the measured water contents; (d) measure equilibrium moisture content by the specific OD technique that produced in a prior study the best agreement with KFT in white lint; (e) test for significant differences in mean values between equilibrium water and moisture contents; (f) measure by isothermal TGA, using dry nitrogen and air as carrier gases, moisture content as weight loss, and observe if differences in results between the two gases trends with differences between OD and KFT results; and (g) measure by pyrolysis TGA the air ash content in the fibers and observe if the results trend with differences between OD and KFT results.
Fundamentals
Karl Fischer Titration Method
The physical definition of water content in white lint as measured by the KFT reference test method (ASTM D7785) is the specific measure of the total amount of water (free plus bound) in a test specimen expressed as a percentage of the mass of the moist material. To be detected, the water in the sample must exert a vapor pressure at 150 °C when the heated sample is purged with dry nitrogen in the system's micro oven. The selection of 150 °C as the optimum oven temperature is supported by KFT results, and confirmed by NIR reflectance spectra taken through the glass bottom of the sealed vials, after KFT processing at 105 °C to 160 °C in 5 degree increments. Following KFT analysis at 150 °C, 155 °C and 160 °C, no observable residual water could be detected in the cottons by both KFT and NIR sensors.2,5
Linking Moisture Content to Water Content
In textile materials, the usual perception of moisture content by weight loss is the water content. However, moisture content measured by OD using an analytical balance to measure weight loss must be procedure defined because the sensor is not specific to water (see definitions, Table I). The measure of mass loss on drying will detect the loss of any volatile material.
To be detected as weight loss, water in the white lint sample must exert a vapor pressure at 105 °C in ambient air. However, an adjustment of the weight loss is necessary because drying is incomplete and weight change due to side reactions takes place. 5 Thus, it is necessary to correct moisture content values.
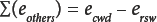
The difference or bias between moisture content (MC) by OD and water content (WC) by KFT measurement in white lint is given by Eq. 1 where ecwd (%) is the algebraic sum of errors or the cumulative error with direction. 5

A list of six sources of error was developed for moisture content by OD of white lint cotton using weighing bottles as sample containers. The straightforward calculation of cumulative error with direction (ecwd) is simply the algebraic sum of the individual biases (Eq. 2); some are negative and the others are positive. For example, ersw is the residual water that remains in the sample after OD. This bias is negative because it decreases the recovery of water (or weight loss) by OD.

eaae is the moisture pickup error after OD (negative) due to ambient air exposure between opening the oven door and closing the weighing bottles, ebwb is the error (positive or negative) due to the change in weight of the blank weighing bottle before and after OD, epic is the error resulting from the mechanical transport of particulates out of the sample matrix by the evolving water vapor, eoxd the bias (positive or negative) due to oxidation of the sample during OD, and econ the error (positive or negative) resulting from the allowed tolerance in the standard practice for conditioning and testing textiles. 9
Since the largest single error found in white lint was the residual water (ersw), Eq. 2 can be rewritten as Eq. 3.

Rearranging Eq. 3 gives Eq. 4.
By measuring MC, WC, and ersw, ∑(eothers) can be calculated. The residual water that remains in the sample after OD (ersw) is measured by KFT. By using the equations developed for white lint, how closely OD tracks KFT can be determined for mechanically-cleaned greige cotton, brown cotton, fax, and rayon.
Linking Moisture Content Determined by TGA to Water Content
In the context of this paper, isothermal TGA at 105 °C is another procedure defined as an OD method. To be detected as weight loss (moisture content), water in the TGA sample must exert a vapor pressure when the heated sample is purged with a carrier gas for 210 min (3.5 h). Since the purge gases in TGA systems may be readily switched, it is possible to mimic the atmospheres in standard OD (air) and KFT (nitrogen) methods. Residual water in a TGA system with air or nitrogen carrier gas is < 0.23 ppm. However, weight change due to side reactions in air (oxidation) may also occur in TGA. Differences between moisture content (weight loss) in standard OD and water content by standard KFT may trend with differences between moisture content by TGA in air and in nitrogen. Consequently, equations were developed to measure the TGA differences in results between air and nitrogen use.
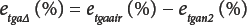
The difference between moisture content by TGA (MCtga) and water content (WC) by KFT is given by Eq. 5.

As with classic OD, moisture content by TGA must also be defined because the sensor is not specific to water. In Eq. 6, etgaair (%) is the TGA error in air, and in Eq. 7, etgan2 (%) is the TGA error in nitrogen.


Combining Eqs. 6 and 7 gives Eq. 8.

and simplifying Eq. 8 by defining the TGA difference in error between air and nitrogen gives Eq. 9.
Substitution from Eq. 8 in Eq. 9 gives Eq. 10.
By measuring the TGA moisture content in air and in nitrogen as simple weight loss, the difference between the measurements in the two atmospheres is given by e tga∆ (%). Note that Eqs. 1, 4, and 10 were traceable to water content (WC) by KFT determination and as a consequence, ought to track each other. Furthermore, by measuring the TGA ash content in air, trends in moisture content data can be sorted with respect to impurity levels in the fibers.
Experimental
Sample Conditioning
All samples were conditioned for a minimum of 24 h in a textile testing laboratory (TTL) maintained at standard textile testing conditions of 21 ± 1 °C and 65 ± 2% relative humidity (RH). All test specimens were weighed and prepared under these conditions before measuring moisture and water content.
Cellulosic Fibers
Four different cellulosic fibers were used in this research, including mechanically-cleaned greige cotton (Table I), a naturally colored brown cotton variety, rayon, and flax. The mechanically-cleaned greige cotton used was True Cotton (T.J. Beall Company) that was still in its natural raw state with waxes, pectins, and inorganic matter retained. The proprietary cleaning process used on True Cotton was an ambient temperature dry process that used no water or caustic materials and resulted in greater than 99% trash removal. 10 The naturally colored brown cotton variety was designated Brown-14 (B-14) and was an improved fiber quality brown cotton previously obtained from the now defunct BC Cotton Inc. The fax fibers used were of unknown origin and were also raw. The rayon fibers were obtained from Consolidated Fibers Inc.
Moisture Content by Standard OD
All oven testing was conducted in a Yamato DKN 600 mechanical convection oven with a 150-L capacity, and a mean flow rate of approximately 1.3 L/s that was located in a normal conditioned laboratory (NCL) (Table I). 5 The NCL was maintained at normal building conditions; air conditioned in the summer and heated in the winter.
For all fiber analysis procedures, 1.000 ± 0.0050 g samples were weighed. Gloved hands were used to manipulate the weighed samples. Glass caps and weighing bottles were also conditioned in the TTL and were weighed to four decimal places. The conditioned samples were placed in the bottles, reweighed prior to oven treatment, and placed in the 105 °C oven for 24 h. To limit the amount of moisture that reentered the sample when the oven door was opened after drying, only a total of three replicates from one of the four fibers were in the oven at a time. 5 Following oven heating, the bottles were capped while in the oven, removed, and quickly placed in a desiccator. The desiccators were then relocated into the TTL. The samples were removed from the desiccators to re-acclimate to the standard testing conditions for ∼30 min and then were reweighed. Mean oven moisture content (%, wet basis) and standard deviation were calculated from the weight loss data.
Water Content by Standard KFT
Water content was determined by KFT (ASTM D7785), a procedure specific for water in white cotton.1,2,11 The Karl Fischer apparatus consisted of a fully automated Metrohm 774 oven sample processor and micro oven held at 150 °C and dry nitrogen to transport released water vapor into the titration cell. A 35 glass vial carousel, an 800 Dosino with an electronic burette, an 801 stirrer, an 803 Ti stand for the titration cell with platinum electrode, and the Tiamo 1.2 titration software all worked seamlessly to measure water content. Hydranal composite 5K was used as the titration reagent and Hydranal medium K was the solvent in the titration cell. Teflon-lined silicone septum caps, to eliminate interactions during testing, were crimped over a 9-mL glass vial, as recommended by the manufacturer for this unit.
Replicates (six containing 0.1000 ± 0.0010 g per fiber sample) were weighed and prepared all at standard conditions. To maintain the conditioned environment, the sealed vials were placed in acclimated Mason jars, where they remained until just prior to being placed on the carousel of the KFT. Mean water content (%, wet basis) and standard deviations were calculated from the amount of reagent consumed.
Residual Water Retained in Standard OD
KFT was used to measure the residual water remaining in a cotton sample following the standard OD procedure. Tree conditioned samples per fiber type were measured to 0.1000 ± 0.0010 g and placed in KFT vials while in the TTL and acclimated to standard testing conditions. Again, to more accurately measure any residual water left after drying in the Yamato oven for 24 hours at 105 °C, only the three replicates per fiber were in the oven at a time. After drying, each vial was capped while in the oven and then removed for immediate crimping. The three samples were then placed on the KFT sample turntable for testing. The water content determined by KFT was believed to be an accurate estimate of any water that remained in the fiber sample after standard OD.
TGA
The KFT instrument, a Yamato mechanical convection oven, and the TGA Q500 (TA Instruments Inc.) with autosampler were placed in NCLs. The TGA measures weight change and/or phase change due to decomposition, oxidation, or dehydration of textile fiber materials, isothermally as a function of time, or at pyrolysis temperatures, in a controlled atmosphere. All fiber samples weighed ∼5 mg and were conditioned overnight in the TTL before being placed on TGA platinum pans. The TGA Q500 had a balance measurement resolution of 0.1 μg and an accuracy of less than or equal to ± 0.1%. Purge gases consisted of nitrogen or breathing air with a purge rate of 15 mL/min. Certificates of analyses for the nitrogen and breathing air indicated moisture concentrations of 0.088 ppm and 0.234 ppm, respectively. Each sample was run isothermally at 105 °C for a period of 210 min, followed by a 20 min cool-down period. The four fiber types were analyzed in triplicate for a total of twelve samples over a 48 h period on the TGA autosampler. Ramp time from ambient temperature to the 105 °C isotherm was ∼5 min. In addition, gradient pyrolysis was used to measure ash content in both atmospheres.
Results and Discussion
Study Design
The flow chart in Fig. 1 details the overall design of this pre-liminary study to determine if ASTM D7785—to measure total water content in white lint by KFT—may be extended to other kinds of cellulosic fibers. One sample each of True Cotton, brown cotton, fax, and rayon were analyzed. Additionally, water content by a specific OD method in ambient air 7 was determined to see how closely OD results track with water content. TGA in nitrogen and air, respectively, was used to simulate results from KFT and OD, and help to understand OD side reactions in air. The TGA results included isothermal runs to measure moisture content and gradient pyrolysis to measure ash content.
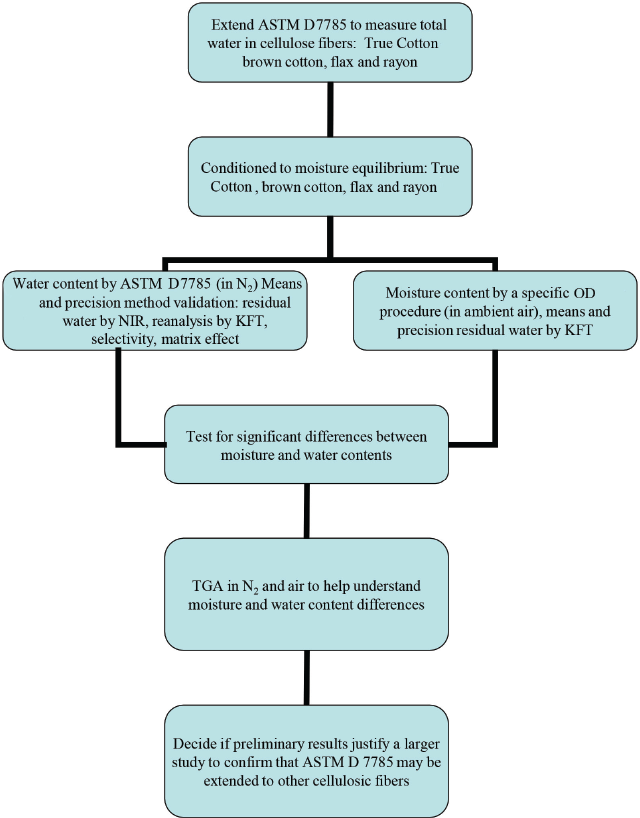
Organizational chart. Extend ASTM D7785 to measure total water in white lint by KFT to other cellulose fibers such as True Cotton, rayon, fax, and naturally colored brown cotton.
Table II details the experimental design of water content and moisture content data acquisition order. Note that the KFT data was taken over a three-week period compared to four days for OD. The fiber type analysis arrangement was always True Cotton, rayon, brown cotton, and fax, for both KFT and OD. By this plan, sample handling occurred in order of increasing levels of water and moisture.
Experimental Design of KFT Water Content and OD Moisture Content Measurements
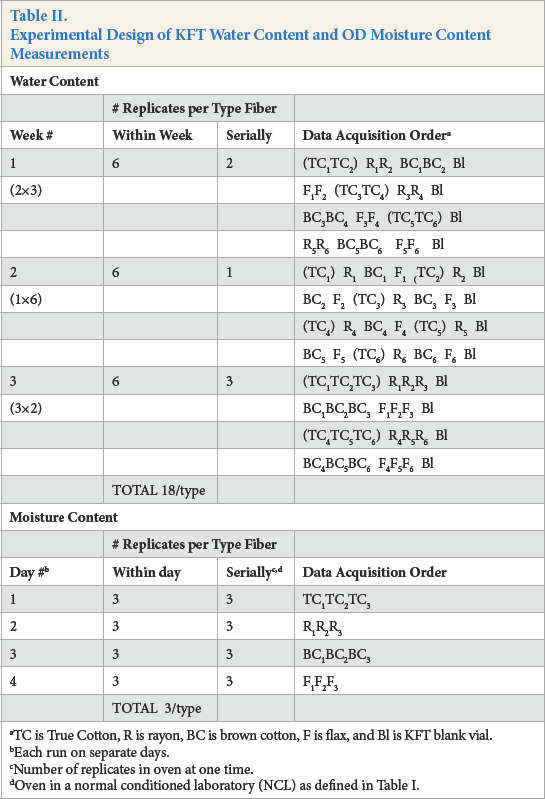
TC is True Cotton, R is rayon, BC is brown cotton, F is flax, and Bl is KFT blank vial.
Each run on separate days.
Number of replicates in oven at one time.
Oven in a normal conditioned laboratory (NCL) as defined in Table I.
It is instructive to examine the first four lines under KFT data acquisition order, week #1, in Table II. During that week, six replicates each of True Cotton, rayon, brown cot-ton, and fax were analyzed, in groups of duplicate analysis (e.g., True Cotton in parenthesis) of the same type fiber: (TC1TC2)R1R2BC1BC2Bl…. In contrast, the first line under KFT data acquisition order, week #2, shows analysis in groups of one replicate: (TC1)R1BC1F1(TC2)R2Bl…. Quite the opposite occurred in week #3 in groups of triplicate serial analysis: (TC1TC2TC3)R1R2R3Bl….
The intent of the KFT data acquisition plan was to determine if the different weekly analysis arrays would affect water content means and precision. Moisture content acquisition order was limited to triplicate serial analysis within a day for the same type cellulosic fiber.
Descriptive Statistics of Water and Moisture Equilibrium Data
The water and moisture content descriptive statistics are presented in Tables III and IV and Fig. 2. No water or moisture content replicates in Table III were excluded as outliers so that all of the original data provided a better understanding of applying D7785 to various cellulosic fibers.
Comparison of mean water contents by KFT by week and moisture content by OD (one-time collection).
Descriptive Statistics: KFT Water Content and OD Moisture Content Without Outlier Deletion
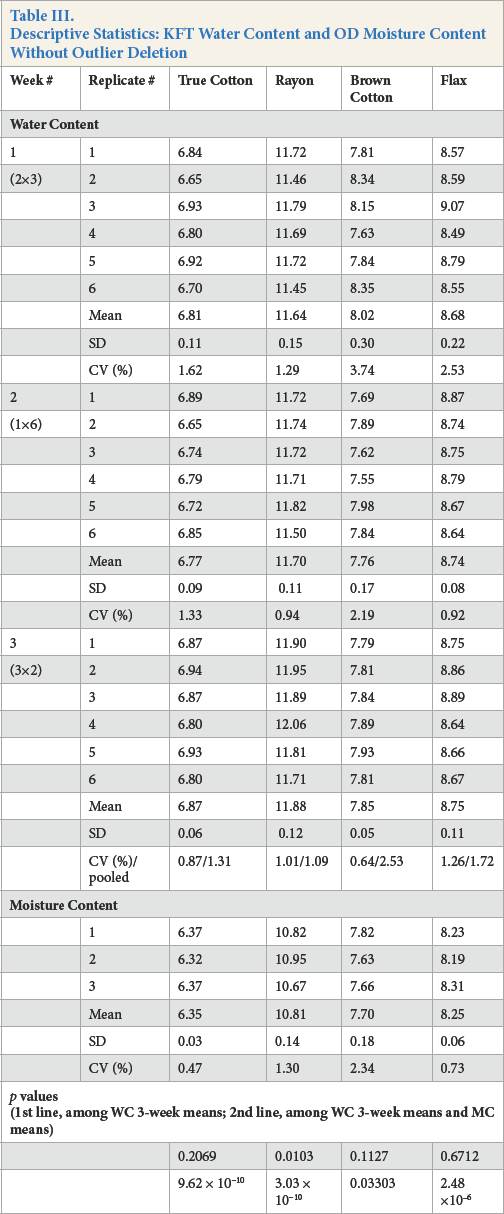
Note the first line of p values in Table III. Comparing the three water content weekly mean values for rayon, at least one differed significantly (p = 0.0103). The pooled standard deviation of the rayon was 1.09% compared to True Cotton, 1.31%; brown cotton, 2.53%; and fax, 1.72%. The more precise rayon data coupled with the larger weekly means allowed for discrimination between weekly means.
Next, examine the second line of p values in Table III. Comparing the three water content weekly means with moisture content, at least one differed significantly with moisture content (p < 0.05) for all four cellulosic fibers. The smaller moisture standard deviations and weekly water standard deviations for True Cotton and rayon, coupled with the actual differences, resulted in a very highly significant difference (p = 9.62 ×10⁻¹⁰ and p = 3.03 × 10⁻¹⁰, respectively). By contrast, brown cotton had the largest moisture standard deviation and generally the largest weekly water standard deviations, coupled with actual small differences, resulted in a weakly significance difference (p = 0.03303).
Table IV compares the water content grand mean (from the three weekly means) and moisture content mean and their difference for all four fibers. Differences were significant (p < 0.05) for True Cotton, rayon, and fax. The larger moisture standard deviation and water standard deviation for brown cotton, coupled to a small actual difference, resulted in a non-significant difference (p = 0.1504).
Descriptive Statistics: Grand Means and Precision a
Water content, moisture content and their differences (% wet basis, at moisture equilibrium).
Mean of 18 replicates.
Mean of 3 replicates.
Between WC grand means (from 3-week means) and oven means (from 3 replicates).
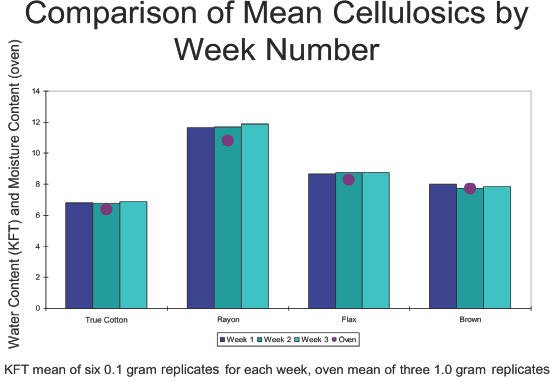
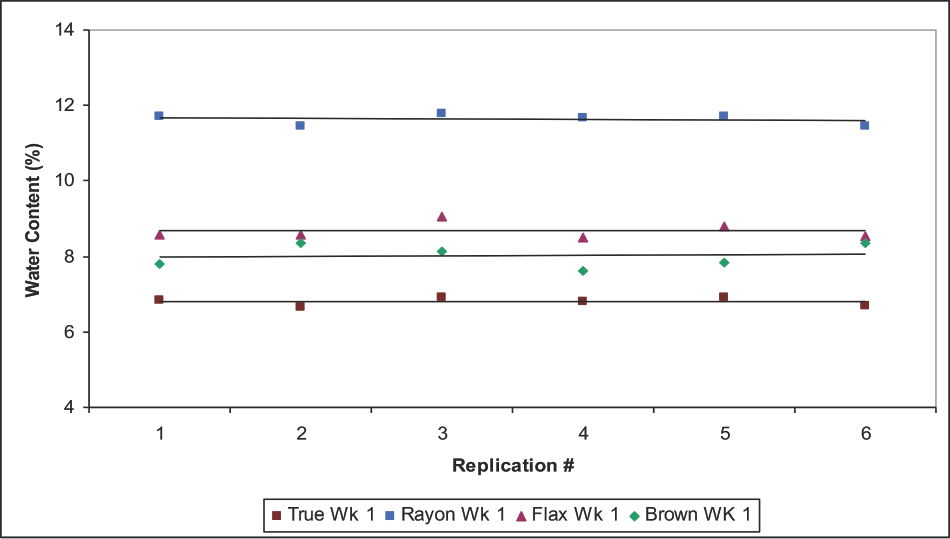
From a different perspective, the bar graph of Fig. 2 confirms that within a fiber type, the mean water content by week tended to not significantly differ. In fact, the comparative rank weekly order, from week #1 to week #3, designated as high (H), medium (M) or low (L) were variable, with True Cotton (M, L, H), rayon (L, M, H), brown cotton (H, L, M), and flax (L, M, H). Based on the available data, the different KFT weekly analysis arrays did not significantly influence water content means and precision. Superimposed on the bar graphs are the mean moisture content values depicted arbitrarily as a solid oval marker on the KFT week #2 bars.
NIR spectra, baseline corrected, of moisture peak (1930 nm). True Cotton is red, rayon is blue, fax is purple and brown cotton is represented by green line. (a) Fibers conditioned to standard textile testing conditions. (b) Fibers after KFT testing. Absorbance scale expansion is 3.3× that of (a).
Water Content Accuracy
Verifying the accuracy of the water content measurements involved (a) checking for residual water remaining in the fibers by NIR after KFT analysis, (b) probing the existence of three types of chemical interferences that influenced the amount of KF reagent consumed, and (c) testing for a matrix effect on the working medium in the titration cell.
First, before KFT analysis, NIR spectra, taken through the glass bottom of the sealed vials, showed the strong water peak at 1930 nm due solely to moisture (Fig. 3a). After oven evaporation of the water in the fibers at 150 °C combined with titration, NIR spectra taken immediately through the underside of the closed vials confirmed there was no observable residual water remaining in any of the four fibers (Fig. 3b). These results are in agreement with detailed studies on cotton that was scoured and bleached, mechanically cleaned, and raw fibers.2,5
Second, as to selectivity studies, procedures to verify the selectivity of the KFT cotton fiber procedure for water over the other components in white lint have been developed in detail and applied to the cellulosic fibers examined in this study. 2 In brief, non-aqueous volatiles in the fibers may produce chemical interferences in the KFT reactions that consumed additional iodine in the reagent. This would result in a positive bias and was designated Type I interference. The heating of the fibers in the KFT oven may produce chemical interferences that yielded additional water or a minute fraction of cellulose might breakdown to produce water. The end result is a positive bias since more iodine was consumed (dubbed Type II interference). Finally, the non-aqueous volatiles in the fibers may produce chemical interferences that oxidized iodide in the titration cell to iodine. This would be a negative bias because less iodine was consumed (Type III interference).
All selectivity studies were run after replacing the working medium in the titration cell with fresh medium. To probe for the existence of any side reaction, 100 mg of fiber in a crimped KFT vial was pre-dried at a mild temperature (75 °C, overnight) in nitrogen and the pre-dried specimen was analyzed by KFT at the usual 150 °C oven evaporation temperature. KFT selectivity (S) to water in the fibers was calculated by Eqs. 11–13 developed in the prior work. 2


WC is water content (%) in the moist fibers by KFT and EWCI is the equivalent water content of interferences (%) measured by KFT in the pre-dried fibers at 75 °C. In both formulas, the numerator is the water content corrected for interferences and the denominator is the amount of interferences (expressed as equivalent % water).
The desired accuracy of this reference method is 0.1%. To calculate the target selectivity (Eq. 13) needed for this level of accuracy, the water content in the fiber by the usual KFT method was determined and corrected by 0.1%. For all cellulosic fibers studied, the calculated selectivity equaled or exceeded the minimum value to retain an accuracy of 0.1%. For example, the measured water content in rayon was 11.74% (Table IV) and EWCI was 0.076% as measured in the pre-dried fibers. The Target S = (11.74 – 0.1)/0.1 = 116.4 and the experimental S value = (11.74 – 0.076)/0.076 = 153.5. As another example, for flax; WC (Table IV) = 8.72, EWCI = 0.10%, Target S = 86.2, and the measured S = 86.2. Also, reanalysis of a specimen by KFT immediately after the original wet basis run did not consume less iodine due to thermal breakdown of the specimen in nitrogen or produce detectable iodine by oxidation of iodide ion in the titration cell.
The selectivity studies may be summarized as follows. If thermal degradation occurred in the KFT measurement process, and produced non-aqueous, volatile chemical substances that consumed additional iodine (Type I interference), or yield chemical substances that produced additional water (Type II interference), or produced chemical substances that oxidized iodide in the titration cell to iodine (Type III interference), the extent of error produced was < 0.1%. This was due to the calculated selectivity values equaling or exceeding the minimum value to retain a water content accuracy of 0.1% for all four cellulosic fibers in the study.
Finally, the possibility of cellulosic fibers causing a matrix effect on the working medium in the titration cell was explored. The working medium in the titration cell was always pumped out and replaced with fresh medium before the start of any run on sequential cellulosic samples. Accurate analysis of a sample sequence using the same working medium assumes that no matrix effect occurred. In this context, a matrix effect is the combined effect of all components in the sample, other than the analyte, on the measurement of the quantity of the analyte. A matrix effect will change the end point and the results (percent water). The cause of this effect is the buildup of sample non-aqueous volatiles and/or Karl Fischer reaction products in the titration cell. The problem was prevented with white lint by alternating six replicates of lint and one replicate of (1) a blank vial, (2) a water standard vial, or (3) by adding fresh working medium to replace spent medium in the titration cell. 2
In this paper, the likelihood of a matrix effect was examined based on the data acquisition order in week #1 (Table II). A group of fiber specimens analyzed by KFT consisted of six replicates that occupied the sequential acquisition order or position (P1 to P6) followed by a blank vial (Bl): P1P2P3P4P5P6Bl. Only in week #1, rather than #2 and #3, did the six replicates of the same type fiber occupy all possible acquisition positions. For example, consider the duplicate analysis sequence of True Cotton (the first three lines under data acquisition order): TC1TC2 occupied positions P1P2, TC3TC4 occupied positions P3P4, and TC5TC6 occupied positions P5P6.
To probe for a matrix effect in week #1 data, the subset of the means of the first three replicate positions (set 1-P1P2P3) and the subset of the second three replicate positions (set 2-P4P5P6) were compared for significant differences (Table V). The p values are given in Table V. Also listed are comparison p values for week #2 and #3 data, although replicates from the same type fiber did not occupy all possible data acquisition positions. Nonetheless, there was no significant difference between paired subsets at p < 0.05, except for week #3 of the fax. The exception may be due to True Cot-ton and brown cottons occupying only positions P1P2P3, and the rayon and fax only positions P4P5P6. A plot of the week #1 individual replicate data (Fig. 4) showed no measurable matrix effect on the working medium in the titration cell (the slopes were essentially zero). From a different perspective, the bar graph (Fig. 5) of the difference in water content between paired means (i.e., TC cotton, week #1: set 1 minus set 2) showed a small distinction.
Minimal matrix effect of KFT data demonstrated by replicates of week 1 data. True is True Cotton and Brown is brown cotton.
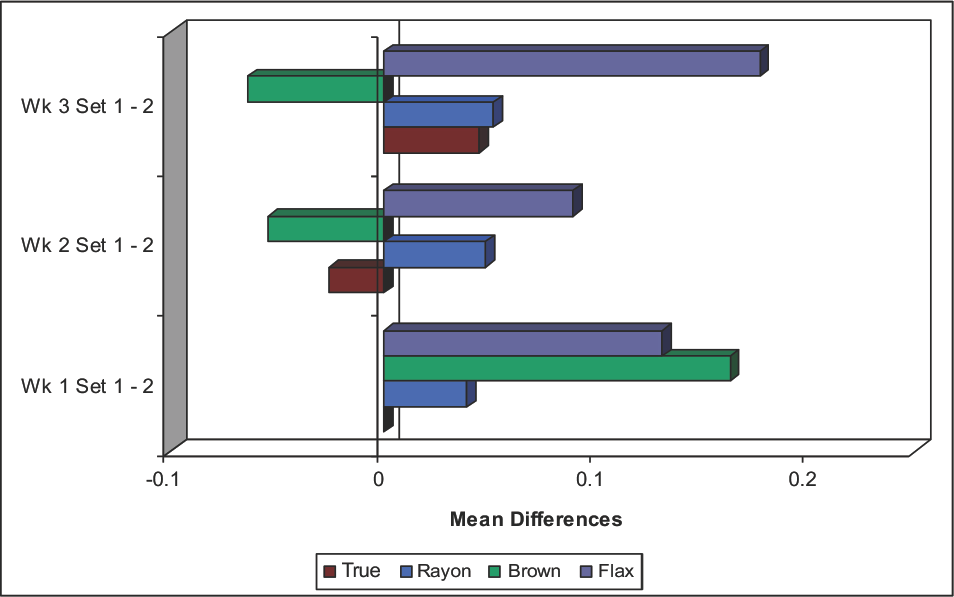
Mean differences between KFT Set 1 (replicates 1–3) and Set 2 (replicates 4–6) for each week. True is True Cotton and Brown is brown cotton.
Matrix Effect on Working Medium in KFT Titration Cell
Set #1 and #2—data acquisition order split in half; #1 is 1st 3 replicates acquired and #2 remaining 3 replicates acquired.
TGA
A recent study indicated that extraneous materials in cotton samples can limit the range of water content in raw and mechanically-cleaned cotton. 12 Thus, complementary methods are recommended that can provide an estimate of impurity levels to help understand the differences in water and moisture content of the four cellulosic fibers. The complementary TGA technique was used. Weight loss at isothermal conditions in air and nitrogen carrier gas was the measure of moisture content; gradient pyrolysis in air was used to quantify impurity levels as ash content. Air and nitrogen carrier gases aided in understanding oxidizing and inert atmospheres.
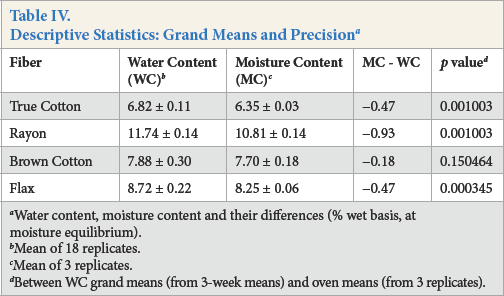
Isothermal TGA spectra of brown cotton, fax, True Cotton, and rayon in air and nitrogen are depicted in Figs. 6a and b. The spectra indicated an initial rapid weight loss of between 4% and 9% within the first ten minutes of the TGA method in air and nitrogen. The weight percentage remained relatively constant thereafter until the end of the experiment at 210 min (3.5 h, Table VI). Rayon and fax produced the greater weight loss (moisture content) when the TGA method was performed isothermally at 105 °C in air and nitrogen. Under pyrolysis conditions in air, the brown cotton and fax showed the greater ash content (extraneous materials, Table VI).
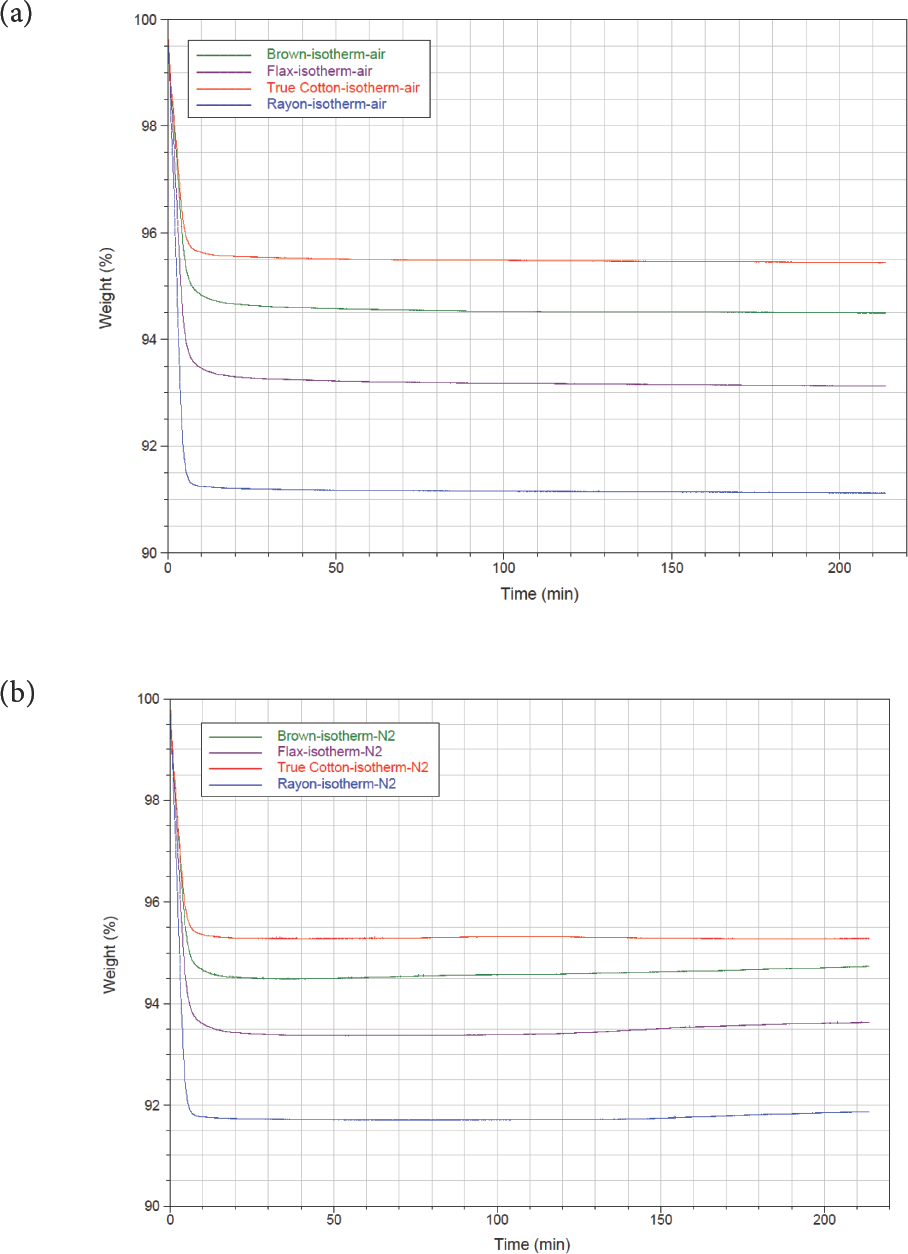
TGA isothermal drying (a) in air and (b) in nitrogen. True Cotton is red, rayon is blue, fax is purple and brown cotton is represented by the green line.
TGA Isothermal Analysis and Gradient Pyrolysis of Cellulosic Fiber in Air and Nitrogen
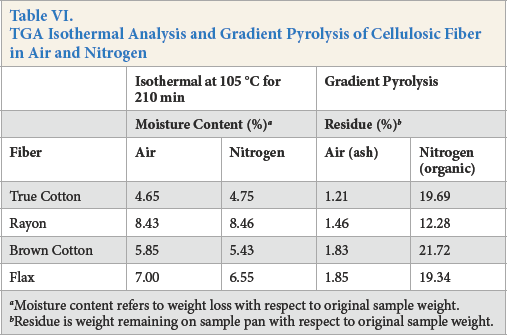
Moisture content refers to weight loss with respect to original sample weight.
Residue is weight remaining on sample pan with respect to original sample weight.
It is instructive to examine the errors in the TGA method. All fiber samples were conditioned under standard conditions prior to TGA. Conditioning issues may arise and contribute to error as the fiber samples are awaiting TGA and rest in their respective weighing pans atop the autos-ampler. During this time, the room RH can vary, leading to variability in sample conditioning and in moisture measurements, but probably not in ash content. The total conditioning error was not measured. However, we recognize this error exists and, as a consequence, used the data in the next section of this paper in a comparative way, rather than as absolute values.
A false assumption of the isothermal TGA method is that the percent weight loss in air is composed entirely of water. It has been reported that low temperature heating of fibrous material leads to the evolution of low molecular weight degradation products including water, carbon monoxide, and carbon dioxide. These degradation products are reactive species themselves that can act as catalysts and accelerate the decomposition process, especially in the presence of air.13 Thequalification and quantification of such degradation were not ascertained using the TGA method, but represent a source of error due to weight change. As a consequence of thermal degradation, which is akin to material aging, partial de-polymerization can occur, leading to changes in crystal-linity, hydrogen bonding, and performance properties of the fibers. With the isothermal TGA method, no attempt is made to estimate the water content. Only the moisture content is measured.
Linking OD Errors to KFT
Many modifications to OD methods can be found in the literature without verifying the accuracy of test procedures. 7 These alterations may have resulted in higher sample throughput and better precision. In adjusting the OD test method for white lint over eight decades, the emphasis was by and large on precision and rarely on accuracy. This is because the latter is more difficult to establish.
Since the extraneous materials in cotton samples can limit the range of water content in raw and mechanically-cleaned cotton, 12 the data in Table VII were sorted and grouped according to TGA ash content in air. True Cotton and rayon were placed in the lower concentration group, and brown cotton and fax in the higher cluster.
Results in Air: OD Errors and Ash Content
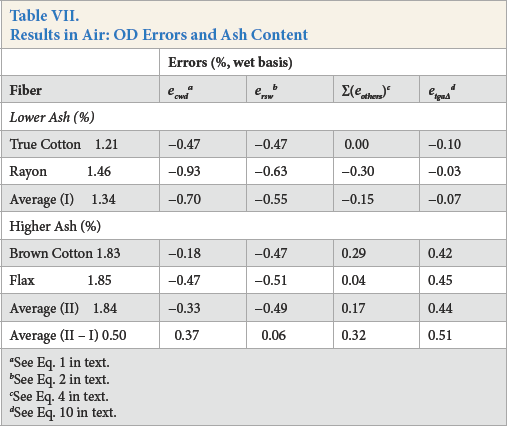
See Eq. 1 in text.
See Eq. 2 in text.
See Eq. 4 in text.
See Eq. 10 in text.
The KFT standard test method for water in white lint enabled the first comprehensive study of OD errors and illustrated how the errors varied with specific OD attributes. 5 The theory developed in that paper was applied in the current study to resolve the algebraic sum of errors (ecwd, cumulative with direction) in standard OD into two components of error: ersw(residual water after drying) and ∑(eothers)(sum of five other errors, Table VII).
The residual water content in the standard OD procedure (ersw) was plotted as a function of total water content in Fig. 7. The strong relationship suggests that MC data can be corrected for the residual water that remains in the fiber samples. Perhaps the correction factor could be in the form of a constant, a single value depending on the type of cellulosic fiber.
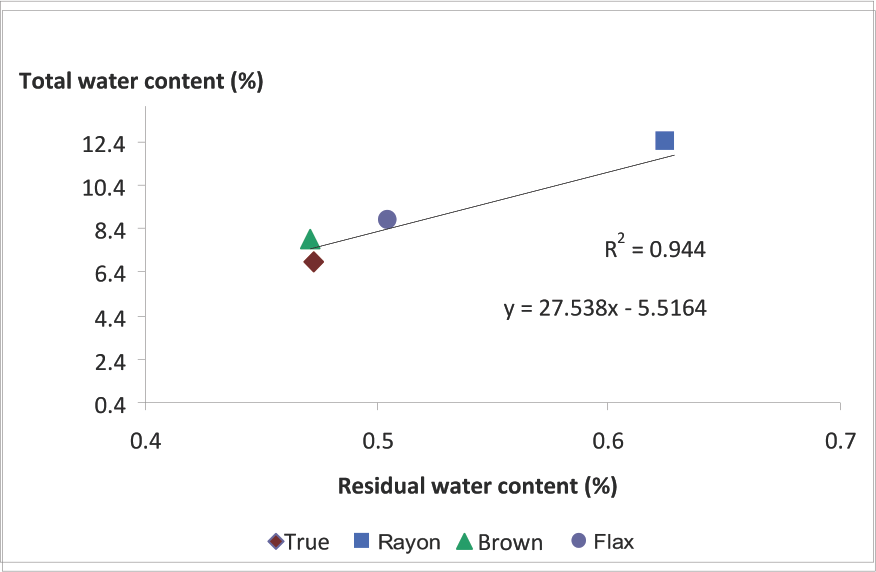
Water content: total vs. residual water content remaining in sample after oven drying. True is True Cotton and Brown is brown cotton.
Note in Table VII that ecwdis the difference between moisture and water content (Eq. 1). Our current knowledge, using weighing bottles as sample containers, is that six individual OD errors make up ecwdd in white lint (Eq. 2). The residual water (ersw) that remains after drying was the largest single error and was easily measured by KFT. However, measurement of the other five errors was difficult and time consuming so they are grouped together and their representation is given as ∑(eothers) (Eq. 4). The error etga∆ is the difference between TGA moisture content in air and that in nitrogen (Eq. 10). The next step in unraveling the errors to spot trends was to average the lower and higher ash results by group, and calculate the difference between the two (see II - I).
There were noticeable trends in the very last row of results. First, the amount of residual water that remained in the fiber after standard OD was essentially independent of ash content (ersw = 0.06%) and did not explain variability in the other errors. Second, the algebraic sum of errors ersw and ∑(eothers)increased with an increase in ash content so that II - I was positive. And third, the TGA difference in moisture content between air and nitrogen, etga∆, also increased with ash content so that II - I was positive.
Trends in standard OD errors—between moisture content in air and water content in nitrogen—were confirmed by similar differences between TGA moisture content in air and in nitrogen across four different cellulosic fibers. The impurities in the fiber seem to be involved in selective decomposition and oxidative processes in air. The extraneous material may limit the differences within sample and between samples, as was found with raw cotton and mechanically-cleaned cottons. 12
Differences between TGA/Gas Chromatography and KFT
The following response to a comment and question from a reviewer may be of interest to the textile community. First, if TGA is connected to a gas chromatograph (GC), then the amount of water can also be precisely obtained. This is true. However, what is the accuracy? If there is a documented TGA/GC test method with accuracy to 0.1% of the instrumental method—with, for example, a solid water standard added to the TGA sample holder—then TGA/GC and KFT for cellulosic fibers using nitrogen carrier gas should yield equivalent results. With TGA/GC air carrier gas, the rate of oxidation of cellulose may differ from that by KFT using nitrogen, and therefore, water contents may differ.
Next, what is the difference between TGA/GC and KFT? There are two main differences. The KFT system, including sealed sample vial, was closed from atmospheric moisture; our TGA balance pan was not closed from atmospheric moisture. The GC sensor selectivity for water is achieved by a GC column that separates water from the other volatile cellulosic impurities. By contrast, KFT selectivity for water is achieved by fact that the titration reaction itself consumes water.
Conclusions
The main goal of this research was to use the ASTM Karl Fischer Titration reference method 1 to accurately measure the water content of one sample each of mechanically-cleaned greige cotton (True Cotton), naturally colored brown cotton, fax, and rayon at moisture equilibrium. The KFT method uses a micro oven to vaporize the water in a sealed sample vial and dry nitrogen to transport the water vapor to a titration cell. Water content in the sample is proportional to the amount of KF reagent consumed.
NIR was used to ensure that no observable residual water remained in any of the fibers after KFT analysis. For all cellulosic fibers studied, the calculated selectivity for water over interfering substances equaled or exceeded the minimum value to retain an accuracy of 0.1%. To prevent a bias associated with volatiles from the heated samples on the working medium in the titration cell, we alternated six replicates of fibers and one replicate of a blank vial. 2 These preliminary results justify a larger study to confirm that D7785 may be extended to other cellulosic fibers.
In addition, the various cellulosic fibers were analyzed for moisture content by standard OD in ambient air, and iso-thermal TGA using dry air and nitrogen carrier gases. There were measurable differences between water and moisture contents by standard OD. KFT was used to help unravel the OD errors due to its selectivity for water. For example, residual water remaining in the sample after OD was measured by KFT and ranged from a low of 0.47% (True Cotton) to a high of 0.63% (rayon).
Isothermal TGA at 105 °C, in dry air and in nitrogen, was used to mimic the atmosphere in standard OD (ambient air) and KFT (nitrogen). There were measurable differences of weight loss (moisture content) by isothermal TGA in the two atmospheres. Paired differences between (standard OD and KFT) and between (TGA in air and TGA in nitrogen) showed similar trends. Programmed temperature TGA to measure thermal decomposition in air gave additional information (ash content) to help understand potential side reactions in OD of cellulose materials in air. The discrepancy between water content and moisture content among the fibers tested was highest for rayon, as it had both the highest water content and the highest residual water content after OD. Therefore, especially for high water content cellulose fibers, the KFT approach was more informative than simple OD.