
Abstract
Arteries undergo marked structural and functional changes in human and experimental hypertension that generally involve smooth muscle cell (SMC) hypertrophy/hyperplasia as well as abnormal extracellular matrix turnover. In this study we examined time courses of changes in SMC activity and matrix protein content in a novel mini-pig aortic coarctation model. Cell proliferation was evaluated by immunostaining of Ki-67, apoptosis was assessed by TUNEL, and phenotypic changes were monitored by immunostaining three SMC contractile markers (caldesmon, calponin, and smoothelin). Changes in medial collagen and elastin were examined by picrosirius red and Verhoeff–van Gieson staining, respectively. LabVIEW-based image analysis routines were developed to objectively and efficiently quantify the (immuno)histochemical results. We found that significant cell proliferation and matrix production occurred in the early stages of this coarctation model and then declined gradually; the SMCs also tended to exhibit a less contractile phenotype following these cellular and extracellular changes. Specifically, different aspects of the phenotypic changes associated with hypertension occurred at different rates: cell proliferation and collagen production occurred early and peaked by 2 weeks, whereas changes in contractile protein expression continued to decrease over the entire 8-week study period. Temporal changes found in this study emphasize the importance of simultaneously tracing time courses of SMC growth and differentiation as well as matrix protein production and content. SMCs are multifunctional, and caution must be used to not overdefine phenotype. This manuscript contains online supplemental material at http://www.jhc.org. Please visit this article online to view these materials.
Keywords
A
We used a porcine aortic coarctation model of hypertension (described in Materials and Methods) and quantified changes of key participants (fibrillar collagen, elastin, and SMCs) in aortic medial growth and remodeling at 2, 4, 6, and 8 weeks of development of hypertension. Medial SMC proliferation was examined by immunostaining for Ki-67, whereas apoptosis was evaluated by a TUNEL (terminal deoxynucleotidyl transferase-mediated dUTP nick-end labeling) assay. Total cell number was confirmed in standard hematoxylin and eosin (H&E) sections. Phenotypic modulation of smooth muscle was monitored by immunostaining for three standard SMC differentiation markers (Owens 1995): caldesmon, calponin, and smoothelin. Caldesmon (CLD) is a 120 kDa actin- and calmodulin-binding protein that has been detected in SMCs and various non-muscle cells (Sobue and Sellers 1991). Calponin (CLP) is a 32-kDa thin myofibrillar filament that acts as an actin-binding protein and is implicated in the auxiliary regulatory role of SMC contraction. CLP expression is restricted to SMCs and has been shown to be a marker of the contractile phenotype of developing smooth muscle (Gimona et al. 1990). Smoothelin (SML) is a 110-kDa cytoskeletal protein exhibiting a filamentous organization and is uniquely expressed in contractile phenotype of SMC (van der Loop et al. 1997). SML shows up very late during differentiation compared with CLD and CLP (Owens 1995); it does not belong to any particular class of structural proteins but appears to be a valuable marker for assessing SMC differentiation. When considered together, expression of these proteins is considered a more sensitive indicator of SMC differentiation than is the common use of α-actin alone. Collagen and elastin were stained with picrosirius red (PSR) and Verhoeff–van Gieson (VvG) and examined under polarized and normal light, respectively. New collagen synthesis was determined by staining with an antibody that detected the uncleaved propeptide of procollagen (I). To quantify both statistical differences and apparent time courses, we developed new image analysis programs using LabVIEW and its Vision module. Three types of quantification were performed: particle counting, staining percentage, and staining intensity. LabVIEW allows image processing (e.g., color thresholding and segmentation) and analysis (e.g., particle analysis and cumulative signal strength measurement) to be integrated within a single program, thus rendering overall analysis more effective and time efficient. Complex changes in cell and matrix biology were found to occur at different rates and extents during the early development of hypertension, thus emphasizing the importance of quantifying time courses.
Materials and Methods
Animal Model
Our aortic coarctation model for studying hypertension in the mini-pig is described elsewhere (Fossum et al. 2003). Briefly, a balloon-expandable occluder is pre-filled with a 50% dextrose solution, placed over a Gore-Tex soft tissue patch sheet, and secured with sutures around the aorta proximal to the diaphragm. The occluder is connected via stiff tubing to a vascular access port that is placed SC in the neck, which allows the occluder to be gradually inflated or deflated in a conscious animal. An indwelling pressure transducer is placed within the internal thoracic artery or right carotid artery and connected to an implanted telemetry unit. Arterial pressure and heart rate were recorded for 30 sec every 2 hr throughout each study period. Mean arterial pressure is defined as diastolic pressure plus one third the difference between systolic and diastolic pressure, and a daily average mean arterial pressure was used to track the condition of each animal.
The aorta was coarcted ∼1 week after surgery by adding small amounts of dextrose to the occluder over a 7- to 10-day period until the mean arterial pressure reached or exceeded 150 mmHg. Data were collected from 30 mature (7- to 16-month old) male mini-pigs: eight normotensive (NT) controls and 22 hypertensive (HT) animals. Specifically, aortas were harvested from true controls (n=4) without an occluder, from NT animals at 2 (n=3) and 4 (n=1) weeks following a sham surgery where an occluder was implanted but not inflated, and from hypertensive animals at 2 (n=6), 4 (n=6), 6 (n=4), and 8 (n=6) weeks after the animal reached its target mean arterial pressure (>150 mmHg). All animal care and use practices were approved by the University Laboratory Animal Care Committee at Texas A&M University.
Histology and Immunohistochemistry
Segments of aorta 3+ cm proximal to the occluder were dissected free of perivascular tissue and either fixed intact by immersion in 4% fresh paraformaldehyde for 1 hr or cut into sectors to release the residual stress prior to fixation (cf. Humphrey 2002). Tissues for positive control (e.g., lymph node, skin, and intestine from NT pigs) were handled and processed similarly. Lymph node was used as a positive control for TUNEL and Ki-67 because of high apoptosis and proliferation of immune cells at this site, skin was used as a positive control for immunostaining of procollagen (I) because it is a known site of collagen synthesis, and intestine was used as positive control for some of the smooth muscle differentiation markers because of its known expression.
Paraffin-embedded tissues were sectioned at 5 μm. Prior to staining, sections were deparaffinized and rehydrated. Sections were stained with H&E for general morphology, VvG for elastin (Bancroft and Gamble 2002), and PSR for fibrillar collagen (Junqueira et al. 1979) or immunostained for a panel of antibodies. Table 1 lists the antibodies examined as well as the optimal procedure for each antibody. Optimal procedures for antigen retrieval were determined by conducting both heat-induced epitope retrieval, which included trials of three retrieval solutions (citrate buffer, pH 6, EDTA, pH 8, and EDTA with urea, pH 8) and two heating procedures (microwave or pressure cooker) and enzyme digestion, which included incubation in trypsin, pepsin, or pronase at room temperature or 37C for different times. All incubations were performed in a humidified chamber at room temperature after antigen retrieval. Endogenous peroxidase was blocked with 3% hydrogen peroxide for 20 min. Slides were then incubated in blocking serum for 30 min to prevent nonspecific binding of antibodies. Slides were incubated with the primary antibody for 1 hr, washed, and incubated in a biotin-free, polymerized detection system (ImmPRESS reagent; Vector Laboratories, Burlingame, CA) for 30 min. Slides were then incubated with DAB substrate (Vector Laboratories) in the dark (for the time period indicated for specific antibodies in Table 1). Finally, slides were counterstained with hematoxylin, dehydrated, and coverslipped with Permount (Fisher Scientific; Pittsburgh, PA). To ensure standardization and reproducibility, sections were cut at the same thickness and stained in the same batch.
Image Acquisition and Quantification
The central medium was imaged using an Olympus BX51 light microscope customized for circularly polarized illumination (Hu et al. 2007) coupled with an Olympus DP70 digital camera (Olympus; Tokyo, Japan). Settings for microscopic illumination, exposure times, and color balance of the digital camera were maintained for each set of slides to enable subsequent comparisons. A 25% density filter avoided saturation problems when PSR-stained sections were imaged with circularly polarized light. For quantitative analysis, five representative 24-bit color images of 1360 × 1024 pixel resolution were acquired per specimen with a ×20 objective; those shown in the following figures were acquired at ×40 for better visualization. Image files were saved in tagged-image file format (TIFF).
Primary antibodies used for immunohistochemistry, their vendors, and pretreatments required to unmask the epitopes as well as optimal dilutions and DAB incubation time
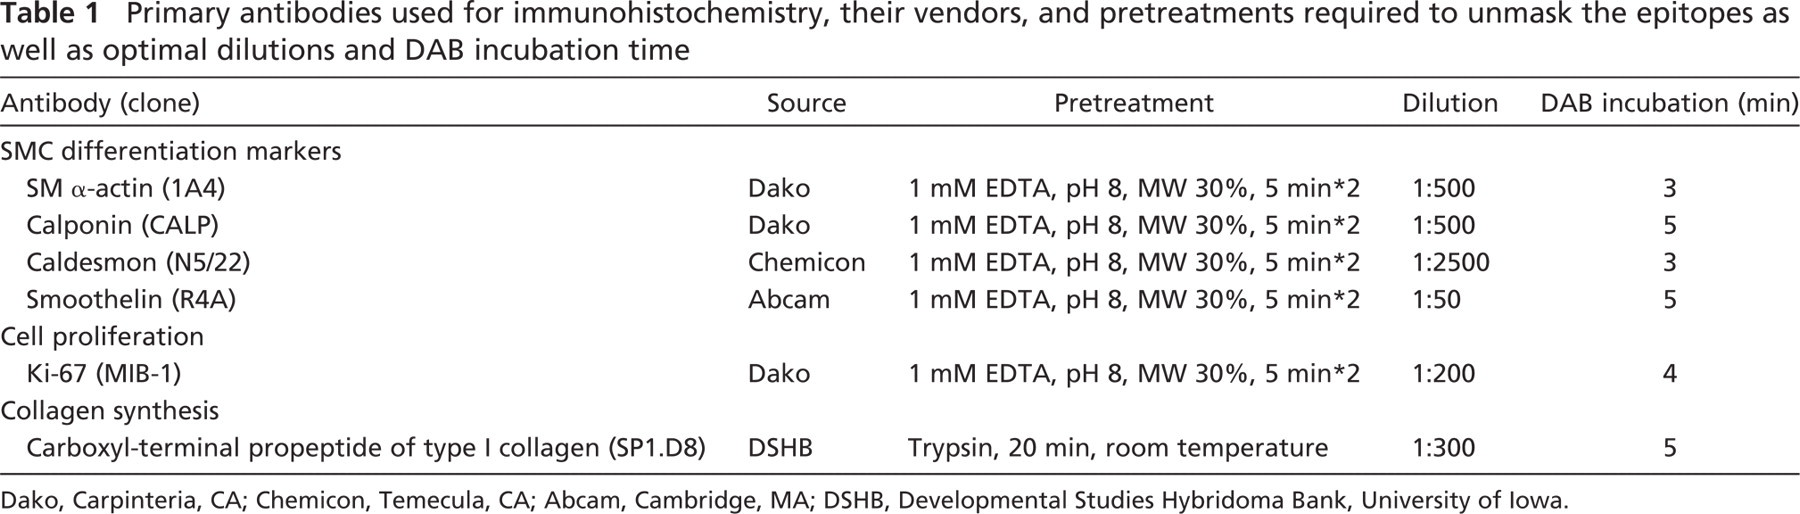
Dako, Carpinteria, CA; Chemicon, Temecula, CA; Abcam, Cambridge, MA; DSHB, Developmental Studies Hybridoma Bank, University of Iowa.
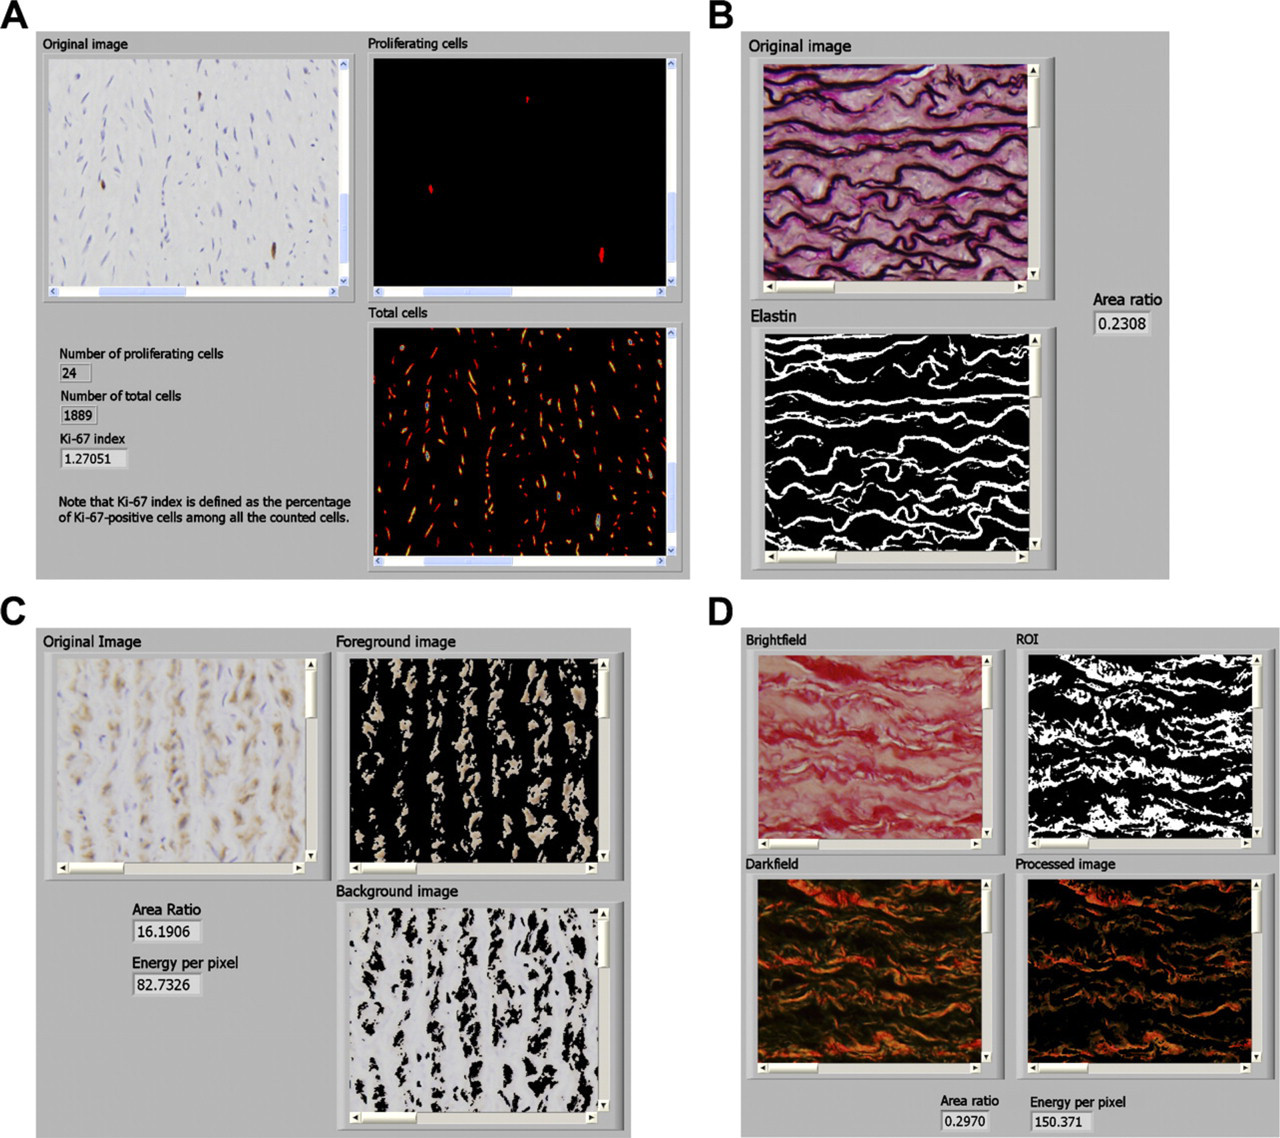
A LabVIEW routine containing a sequence of functions including color thresholds, fill hole, particle filter, reject border, danielsson, watershed transform, and particle analysis was developed and used to count SMC nuclei. Specifically, three-dimensional (3D) red, green, blue (RGB) thresholding (Russ 2002) was used to segment all nuclei (R: 0–255, G: 0–185, B: 0–255) and DAB-stained nuclei (R: 75–255, G: 0–255, B: 0–135). Particle analysis also generated information such as the area, hydraulic radius, orientation, and elongation of a nucleus, which can be used to estimate the 3D orientation of an individual cell (Walmsley and Canham 1979). Figure 1A shows the front panel of a representative LabVIEW VI with a demonstration (see also Supplemental Materials SM1 for the actual LabView VI).
Elastin, stained black with VvG, was segmented by another LabVIEW routine based on 3D HSL (hue, saturation, lightness) thresholding (H: 160–240, S: 120–255, L: 0–50) (Goto et al. 1992; Kohlberger et al. 1999). Thresholds in saturation and luminance efficiently excluded lightly stained black nuclei. Relative elastin content was evaluated by calculating the segmented area as a percentage of the total area (Figure 1B) (see Supplemental Materials SM2 for the LabView VI). Another 3D HSL thresholding was used to segment specific DAB-stained regions (H: 0–30, S: 12–255, L: 0–200) from nonspecific background stained regions (H: 150–30, S: 12–255, L: 0–200, followed by an inversion). This segmentation generates a region of interest, which if used as a mask permits selective processing and analysis of the original image. Figure 1C shows the front panel of the VI with an example (see Supplemental Materials SM3 for the actual VI).
Here we present staining intensity in terms of a normalized “energy” E that is defined as follows (Matkowskyj et al. 2000). In an N 1 × N 2 pixel image,
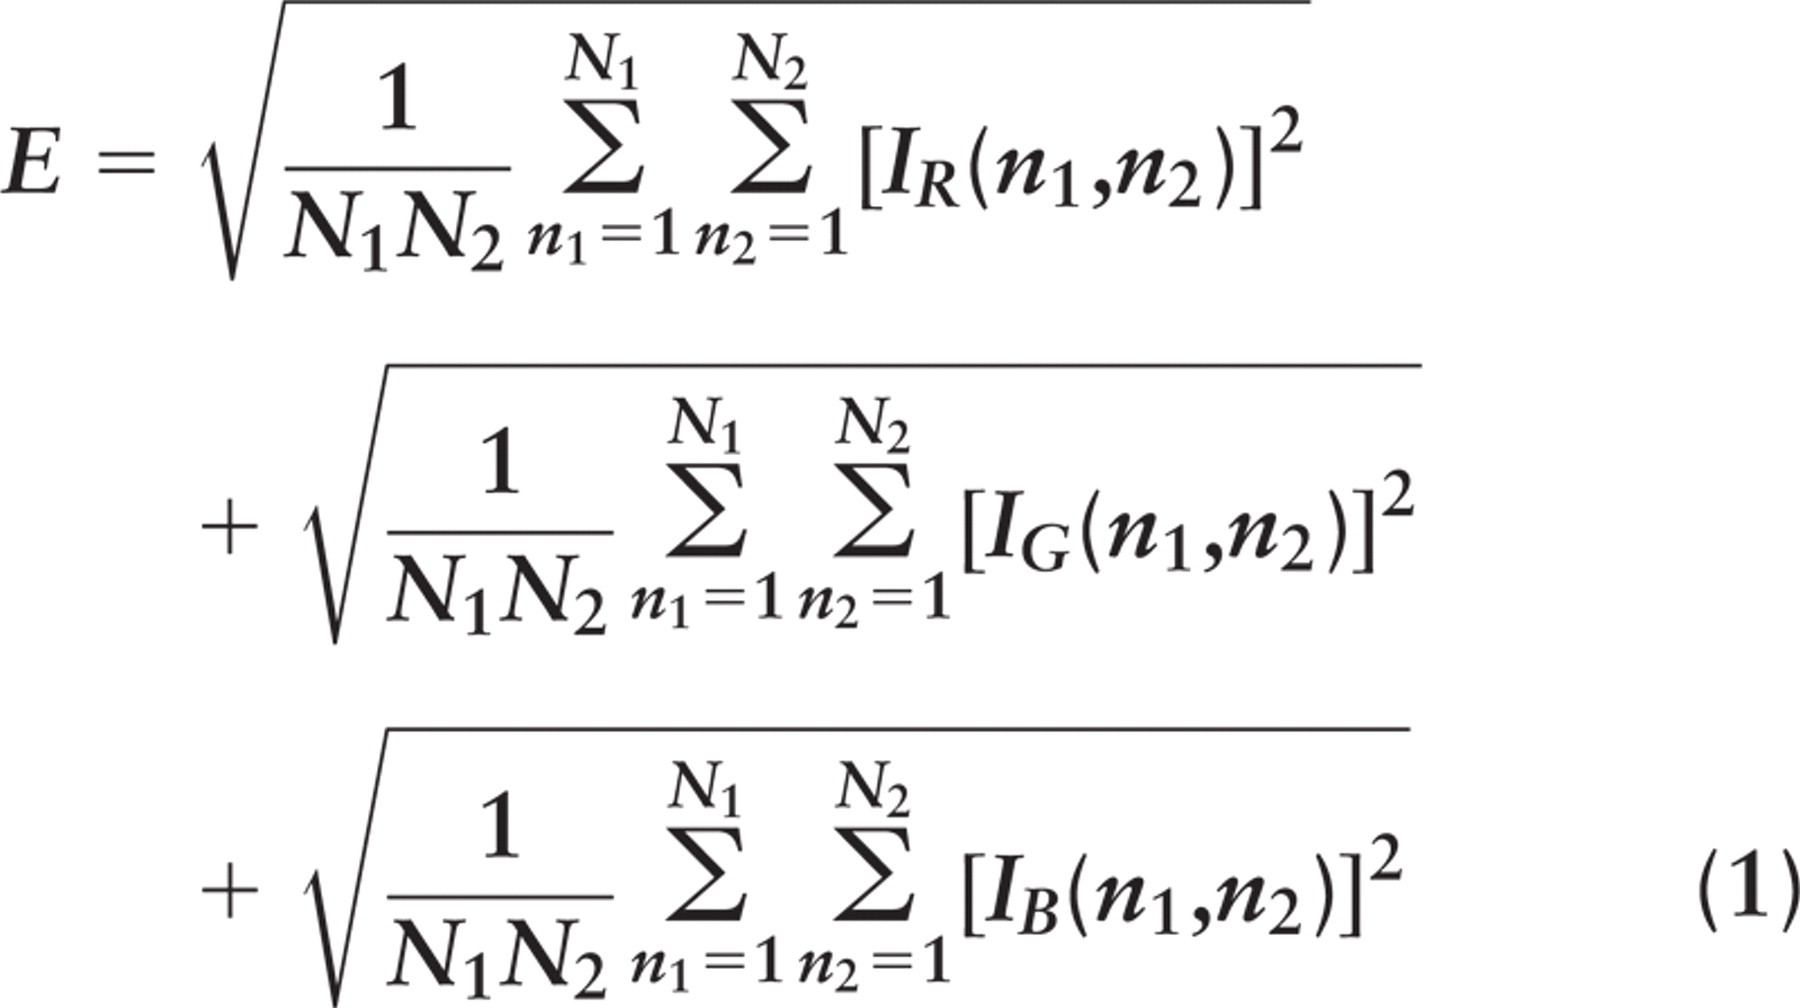
where Ii (n 1, n 2) is the energy contribution from color i = R, G, or B at position (n 1, n 2) of an image (n 1=1-N 1, n 2=1-N 2 pixels). For brightfield images (e.g., standard transmitted light), Ii (n 1, n 2) = 255-bi (n 1, n 2), noting that a brightness bi (n 1, n 2) = 0 corresponds to black, and a brightness of 255 corresponds to white; for darkfield images (e.g., birefringence or fluorescence), Ii (n 1, n 2) = bi (n 1, n 2).
(
After segmentation of foreground and background regions, the brightness of R, G, and B at each pixel in each region was extracted to calculate the corresponding normalized energy using Equation (1). A normalized energy contributed by a specific stain is

where subscripts s, f, and b stand for specific, foreground, and background staining, respectively. The stained percentage, defined as the area ratio of the foreground to the total image, Af/Atotal , was also determined. Relative SMC content was determined by the stained percentage of SM α-actin.
Another LabVIEW routine, based on Whittaker's method (Whittaker et al. 1994), was developed to measure relative collagen content and its normalized energy (Figure 1D) (see Supplemental Materials SM4 for the actual LabView VI). Briefly, red regions, segmented by 3D HSL thresholding (H: 130–0, S: 80–255, L: 0–255), in the brightfield image were used as a mask to exclude birefringence from muscle on darkfield images. Relative collagen content was defined as the birefringent region divided by the total region. Similarly, the intensity of birefringence was represented by the normalized energy. If we let REC be relative elastin content, RCC be relative collagen content, and RSC be relative SMC content, then relative ground substance content = 1-REC-RCC-RSC, assuming that elastin, collagen, SMCs, and ground substance (i.e., the amorphous material consisting primarily of proteoglycans) that is not visible in standard histological sections (Fawcett 1986) are the four primary structural components of the aortic media. Note that inter- or intralaboratory variations in (immuno)histological staining may affect these thresholds; those that reach best separation should be determined empirically.
Statistical Analysis
Mean staining parameters were calculated for each animal based on five representative images. Differences between groups (e.g., NT and 2, 4, 6, or 8 weeks of HT) were assessed via one-way ANOVA in conjunction with Holm–Sidak posthoc testing, with an overall significance level p=0.05. Results are reported as mean ± SE.
Results
The 24-hr average mean arterial pressures in the HT animals (151 ± 3 mmHg at 2, 174 ± 4 mmHg at 4, 172 ± 8 mmHg at 6, and 181 ± 8 mmHg at 8 weeks) were significantly different from those in the NT animals (131 ± 2 mmHg) at each end-point. Notwithstanding the increase in pressure over time during hypertension, the overall averaged mean arterial pressures were 131 ± 2 mmHg in NT and 169 ± 4 mmHg in HT, which were also significantly different (p<0.001). The average pulse pressures in HT at 2 (49 ± 2 mmHg), 4 (58 ± 5 mmHg), and 8 (55 ± 5 mmHg) weeks differed significantly from those in NT animals (36 ± 3 mmHg); if grouped separately, the averaged pulse pressures were 36 ± 3 mmHg in NT and 54 ± 2 mmHg in HT, which were also significantly different (p<0.001).
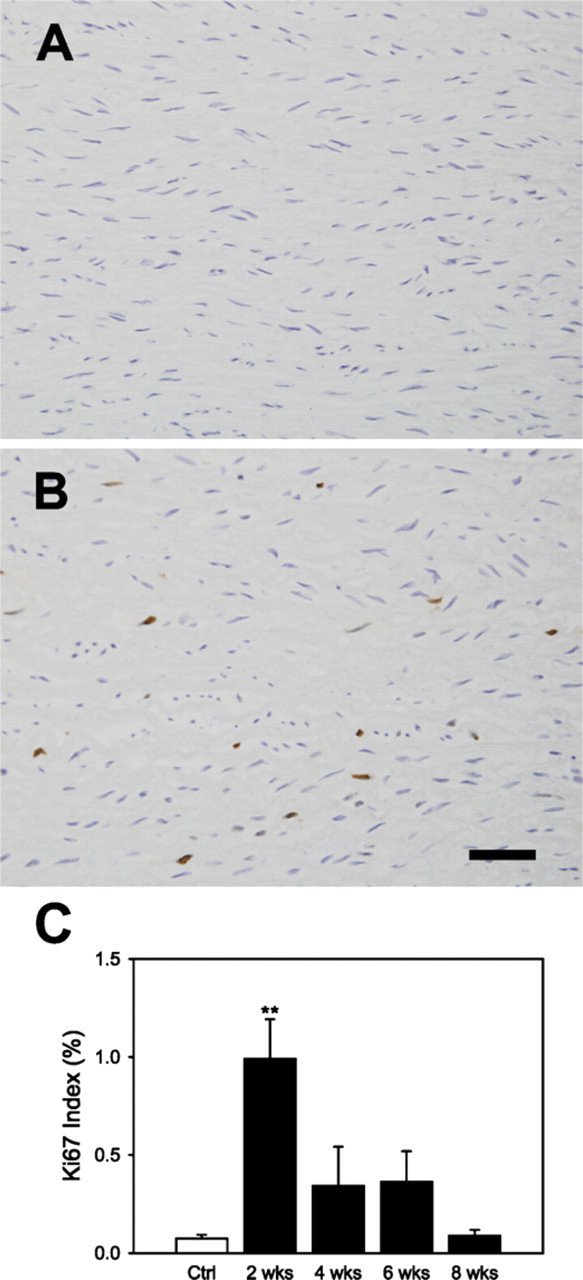
The Ki-67 antigen is present during all active phases of the cell cycle (G1, S, G2, and M) but absent in resting cells (G0); it is thus an excellent marker for cell proliferation. Ki-67 stained nuclei appeared to be distributed evenly throughout the central media in all samples (cf. Figures 2A and 2B). We found an increased Ki-67 index in the central media at 2, 4, and 6 weeks of HT although only 2 weeks reached statistical difference when compared with NT controls; similarly, the number of total nuclei per sectional area reached statistical significance only at 2 weeks of HT, thus suggesting that heightened activity was particularly strong early on (Figure 2C). Future studies should thus examine time points earlier than 2 weeks during the development of hypertension.
(
TUNEL assay, which demonstrates insitu DNA fragmentation, a hallmark for apoptosis, showed strongly positive reactions on both intimal cells and fibroblasts in the adventitia in the early stage of HT (data not shown), but no marked staining in the media over the 8-week study period.
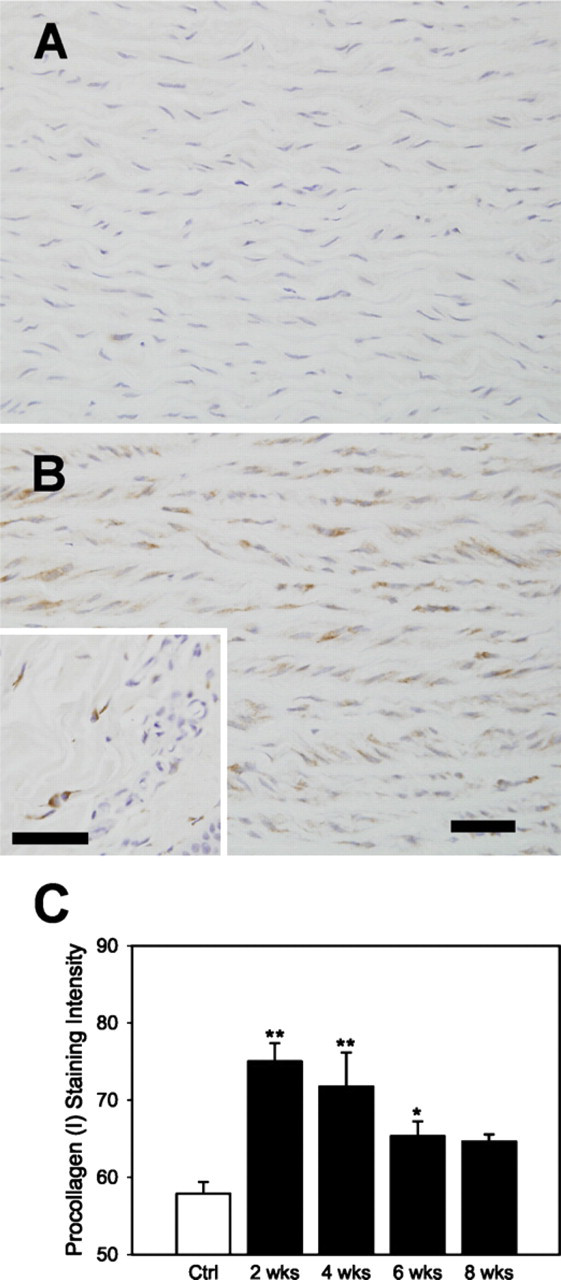
Soon after release of procollagen (I) into the extracellular space, the amino propeptides and then the carboxyl propeptides are cleaved (Davidson et al. 1975). Antibodies to the amino- or carboxyl-terminus of procollagen (I), which only bind to intracellular procollagen (I), can thus be used to examine new collagen (I) production and its localization (Botney et al. 1993). Staining intensity of procollagen (I) was increased relative to control in all HT specimens (Figures 3A and 3B) but was highest at 2 weeks (Figure 3C).
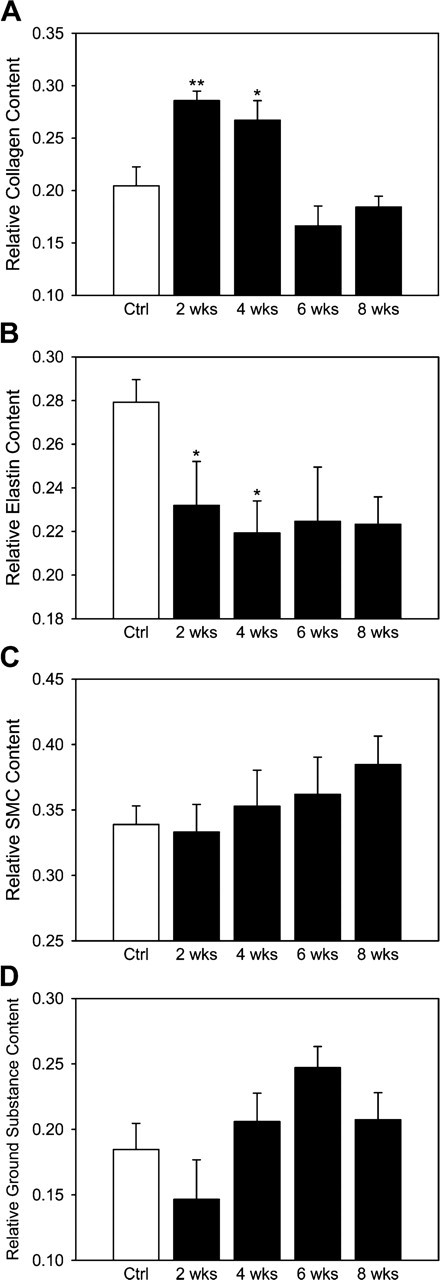
Viewed under circularly polarized light, PSR-stained sections demonstrated the lamellar structure of medial collagen. Computer-assisted morphological analysis showed that relative collagen content increased in HT animals at 2 weeks, stayed high at 4 weeks, but declined toward baseline at 6 weeks. On the other hand, normalized energy for fibrillar collagen, which represents collagen density per sectional area, peaked at 2 weeks of HT (p<0.05) and then returned to the normal value at 4 weeks and remained so thereafter (Figure 4A).
Analysis also showed that the relative elastin content in HT decreased significantly (p<0.05) at 2 and 4 weeks of HT but remained at a similar level thereafter with no statistical difference from NT (Figure 4B). As the ratio of collagen and elastin is often used as an index of arterial stiffening, note that this ratio increased at 2 and 4 weeks of HT (p<0.005) but returned to baseline after 6 weeks: 0.75 ± 0.09 for NT and 1.27 ± 0.12, 1.25 ± 0.11, 0.80 ± 0.20, and 0.83 ± 0.08 at 2, 4, 6, and 8 weeks of HT (cf. Olivetti et al. 1982; Levy et al. 1994). There was no significant difference among NT and each HT for relative SMC content or the bulk ECM represented by components other than elastin or collagen (Figures 4C and 4D).
Despite no statistical difference in staining intensity of SM α-actin among groups, the medial SMCs appeared to modulate their phenotype from contractile to more synthetic in HT in terms of expression of caldesmon (CLD), calponin (CLP), and smoothelin (SML) (Figure 5). Posthoc multiple comparisons to controls showed that staining intensity of CLD reached statistical significance at 4 weeks of HT (p<0.005) and remained at 6 (p<0.05) and 8 (p<0.005) weeks of HT (Figure 6A). Staining intensities of CLP did not differ statistically between NT and HT, but temporal changes appeared similar to that of CLD (Figure 6B). Temporal changes in the staining intensity of SML were slightly different from that of CLD and CLP; it decreased as hypertension advanced but was not significantly different from the control until 8 weeks of HT (Figure 6C). Note that there was no significant difference between NT and HT in terms of stained percentage for the three SMC differentiation markers.
(
Relative contents (mean ± SEM) obtained from image analysis with
statistical comparison. (
Discussion
Diverse growth responses by SMCs and deposition patterns of ECM proteins have been reported separately for the many different vessels and durations of hypertension that have been considered via different animal models (e.g., Gabbiani et al. 1979; Olivetti et al. 1982; Owens and Reidy 1985; Baumbach and Hajdu 1993; Pauletto et al. 1994). As a result, it has been difficult to mathematically model time courses of changes in cellular and matrix activity, which is essential for understanding how the arterial wall responds to hypertension (Rachev et al. 1998; Gleason and Humphrey 2004). One goal of this work, therefore, was to quantify together the time courses of cellular and matrix changes in the aorta of a single model of hypertension over an extended (8 week) period. The porcine aorta is preferred over rodent aorta because the thicker media allows better quantification of (immuno-)histological findings, particularly for cell proliferation or apoptosis. That is, whereas mouse and rat thoracic aorta consist of only 5–7 and 6–8 musculoelastic layers, respectively, the porcine thoracic aorta consists of 60–70 layers that delimit the many medial smooth muscle cell layers (Wolinsky and Glagov 1969). The porcine vasculature is also thought to be closer to that of humans than the rodent vasculature (Johnson et al. 1999).
We found increased cell proliferation at 2, 4, and 6 weeks, but not at 8 weeks, of HT compared with NT controls, reaching statistical significance at 2 weeks of HT. Accordingly, cell number per sectional (unit) area also peaked at 2 weeks of HT. Altered cell numbers in cross-sectional images may have been due to hyperplasia or changes in orientation (e.g., cells becoming more longitudinal and less circumferential), but the former is more likely because the percentage of round cells, determined by quantifying elongation via the particle analysis, did not change at 2 weeks of HT (data not shown). Starting at 4 weeks of HT, there was no increase in cell number per sectional area, whereas cells kept proliferating without strong indication of cell death. This suggested an increase in absolute volume occupied by SMCs. Indeed, gross morphological analyses revealed an increase in wall thickness at 2 and 4 weeks of HT, which may have been due to both cell proliferation and matrix production. Our overall findings are thus consistent with results from Xu et al. (2001) who found that proliferation of medial SMCs was induced rapidly (within 3 days) after acute coarctation of the rat aorta and continued for 2 weeks, whereas no increased apoptosis was found until 4 weeks. We did not observe obvious staining of TUNEL in the media throughout the 8-week study. This suggests that both proliferation and apoptosis were delayed in our porcine model in which the coarctation was induced gradually over a 7- to 10-day period, rather than acutely as in most rodent models.
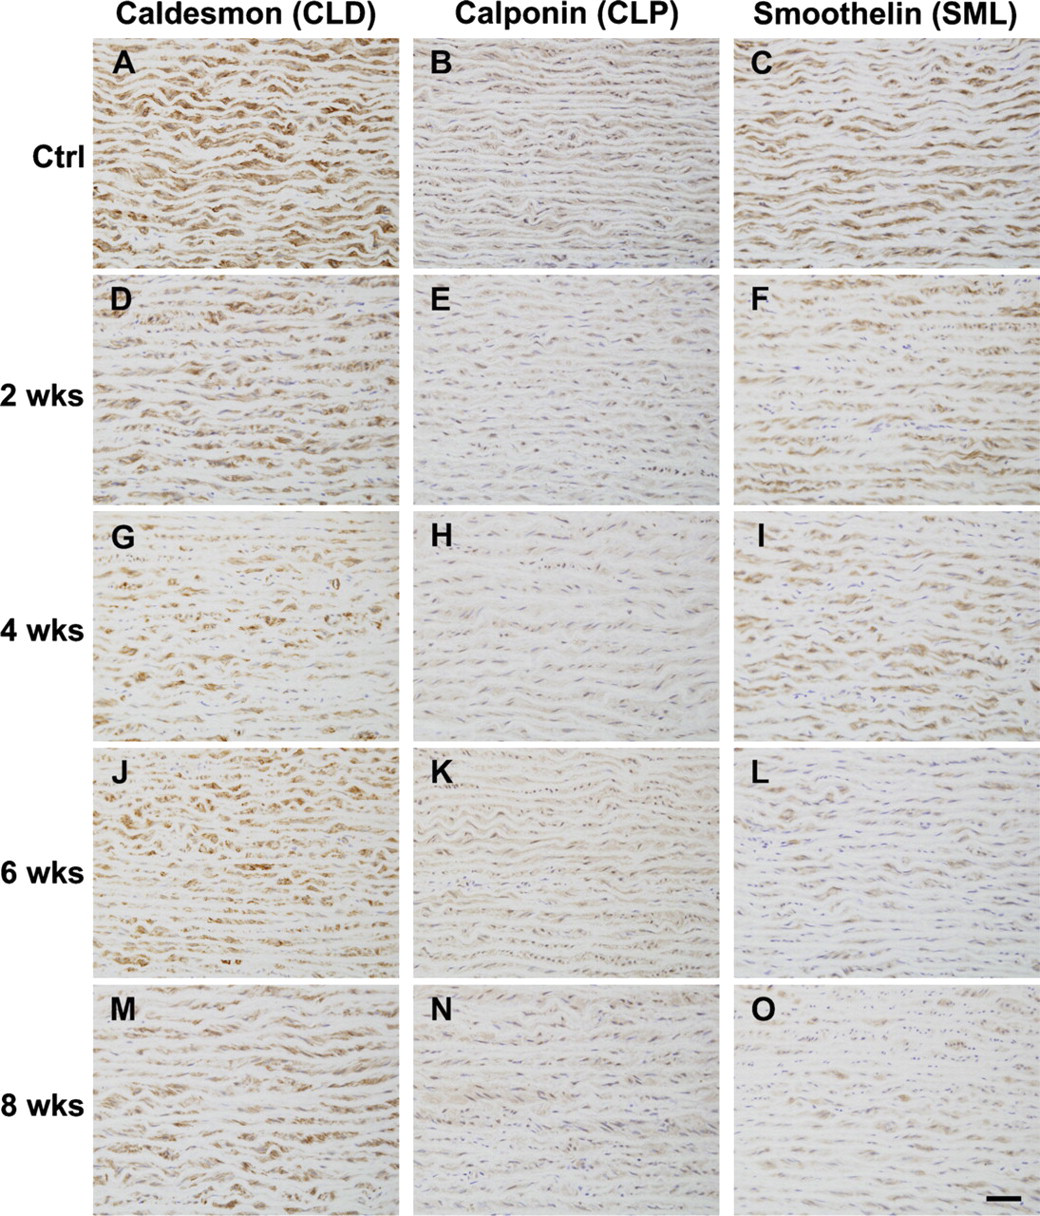
Micrographs of immunohistochemical staining of porcine aorta with anti-CLD
(
Changes in absolute and relative quantities of collagen and elastin typically reflect changes in passive mechanical properties (Wolinsky and Glagov 1964), provided there are no major changes in orientation or crosslinking of these fibers. An abnormal turnover of elastin and collagen can thus lead to a maladaptive response, which in turn can contribute to the progression of the disease. Relative collagen content was increased at 2 weeks of HT, stayed high at 4 weeks, and declined to baseline level at 6 weeks, although the normalized energy (Equation 1) was significantly higher only at 2 weeks of HT. Although these findings correlated with the expression of procollagen, which peaked at or before 2 weeks of HT and remained thereafter, they suggested that collagen degradation may have started by 4 weeks of HT. Although we did not measure imbalances in matrix metalloproteinase–tissue inhibitor of metalloproteinases (MMP-TIMP) activity, a shorter half-life of arterial collagen has been reported in hypertension (e.g., decrease from ∼70 days in NT to ∼17 days in HT rat aorta) (Nissen et al. 1978). Hence, the decrease of relative collagen content at 6 and 8 weeks of HT may have been due to enhanced collagen degradation, similar to time courses of MMP activity in arterial injury models (Strauss et al. 1996). Using a similar rabbit aortic coarctation model (Xu et al. 2000), it was found that collagen (I) increased at 3 days, remained high at 1, 2, and 4 weeks, and decreased toward normal by 8 weeks, again consistent with our results.
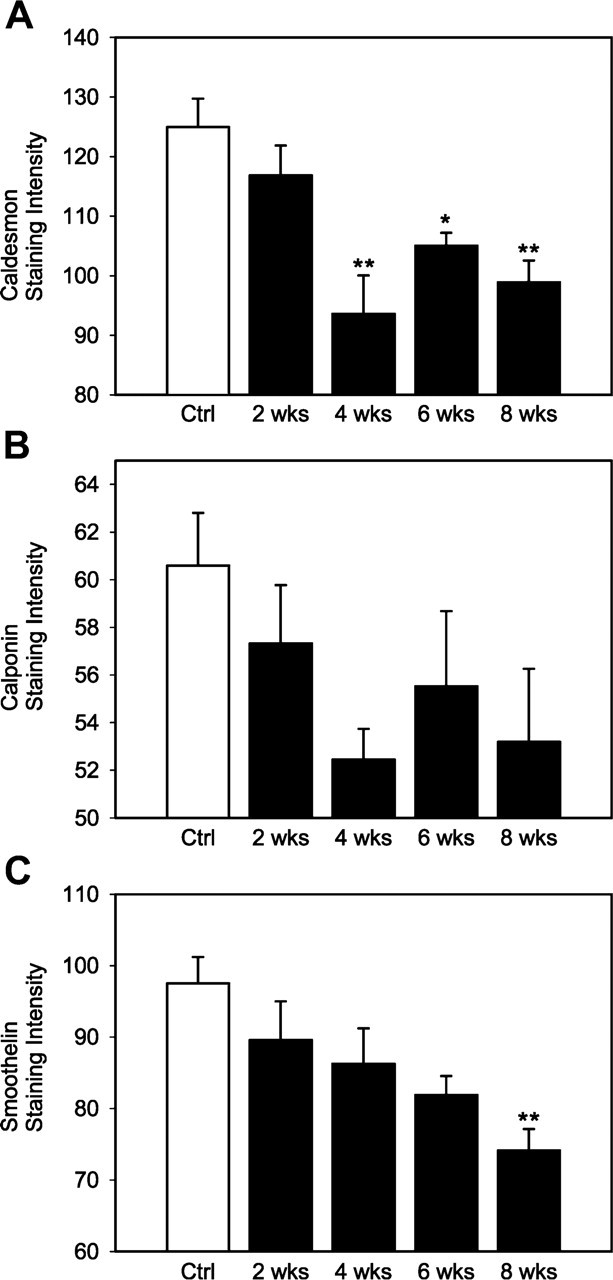
Time course of staining intensity (mean ± SEM) of SMC contractile
markers obtained from image analysis. (
The relative elastin content in the HT animals decreased at 2 weeks and remained at a similar level thereafter. There are contradictory reports regarding changes in arterial elastin due to hypertension, which may be due to the use of different animal models, methods of analysis (chemical vs morphometric approaches), or definitions of content (e.g., relative content can change while absolute content remains unchanged). Wolinsky (1970) chemically assessed collagen and elastin content in the aorta of DOCA-salt hypertensive rats and reported that neither protein was significantly different between NT and HT. In contrast, a morphological study of the aorta of spontaneously hypertensive rats showed an increased collagen content in the media but showed similar absolute elastin content compared with controls (Levy et al. 1994). Our findings are not consistent with these results.
Phenotypic modulation of SMCs, manifested as increased rates of proliferation, migration, and synthesis of ECM proteins and decreased expression of SMC-specific/-selective marker genes, has been reported in atherosclerosis and hypertension (Owens et al. 2004). In addition to SM α-actin, we examined expression of three primary SMC-specific markers by immunohistochemistry. Staining intensities of CLD, CLP, and SML were all decreased at 4 weeks of HT, with similar temporal changes in CLD and CLP but not SML. This may be due to the distinct promoters involved in their gene transcription (Yoshida et al. 2004). Different staining patterns of SMC differentiation markers also demonstrated that the aortic medial SMCs may represent a spectrum of SMC phenotypes.
Most studies of phenotypic modulation of vascular SMCs have focused on neointimal development associated with atherosclerosis or restenosis. Very few have examined the time course of phenotypic changes in the media of large arteries. Regan et al. (2000) reported decreased immunostaining for SM α-actin and SM myosin heavy chain 7 days after injuring the carotid artery with a wire, with slightly increased staining for both markers by 14 days (see their Figure 2). If one focuses on these markers in the media, however, staining appears to decrease further than that of 7 days after injury. Note that they only qualitatively describe their immunostaining. It is of interest that at 2 weeks of HT when vigorous cell proliferation and collagen (I) production were observed, there was no significant difference between HT and NT in terms of SMC differentiation marker staining intensities. This suggested that the medial SMCs expressing contractile proteins could also proliferate and actively synthesize ECM proteins. Indeed, this was found by double staining at 2 weeks of HT (data not shown), which showed coexistent staining of Ki-67 and SMC differentiation markers in the same SMCs. Owens et al. (1986) similarly found that loss of SM α-actin was not a prerequisite for initiation of cell proliferation in cultured rat aortic SMCs. Furthermore, the medial SMCs continued to modulate their phenotype as determined by decreased expression of the SMC differentiation markers after 2 weeks of hypertension, whereas cell proliferation and collagen production did not correlate with this phenotypic change, which contrasts with the accepted phenotypic changes of SMCs in neointimal development (Owens 1995; Thyberg 1998).
Drawbacks of visual scoring of immunostaining include inter- and intra-observer bias and difficulty of statistical analysis due to a lack of consistent grading. In this study, LabVIEW-based image analyses provided a consistent description of staining patterns [e.g., SMC differentiation markers and procollagen (I)] and allowed quantitative comparison between HT and NT. It was challenging, if not impossible, in pilot studies to infer results from immunostaining without computer-assisted image analysis.
Segmentation of regions of interest (e.g., DAB-stained brown) from background has a significant impact on quantification of staining parameters. In general, two types of color segmentation are generally used based on dependencies on background color: (a) use of information on the foreground color only (e.g., blue channel, combined HSL, and combined RGB) (Russ 2002) and (b) use of color contrast between foreground and background (e.g., G/B) (Montironi et al. 1996), normalized colors (Ohta et al. 1980; Brey et al. 2003), and spectral ratio (Ornberg et al. 1999). We adopted 3D color thresholds (either combined HSL or RGB) to segment regions of interest because they require no information on the background color (and thus is a better choice for multicolor immunohistochemistry or special staining) while providing the best results among the first type (Brey et al. 2003). A set of predefined HSL (or RGB) thresholds was applied for all sections, which allowed more objective selection compared with using the Magic Wand in conjunction with Similar commands (Photoshop; Adobe Systems, San Jose, CA) (Lehr et al. 1997; Matkowskyj et al. 2000). The latter may yield different staining areas when subtly different colors are selected. This is, in fact, common to all interactive thresholding procedures. Quantitative immunohistochemistry often determines the amount of antigen by calculating the mean optical density (MOD) of selected regions using Photoshop or NIH image. With appropriate dilutions of antibodies, the MOD of immunostaining region relates linearly to the stained protein level (Rahier et al. 1989); such correlations have been shown in many other studies (Venter et al. 1987; Dias et al. 2000). The MOD depends, however, on the formula converting the color to the gray-scale image [e.g., gray scale = 0.3×R + 0.59×G + 0.11×B or gray scale = B − 0.3×(R+G)]. That is, MOD is excellent for evaluating the amount of a monochromatic chromogen but not as good for a spectrum of browns. On the other hand, cumulative signal strength (Matkowskyj et al. 2000), which considers equal contributions of three colors (red, green, and blue), is a better choice when accounting for a broad range of brown DAB staining as in this study and validated experimentally elsewhere (Matkowskyj et al. 2003).
Whereas existing algorithms require a series of user inputs for each image, the object-oriented programming of LabVIEW integrates all image processing and analysis as an assembly line, making the process less labor intensive (cf. Lehr et al. 1997; Matkowskyj et al. 2000; Tolivia et al. 2006). The Vision module of LabVIEW, which contains a variety of functions for both image processing and analysis, also provides flexibility for different applications including studies of cellular and extracellular changes in cancers or cardiovascular diseases. Once the routine is developed, standalone executable files with user-friendly interfaces can be distributed to others who have the LabVIEW run-time engine (downloadable at no cost from www.ni.com).
In summary, there is a pressing need to predict growth and remodeling of arteries in response to altered mechanical environments and to elucidate the underlying mechanisms. Temporal changes found in this study emphasize the importance of simultaneously tracing time courses of SMC growth and differentiation as well as matrix protein production and content. Moreover, as confirmed by our data, SMCs are multifunctional and caution must be used to not overdefine phenotype. Clearly, additional data will be needed to develop a predictive mathematical model of pressure-induced growth and remodeling, and objective immunohistochemical analyses will continue to play an important role. In particular, attention should be given to the development of kinetic models, which in turn may aid in the design of new treatment strategies to prevent maladaptations in hypertension and to help provide directions for tissue engineering of vascular grafts.
Footnotes
Acknowledgements
This research was supported by Grant HL-64372 from the National Institutes of Health via the Bioengineering Research Partnerships Program.
We thank Rosemary Vollmar and Jan Patterson for expert technical assistance. The procollagen type I (SP1.D8) developed by Dr. Heinz Furthmayr was obtained from the Developmental Studies Hybridoma Bank at the University of Iowa.