
Abstract
The main sites of longitudinal growth in skeletal muscle are the ends of the fibers. This study tests the hypothesis that satellite cells (SCs) are at a greater frequency (#SC nuclei/all nuclei within basal laminae) and concentration (closer together) within growing fiber ends of posthatch chicken pectoralis. SCs were localized by their Pax7 expression, and fiber ends were identified by their retention of neonatal myosin heavy chains and small cross-sectional profiles. Whereas SC frequency decreased from about 20% at 9 days posthatch to <5% at 115 days, fiber ends retained a frequency of ∼16%. Calculated mean area of sarcolemma per SC revealed higher concentrations of SCs at fiber ends. There was also a strong inverse correlation between SC frequency and fiber profile cross-sectional size throughout development. This study suggests that SCs at fiber ends play a key role in the longitudinal growth of muscle fibers, and that fiber profile size may impact SC distribution.
S
The ends of skeletal muscle fibers have been shown to be highly active sites of postnatal growth and the main sites for the longitudinal growth of muscle. New sarcomeres are added in series to the ends of existing myofibrils during normal longitudinal growth of the muscles of mammals (Williams and Goldspink 1971; Goldspink 2003) and fish (Ennion et al. 1999). In those mouse muscles in which fibers are arranged in series, overlapping one another from origin to insertion of the muscle, longitudinal growth of the fibers also produces an increase in diameter of the muscle (Paul and Rosenthal 2002). Nuclei are preferentially added to the ends of growing myotubes in rats (Zhang and McLennan 1995). In experimentally induced lengthening of immature leg muscle of rabbits, a greater proportion of SCs expressing proliferating cell nuclear antigen were located at the musculotendinous junction than in other regions of the muscle (Tsujimura et al. 2006).
The pectoralis muscle of the chicken is composed of overlapping fibers arranged in series (Gaunt and Gans 1992; Trotter 1993). Consequently, a transverse section anywhere through the belly of the muscle will include the profiles of many fiber ends (Rosser et al. 1995, 2000, 2002). Distinct myosin heavy chain (MyHC) isoforms are sequentially expressed within the fibers of developing chicken pectoralis (Bandman and Rosser 2000). Embryonic isoforms are supplanted by a neonatal isoform that is in turn replaced by an adult isoform. In each muscle fiber, replacement of neonatal by adult MyHC isoform progresses from the centrally located motor end plate towards the tapered ends of the fiber (Rosser et al. 2000). Fiber end profiles invariably have the smaller diameters and retain densities of neonatal myosin comparable to those observed in neonatal muscle (Rosser et al. 1995, 2000). We have previously shown that myonuclei are more concentrated (located closer to one another) at the ends of maturing fibers of posthatch chicken pectoralis (Rosser et al. 2002).
Questions remain concerning the distribution of SCs within skeletal muscles. SCs tend to be more concentrated near specific anatomic structures such as blood capillaries and motor end plates (Schultz and McCormick 1994; Christov et al. 2007). Along the rest of the length of individual muscle fibers, SCs have been described as either evenly (Snow 1981) or randomly (Novotova and Uhrik 1992) distributed. The frequency of SCs and number of SC nuclei divided by the sum of myonuclei and SC nuclei has been commonly used to study the distribution of SCs (Schmalbruch and Hellhammer 1977; Gibson and Schultz 1983; Hikida et al. 1998; Roth et al. 2000; Sajko et al. 2002). This frequency was found to vary among species (Castillo de Maruenda and Franzini-Armstrong 1978; Novotova and Uhrik 1992), muscles, and different fiber types (Schmalbruch and Hellhammer 1977; Schultz and McCormick 1994). The trend in temporal distribution for most species and muscles studied showed a decrease in SC frequency and number with age (Snow 1977; Gibson and Schultz 1983; Hawke and Garry 2001; Shefer et al. 2006).
This article elucidates temporal and spatial patterns of SC distribution in the posthatch chicken pectoralis. We test the hypothesis that there is a greater frequency and concentration of SCs at the ends of growing post-hatch muscle fibers. We examine some of the same chicken pectoralis samples used in our previous studies (Rosser et al. 2000, 2002). Using immunocytochemical techniques that include an antibody against Pax7, we detected SCs among different regions of the muscle fibers during maturation. Whereas the frequency of SCs is significantly reduced with age, it remains high at the ends of the fibers where SCs are also located closer to one another. Some of these findings have been presented as a conference abstract (Allouh and Rosser 2006).
Materials and Methods
Animals and Tissue Preparation
Female White Leghorn chickens (Gallus gallus; Hy-Line W-36, Clark Hy-Line, Brandon, Canada) were hatched at the same time and raised under identical conditions at the University of Saskatchewan, Department of Animal and Poultry Science, as described in our previous studies (Rosser et al. 2000, 2002). Following the Canadian Council on Animal Care Guidelines and with the approval of the University of Saskatchewan Committee on Animal Care and Supply, three birds were killed by cervical dislocation at each of the following ages: 9, 23, 30, 49, 62, 79, and 115 days posthatch. Muscle samples were excised from superficial regions of the cranial half of the main part of the left pectoralis muscle (M. pectoralis pars sternobrachialis; Vanden Berge and Zweers 1993) of each bird. Each sample was approximately 0.5 × 0.5 × 1–2 cm. The long axis of each sample was parallel to the direction of the muscle fibers. Each sample was then coated with OCT compound (Miles Inc.; Elkhart, IN), immediately frozen in 2-methylbutane cooled via liquid nitrogen (Sewry and Dubowitz 2001), and then stored at −80C. Serial cross-sections of samples were cut at 10-μm thickness at −20C using a cryostat. Every two serial sections were picked up on a ProbeOn Plus microscopic slide (Fisher Scientific Ltd.; Toronto, Canada). Serial slides bearing sections were numbered and stored at −20C. Using these same methods, some longitudinal sections were also obtained from each animal.
Antibodies, Nuclear Labeling, and Immunocytochemical Techniques
Three previously characterized primary antibodies were each diluted in blocking solution (see following). Anti-Pax7 (Developmental Studies Hybridoma Bank; Iowa City, IA) (Berggren et al. 2001) is a mouse monoclonal used at 1:100 to label SC nuclei. Anti-laminin (L9393; Sigma, St Louis, MO) (Tisay and Key 1999) is a rabbit polyclonal used at 1:200 to detect basal laminae. Anti-neonatal MyHC (2E9; gift from Dr. E. Bandman) is a mouse monoclonal used at 1:500 to label the neonatal MyHC isoform of the chicken (Bandman 1985; Moore et al. 1992). Fluorescein isothiocyanate-conjugated anti-mouse and tetramethylrhodamine anti-rabbit secondary antibodies (A-11010 and A-11001; Molecular Probes, Eugene, OR) were used, respectively, to label anti-Pax7 green and anti-laminin red when viewed with epifluorescent microscopy. Each of these secondary antibodies was prepared at 1:200 in PBS (see following). Hoechst 33258 (Bisbenzimide; Sigma) was applied at 1:1,500,000 in PBS to label the DNA in nuclei blue under epifluorescent microscopy. Biotin-conjugated anti-mouse secondary antibody (B-9904; Sigma) was used at 1:500 to visualize labeling of neonatal myosin by the anti-neonatal MyHC antibody when viewed under brightfield microscopy.
Serial numbered slides of muscle cross-sections were removed from the freezer and air dried for 15 min. Sections were treated for 30 min with blocking solution, which consisted of 5 mM EDTA in PBS (0.02 M sodium phosphate buffer, 0.15 M sodium chloride, pH 7.2), 5% goat serum, and 1% BSA. Slides were then alternatively treated either with the anti-neonatal MyHC antibody for brightfield microscopy or with anti-Pax7, anti-laminin, and Hoechst for epifluorescent microscopy. Using this approach, the type of fiber profile (neonatal, transforming, or adult) can be identified on one slide, whereas SC nuclei and myonuclei within the same fiber can be located in the serial sections on the adjacent slide. Appropriate controls included slides with blocking solution in place of primary antibody.
Anti-neonatal MyHC was applied over sections for 70 min and biotinylated goat anti-mouse secondary antibody for 30 min. The related immunocytochemical protocol followed our earlier studies (Rosser et al. 2000, 2002). Briefly, the Avidin ABC kit (Vector Laboratories; Burlingame, CA) diluted in PBS was applied over the sections that were then kept in the dark for 60 min. To obtain a specific color reaction visible under the brightfield microscope, slides were immersed in 0.05% DAB in PB for 5 min.
Anti-Pax7 and anti-laminin primary antibodies were placed together over the serial sections for 12–16 hr at 4C in the dark, and a cocktail containing the fluorescein and tetramethyl secondary antibodies was then applied at room temperature for 30 min. Hoechst was used for 5 min. Slides were then fixed with 4% formaldehyde in PBS and mounted in Geltol (Thermo Shandon; Pittsburgh, PA). The related methodology followed our previous work (Halevy et al. 2004). Appropriate controls included slides with PBS in place of secondary antibody.
Image Analysis and Data Collection
Images were captured from each immunofluorescent slide using a Zeiss Axioskop 20 microscope (Carl Zeiss GmbH; Jena, Germany) equipped for epifluorescence and a Sony S70 (Sony Corporation; Tokyo, Japan) digital still camera. Depending on fiber size, three to six different fields of view were obtained from each slide. Three epifluorescent images, each viewed through a different wavelength filter, were acquired from each field. The resultant images were all nuclei in blue, SC nuclei in green, and basal laminae in red (Figure 1). Images were subsequently transferred to a Macintosh G4 computer (Apple Computers; Cupertino, CA), and the three images for each field of view were superimposed and their contrast improved using Adobe Photoshop (Adobe Systems; San Jose, CA).
Images of the anti-neonatal MyHC antibody-labeled slides were taken using brightfield microscopy from sections serial to those used for epifluorescence and included the same fields of view that were photographed under epifluorescence (Figure 1). Scion imaging program (developed by the U.S. National Institutes of Health and available on the internet by anonymous FTP from Zippy.nimh.nih.gov) was then used to set the images to gray scale for measuring the optical density (OD) and the ellipse minor axis of individual fibers. Pectoralis tissue from 9-day-old chicks was used as a neonatal density control, and larger fiber profiles of pectoralis tissue from 115-day-old chickens were used as a control for the absence of neonatal myosin. OD and ellipse minor axis of at least 200 contiguous fiber profiles from each animal were measured. OD measurements were used to classify fiber profiles as neonatal, transforming, or adult as per our earlier works (Rosser et al. 2000, 2002). Briefly, white and black were automatically assigned OD values of 0 and 255, respectively, at the ends of a perfect arithmetic linear regression. All fiber profiles quantified at 9 days of age had ODs of >110, whereas control adult profiles at age 115 days had values of <80. Thus, in all sections studied, fiber profiles with a density of >110 were classified as neonatal, profiles <80 were classified as adult, and profiles ≥80 and ≤110 were classified as transforming. Ellipse minor axis was used to assess the size of fiber cross-sectional profiles from the pectoralis of birds aged 9, 49, and 62 days. These fiber profiles were then arranged into groups according to size by 10-μm increments.
The numbers of satellite cell nuclei (SCN) and myonuclei (MN) within each of the 200+ fibers of each animal were totaled. The frequency of SCs was then calculated for each animal, for each fiber profile type, and for each fiber size range group using the formula that frequency = (SCN/SCN+MN) × 100% (Schmalbruch and Hellhammer 1977). Mean values for SC frequency per fiber type and size group were obtained from three animals at each age using the means from each animal.
Longitudinal sections were used to measure the lengths of SC nuclei. The same methods outlined in the preceding to study cross-sections using epifluorescent microscopy were utilized to study longitudinal sections. The lengths of 15–22 SC nuclei were measured from longitudinal sections of the pectoralis of each of three animals at each of the following ages: 9, 30, 49, 62, and 115 days.
Concentration of SCs was determined by calculating the mean area of sarcolemma per SC. First, the number of SCs per unit length of fiber was calculated for each type of fiber profile (neonatal, transforming, and adult) using a formula from Castillo de Maruenda and Franzini-Armstrong (1978). This formula is N = A/(Ln + M), where N is the number of SCs per unit length of fiber, A is the mean number of SC nuclei per fiber profile, Ln is the average length of SC nucleus, and M is the thickness of tissue section. The surface area of sarcolemma per unit length of the fiber was then measured for different profiles using the formula S = πEU, where S is the surface area of the sarcolemma per unit length of fiber, E is the ellipse minor axis, and U is the unit length of the fiber (1 mm). Finally, the area of muscle fiber sarcolemma per each SC was determined by dividing the surface area measurements (S) by the number of SCs (N) in each type of fiber profile. SCs were deemed to be more concentrated when the mean area of sarcolemma per SC was less.
Statistics
After determining the homogeneity of variance, data were evaluated by one-way and univariate analysis of variance (ANOVA) at 5% level of significance. Samples were blocked into different age groups and randomized complete block design analysis was applied. If a significant (p<0.05) difference was found, Scheffe's post hoc analysis test was applied to examine statistical differences between groups. Kruskal–Wallis non-parametric test was used to evaluate surface area per SC data, and t-test for two independent samples was further applied to compare the neonatal group along with transforming or adult group. Data were plotted, and linear regression or curve fits were calculated. All statistical tests were performed using SPSS program (standard version 12.0.0; SPSS Inc., Chicago, IL).
Results
Expression of Pax7 by SC Nuclei
Locations of Pax7-labeled (+) nuclei relative to basal laminae (Figure 1) were determined from three animals at each of four different developmental ages: 9, 49, 62, and 115 days posthatch (Table 1). We found that ∼97–98% of the Pax7+ nuclei were located beneath the basal laminae of the muscle fibers. Consequently, these nuclei were classified as SC nuclei. The remaining 2–3% were nuclei located outside the basal laminae in the surrounding endomysium and perimysium (Figure 2).
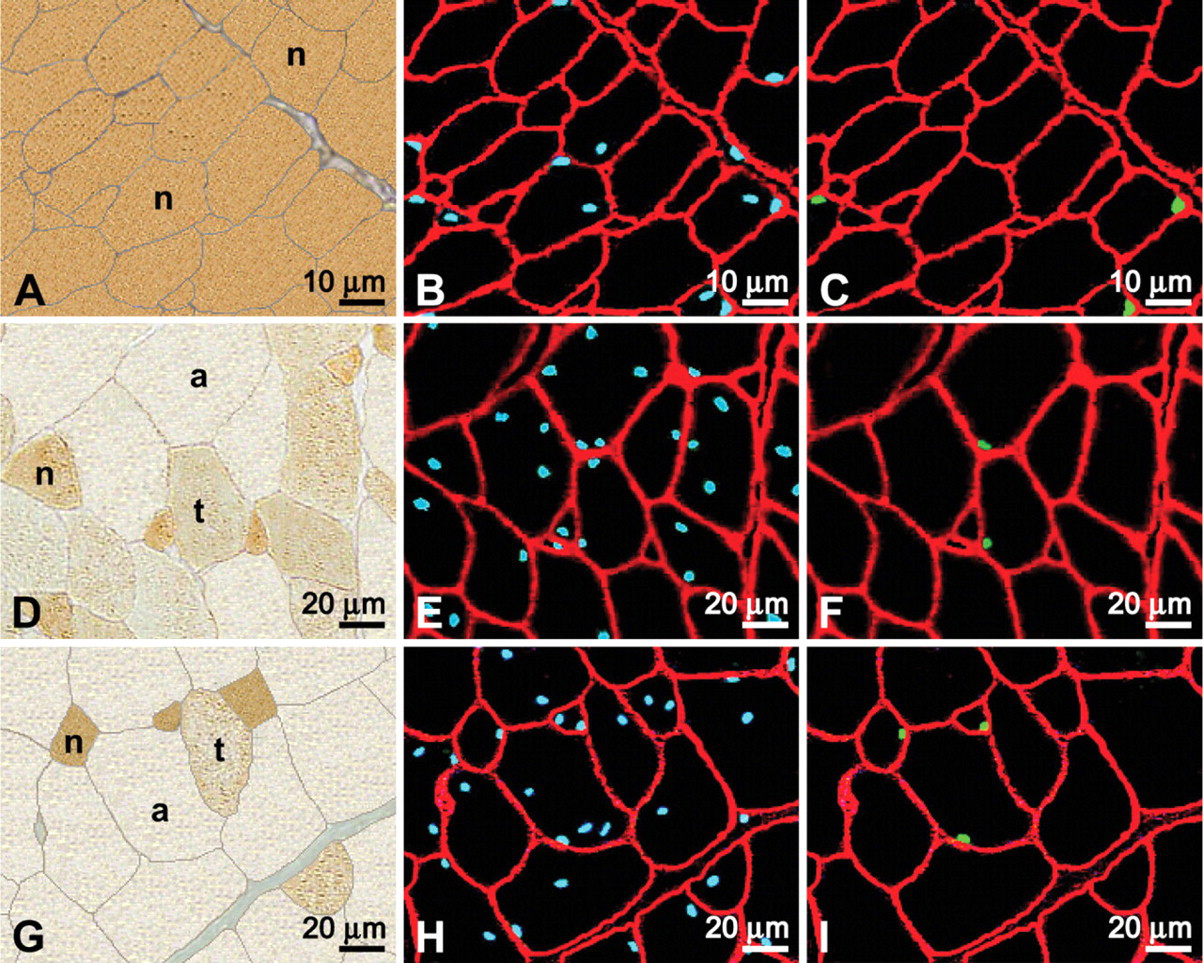
Immunocytochemical labeling of serial cross-sections of developing chicken pectoralis. Muscles were from birds aged 9 (
Length of SC Nuclei
Mean length of SC nuclei was determined on longitudinal sections obtained from three animals at each of the following ages: 9, 30, 49, 62, and 115 days posthatch (Table 2). There were no significant (p>0.05) differences in the mean length of SC nuclei either within or among these ages. Thus, there is a uniform length for SC nuclei in chicken pectoralis during development. Overall mean length was 10.28 μm ± 0.10 (±SD), and this value was used in our calculations of the number of SCs per unit length of fiber (see Materials and Methods). This length is comparable to those found in previous studies of other species and muscles (Muir 1970; Schmalbruch 1977).
Frequency of SCs and Fiber Size With Age
The mean frequency of SCs decreased significantly (p<0.01) with age. As illustrated in Figure 3A, the mean frequency declined from 20.04% at age 9 days posthatch to 4.86% at 115 days. These findings were consistent with our previous results, which included two of the same data points (Halevy et al. 2004) and reflect observations from studies of other species (Hawke and Garry 2001). Furthermore, our new expanded data showed that the declining pattern of SC frequency with ageisa curvilinear regression [SC frequency = −5.808Ln(age) + 33.051, r = −0.971, p<0.001]. Mean fiber size increased significantly (p<0.001) with age. As shown in Figure 3B, fiber size increased from a mean ellipse minor axis of 12.21 μm at age 9 days posthatch to 35.9 μm at 115 days. Increase in muscle fiber diameter during postnatal growth is fairly ubiquitous among vertebrates (Swatland 1994; Goldspink and Yang 1999; MacIntosh et al. 2006). Our data showed that within chicken pectoralis the increase of fiber size with age is a curvilinear regression [fiber size = 10.454Ln(age) − 12.256, r = 0.969, p=0.006]. Further analysis also revealed a strong inverse correlation (r = −0.984, p<0.001) between mean fiber size and mean SC frequency [SC frequency = −0.545 (fiber size) + 25.974], as illustrated in Figure 3C.
Percent of Pax7+ nuclei that are satellite cell (SC) nuclei
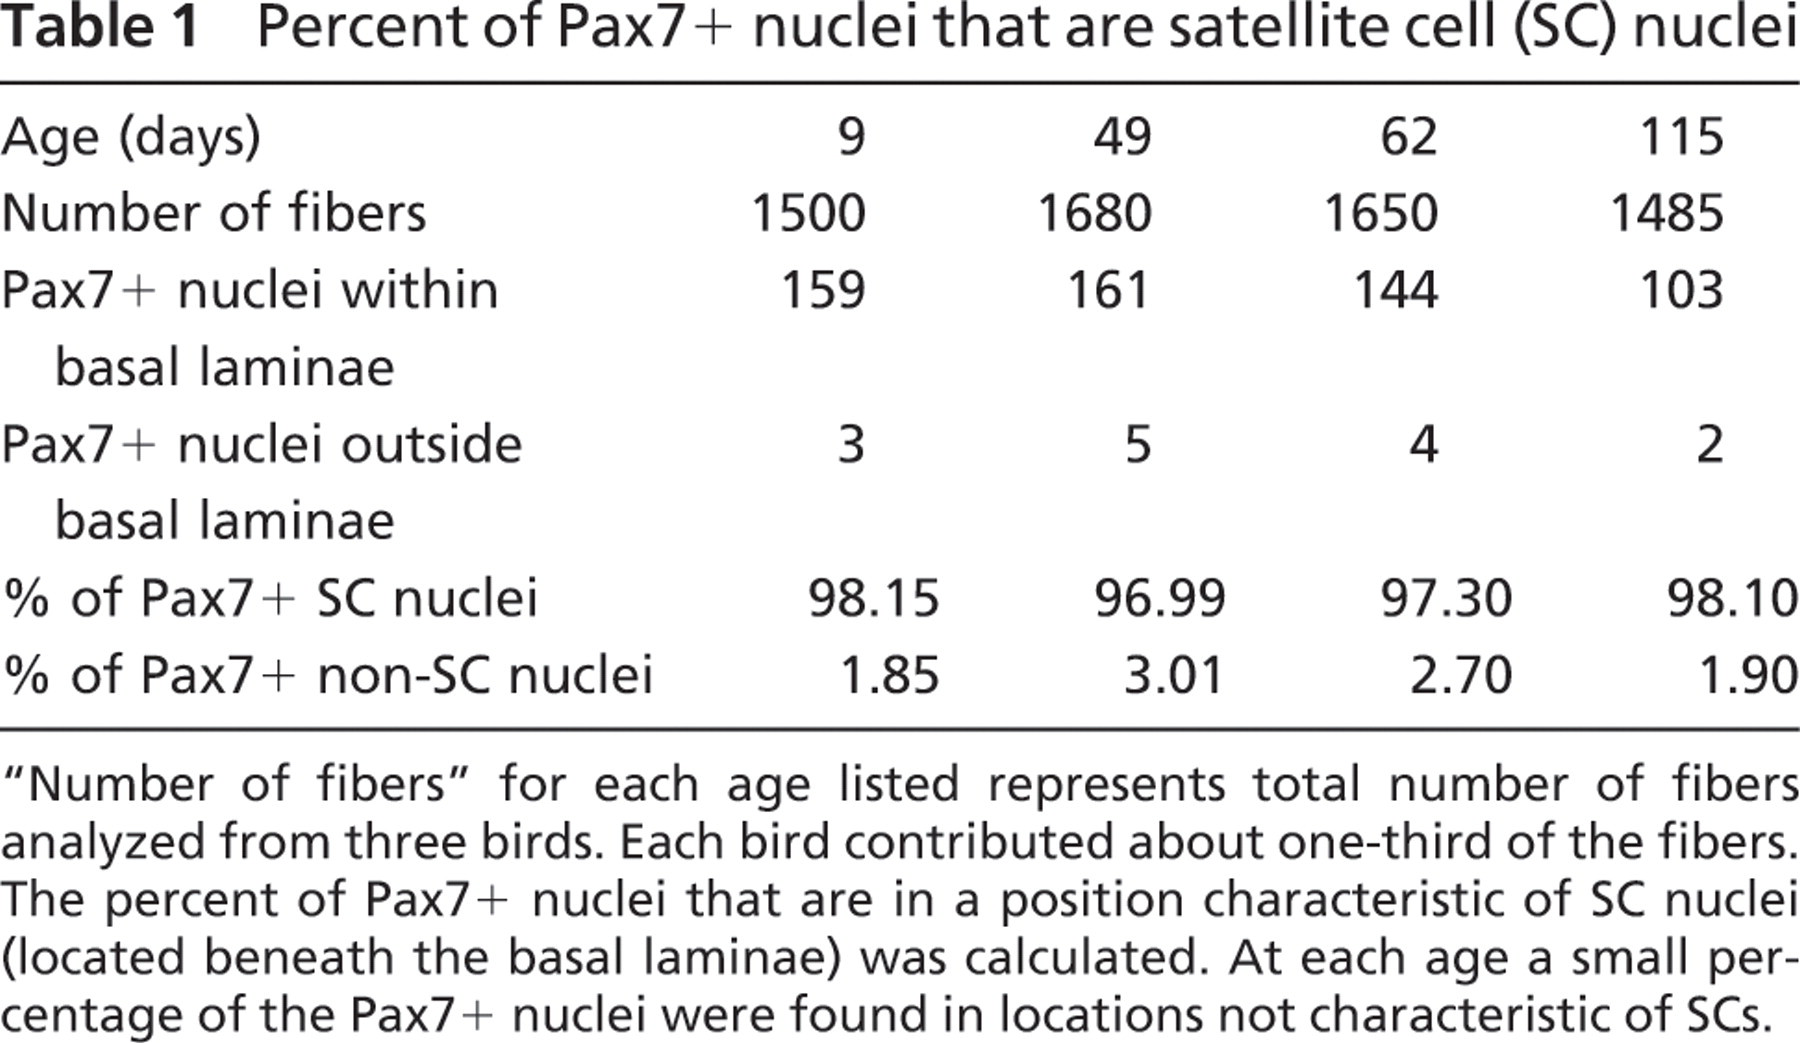
“Number of fibers” for each age listed represents total number of fibers analyzed from three birds. Each bird contributed about one-third of the fibers. The percent of Pax7+ nuclei that are in a position characteristic of SC nuclei (located beneath the basal laminae) was calculated. At each age a small percentage of the Pax7+ nuclei were found in locations not characteristic of SCs.
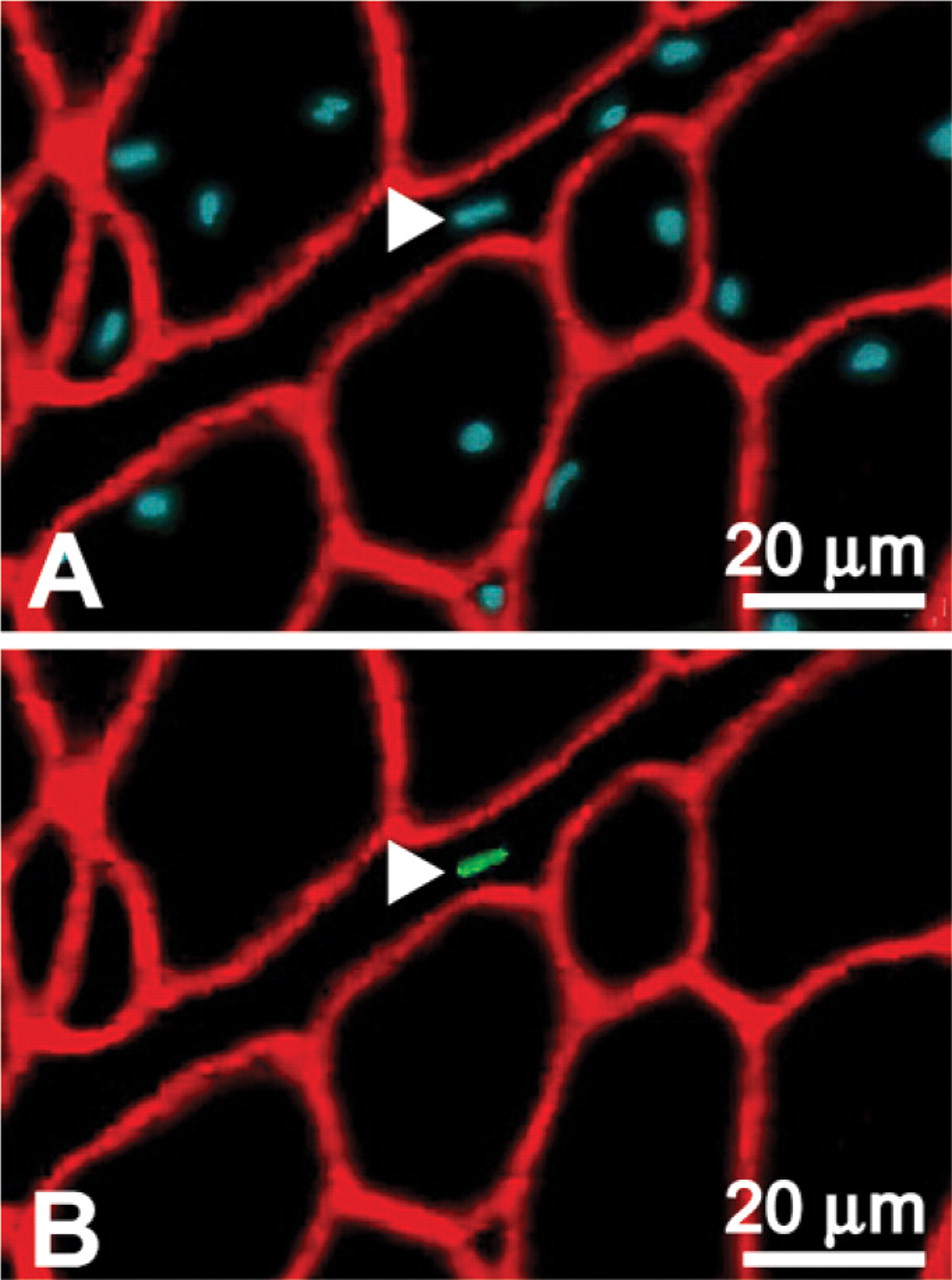
Pax7+ nucleus outside the basal laminae. A cross-section prepared from pectoralis muscle of a 49-day-old chicken and labeled for immunofluorescence by Hoescht in blue (
Frequency of SCs With Type of Fiber Profile
OD measurements were used to classify fiber profiles as neonatal, transforming, or adult as per our earlier works (Rosser et al. 2000, 2002). Transforming profiles had ODs between those of neonatal and adult profiles. Neonatal profiles had the highest frequencies of SCs, ranging from 13.65% to 20.04% during development. The frequency of SCs was dramatically (p<0.001) decreased with repression of neonatal MyHC isoform expression (Figure 4A). There was no significant difference (p>0.05) in SC frequency between transforming and adult profiles. Overall, the mean frequency of SCs in transforming and adult profiles never reached 10%. All fiber profiles at ages 9 and 23 days were neonatal, whereas most of the profiles at age 115 days were adult. Transforming profiles appear somewhere between 23 and 30 days of age (see Rosser et al. 2000). These findings support our hypothesis that there is a greater frequency of SCs at the ends of muscle fibers because after 23 days of age, neonatal profiles are in fact the tapered ends of the fibers (Rosser et al. 2000).
Surface Area of Sarcolemma per SC
The surface area of muscle fiber sarcolemma per SC was calculated for each different type of fiber profile at each of the following ages: 9, 23, 30, 49, 62, 79, and 115 days posthatch. There was less area of sarcolemma per SC in neonatal profiles than in other profiles (Figure 4B). The difference was statistically significant (p<0.05) between neonatal and either transforming or adult profiles, but not between transforming and adult profiles (p=0.38). These results show that there is a greater concentration of SCs at fiber ends, represented by neonatal profiles, than in other regions of the muscle fibers.
Frequency of SCs With Fiber Profile Size
The mean frequency of SCs decreased with increasing fiber profile size. The ellipse minor axis of the largest profiles at age 9 days did not exceed 20 μm. At this age, although fibers ranging from 0 to 10 μm had on average a numerically greater frequency of SCs than those ranging from 10.01 to 20 μm, this difference was not statistically significant (p=0.12, Figure 5A). At both age 49 and 62 days, there was a significant (p<0.01) decrease in the mean frequency of SCs as the ellipse minor axis increased (Figures 5B and 5C). This decrease was most prominent as the ellipse minor axis increased from the range of 0.0–10.00 μm to 10.01–20 μm. These findings strongly support our hypothesis that the tapered fiber ends have a higher frequency of SCs because the smaller fiber profiles seen at 49 and 62 days of age are the tapered ends of muscle fibers (see Rosser et al. 2000).
Lengths of SC nuclei
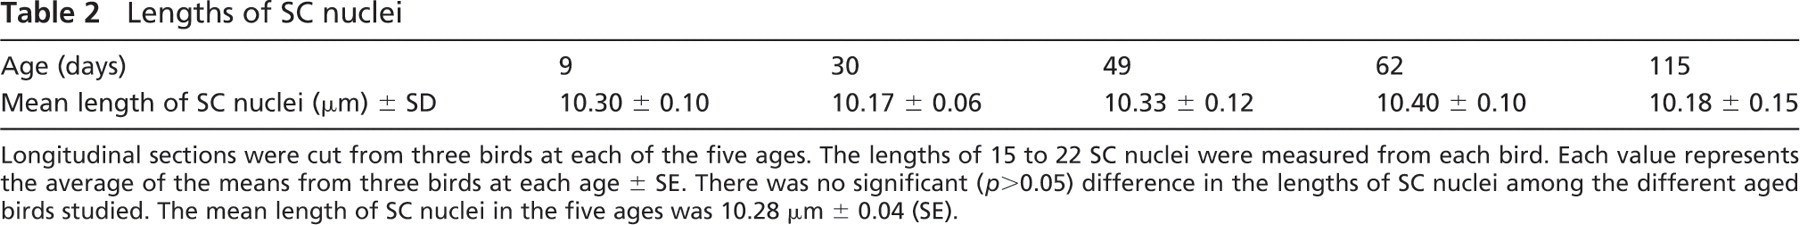
Longitudinal sections were cut from three birds at each of the five ages. The lengths of 15 to 22 SC nuclei were measured from each bird. Each value represents the average of the means from three birds at each age ± SE. There was no significant (p>0.05) difference in the lengths of SC nuclei among the different aged birds studied. The mean length of SC nuclei in the five ages was 10.28 μm ± 0.04 (SE).
Discussion
It is now well established that in skeletal muscle the nuclei of all resident satellite cells express Pax7 (Seale et al. 2000; Zammit et al. 2006; Day et al. 2007). Studies of humans, other mammals, birds, and amphibians have established that Pax7 is expressed by quiescent SCs and their proliferating progeny, that expression declines upon myogenic differentiation, and that Pax7 is typically not expressed within myonuclei (Halevy et al. 2004; Zammit et al. 2004; Morrison et al. 2006; Shefer et al. 2006; Verdijk et al. 2007). In the present study we used this characteristic Pax7 expression by resident satellite cells to investigate their distribution along the lengths of muscle fibers within the growing fibers of the posthatch chicken pectoralis. We find that ∼97–98% of Pax7+ nuclei are localized in positions characteristic of SCs, immediately beneath the basal laminae of muscle fibers. Hence, it is inferred that these Pax7+ nuclei are SC nuclei. The remaining 2–3% Pax7+ nuclei were located in the interstitial spaces outside the basal laminae of the muscle fibers and were not included in our calculations of SCs along fiber lengths. We also found at all ages of posthatch growth that myonuclei (Pax7−) were located throughout the sarcoplasm of individual fibers. Whereas the peripheral location of myonuclei is characteristic of normal postnatal mammalian muscle fibers (Sewry and Dubowitz 2001; Yablonka-Reuveni and Anderson 2006), myonuclei are also normally located in large numbers throughout the sarcoplasm of fibers within healthy posthatch chicken pectoralis muscle (George and Berger 1966; Rosser et al. 2002).
This is the first study to demonstrate that throughout growth and maturation there is both a greater frequency and a higher concentration of SCs at the terminal tips of skeletal muscle fibers. Our earlier studies showed that the ends of maturing skeletal muscle fibers in the posthatch pectoralis of the chicken (Rosser et al. 2000) and pigeon (Bartnik et al. 1999) retain high densities of neonatal MyHC isoform. We also demonstrated with previously published, but preliminary, data that SC frequency in the chicken pectoralis decreased during posthatch development (Halevy et al. 2004). Here we correlate our much expanded and more exact data on SC frequency with fiber size (see subsequent Discussion). The current study also finds that while SC frequency decreases during development with repression of neonatal MyHC isoform expression along the fiber lengths, the tapered fiber ends retain both neonatal myosin and a high frequency of SCs. To further validate these results, the frequency of SCs for different sizes of fiber profiles was obtained, and a higher frequency of SCs was found in smaller fiber profiles. This corroborates our results, as the smaller fiber profiles are the tapered ends of skeletal muscle fibers (Rosser et al. 2000). In addition, a greater concentration of SCs at the ends of skeletal muscle fibers was shown by significantly less sarcolemma per SC nucleus in those fiber regions expressing neonatal myosin.
Our results suggest that SCs at fiber ends play a key role in the longitudinal growth of muscle fibers. Developing skeletal muscle fibers grow in both length and width (Zhang and McLennan 1995; Paul and Rosenthal 2002). It has been established that the terminal ends of maturing muscle fibers are the regions for longitudinal growth within muscles (Swatland 1994; Goldspink 2003). Our earlier study showed that smaller myonuclear domains are present at the tapered ends of the fibers in the posthatch chicken pectoralis (Rosser et al. 2002). Myonuclear domain is the estimated volume of sarcoplasm associated with a single myonucleus, and each myonucleus is responsible for protein synthesis within its domain (Hall and Ralston 1989; Allen et al. 1999). Smaller myonuclear domains are an indication of greater protein synthesis because myonuclei tend to be more concentrated in regions of active protein synthesis (Edgerton and Roy 1991; Winchester and Gonyea 1992; Allen et al. 1999; Ohira et al. 2001). Myonuclei are postmitotic. SCs supply myonuclei to growing myofibers before becoming mitotically quiescent in maturing muscle. SCs can then be activated from this quiescent state for the maintenance, hypertrophy, and repair of mature muscle (Zammit et al. 2006). The higher frequency and concentration of SCs now observed at the fiber ends are presumably correlated with the demand for more myonuclei there due to greater protein synthesis required for longitudinal growth. Higher SC numbers are also associated with higher myonuclear numbers elsewhere in the muscle fiber. Studies have shown that SC nuclei tend to be more concentrated near capillaries and motor end plates (Schultz and McCormick 1994; Christov et al. 2007). Another study has shown the same for myonuclei (Ralston et al. 2006).
A recent study using immunocytochemical techniques to study rat soleus muscle indicated that equal numbers of SCs were distributed per unit length along the fibers (Wang et al. 2006). However, this was an experimental and not ontogenetic study, and neither SC frequencies nor SC concentrations were calculated. Also, whereas central, proximal, and distal regions of the fibers were compared, it was unclear how much of each fiber was encompassed by those regions designated as proximal and distal. Moreover, unlike chicken pectoralis, which is composed of overlapping fast-twitch fibers arranged in series (Gaunt and Gans 1993), rat soleus consists primarily of slow-twitch fibers (Golding et al. 2006) that extend the entire length of the muscle (Wang et al. 2006). Thus, it is difficult to compare the results of our study to those of Wang et al. (2006). Nonetheless, whereas unloading the soleus reduced myonuclear numbers uniformly along fiber lengths, SC numbers were reduced only in the central regions of the fibers. This indicates that high numbers of SCs are maintained at the end regions of unloaded muscle fibers and suggests that there are regional differences in the regulation of SCs along fiber lengths. Some additional support for our findings may be provided by an earlier study. Castillo de Maruenda and Franzini-Armstrong (1978) studied a fast-twitch muscle, the sartorius of adult frogs. It was indicated that the distal region of the belly of the muscle was tapered, as fibers gradually terminated into the distal tendon. Using the light microscope with phase and/or differential interference contrast, there were more SCs/fiber profile in the distal third of the belly of the muscle in four of five muscles examined. However, using the electron microscope, results on SC distribution were more variable.
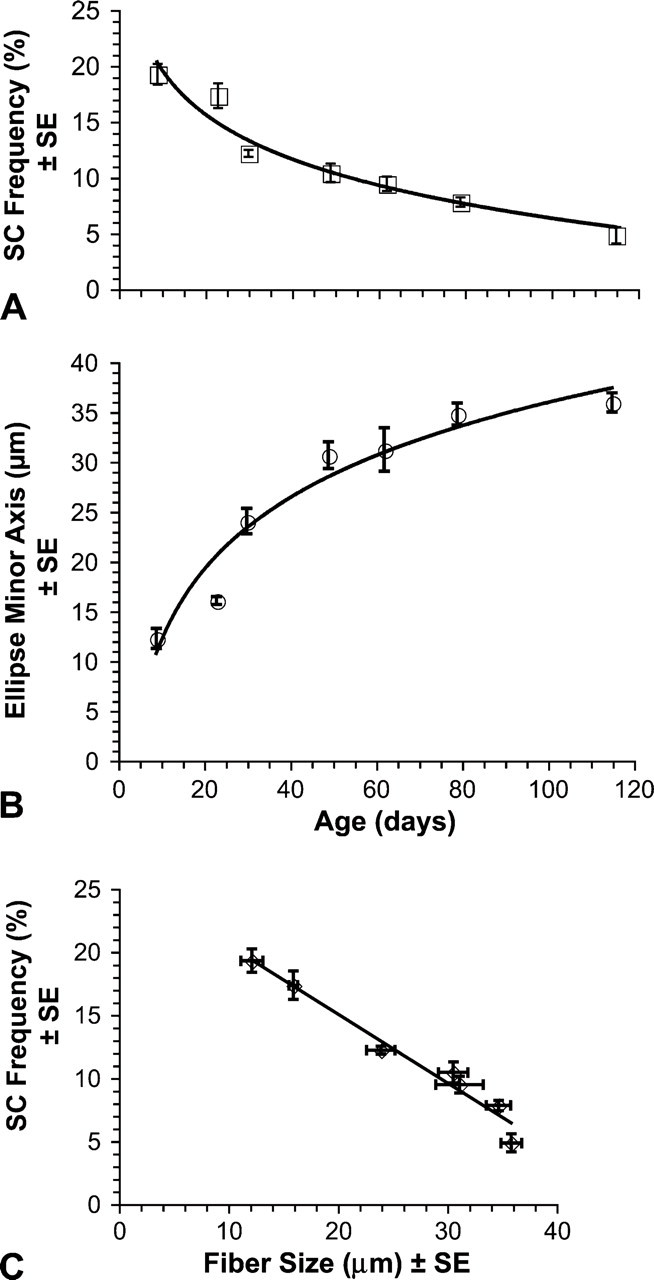
Fiber profile size and SC frequency during development. Each symbol represents mean ± standard error (SE). (
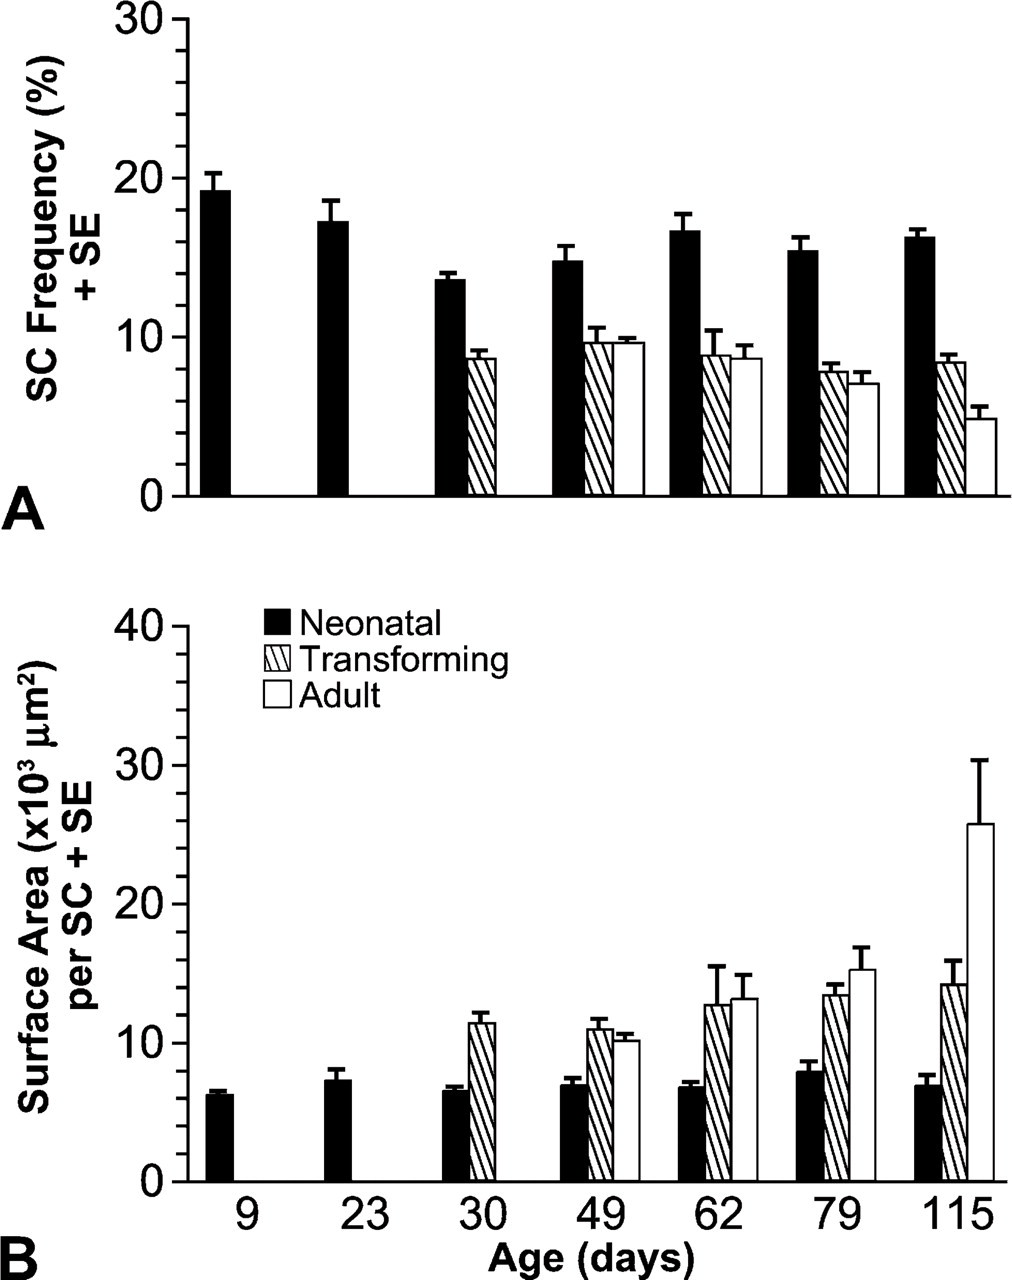
SC frequency and surface area of sarcolemma per SC during development in neonatal, transforming, and adult fiber profiles. (
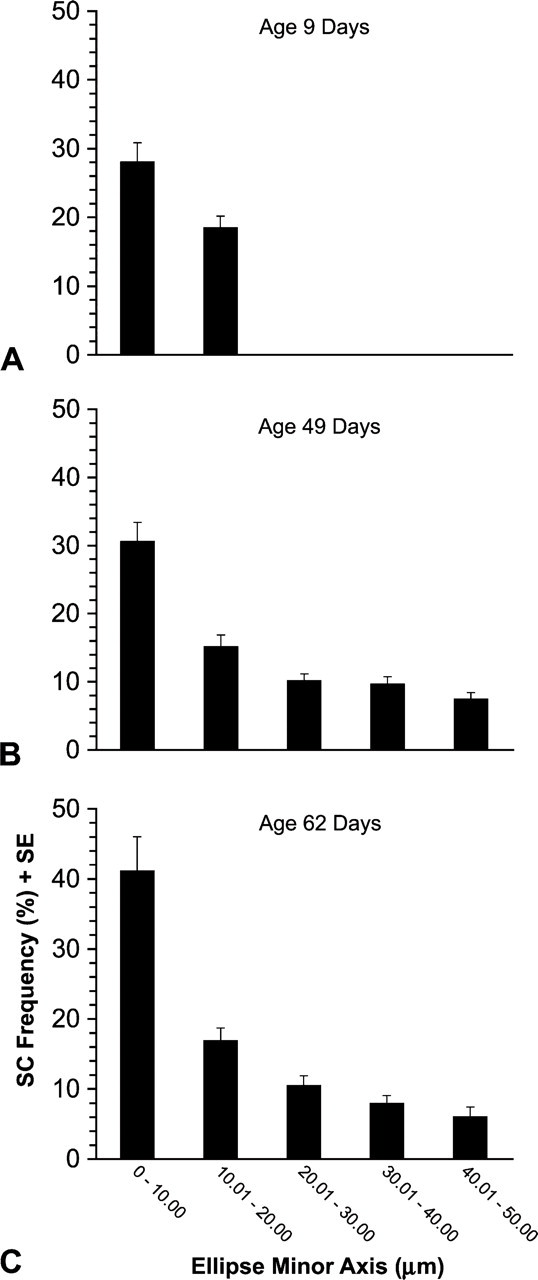
SC frequency according to fiber profile size. Three birds were studied at each of three different ages: (
We found that 2–3% of the Pax7+ nuclei were located in the interstitial spaces outside the basal laminae of the muscle fibers. Neither the role nor the source of myogenic cells in the interstitium is fully understood (Kuang et al. 2006; Schultz et al. 2006). Their presence is consistent with the theories that myogenic cells arise from non-muscle sources (Asakura et al. 2002; Shi and Garry 2006), that satellite cells migrate between muscle fibers in postnatal muscle (Lipton and Schultz 1979; Hughes and Blau 1990; Morgan et al. 1993), and that myogenic cells of alternate origins reside in the interstitium (Kuang et al. 2006). Myogenic cells in the interstitium have been described as either expressing (Schultz et al. 2006) or not expressing (Kuang et al. 2006) Pax7.
We demonstrate a strong inverse correlation between fiber profile diameter and SC frequency throughout development. To the best of our knowledge, this correlation has not been demonstrated by any other researcher(s). Another parameter showing strong inverse correlations with fiber cross-sectional size is oxidative capacity, as revealed by quantitative biochemical or microdensitometric analyses of mammalian muscle fibers (Rosser et al. 1992; Sieck et al. 1995; Quiroz-Rothe and Rivero 2004). It is thought that fibers relying upon oxidative metabolism may require smaller diameters to reduce the diffusion distance of oxygen to mitochondria for oxidative metabolism (Rosser et al. 1992; Sieck et al. 1995). Although comparable quantitative analyses of fibers within the posthatch chicken pectoralis have not been undertaken, qualitative histochemical studies of this muscle have revealed that the smaller fiber profiles are more oxidative than the larger profiles (George and Berger 1966; Rosser and George 1986). As the smaller fiber profiles are fiber ends, it can be deduced that fiber ends in the chicken pectoralis are probably more oxidative than the other regions of the fibers. Studies of mammalian muscle fibers have shown a direct correlation between oxidative capacity and capillary density (number of capillaries/fiber area) (Quiroz-Rothe and Rivero 2004). In chicken muscle, smaller diameter fibers have higher capillary densities (Snyder 1995; Hoving-Bolink et al. 2000). SC nuclei tend to be more concentrated near capillaries (Schultz and McCormick 1994; Christov et al. 2007). Thus, our results showing a strong inverse correlation between fiber diameter and SC frequency throughout development of the chicken pectoralis could be related to higher capillary densities associated with smaller diameter, more oxidative fiber profiles. Greater capillary density at fiber ends should result in greater numbers of SCs. Christov et al. (2007) demonstrated that endothelial cells of capillaries specifically enhanced SC growth through a variety of growth factors.
Further study is required to address questions arising from our findings. Are a greater proportion of SCs active at the ends than elsewhere along the fibers? To ascertain this, active SCs could be identified by immunolabeling with antibodies against antigens associated with SC proliferation such as proliferating cell nuclear antigen or the myogenic regulatory factor MyoD, or by experimentally introducing bromodeoxy-uridine to the live animals to label DNA of proliferating cells (Yablonka-Reuveni and Rivera 1994; Yablonka-Reuveni et al. 1999; Zammit et al. 2006). Can our findings of high SC numbers at the ends of fibers in posthatch chicken pectoralis be extrapolated to muscles of postnatal mammals? Studies showing that sarcomeres or newly synthesized proteins are added to the ends of growing postnatal muscle fibers have utilized primarily mammalian models (Goldspink 2003). Thus, one would anticipate higher concentrations of satellite cells at the ends of mammalian muscle fibers. However, the majority of studies of muscle development utilize mice or rats as experimental models. The fibers within the muscles of these small laboratory rodents generally extend for most of the short muscle length and are attached to the tendon at each end (Burkholder et al. 1994; Sheard et al. 1999). These may not be the best models for studying longitudinal growth in muscle fibers, as most fiber ends are confined to relatively narrow zones near the myotendinous junctions. In comparison, better models may be found within the less frequently studied muscles of larger mammals in which fibers are also relatively short but with the majority arranged in series terminating intrafascicularly (Gaunt and Gans 1992; Sheard et al. 1999) as do those in the avian pectoralis (Gaunt and Gans 1993). These models offer numerous tapered fiber ends that are easily accessed throughout the belly of the muscle. In the present study we have used a muscle rich in fiber ends throughout its belly to show that SCs are more concentrated (closer together) and at a greater frequency (#SC nuclei/all nuclei within basal laminae) within growing posthatch fiber ends.
Footnotes
Acknowledgements
The College of Medicine, University of Saskatchewan and the Jordan University of Science and Technology provided funds for M.Z.A. Z.Y.R is supported by the National Institute on Aging, National Institutes of Health (Grants AG-021566 and AG-013798) and the U.S. Department of Agriculture (USDA) Cooperative State Research, Education and Extension Service (NRI, 2003-35206-12843). A Discovery Grant awarded to B.W.C.R. from the Natural Sciences and Engineering Research Council of Canada provided funds for this study.
We thank Dr. Everett Bandman of the Department of Food Sciences and Technology, University of California, for the generous gift of the anti-neonatal MyHC antibody. Antibody against Pax7 developed by A. Kawakami was obtained from the Developmental Studies Hybridoma Bank developed under the auspices of the National Institute of Child Health and Human Development (NICHD) and maintained by the Department of Biological Sciences, University of Iowa. Tonya McGowan, University of Saskatchewan, assisted with preparation of the final version of the figures.