
Abstract
The hamster is a valuable biological model for physiological investigation. Despite the obvious importance of the integration of cardiorespiratory and muscular system function, little information is available regarding hamster muscle fiber type and oxidative capacity, both of which are key determinants of muscle function. The purpose of this investigation was to measure immunohistochemically the relative composition and size of muscle fibers composed of types I, IIA, IIX, and IIB fibers in hamster skeletal muscle. The oxidative capacity of each muscle was also assessed by measuring citrate synthase activity. Twenty-eight hindlimb, respiratory, and facial muscles or muscle parts from adult (144–147 g bw) male Syrian golden hamsters (n=3) were dissected bilaterally, weighed, and frozen for immunohistochemical and biochemical analysis. Combining data from all 28 muscles analyzed, type I fibers made up 5% of the muscle mass, type IIA fibers 16%, type IIX fibers 39%, and type IIB fibers 40%. Mean fiber cross-sectional area across muscles was 1665 ± 328 μm2 for type I fibers, 1900 ± 417 μm2 for type IIA fibers, 3230 ± 784 μm2 for type IIX fibers, and 4171 ± 864 μm2 for type IIB fibers. Citrate synthase activity was most closely related to the population of type IIA fibers (r=0.68, p<0.0001) and was in the rank order of type IIA > I > IIX > IIB. These data demonstrate that hamster skeletal muscle is predominantly composed of type IIB and IIX fibers.
T
Hamster skeletal muscle fiber classification has been reported for a limited number of muscles, such as the cremaster (Sarelius et al. 1983), extensor digitorum longus and soleus (Wilcox et al. 1989), medial gastrocnemius (Zhan and Sieck 1992), and scalene muscles (Fournier and Lewis 2000). In addition, Farkas and Roussos (1984) reported the percentage and cross-sectional area of fibers in diaphragm, intercostal, and plantaris muscles. Few studies, however, have reported the oxidative potential of hamster muscle (Farkas and Roussos 1984). Therefore, the purpose of this investigation was to measure immunohistochemically the relative composition and size of muscle fibers composed of types I, IIA, IIX, and IIB fibers in hamster skeletal muscle. In addition, the oxidative capacity of each muscle was assessed by measuring citrate synthase activity.
Materials and Methods
The protocols used in this investigation were approved by the University of Utah Institutional Animal Care and Use Committee. In all respects, they conform with the Guide for the Care and Use of Laboratory Animals published by the US National Institutes of Health (NIH publication no. 8523, revised 1985).
Animals and Muscles
Three adult male Syrian golden hamsters (7–8 months old, 146 ± 2 g bw) were maintained on a 12:12-hr light:dark cycle and were supplied with rodent chow and water ad libitum.
Hamsters were weighed and sacrificed with ketamine/xylazine. Major muscles from the face, thorax, hip, thigh, and leg were dissected bilaterally and weighed. Popesko and colleagues’ color atlas (Popesko et al. 1990) was used as a reference for the dissection. Larger muscles were not subdivided into red, white, and mixed portions because, unlike the rat (Armstrong and Phelps 1984; Delp and Duan 1996), there appeared to be no gross differences within a muscle. In other words, there were no visually apparent gradations or stratification of color within a given muscle during the dissection. For most muscles, the entire muscle was dissected free and weighed. However, the diaphragm, biceps femoris, adductor, and gastrocnemius muscles were dissected into distinguishable portions on the basis of their anatomy.
After being weighed, a 5-mm midbelly portion was dissected from one set of muscles for each animal, frozen in melting isopentane, and stored at −70C for immunohistochemical determination of fiber composition and cross-sectional area. The second set of muscles were frozen in liquid N2 and stored at −70C for determination of citrate synthase activity.
Citrate Synthase Activity
Activity of citrate synthase, a mitochondrial enzyme and marker of muscle oxidative capacity, was measured in frozen muscle samples according to the methods described by Reichmann et al. (1985). Briefly, the frozen muscle was pulverized under liquid N2 and total cell enzymes were extracted by homogenizing the muscle powder in a cold extraction buffer (6.5 g KCl + 1.6 g glutathione + 0.35 g EDTA + 500 ml dH2O). Enzyme activities, expressed as μmol/min/g wet weight, were measured spectophotometrically in 1 ml assay (0.6 ml 100 mM Tris buffer + 0.1 ml 3.0 mM acetyl CoA + 0.1 ml 1.0 mM DTNB + 0.1 ml diluted homogenate, incubated 7 min, + 0.1 ml 5 mM oxaloacetate) mixtures at room temperature (i.e., 25C).
Immunohistochemical Analysis
Serial transverse cross-sections (8–10 μm) near the midbelly portion of each muscle were cut on a cryostat microtome. Fiber type identification was performed as described by Schiaffino et al. (1989). Sections of muscle were fixed with cold AFA fixative (50 ml 37% zinc formalin + 370 ml 95% ethanol + 25 ml glacial acetic acid) for 5 min. Slides were then hydrated for 10 min in PBS before blocking. Power-Block solution (InnoGenex #BS-1310–25; San Ramon, CA) was added to the sections and incubated for 5 min at RT. After removal of excess blocker, primary antibodies to the MHCs type I (BA-D5), type IIA (SC-71), and type IIB (BF-F3) were added to the appropriate sections and the slides were incubated at 4C overnight in a humid chamber. After incubation, slides underwent two 10-min washes in PBS with gentle rotation. After washing, a biotinylated goat anti-mouse Ig secondary antibody (InnoGenex #AS-2400–16) was added to the sections for 20 min at RT. Slides were washed as described above and streptavidin-alkaline phosphatase conjugate (InnoGenex #CJ-1002–86) was added to the sections and incubated for 20 min at RT. The conjugate was removed by washing (as in prior steps) and a solution of naphthol phosphate buffer (InnoGenex #BS-080204) and Fast Red dye (InnoGenex #CH-0802–06) was added to the sections and incubated until adequate color development was observed. Sections were counterstained with Mayer's hematoxylin and mounted with Glycergel (DAKO; Carpinteria, CA). Fibers containing the MHCs of interest expressed a red color after exposure to the immunohistochemical staining procedure. Serial muscle sections were also examined for IIX fibers (i.e., fibers that expressed no staining after exposure to any of the heavy-chain antibodies) and hybrid fibers (i.e., fibers that expressed multiple heavy chains).
Determination of Muscle Fiber Composition and Cross-sectional Area
All the fibers contained in each muscle cross-section were typed to determine the relative population of each fiber type. For quantification of fiber cross-sectional area, muscle cross-sections were divided into four or five evenly spaced non-overlapping regions, depending on the size of the sample. Representative fascicles with fibers cut perpendicular to their long axes were measured with the use of an image processing system (Bioquant; Nashville, TN). A minimum of five fibers of each type was measured in each of the four or five regions of the muscle. Therefore, in every muscle, fiber area for each of the fiber types was measured in 20–40 fibers. Exceptions to this procedure were made when only a few fibers of a given fiber type were present in a muscle. Under this circumstance, fiber cross-sectional area was measured in all the fibers present of that type in the muscle cross-section. Similar sampling techniques have been previously used to determine fiber population and area (Armstrong and Phelps 1984; Delp and Duan 1996).
Estimation of Fiber Mass
For each muscle, the relative portion of each fiber type was estimated as previously described (Armstrong and Phelps 1984; Delp and Duan 1996). The estimated proportion of each fiber type (Pf) within a given muscle was calculated by dividing the product of the mean cross-sectional area of fibers of that type (Af) and the population of fibers of that type (%f) by the sum of the proportional areas of all the fiber types

where f is type I, IIA, IIX, or IIB.
To compute the mass of the muscle composed of each of the four fiber types, it was assumed that fiber mass makes up 85% of the total muscle mass (Mt) (Gollnick et al. 1981). Thus, the fiber mass of a given type (Mf) was calculated as follows

This computation also assumes that the density and length of the fibers are not significantly different among types.
Statistical Analysis
Differences between cross-sectional areas among different fiber types were determined by calculating a 95% coefficient interval around sample means. Linear regression analysis was used to determine the relationship between oxidative potential (citrate synthase) and the percentage of each fiber type.
Results
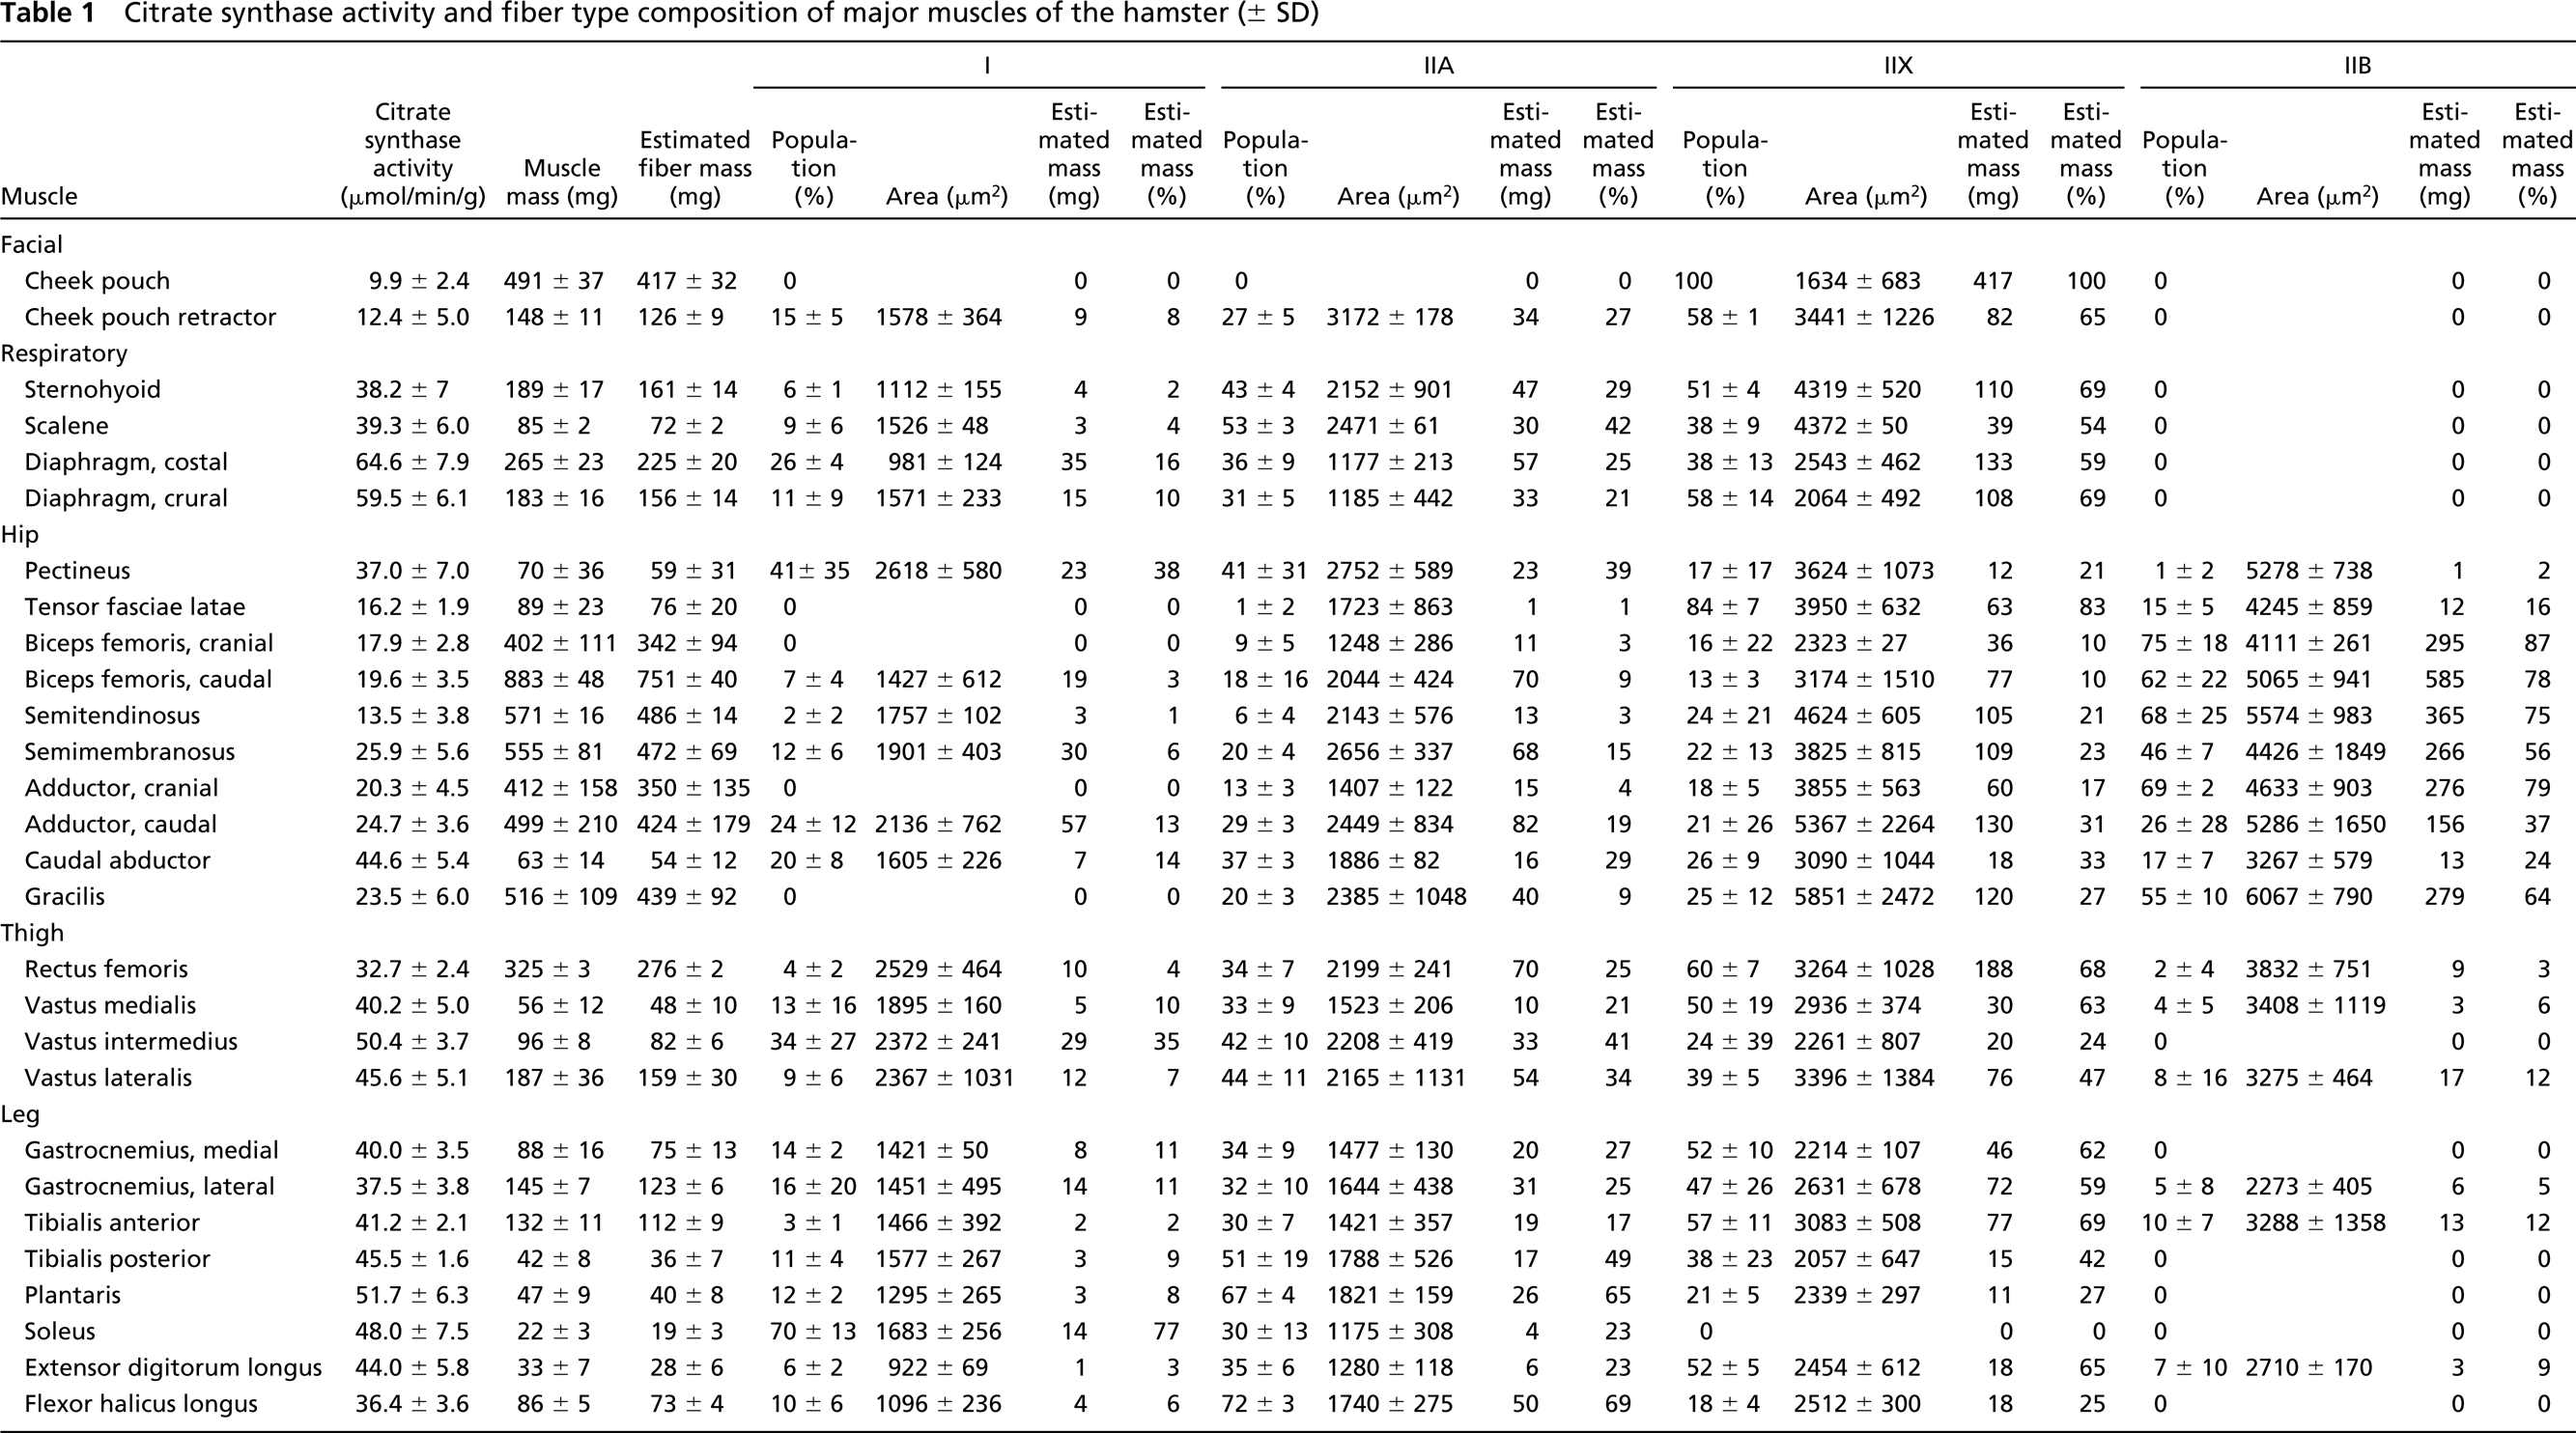
Muscle fiber composition and mass data are presented in Table 1. Muscles analyzed ranged in size from soleus (22 ± 3 mg) to biceps femoris muscle (1285 ± 69 mg). As in the rat (Delp and Duan 1996), fiber composition varied considerably in the muscles. The muscle with the highest percentage of type I fibers was the soleus muscle (70 ± 13%). Cheek pouch, tensor fasciae latae, cranial portion of the biceps femoris, cranial portion of the adductor, and gracilis muscles had no type I fibers. Muscles with the highest percentage of type IIA fibers were scalene (53 ± 3%), tibialis posterior (51 ± 19%), and plantaris (67 ± 4%). In contrast, cheek pouch muscle had no type IIA fibers. Muscles with the highest percentage of type IIX fibers were the cheek pouch (100%) and tensor fasciae latae (84 ± 7%), whereas soleus muscle had no type IIX fibers. Finally, the muscles or muscle parts with the highest percentage of type IIB fibers were cranial and caudal portions of the biceps femoris (75 ± 18% and 62 ± 22%, respectively), semitendinosus (68 ± 25%), and the cranial portion of adductor (69 ± 2%) muscles. Cheek pouch, cheek pouch retractor, sternohyoid, scalene, diaphragm, vastus intermedius, medial portion of gastrocnemius, tibialis posterior, plantaris, soleus, and flexor halicus longus muscles had no type IIB fibers.
Mean cross-sectional area of type I fibers ranged from 922 ± 69 μm2 in extensor digitorum longus to 2618 ± 580 μm2 in pectineus muscles (Table 1). Mean cross-sectional area of type IIA fibers ranged from 1175 ± 308 μm2 in soleus to 3172 ± 178 μm2 in cheek pouch retractor muscles. Mean cross-sectional area of type IIX fibers ranged from 1634 ± 683 μm2 in cheek pouch to 5367 ± 2264 μm2 in the caudal portion of adductor muscles. Finally, mean cross-sectional area of type IIB fibers ranged from 2273 ± 405 μm2 in the lateral portion of gastrocnemius to 6067 ± 790 μm2 in gracilis muscles. Mean fiber cross-sectional area across all muscles was 1665 ± 328 μm2 for type I fibers, 1900 ± 417 μm2 for type IIA fibers, 3230 ± 784 μm2 for type IIX fibers, and 4171 ± 864 μm2 for type IIB fibers (Table 2).
Soleus muscle was the only muscle or muscle part sampled in which type I fibers constituted the majority of fibers in the muscle. Type I fibers also made up the largest portion of muscle mass in the soleus muscle. In eight of the 28 muscles or muscle parts, type IIA fibers constituted the highest portion of fiber type percentage. In only four of these muscles was the largest portion of muscle mass made up of type IIA fibers. In 12 of the 28 muscles or muscle parts, type IIX fibers constituted the highest portion of fiber type percentage and, in 15 of the 28 muscles, type IIX fibers made up the largest portion of muscle mass. In six of the 28 muscles or muscle parts, type IIB fibers constituted the highest portion of fiber type percentage and, in seven of the 28 muscles, type IIB fibers made up the largest portion of muscle mass. The remaining muscle, pectineus, was principally composed of equivalent amounts of type I and IIA fibers. Collectively, type IIX fibers comprised 39% of the total mass of the muscles sampled, whereas type IIB fibers made up the greatest portion (40%) of the muscle mass (Table 2). Type IIA fibers constituted 16% of the total muscle mass and type I fibers made up 5%.
Citrate synthase activity and fiber type composition of major muscles of the hamster (± SD)
Muscle fiber cross-sectional area and mass data a
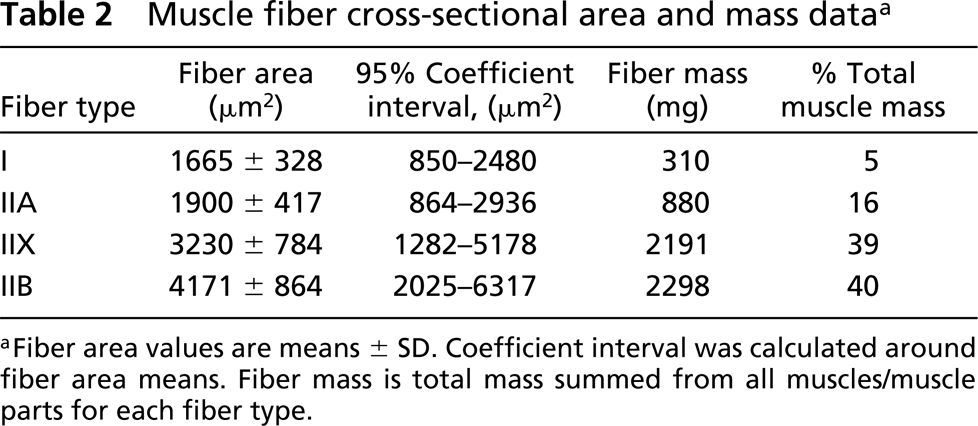
aFiber area values are means ± SD. Coefficient interval was calculated around fiber area means. Fiber mass is total mass summed from all muscles/muscle parts for each fiber type.
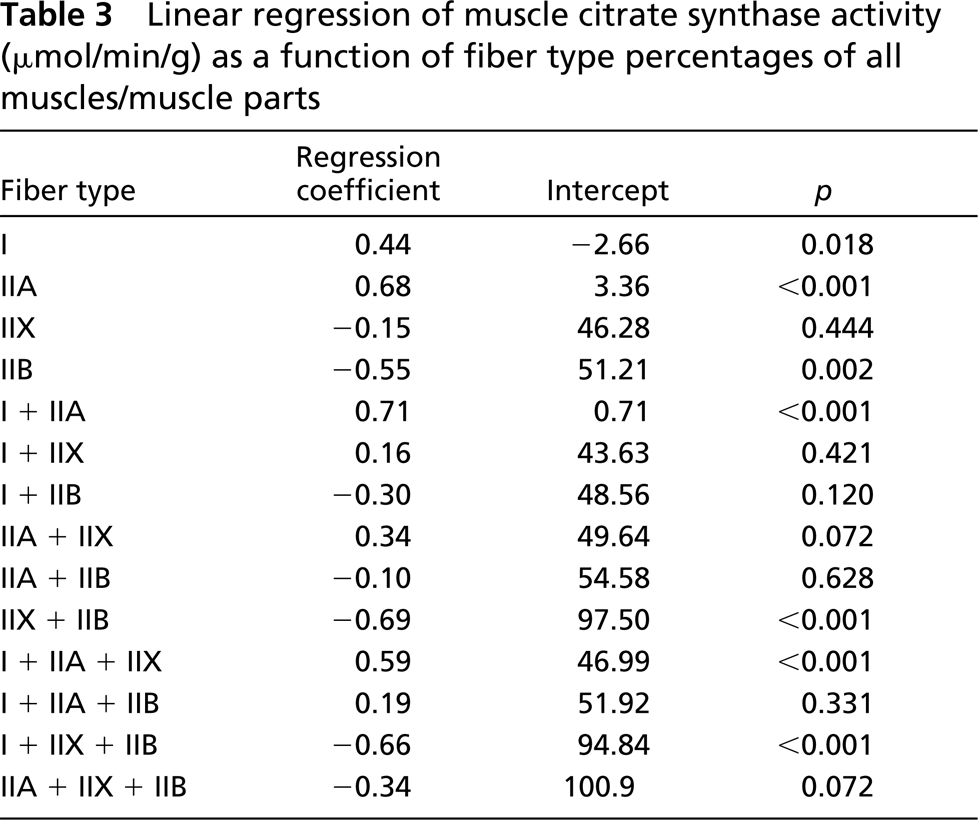
Citrate synthase activity ranged from 9.9 μmol/min/g wet wt in cheek pouch muscle to 64.6 μmol/min/g wet wt in costal portion of diaphragm muscle (Table 1). The strongest correlation between citrate synthase activity and a single fiber type percentage was with type IIA fibers (r=0.68; Table 3) and inversely with type IIB fibers (r=-0.55). However, the strongest relationships between fiber composition and oxidative capacity occurred when type I and IIA fibers were grouped (r=0.71) and inversely when type IIX and IIB fibers were grouped (r=-0.69).
Discussion
The primary purpose of this investigation was to measure immunohistochemically the relative composition and size of muscle fibers composed of types I, IIA, IIX, and IIB fibers in hamster skeletal muscle and to determine the muscle oxidative capacity, as indicated by citrate synthase activity. An understanding of fiber composition, fiber-specific muscle mass, muscle mass, or muscle group mass, and oxidative potential is useful for investigations integrating cardiorespiratory and muscular systems that examine physiological function and/or pathological dysfunction. For example, many investigations, through necessity, use a very specialized hamster muscle (e.g., check pouch retractor for intravital microscopy), and data derived from such unique muscles should ideally be interpreted in the context of their fiber composition and oxidative capacity when relevant.
Linear regression of muscle citrate synthase activity (μmol/min/g) as a function of fiber type percentages of all muscles/muscle parts
Previous work characterizing muscle fiber composition in the hamster musculature was based on myosin ATPase and mitochondrial NADH-TR activity (Farkas and Roussos 1984; Sarelius et al. 1983) or solely on the muscle fibers’ ATPase activity (Wilcox et al. 1989; Zhan and Sieck 1992). Spurway (1981) suggested there was a close relationship between muscle fiber classification on the basis of ATPase and NADH-TR reactions (Barnard et al. 1971; Peter et al. 1972) and the ATPase reaction alone (Brooke and Kaiser 1970). Thus, type I fibers were purported to be the equivalent of SO fibers, type IIA fibers the equivalent of FOG fibers, and IIB fibers synonymous with FG fibers. As has been previously observed in rat musculature (Delp and Duan 1996), hamster skeletal muscles with a markedly heterogeneous fiber composition do not appear to have percentages of FOG/FG fibers corresponding to those of type IIA/IIB fibers (Figure 1). Farkas and Roussos (Farkas and Roussos 1984), using the method of Peter et al. (Barnard et al. 1971; Peter et al. 1972), classified type IIX fibers as FOG rather than FG fibers using the NADH-TR stain as a result of the greater oxidative capacity of IIX than IIB fibers. Furthermore, using the method of Brooke and Kaiser (1970), Wilcox and colleagues (1989) classified type IIX fibers as type IIB rather than IIA fibers as a result of the similar ATPase staining between IIX and IIB fibers with an acid (pH 4.45) preincubation. The idiosyncracies inherent in the classification systems cited above may explain the discrepancy between the previously (Farkas and Roussos 1984) reported fiber composition of the hamster plantaris muscle (40% FOG and 46% FG) and that reported in the present study (67% IIA, 21% IIX, 0% IIB).
As described for rat skeletal muscle, mean fiber cross-sectional area of hamster skeletal muscle varies among fiber types. Specifically, the smallest fibers are type I fibers, the largest are type IIB fibers, and type IIX are intermediate to type IIA and IIB fibers (Table 2). In hamster hindlimb musculature, type IIA fibers demonstrated the least heterogeneity with a 2.2-fold difference in fiber cross-sectional area across muscles. Type I, IIX, and IIB fibers all had similar differences in fiber size across muscles (2.8, 2.8, and 2.7-fold difference in cross-sectional area, respectively). In addition, for a given fiber type there is a spatial distribution in fiber size among muscles, as has previously been described in other animal species (Burke 1981; Armstrong and Phelps 1984; Delp and Duan 1996). The general spatial pattern of size distribution was for type I fibers in deep muscles (e.g., vastus intermedius muscle) to be larger than those in more superficial muscles (e.g., vastus medialis muscle). Conversely, type IIX and IIB fibers tended to be largest in superficial muscles. Type IIA fibers did not appear to follow a discernable pattern. In addition, there appeared to be a predictable pattern of fiber distribution within single hindlimb muscles, similar to that in the rat (Delp and Duan 1996). For example, hindlimb muscles with the most heterogeneous fiber composition (e.g., caudal adductor, pectineus, semimembranosus, and gastrocnemius muscles) tended to have a higher concentration of their type I and IIA fibers deep within the muscle, whereas higher concentrations of type IIX and IIB fibers were found in the superficial regions of these muscles (Figure 2). Others have speculated that such spatial variation in both fiber size and type may be related to muscle recruitment activity (Armstrong and Laughlin 1985) and/or economy of energy expenditure (Armstrong and Phelps 1984).
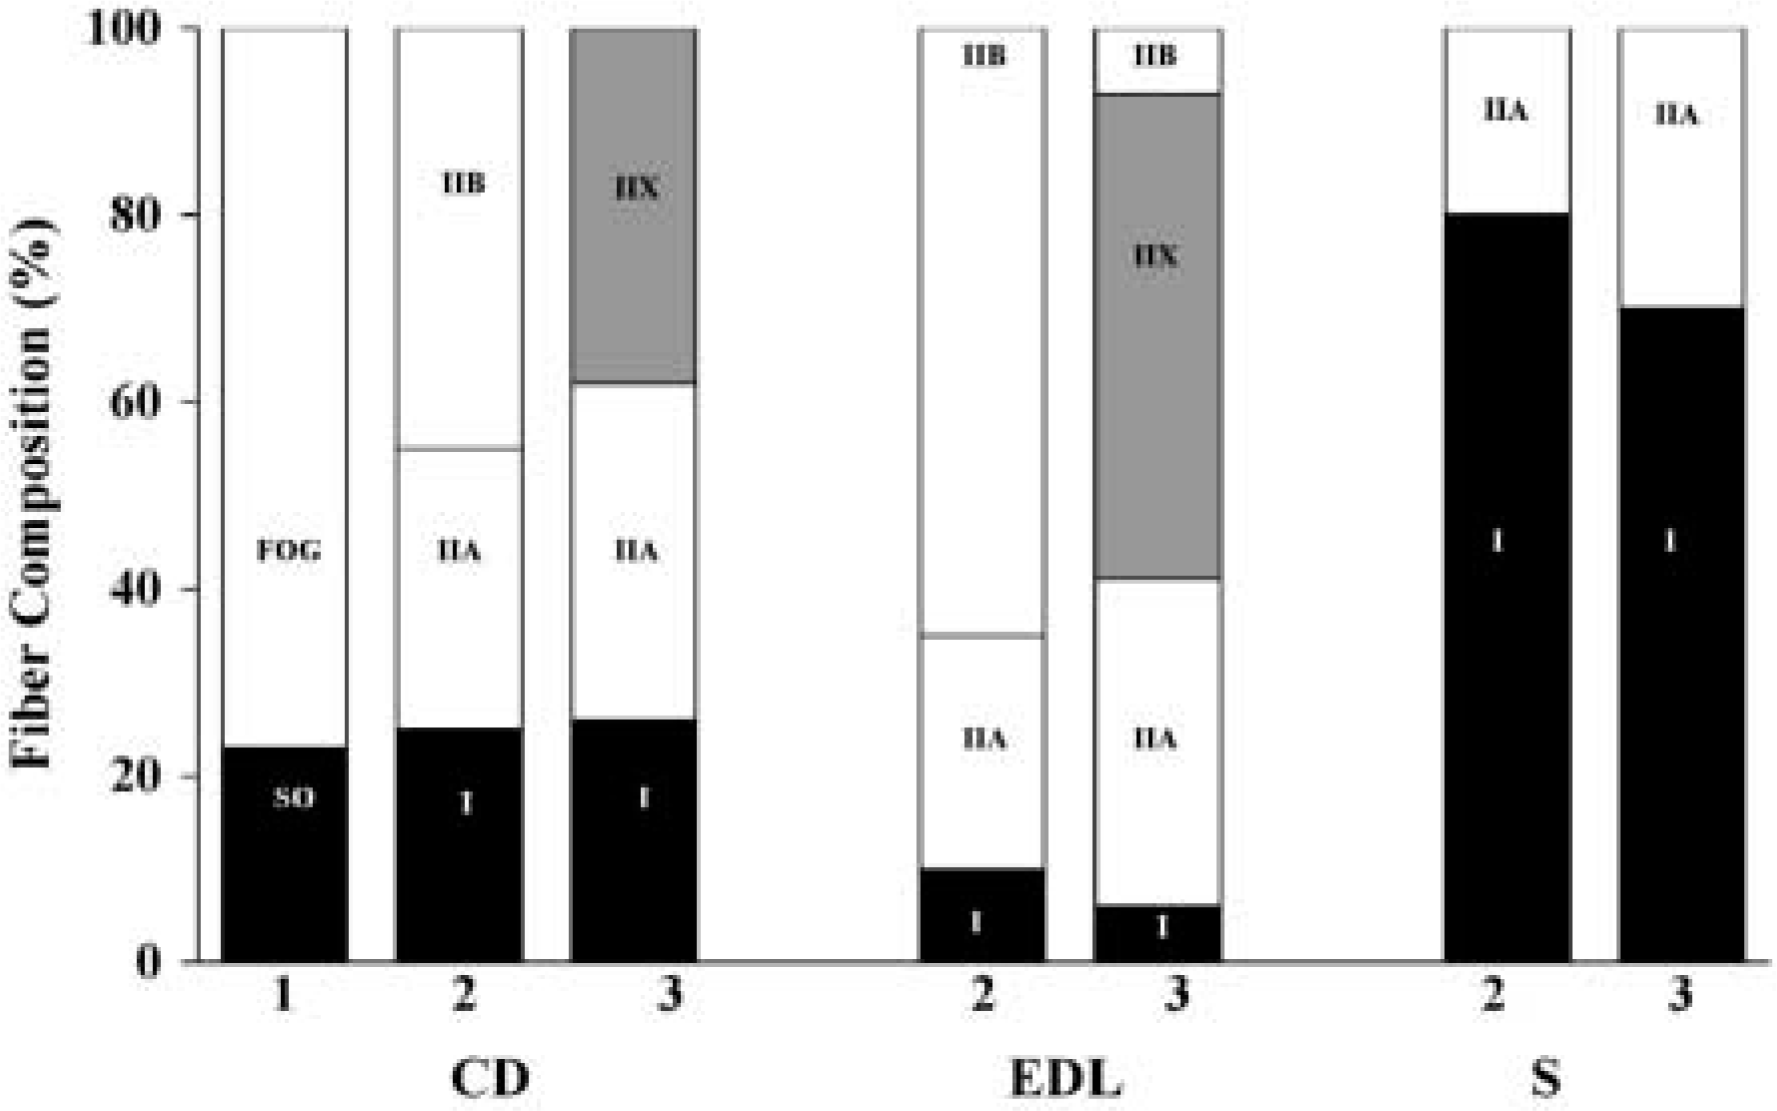
Percent fiber composition of the costal diaphragm (CD), extensor digitorum longus (EDL), and soleus (S) determined by Farkas and Roussos (1984) according to the methods of Peter et al. (Barnard et al. 1971; Peter et al. 1972; column 1), Wilcox et al. (1989) according to the methods of Brooke and Kaiser (1970; column 2), and by the authors of this paper according to the methods of Schiaffino et al. (1989; column 3). SO, slow oxidative glycolytic; FOG, fast oxidative glycolytic.
In the present study, correlational analysis indicated that the oxidative potential of hamster muscle is greatest in muscles composed primarily of type IIA fibers, and in the rank order of type IIA > I > IIX > IIB fibers (Table 3). However, unlike the fiber classification scheme of Peter et al. (1972), which uses both fiber myosin ATPase activity and metabolic properties to categorize fibers as SO, FOG, or FG, myosin heavy chain-based fiber typing, as was used in the present study, and myosin ATPase-based typing do not consider fiber metabolic properties as part of the fiber categorization (Reichmann and Pette 1982, 1984; Schiaffino et al. 1990; Punkt 2002). As a result, there is considerable overlap in the oxidative capacity among fibers typed by their myosin heavy-chain composition or myosin ATPase activity (Reichmann and Pette 1982,1984; Schiaffino et al. 1990; Punkt 2002).
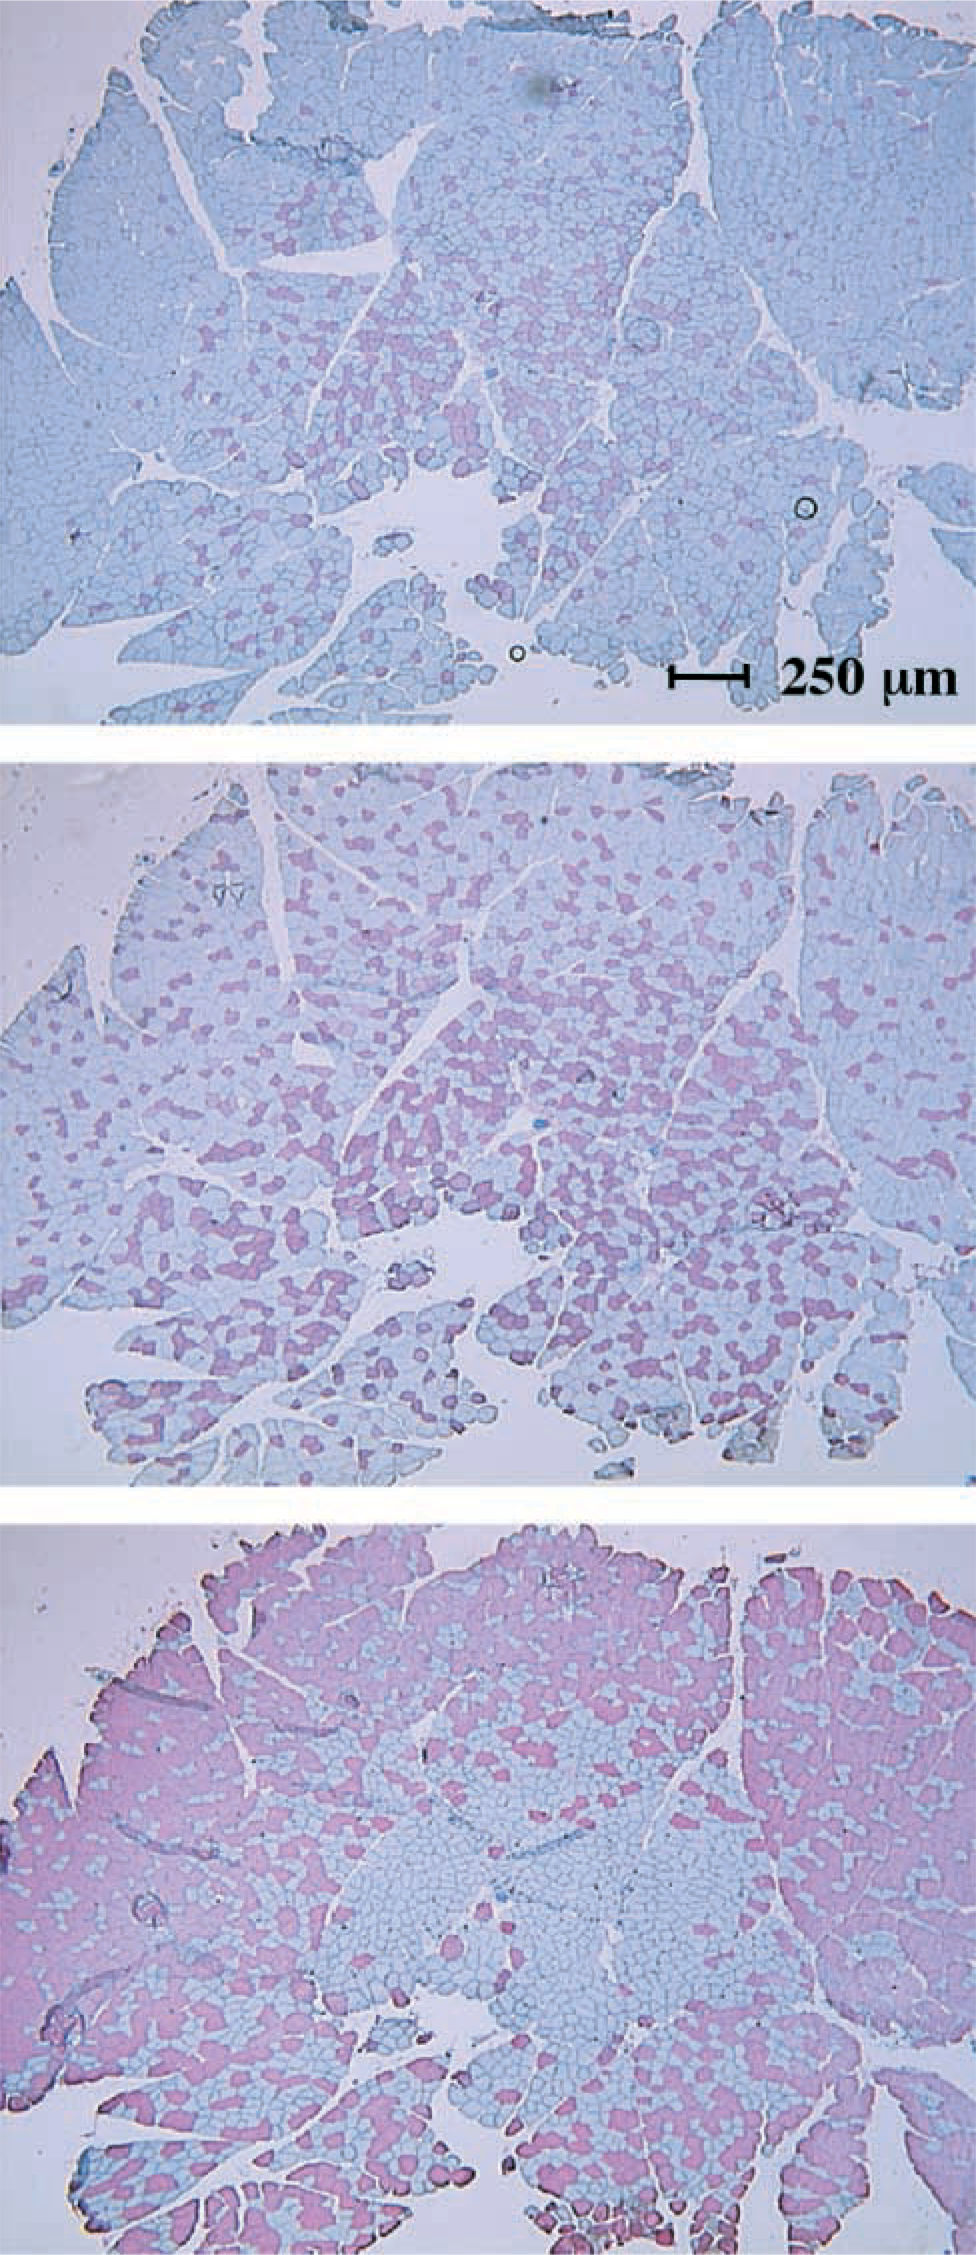
Serial cross-sections of hamster caudal adductor muscle stained red for the presence of type I fibers (top), type IIA fibers (middle), and type IIB fibers (bottom).
The rank order of fiber type and oxidative potential in hamster muscle is identical to that reported for the rat using similar correlational analysis and histological determination of fibers and oxidative potential (Delp and Pette 1994; Delp and Duan 1996). In addition, the ranges of citrate synthase activity among muscles from the rat and hamster are similar. For example, hamster skeletal muscle citrate synthase activities ranged from 9.9 μmol/min/g wet wt in cheek pouch muscle to 64.6 μmol/min/g wet wt in the costal portion of the diaphragm (Table 1), whereas in the rat, citrate synthase activity ranges from 8.1 μmol/min/g wet wt in cremaster muscle to 42.3 μmol/min/g wet wt in the red portion of vastus lateralis muscle (Delp and Duan 1996). In fact, in a muscle in which fiber composition is similar in the hamster and rat (e.g., semitendinosus muscle), muscle citrate synthase activity is almost identical (hamster 13.5 ± 3.8; rat 12.6 ± 0.5 μmol/min/g wet wt).
In summary, the results of the present investigation demonstrate that the relative mass of hamster skeletal muscle is predominantly composed of type IIX (39%) and type IIB (40%) fibers. In addition, there is a continuum of type IIX fiber composition among muscles, ranging from 0% in soleus to 100% in the cheek pouch muscle. Activity of citrate synthase, a marker of muscle oxidative capacity, was strongly correlated with the population of type IIA fibers and, similar to the rat, fell in rank order of type IIA > I > IIX > IIB. Muscle fiber cross-sectional area and distribution also varied within and among muscles in the hamster. The mean cross-sectional area of type IIX fibers was intermediate to type IIA and IIB fibers and fell in rank order of type IIB > IIX > IIA > I. Type I and IIA fibers tended to be more concentrated in deep limb muscles and deep portions of muscles, whereas type IIX and IIB fibers tended to be most concentrated in superficial muscles and muscle parts (Figure 2).
Footnotes
Acknowledgements
Supported by an American Lung Association grant RG-013-N, an American College of Sports Medicine Visiting Scholar Award, and a National Heart, Lung, and Blood Institute grant HL-50306.
We gratefully acknowledge Timothy I. Musch, PhD, and Sue Hageman for technical assistance with this project.