
Abstract
A major feature of epithelial cell polarity is regulated positioning of the mitotic spindle within the cell. Spindles in cells of symmetrically expanding tissues are predicted to align parallel to the tissue plane. Direct measurement of this alignment has been difficult in mammalian tissues. Here, we analyzed the position of spindles in intact mouse intestinal epithelium using microtubule immunofluorescence and three-dimensional confocal imaging. Mitotic cells were identified in the proliferative zone of intestinal crypts. Spindle angle relative to the apical cell surface was determined either by direct measurement from confocal images or with a computational algorithm. Angles averaged within 10° of parallel to the apical surface in metaphase and anaphase cells, consistent with robust planar spindle positioning, whereas spindles in prometaphase cells showed much greater angle variability. Interestingly, cytokinetic furrows appeared to extend from the basal cell surface toward the apical surface. This type of image analysis may be useful for studying the regulation of spindle position during tissue remodeling and tumor formation.
M
To determine how mitotic spindle positioning is affected by a higher degree of tissue organization, we imaged spindles directly in the tissue of origin. The intestinal epithelium undergoes continuous cell division in the crypt proliferative zone, making it an ideal tissue in which to analyze spindle positioning. A major challenge of imaging spindles in intestinal tissues is the three-dimensionality of the crypts within the tissue. To circumvent this, others have analyzed spindle position in crypts dissociated from the tissue with EDTA, finding a bias toward planar orientation, but with significant variation in spindle angle (Bjerknes and Cheng 1989). Rather than dissociating crypts, we used a geometrical algorithm for calculating spindle angle in 3D space.
We used anti-tubulin immunofluorescence on tissue sections to image spindles. Spindle angle relative to the apical cell surface was measured directly or calculated by solving for spindle and crypt orientation vectors. Metaphase and anaphase spindles were found to be tightly aligned parallel to the apical cell surface, and cytokinetic furrows were strikingly asymmetric, emerging from the basal cell surface. These mitotic features are similar to those seen in symmetric divisions in cells of diverse tissues including the Drosophila wing, the mammalian cochlea, and fly and vertebrate neuroepithelial cells (Lu et al. 2001; Dabdoub and Kelley 2005; Jenny and Mlodzik 2006; Dubreuil et al. 2007). These studies lay the foundation for future research on mechanisms of spindle positioning in intact epithelia, and they may be useful for detecting subtle phenotypes.
Materials and Methods
Mouse Intestinal Tissue
Mice used for this study were wild-type C57BL/6 obtained from the Jackson Laboratory (Bar Harbor, ME). Mice were housed in a ventilated, temperature- and light -controlled facility with ad libitum access to Purina laboratory rodent chow 5001 (Purina; St Louis, MO) and water, according to the Institutional Guidelines for Humane Care and Use of Laboratory Animals. Mice were sacrificed by CO2 asphyxiation according to a protocol approved by the Animal Care Committee at the University of Connecticut Health Center.
Fixation and Mounting
After sacrifice, small intestines were immediately excised and flushed with PBS. Surgical suture was used to tie off one end of the intestine, which was gently filled with 4% freshly made formaldehyde from paraformaldehyde (Ted Pella; Redding, CA) in PBS, tied at the other end, and placed in additional fixative for 6 hr. To address concerns that spindle microtubules might be destroyed by standard fixation at room temperature, fixation was initially done in the presence of 15 μM Paclitaxel at 37C, which provided good preservation of microtubules (data not shown). We subsequently found that omission of Paclitaxel and room temperature fixation gave equivalent spindle and individual microtubule preservation, without concerns about Paclitaxel-induced microtubule artifacts. As expected, incubation of tissues at 4C caused near-complete microtubule depolymerization (data not shown). After fixation, the tied ends of the tissue were removed, fixative was washed out with PBS, and the tissue was immersed in 30% sucrose (Fisher Scientific; Fair Lawn, NJ) in PBS overnight at room temperature. Tissue was opened longitudinally, rolled, and frozen in OCT (Triangle Biomedical Sciences; Durham, NC).
Sections of 8 μm were cut longitudinally through the center portion of the rolled tissue using a cryostat (Thermo Electron; Waltham, MA) and adhered to glass slides pre-coated with 1 mg/ml Poly-L-lysine (Sigma-Aldrich; St Louis, MO). Slides were washed with PBS, permeabilized with 0.5% Triton X-100 (LabChem; Pittsburgh, PA) in PBS for 5 min, washed with PBS, and incubated with or without 0.1 mg/ml collagenase (Wako Chemicals USA; Richmond, VA) in PBS at 37C for 1 hr. A previous report of light microscopy imaging of microtubules in intestines of mice perfused with Paclitaxel and fixative found that collagenase treatment greatly reduced tissue autofluorescence (Suzaki et al. 2004). Our use of collagenase did not significantly alter tissue fluorescence and was dispensable for microtubule (including spindle) imaging (data not shown).
Tissue Immunofluorescence and Staining
Slides were blocked with 1% BSA (Fisher Scientific; Pittsburgh, PA) in PBS for 5 min, followed by antibody incubation with FITC labeled anti-tubulin antibody DM1a (Sigma-Aldrich) diluted 1:200 in blocking solution for 16 hr. Actin was stained with Alexa568-labeled Phalloidin (Invitrogen; Eugene, OR) at 165nM in PBS for 1hr. DNA was counterstained with Hoechst 33342 (Sigma-Aldrich) at 1 μg/ml for 5 min (for visual identification of cells) and Syto61 (Invitrogen) at 200 nM in blocking solution for 30 min or DRAQ5 (Biostatus; Leicestershire, UK) at 5 μM in blocking solution for 5 min (for confocal imaging). Slides were washed with PBS, and cover slips were mounted with 0.5% p-phenylenediamine (Sigma-Aldrich) in 20 mM Tris 8.8 and 90% glycerol, sealed with nail polish, and stored at 4C.
Imaging
Imaging was done through a ×100 1.4 NA Plan Apo objective on an inverted Nikon TE2000-U microscope (Nikon Instruments; Melville, NY) equipped with a Yokogawa CSU-10 spinning disk confocal head (Perkin Elmer; Wellesley, MA) and a deep-cooled Orca AG CCD camera (Hamamatsu Photonics; Bridgewater, NJ). Image acquisition and processing were controlled by MetaMorph software (Molecular Devices Corp.; Sunnyvale, CA). Image stacks were acquired at 0.2-μM intervals in the z-axis.
Calculation of Spindle Angle
When spindle and crypt lumen were in the same image plane, spindle angle was measured directly from the image using the region measurements tool in MetaMorph software (Molecular Devices Corp.).
For image stacks in which spindle or crypt axis traversed multiple image planes, the axis of the crypt lumen and spindle were calculated from digitized x, y, z-coordinates. A spindle axis vector was determined from coordinates of the two spindle poles. A crypt axis vector was calculated by treating the crypt as a cylinder and fitting ellipses to digitized points from sections in three independent confocal image planes. Points on the ellipses were chosen manually on Alexa568-Phalloidin images, using the measure pixel feature of MetaMorph. They were fitted to an obliquely sectioned cylinder by first shifting the ellipse from each section plane to the origin and then aligning the long and short axes of each ellipse with the coordinate axes, using least squares minimization of the following error function:

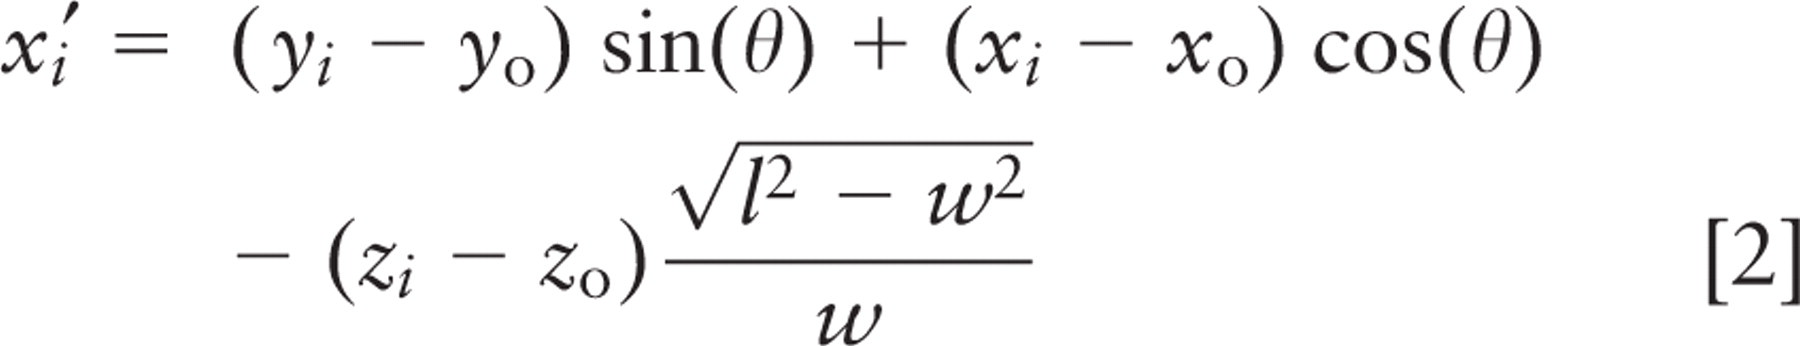

where (x i , y i , z i ) is the ith digitized point from the crypt wall and N is the total number of points. Parameters l, w, and (x0, y0 ) are length, width, and central point of the fitted ellipse, which are input as initial guesses; z0 is the vertical coordinate of the middle optical plane; and θ is the angle that aligns the fitted ellipse with the coordinate axes. The error is a measure of the difference from a perfect ellipse. The ratio of length to width for the fitted ellipses was used to calculate crypt inclination, and the centers of ellipses from the three image planes were connected to generate a vector pointing along the crypt axis.
Spindle inclination relative to the apical cell surface was calculated from the spindle axis vector and a vector from the spindle axis center to the nearest point on the crypt axis using the following formulas:
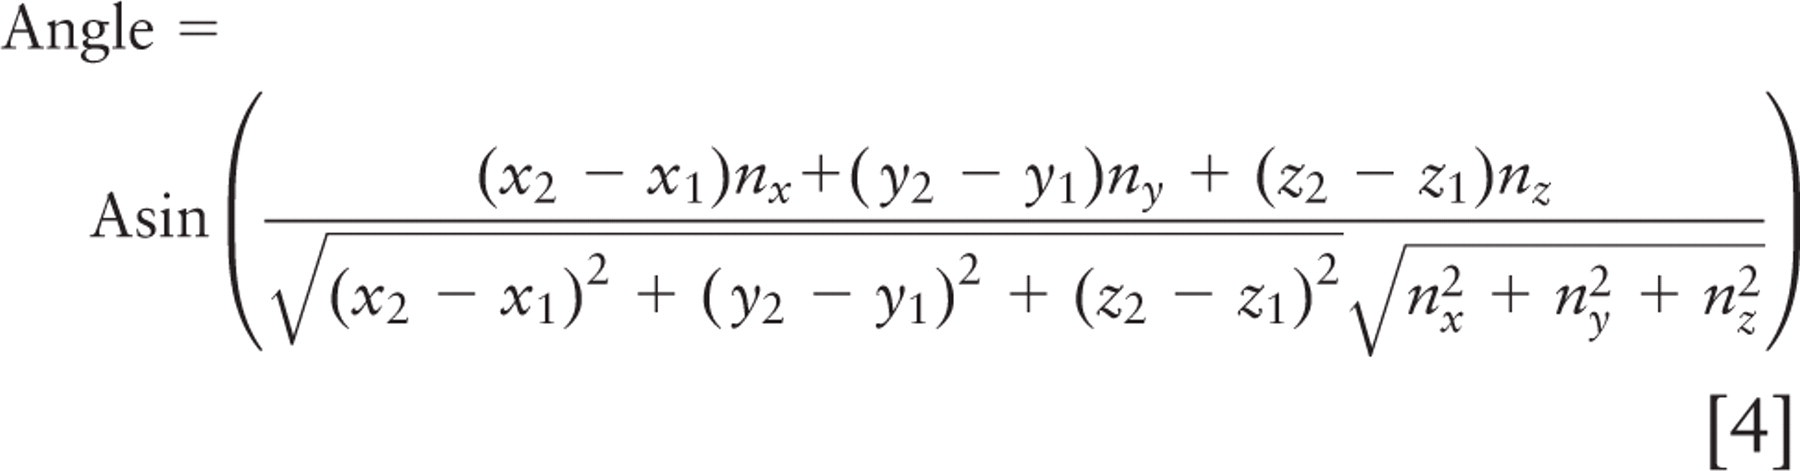
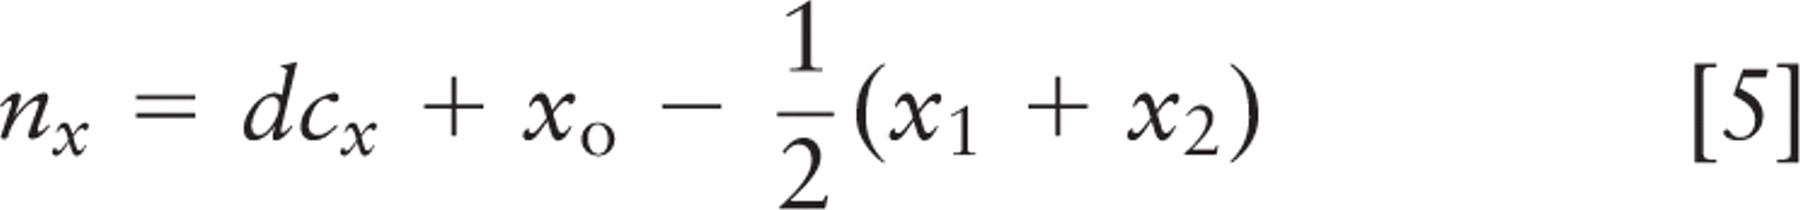
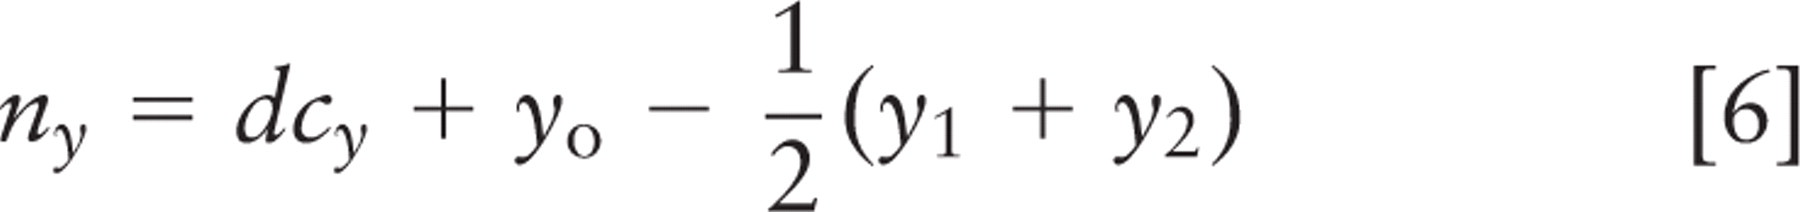
where (x 1, y 1, z 1) and (x2, y2, z2 ) are spindle pole coordinates, with the first point farther from the crypt. Components (nx, ny, nz ) define the vector that points directly from the spindle to the crypt, and (cx, cy, cz ) define the vector that points along the crypt axis. Orientations are strictly positive, with a maximum of 90° for a spindle axis perpendicular to the crypt axis; all spindles tangent to the surface of the crypt lumen had an angle of 0°. These calculations and other statistical analyses were done in Microsoft Excel (Microsoft; Redmond, WA); parameter optimization by least squares fitting was done with Excel's solver function. This method was not used for spindles in cells bordering the rounded bulb at the base of the crypt. Direct measurement and calculation of spindle angle were done with approximately equal frequency.
Results
Mitotic Spindle Imaging
Tissues were fixed at room temperature or 37C to preserve microtubule integrity and interactions that might be important for spindle positioning. The percentage of longitudinally oriented crypts was increased by rolling tissue into a jelly roll, embedding it in OCT, and sectioning to reach the center region of the roll (Figure 1). This allowed easier identification of the proliferative zone of the crypt in which mitotic cells are located. Microtubule immunofluorescence was imaged by confocal microscopy at ×100 magnification in serial z sections that encompassed the entire cell and the adjacent crypt region.
Determination of Spindle Angle
Spindle angle was determined relative to the apical surface of the mitotic cell, which together with apical surfaces of adjacent cells formed the border of the crypt lumen. Alexa568-Phalloidin staining was used to facilitate identification of the actin brush border at these apical surfaces. Spindle angle was measured directly in single image planes when feasible. When spindle and/or crypt lumen traversed multiple image planes, spindle angle—the angle between the spindle vector and the apical surface of the crypt cells—was calculated using digitized x, y, z-coordinates from image stacks (Figure 2). The spindle vector was determined from the two spindle poles, which were identified by the small hole in the fluorescence at the convergence of spindle microtubules. The crypt vector in the region of the spindle was calculated from the coordinates of manually chosen points on apical cell surfaces in three separate image planes (see Materials and Methods and Figure 2).
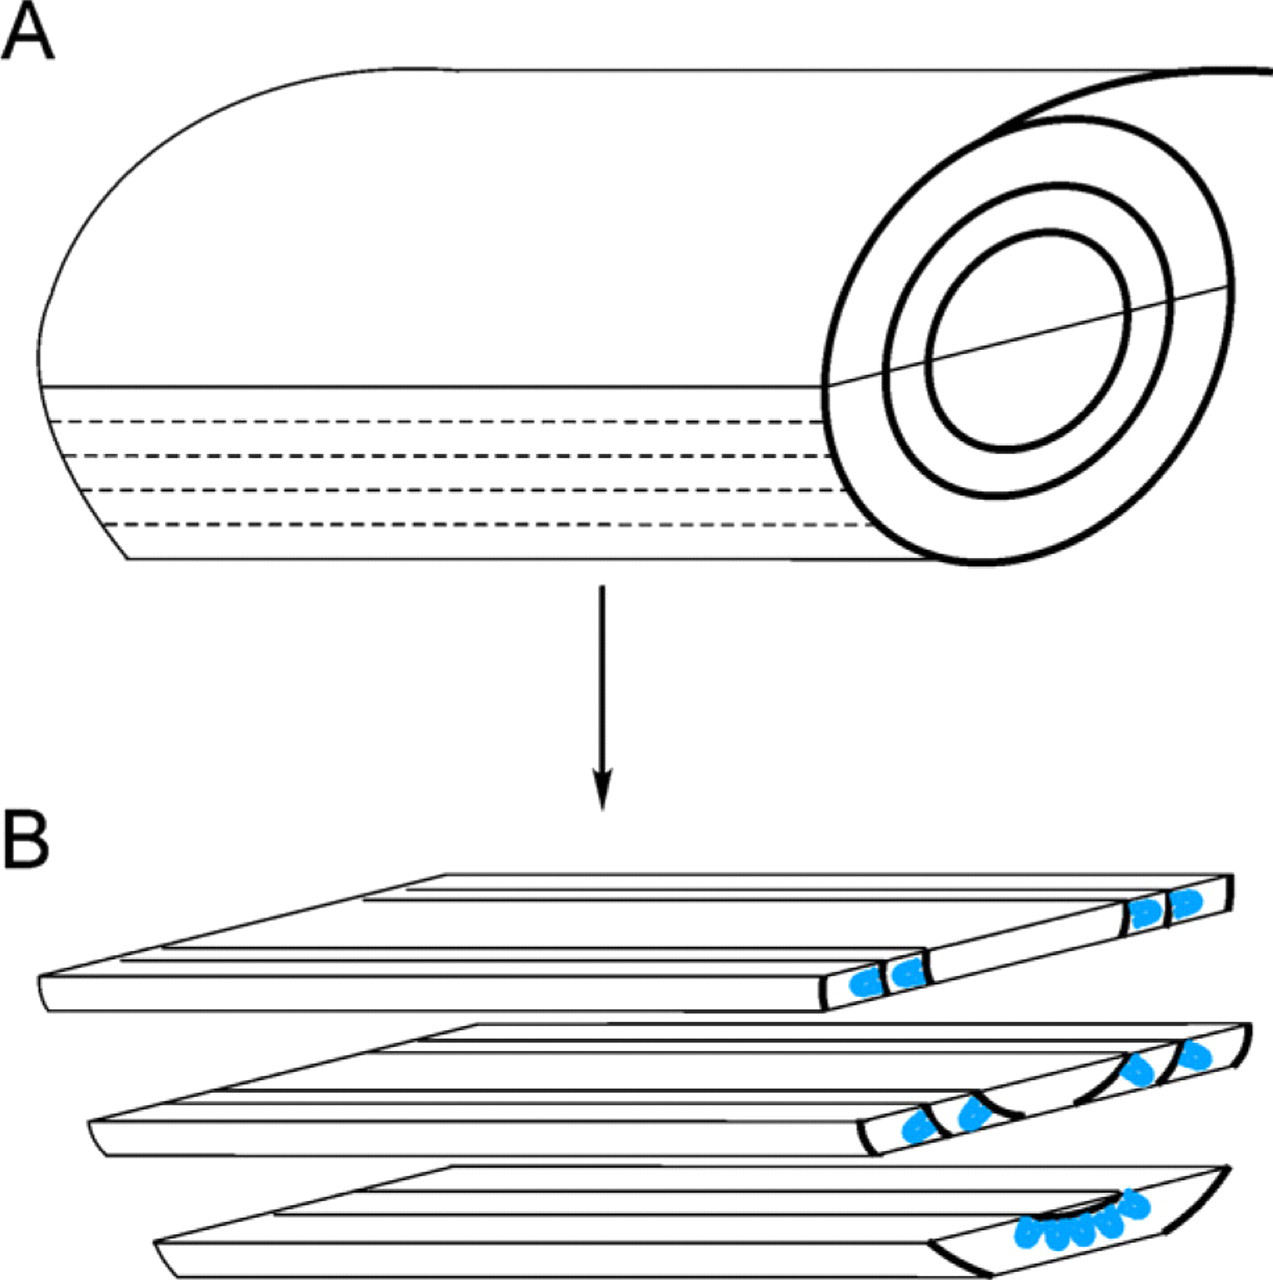
Method for orienting and cutting tissue. (
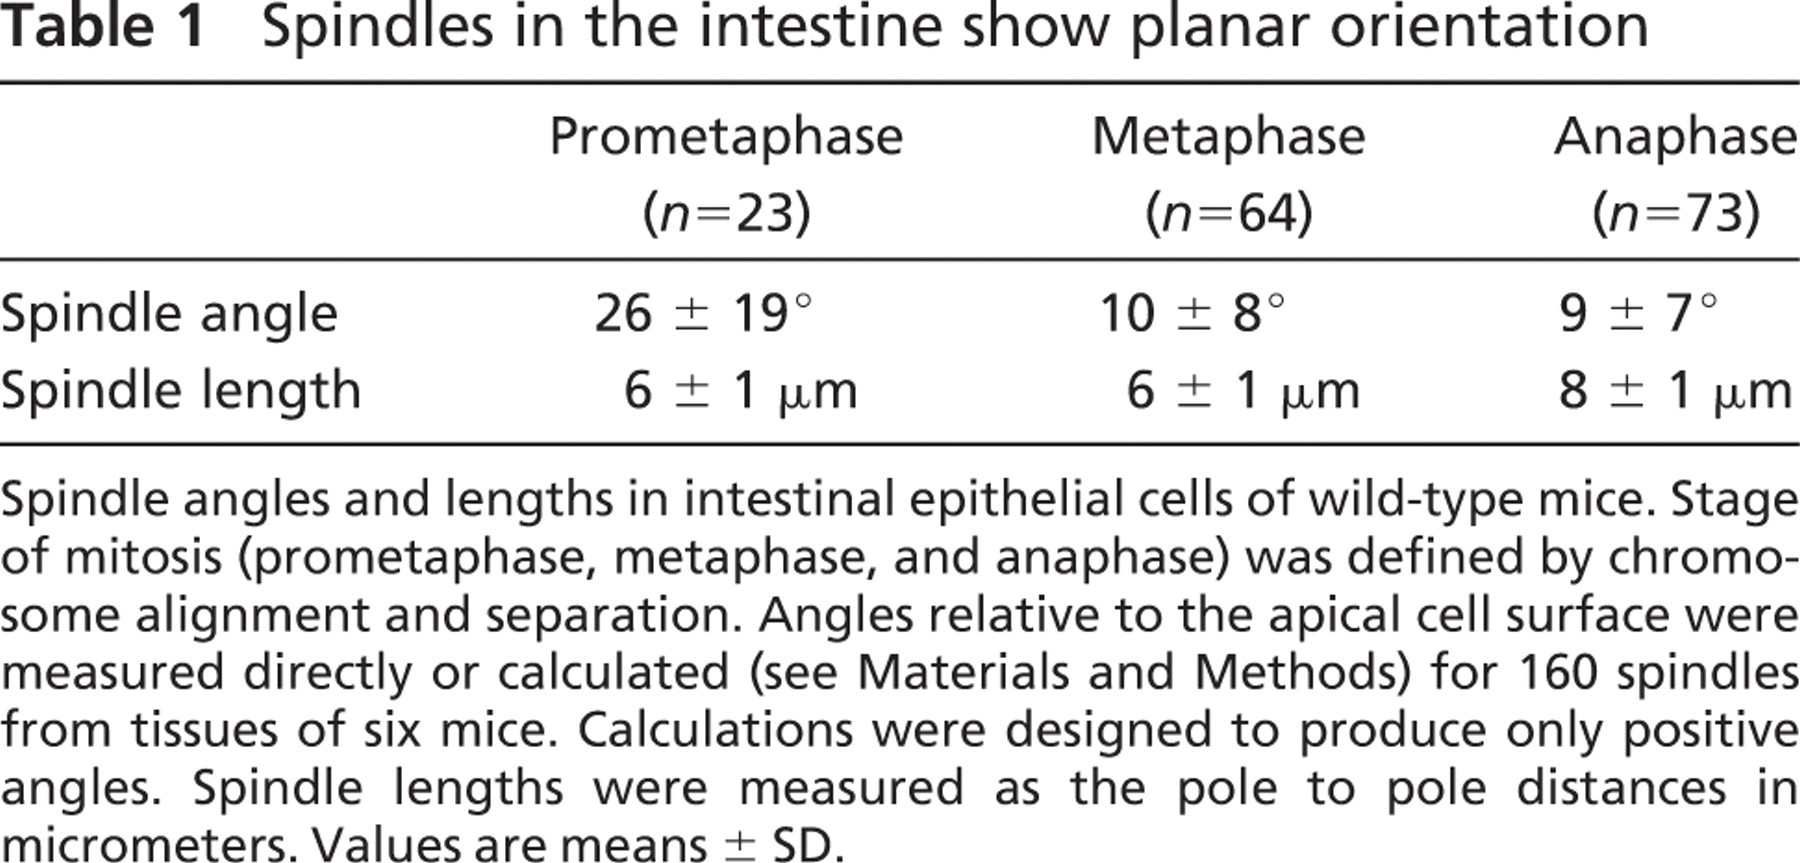
Spindle angles were categorized according to the stage of mitosis, as determined by chromosome alignment (Figure 3; Table 1). In prometaphase cells, spindle angles ranged from 3° to 63°, with a mean of 26 ± 19° (SD; n=23). Only 7 of 23 spindle angles (30%) were ≤10°, and spindles in 10 of 23 cells (43%) had angles >30°. These angles are consistent with a bias toward spindle alignment parallel to the apical cell surface, but with great variability. In metaphase and anaphase cells, spindles were much more closely aligned to the apical cell surface. For metaphase cells, angles ranged from 0° to 33°, with a mean angle of 10 ± 8° (n=64). Forty of 64 metaphase spindle angles (63%) were ≤10°. For anaphase cells, angles ranged from 0° to 29°, with a mean angle of 9 ± 7° (n=73). Forty-eight of 73 anaphase spindle angles (66%) were ≤10°. Only one spindle in 137 metaphase and anaphase cells had an angle >30°. These metaphase and anaphase angles are consistent with greater regulation of spindle positioning at the later stages of mitosis. Spindles in all mitotic cells were displaced apically relative to interphase nuclei. Spindle lengths, measured or calculated as the pole to pole distances, were 6, 6, and 8 μm in prometaphase, metaphase, and anaphase cells, respectively (Table 1).
Cytokinetic Furrows Appear to Extend Asymmetrically From Basal to Apical Cell Surface
Mitotic cells appeared to be highly rounded and compressed at their bases by adjacent cell nuclei. Their spindles were apically displaced, and only a thin cytoplasmic process, discernible by Alexa568-Phalloidin staining of subcortical actin, connected them to the underlying basement membrane (Figures 4A and 4B). Such a process was seen on all mitotic cells analyzed. When viewed as an isosurface, the process appeared as a stalk tethering the mitotic cell to the basement membrane (Figures 4C–4E). In late mitotic cells, the process appeared more sheet-like. In 22 image stacks analyzed, a potential connection between the sheet and both future daughter cells appeared to exist for every mitotic cell.
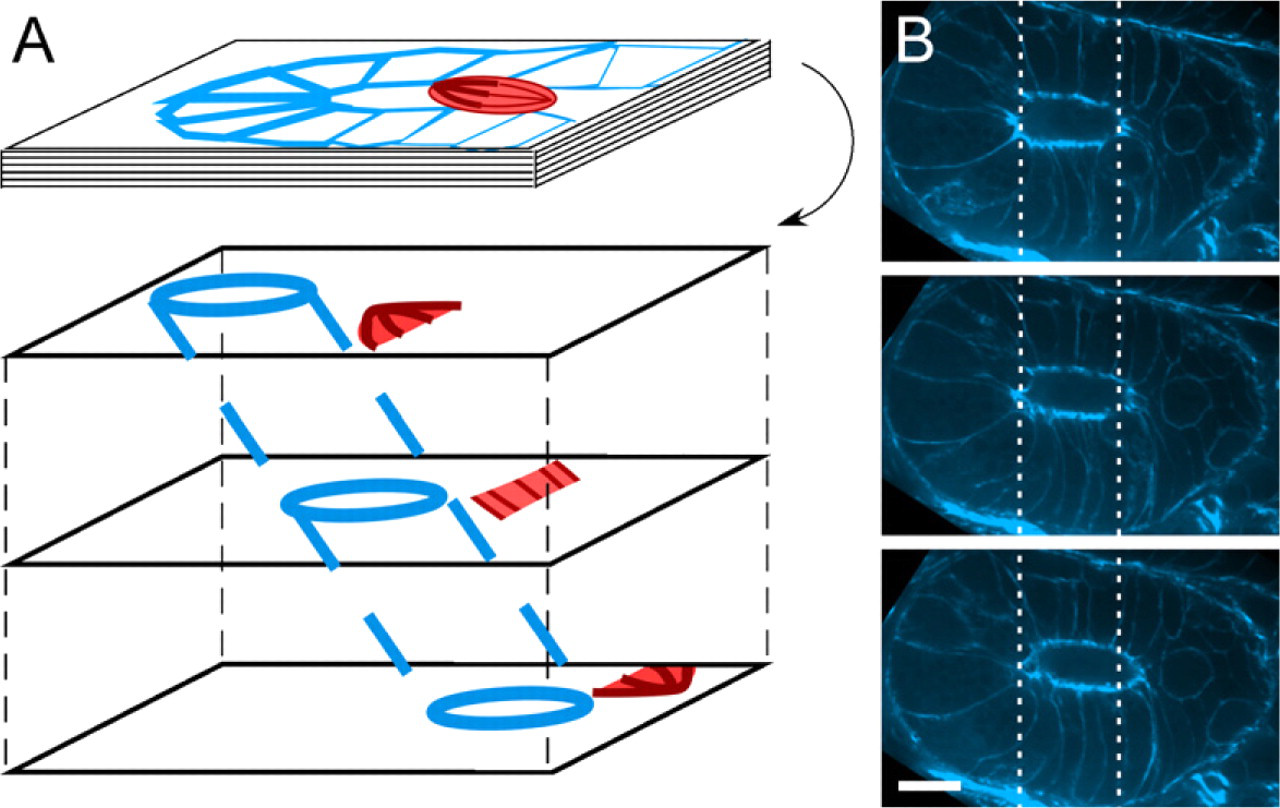
Method for calculating crypt inclination. (
Interestingly, late mitotic cells appeared to extend their cytokinetic furrow solely from their basal surface, rather than contracting it across the spindle midzone from both the apical and basal sides (Figure 5). Static images did not distinguish whether the furrow originated from the cytoplasmic process or from a region near the process. Consistent with the cytokinetic furrow originating at the basal cell surface and extending apically, spindle remnants and midbodies were always seen at the apical cell borders and never at the basal or lateral borders in 101 late telophase cells.
Planar polarity spindle positioning allows both daughter cells to maintain contact with the basement membrane of the tissue in which they reside. To determine whether the mean spindle angle of 10° in metaphase and anaphase cells would have preserved this contact, we calculated the aspect ratio of the cells and the maximal angle that would preserve attachment of both daughter cells to the basement membrane. The typical aspect ratio of cells in our study was ∼5:1 (mean height, 21 μm; mean width, 4 μm; n=50 interphase cells). Mitotic cells were rounded and nearly twice as wide (mean diameter, 8 μm; n=49 mitotic cells). Mean spindle position within the cell was 14 μm from the basement membrane (n=49). These dimensions are shown in Figure 6. Thus, an apically located spindle with an angle >30° with respect to the apical surface would be expected to produce one daughter cell lacking contact with the basement membrane, if it generated an orthogonal plane of cytokinesis. By these criteria, cell divisions in 99% of metaphase and anaphase cells in the small intestine would preserve attachment of both daughter cells to the basement membrane.

Stages of mitosis correlate with spindle alignment. (
Discussion
Spindles in the Mammalian Intestine Show Planar Orientation
In the tissues of wild-type mice, spindle angles in metaphase and anaphase cells suggest stringent regulation of planar spindle orientation. Planar cell polarity is a likely candidate for providing the control mechanism for this orientation, because loss of planar cell polarity components in other systems disrupts spindle orientation (Le Borgne et al. 2002; Gong et al. 2006). Adherens junctions could provide the link between planar cell polarity and planar spindle orientation, because these junctions are located at lateral cell borders near the apical surface and contain polarity determinants and microtubule binding proteins (Lu et al. 2001; Tepass 2002; Perez-Moreno et al. 2003). Junctional complexes may capture astral microtubules by binding to microtubule plus-end proteins (also known as +tips) (Bienz 2001; Lu et al. 2001), and forces generated by cytoplasmic dynein and/or microtubule dynamics may rotate spindles into alignment (Skop and White 1998; Gönczy et al. 2001; Perez-Moreno et al. 2003; Grill and Hyman 2005). Mouse models incorporating mutations or gene deletions of these proteins should allow testing of their roles in the spindle positioning process in fully polarized epithelial tissues. These studies are likely to be complicated, because planar cell polarity may be required for planar spindle orientation, and planar spindle orientation may be required to maintain planar cell polarity (Perez-Moreno et al. 2003). Interestingly, substantially tighter regulation of spindle orientation was found in the intact tissue compared with cells of isolated intestinal epithelial crypts (Bjerknes and Cheng 1989). Partial loss of adherens junctions in cells of dissociated crypts might explain the greater variability in spindle angle.
Spindles in the intestine show planar orientation
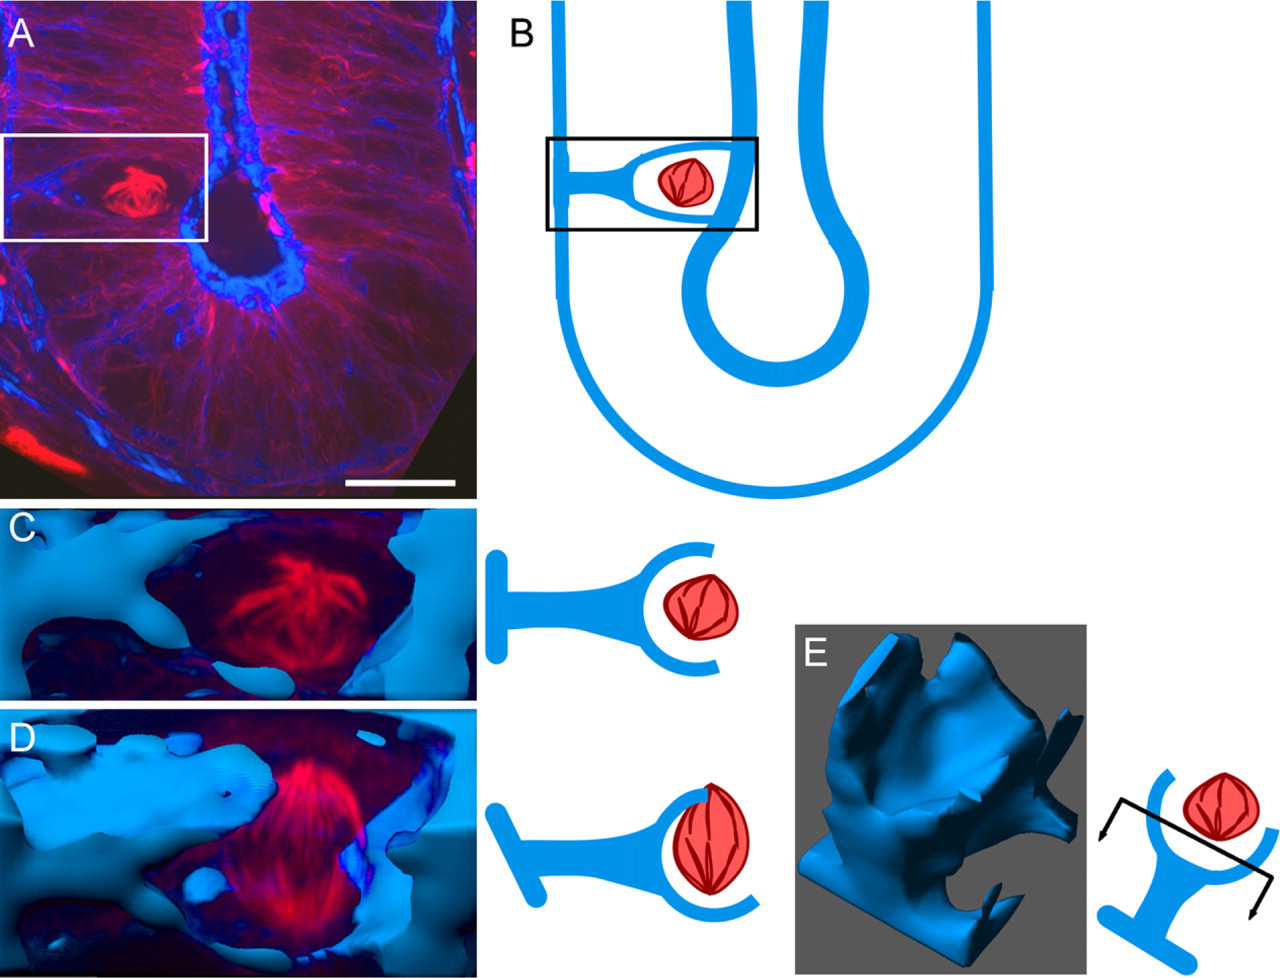
A thin cytoplasmic process connects the mitotic cell to the basement membrane. Mitotic (metaphase) cell immunofluorescence for tubulin (red) combined with isosurface rendering of Phalloidin staining (blue) show the process connecting the mitotic cytoplasm to the basement membrane. (
Tight regulation of spindle position may be especially important in the intestine. The intestinal epithelium requires continuous repopulation with new cells to replace those shed at the villus tip. New cells must retain their position in the monolayer as they migrate up the crypt—villus axis. Otherwise, as our cell shape measurements suggest, daughter cells would be unable to maintain their position in the monolayer and would lose contact with the basement membrane. Such cells would be expected to be shed and/or undergo apoptosis within the crypt lumen. This cell loss could lead to significant thinning of the epithelial layer under physiologic conditions and to more severe loss of epithelial integrity in response to de-epithelializing injury.
Failure of spindle angle regulation could also lead to abnormalities in tissue organization, including developmental defects and tumor formation. The latter might result if a daughter cell lost contact with the basement membrane but failed to undergo apoptosis as a consequence. Proliferation of such a daughter cell and its progeny could generate hypertrophy and loss of normal tissue architecture. Mutations that simultaneously disrupted spindle—cell cortex interactions and apoptosis signaling could induce these changes. Loss of function of the colon cancer tumor suppressor adenomatous polyposis coli (APC) have been shown to alter spindle positioning in flies and cultured cells (Lu et al. 2001; Yamashita et al. 2003; Green et al. 2005), APC may play a role in apoptosis, and APC mutations occur early in intestinal tumorigenesis (Bodmer 2006). APC is thus an attractive candidate for regulating spindle orientation and its consequences in the intestine.
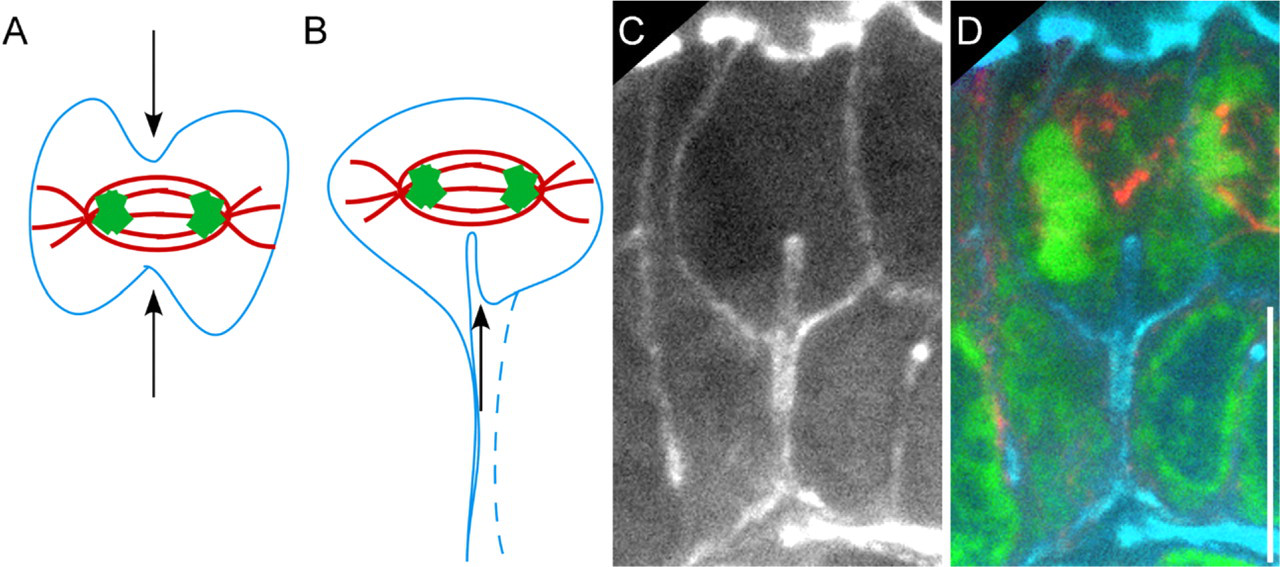
Differences in cytokinetic furrow placement in cultured cells vs intestinal epithelial cells. (
Cytokinesis in Intestinal Cells Shows Dramatically Asymmetric Furrowing
In addition to their alignment parallel to the apical cell surface, spindles in intestinal epithelial cells were also apically displaced. Such apical displacement has been seen in cultured MDCK cells and in symmetrically dividing neural progenitor cells of the neurocortex and retina (Reinsch and Karsenti 1994; Das et al. 2003; Dubreuil et al. 2007). Correspondingly, the basal cytoplasm in the intestinal cells appeared compressed by the nuclei of adjacent interphase cells, leaving only a thin cytoplasmic process between the mitotic cell and the basement membrane. Similar processes have been seen in symmetrically dividing cells, and their asymmetrical inheritance by one of the daughter cells has been inferred (Das et al. 2003). The intestinal epithelial images in our study gave the impression that both daughter cells retained connections to this basal process, which in later stages of mitosis appeared more like a sheet than a stalk (Figures 4 and 4).
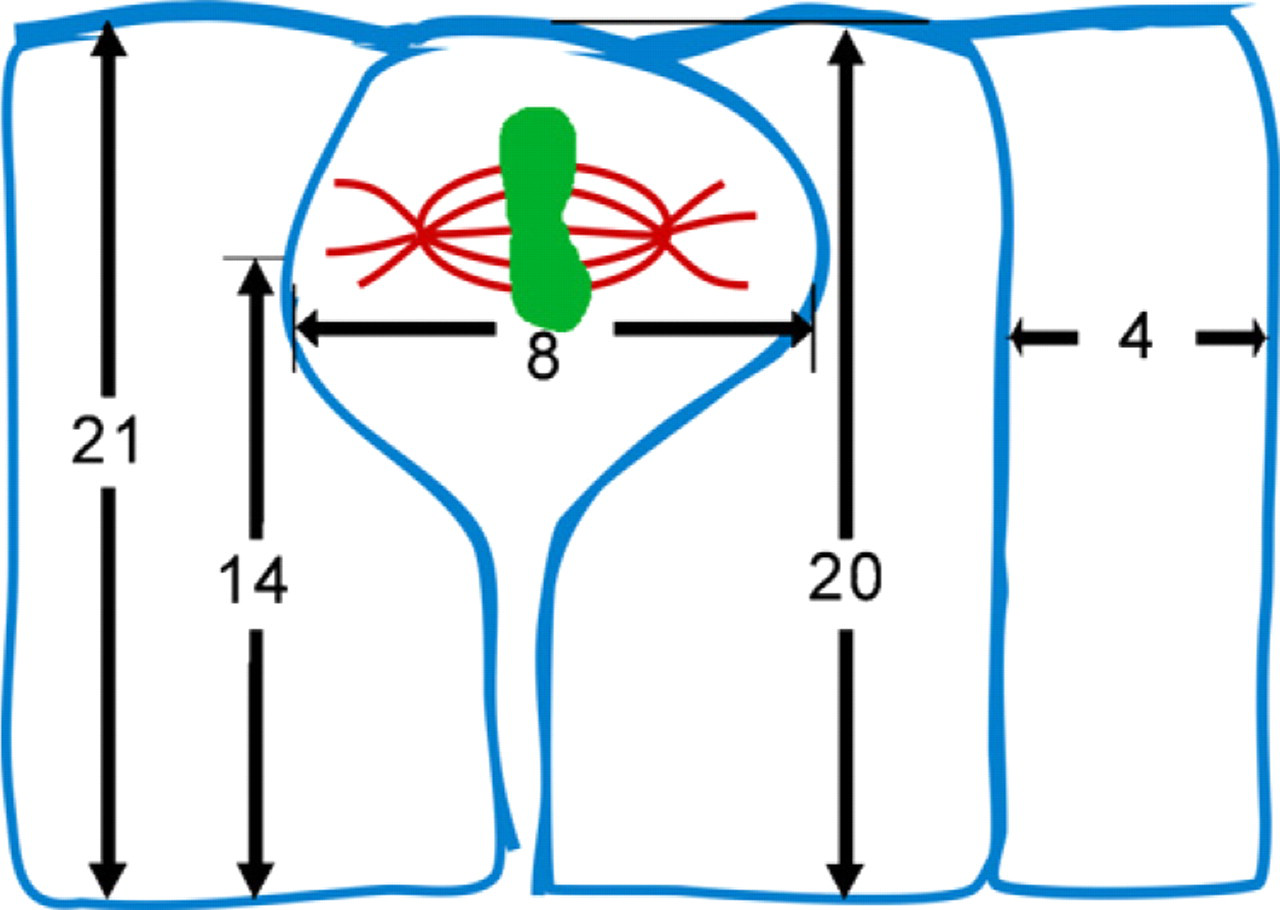
Aspect ratios of intestinal cells. The average interphasic cell was 4 μm wide by 21 μm tall (n=50). The average mitotic cell was 8 μm wide by 20 μm tall, including its cytoplasmic process (n=49). The average mitotic spindle at the level of its poles was 14 μm from the base of the process (n=49). Spindle angles <30° would create an orthogonal plane of cytokinesis that extended to the base of the cell, allowing both daughter cells to maintain attachment to the basement membrane.
The other striking asymmetry along the apico-basal axis was the position of the cytokinetic furrow. Unlike cultured cells, in which furrows contract symmetrically across the spindle midzone (Eggert et al. 2006), furrows in intestinal cells appeared to extend exclusively from the basal region of the cell (Figure 5). This appearance was also seen in electron microscopy studies of intestinal epithelia (Jinguji and Ishikawa 1992). In late mitotic cells, spindle remnants and midbodies were located exclusively at the apical cell borders. Interestingly, such asymmetric furrowing has been observed in other planar cell divisions in vivo (Das et al. 2003; Dubreuil et al. 2007) and during the cellularization process of Drosophila embryos (Royou et al. 2004).
The spatial relationship between the furrow and the cytoplasmic processes connecting the cell to the basement membrane could not be determined from our image stacks of fixed tissue. Thus, it is not clear whether furrowing originates from this process or from another region of the basal cytoplasm. Perhaps the furrow trajectory is initially determined by the basal cytoplasm and becomes redirected by interactions with spindle and astral microtubules to ensure proper distribution of daughter nuclei. Testing this hypothesis will likely require live cell imaging of intact intestinal tissues.
Footnotes
Acknowledgements
This work was supported by the American Association for Cancer Research, the Cancer Research and Prevention Foundation, and the Patterson Trust.
We thank Maura Temchin for help with data analysis, Jakob Jorgensen for help designing the figure cartoons, and Vladimir Rodionov for helpful comments on the manuscript.