
Abstract
GIT1 and GIT2 belong to the family of ADP-ribosylation factor GTPase-activating proteins (ARF-GAP) and have been implicated in the regulation of G protein-coupled receptor sequestration, cell migration, T-cell activation, neuronal spine formation, and aggregate formation in Huntington's disease. Examination of endogenous GIT protein expression in tissues, however, has been hampered by the lack of GIT2-specific antibodies. To visualize GIT1 and GIT2 gene expression in mouse tissues, we created mice with β-galactosidase (β-Gal) reporters inserted into the two GIT genes. β-Gal staining confirmed the broad tissue distribution of GIT1 and GIT2 in the mouse but also revealed striking differences. GIT2 is expressed in most cells of the body, whereas GIT1 is restricted to only a subset of cells. For example, GIT2 is uniformly expressed throughout lung and liver, whereas GIT1 is restricted to cells lining blood vessels, bronchi, and bile ducts. Expression of GIT1 and GIT2 is mutually exclusive in the testes, where a developmental expression shift occurs, with GIT2 present in spermatogonia but GIT1 in mature spermatids. In conclusion, analysis of endogenous GIT expression revealed a nearly ubiquitous distribution of GIT2, whereas GIT1 is restricted to specific cell types even in tissues with apparently high GIT1 expression and is entirely absent from some tissues.
T
GIT proteins play a critical role in the catalytic inactivation of the Arf small GTP-binding proteins (Vitale et al. 2000), which is critical for the ability of GIT proteins to regulate Arf6-dependent sequestration of activated GPCRs from the cell surface (Premont et al. 1998; Claing et al. 2000). On the other hand, GIT proteins act as part of a scaffold complex to link several signaling molecules to distinct sites of action. In this oligomeric complex, GIT proteins bind tightly to the p21-activated kinase-interacting exchange factor (α/β PIX) proteins through homomeric and heteromeric interactions (Premont et al. 2004). PIX proteins in turn bind to p21-activated kinases (PAKs). Through the interaction of integrin-bound paxillin with GIT proteins, GIT/PIX complexes bring PAK to focal adhesions, where PAK can exert its kinase activity to regulate focal adhesion assembly and disassembly (Zhao et al. 2000). Similarly, GIT/PIX complexes target PAKs to centrosomes, where PAK regulates the activity of Aurora kinase (Zhao et al. 2005). In contrast to GIT functions mediated via enzymatic activity or scaffolding, GIT1 has been shown to interact directly with huntingtin, causing an acceleration in huntingtin aggregation (Goehler et al. 2004).
Although GIT1 and GIT2 proteins are highly similar and exhibit the same domain structure, only a few studies have directly compared their activities. First, both GIT1 and GIT2 are active as PIP3-stimulated GAPs for all three classes of Arf proteins (Vitale et al. 2000) and are able to regulate Arf6-dependent GPCR sequestration (Premont et al. 2000). Second, both GIT1 and GIT2 bind directly to paxillin and thereby localize to focal adhesions. However, the direct comparison of mammalian GIT1 and GIT2 suggests that GIT2 binds to paxillin with much lower affinity than does GIT1 (Premont et al. 2000). Third, comparing tyrosine phosphorylation of GIT1 and GIT2 during cell adhesion, GIT1 phosphorylation was unaffected by cell adhesion, whereas GIT2 was transiently phosphorylated during attachment (Shikata et al. 2003a). In addition, GIT2 association with focal adhesions was dependent on its phosphorylation by Src family kinases at three tyrosine residues, whereas GIT1 localization to focal adhesions was unaffected by loss of Src family kinases (Brown et al. 2005).
The high sequence and functional homology, as well as the equivalently strong homo- and heterodimerization of GIT1 and GIT2 proteins, suggest some level of functional redundancy in vivo. To study the individual GIT proteins in a cellular context, it is important to know their tissue- and cell-specific expression patterns. Northern blot experiments suggested that both GIT mRNAs are expressed in many of the same tissues in human and rat (Premont et al. 1998, 2000). Thus far, it has been impossible to determine the tissue distribution in more detail due to the lack of specific antibodies for the GIT2 protein.
In this study we report the generation of mouse lines with β-galactosidase (β-Gal) reporters inserted into either the GIT1 or GIT2 gene to visualize their expression in different mouse tissues. Results from our β-Gal staining studies confirm the broad distribution of the two GIT genes seen in human and rat, but also reveal many differences. For example, both genes seem to be coexpressed in most areas of the brain, with the exception of the cerebellum, where only GIT2 is found in the granule cells. In the liver and lung, GIT2 is expressed in most cell types, whereas GIT1 expression is restricted to the vasculature in these organs. Interestingly, GIT1 and GIT2 genes are regulated in a striking cell maturation-dependent fashion in testes. Whereas GIT2 expression is on in early-stage gonia cells and turned off as these cells mature, GIT1 expression is off in the gonia cells but turned on in maturing spermatids. Results of this study reveal major differences in the expression pattern of endogenous GIT1 and GIT2 in mouse tissues, which will be valuable in directing in future studies comparing tissue- or cell type-specific GIT1 and GIT2 functions.
Materials and Methods
Generation of Mice
Embryonic stem (ES) cells for the generation of genetrap mice for GIT1 (S10-12C (P17-1B)) and GIT2 (XG510) were purchased from the Fred Hutchinson Cancer Research Center (Seattle, WA) (Chen and Soriano 2003) and the BayGenomics Consortium (Stryke et al. 2003), respectively. Genetic background of the ES cells is 129S4 for GIT1 and 129/Ola for GIT2. Locations of the genetraps in the ES cell lines were confirmed by genomic PCR and RT-PCR, and genetrap function was confirmed by β-Gal staining of the ES cells. Cells were then screened for a normal karyotype before being injected into C57/BL6 blastocysts and the blastocysts inserted into pseudo-pregnant C57/BL6 females. Chimeric animals were screened for the presence of the genetrap by genomic PCR, and positive animals were paired with C57/BL6 partners for breeding. Animals used in this study were 2- to 4-months of age and heterozygotes (HET) from the F2 generation on a mixed background. Neither GIT1 nor GIT2 HET animals were different in body size, organ size, overt behavior, or fertility when compared with the wild-type (WT) animals. All animals were treated in accordance with NIH guidelines for the care and use of animals and an approved animal protocol from the Duke University Institutional Animal Care and Use Committee.
PCR Genotyping
GIT1 mice and GIT2 mice were genotyped by genomic PCR isolated from tail clips. Amplification was carried out by standard PCR protocol. Primers used to screen the WT GIT1 mice are forward primer 5′-GCTGAGCATCCTGAGTTCTA, reverse primer 5′-GTGCTTGACAATGGAGATGT. Primers used to screen the gene-trapped GIT1 mice are forward primer 5′-CTCTGGACAGCACACAATG and reverse primer 5′-CATCAAGGAAACCCTGGACTACTG. Amplification for GIT2 mice was carried out by standard PCR protocol in a triplex primer reaction. Primers used to screen the GIT2 mice are forward primer 5′-TCTCCTGGAACTCAGGGATT, reverse primers (wt) 5′-CATTTCAGAGTCTGCTGCCTTA and (tg) 5′-GGCTACCGGCTAAAACTTGA.
RT-PCR
Total RNA was isolated from mouse brains using Trizol (Invitrogen; Carlsbad, CA) following manufacturer's instructions. RNA was then added to the one-step RT-PCR reaction mix (SuperScript III One Step RT-PCR kit; Invitrogen) and amplified using the following primers: GIT1 exon 1 5′-CTGAGGATGTCCCGGAAG, ROSAFARY vector 5′-GACAGTATCGGCCTCAGGAAGATCG; GIT2 exon 1 5′-ATGTCGAAGCGGCTCCGGAG, pGT1lxf vector 5′-GACAGTATCGGCCTCAGGAAGATCG.
β-Gal Staining
Heterozygous GIT1 and GIT2 mice were sacrificed using CO2 asphyxiation and the tissues harvested immediately. After rinsing the tissues in PBS, tissues were incubated in 30% sucrose at 4C until the tissues began to sink, usually several days. Tissues were then rinsed in PBS, embedded in optimal cutting temperature compound (OCT; Tissue-Tek, Sakura Finetek, Torrance, CA), frozen in liquid nitrogen, and stored at −80C. Before sectioning, tissues blocks were equilibrated to −20C in a cryostat (Microm HM500 OM; Microm, Oceanside, CA). Twenty- to 30-μm-thick sections were cut and transferred onto superfrosted glass microscope slides and dried at room temperature overnight. Immediately before staining, tissues were fixed in 0.2% glutaraldehyde, 5 mM EGTA in PBS for 10 min at 4C, and rinsed with deionized water several times. Slides were transferred to staining solution containing 2 mM MgCl2, 5 mM K2 ferrocyanide, 5 mM K2 ferricyanide, 0.01% Na-deoxycholate, 0.02% NP-40, and 1 mg/ml X-Gal (Invitrogen) in PBS and incubated for 24 hr at 37C. Tissue sections were then rinsed several times with deionized water and left to dry at room temperature overnight. Coverslips were mounted with SHUR-Mount (Triangle Biomedical Sciences; Durham, NC) and pictures taken with a Zeiss epifluorescence microscope (Carl Zeiss; Oberkochen, Germany) at the indicated magnifications. Three mice for each gene and genotype were analyzed.
Immunohistochemistry
Testes and cerebellum were isolated from GIT2 WT and GIT2 HET animals and fixed in 4% paraformaldehyde in PBS overnight at 4C. Tissues were then rinsed in 70% ethanol in water and paraffin embedded before being processed and stained at the Duke University Medical Center Immunohistology Research Laboratory. GIT1 was detected using the rabbit polyclonal antibody H170 (Santa Cruz Biotechnology; Santa Cruz, CA), and tissues were counterstained using hematoxylin.
Results
Confirmation of Targeting of the GIT1 and GIT2 Genes
We created mouse lines from commercially available ES cell lines carrying genetrap vectors inserted in either the GIT1 or the GIT2 gene. Insertion of the genetrap vector causes the expression of a fusion protein of the exons upstream of the inserted gene trap with the β-Gal reporter from the genetrap (Figure 1A). According to the ES cell creators, the genetraps inserted in intron 1 of the GIT1 gene and intron 2 of the GIT2 gene. To confirm the presence of the correct transcripts, we first amplified the GIT1 or GIT2 genetrap fusion mRNA from the corresponding ES cells by RT-PCR and sequenced the PCR products. In the GIT1 ES cells, the single transcript containing exon 1 spliced to the β-Gal reporter could be detected. In the mRNA isolated from GIT2 ES cells, however, we found two transcripts. One contained the expected exon 1–exon 2–β-Gal fusion, whereas the alternative mRNA lacked exon 2 (data not shown), consistent with previously reported extensive alternative splicing of the GIT2 transcript (Premont et al. 2000). Exact genetrap vector insertion sites in genomic DNA were determined by genomic PCR and sequencing. Confirmed ES cells were then used to create genetically modified animals to study the tissue distribution of the two GIT gene transcripts. Animals were genotyped using genomic PCR (Figure 1B).
β-Gal Staining Is Specific for Reporter Gene Expression
To verify absence of endogenous β-Gal activity in WT tissues, we stained several tissues from both GIT2 WT and HET animals with X-Gal for comparison. For example, in WT testes, brain, and thymus we did not find any β-Gal activity (Figures 2A, 2C, and 2E) but detected moderate to strong β-Gal activity in the GIT2 HET animals (Figures 2B, 2D, and 2F). In addition, we did not detect any β-Gal activity in either WT kidney or spleen (data not shown). The only WT tissue showing substantial endogenous β-Gal activity in the absence of a genetrap vector is the epididymis (data not shown); therefore, we were unable to examine GIT gene expression there. The specific β-Gal staining we observed was entirely nuclear, suggesting that the GIT1-lacZ and GIT2-lacZ fusion proteins localized to the cell nucleus.
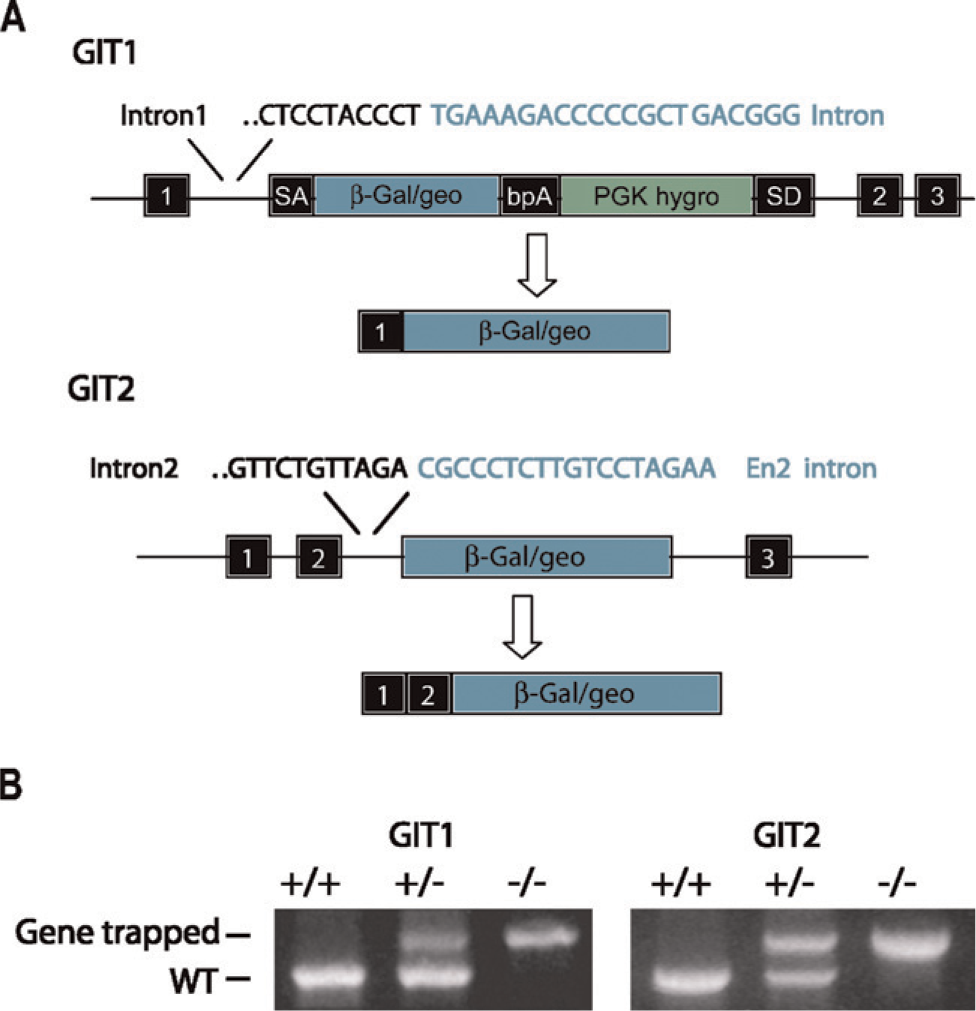
Generation of the GIT1 and GIT2 β-galactosidase (β-Gal) reporter mice. Mouse embryonic stem cells were obtained from the Fred Hutchinson Cancer Research Center and the BayGenomics Consortium with gene trap vectors inserted in intron 1 and intron 2 of the GIT1 and GIT2 genes, respectively (
Widespread Expression of Both GIT1 and GIT2 in the Brain
To reveal expression of GIT1 and GIT2 in the brain, we compared sagittal sections of brains from GIT1-lacZ and GIT2-lacZ HET animals for gene reporter activity (Figures 3A and 3B). Both GIT genes are expressed in the major areas of the brain including the cortex, hippocampus, striatum, cerebellum, and the olfactory bulb. In the cortex, both GIT genes are expressed in all seven cortical layers. Similarly, both GIT1 and GIT2 are expressed in the striatum, with no obvious difference in cell type specificity. Correspondingly, both GIT genes are coexpressed in the various regions of the hippocampus, namely, the dentate gyrus and the CA1 and CA3 regions. In the olfactory bulb, both GIT1 and GIT2 are expressed with no obvious differences (data not shown). The only brain region where the two GIT genes are clearly differentially expressed is the cerebellum. Whereas both GIT1 and GIT2 are expressed in the Purkinje cell layer, only GIT2 is expressed in the granule cells (Figures 3C and 3D). Overall, these results revealed coexpression of GIT1 and GIT2 in all the major areas of the central nervous system with the exception of cerebellar granule cells, which have no detectable expression of GIT1.
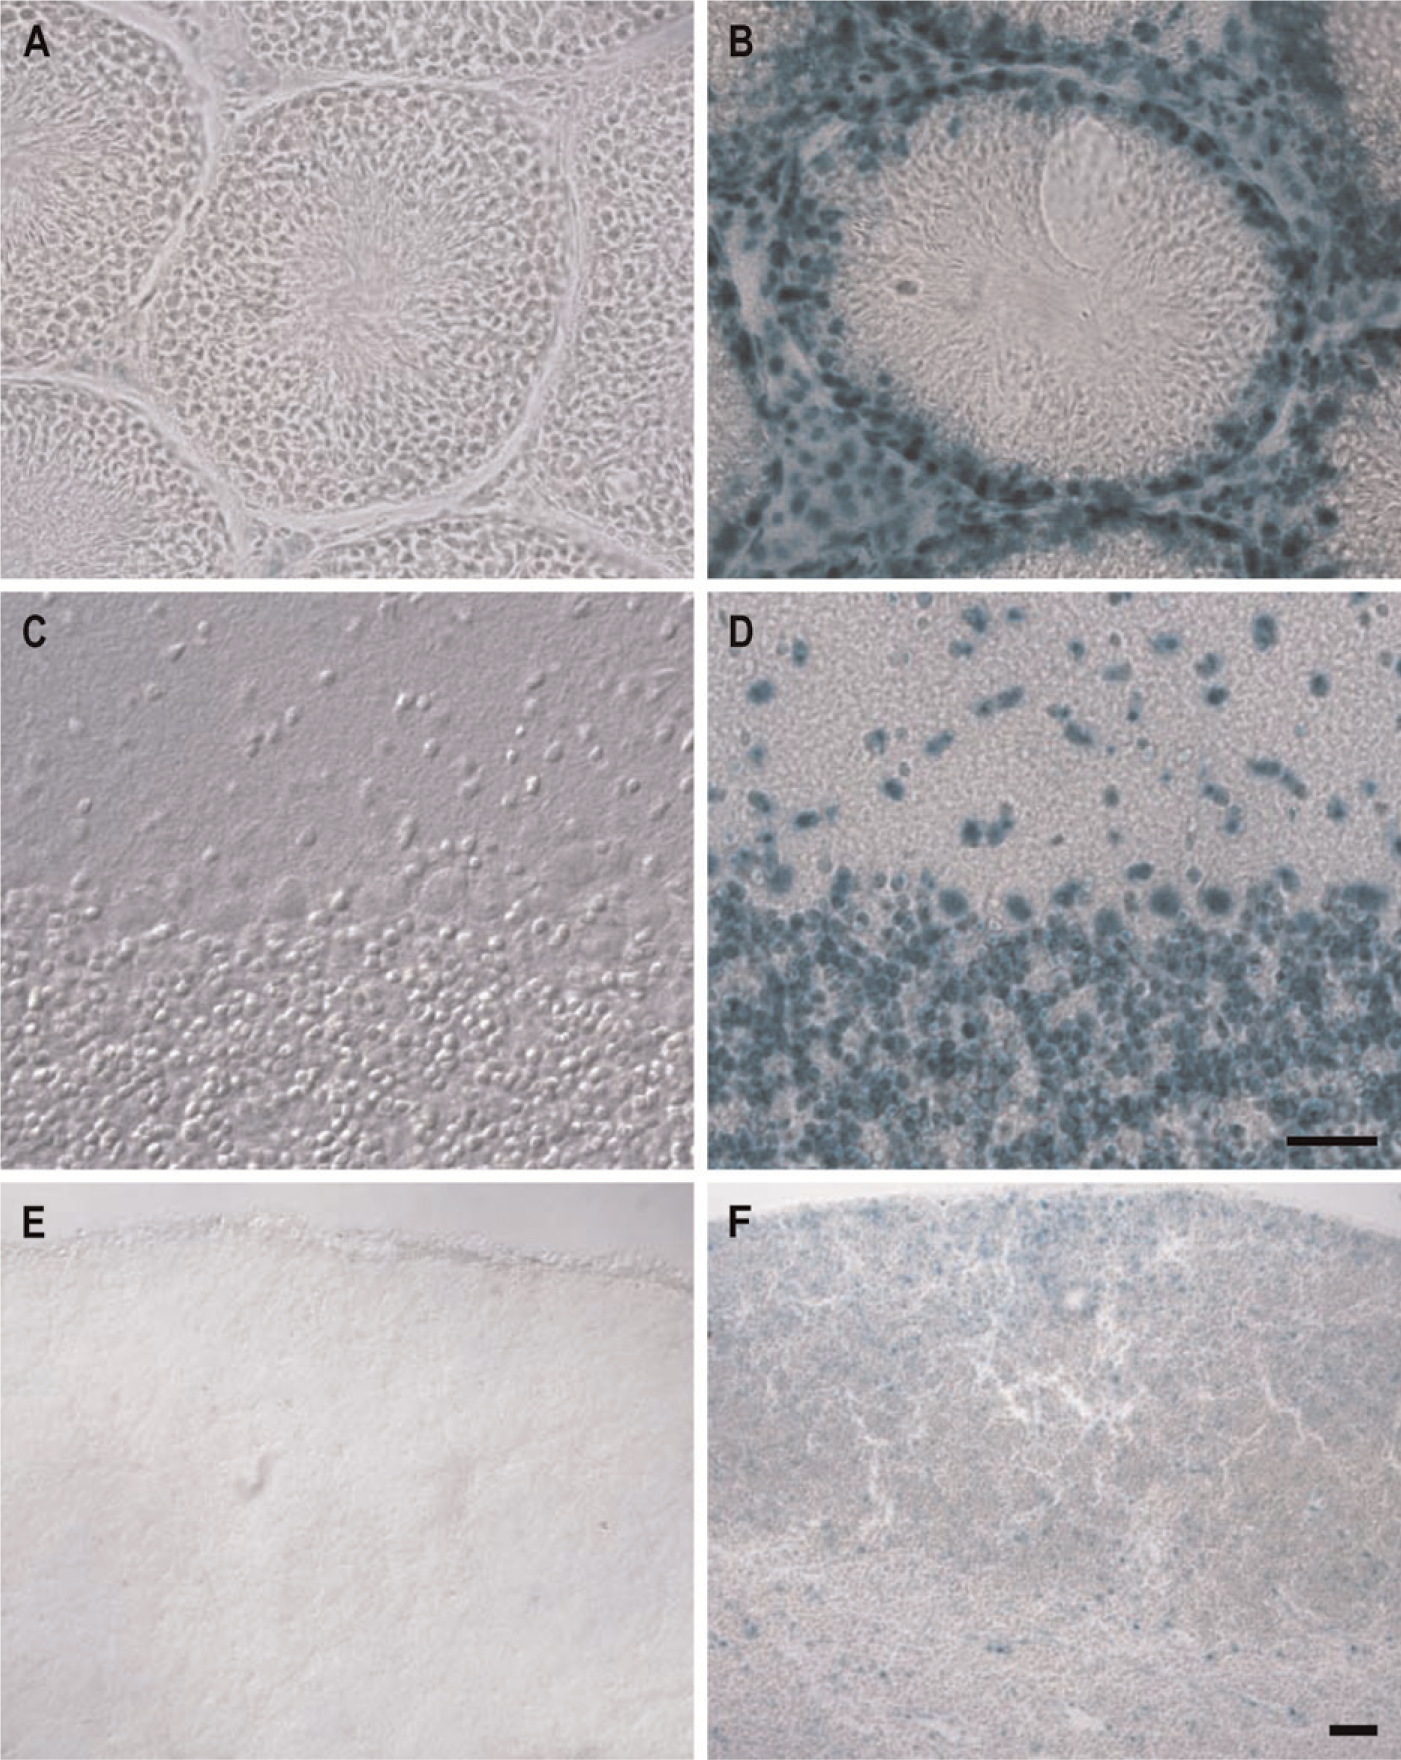
Specificity of X-Gal staining for exogenous β-Gal marker expression. Tissue slices of testis (
Broad Expression of GIT2 but Restricted Expression of GIT1 in Lung and Liver
In the liver and lung, GIT1 and GIT2 expression profiles were very distinct (Figure 4). In these organs, GIT1 expression is limited to cells of the vasculature and airways/bile ducts (Figures 4A and 4C), whereas GIT2 is expressed ubiquitously (Figures 4B and 4D). The lung consists mainly of the parenchyma containing the alveoli, with interspersed blood vessels and bronchi. The parenchyma consists primarily of pneumocytes, which were devoid of GIT1 expression but expressed GIT2 at significant levels (Figures 4A and 4B). In contrast, both GIT genes are expressed in the endothelial and smooth muscle cells of the vasculature and the bronchi (Figures 4A and 4B). The liver has a similar tissue architecture, consisting of a parenchyma interspersed by vasculature and bile ducts. The major parenchymal cell type in the liver is the hepatocyte. The expression pattern of GIT1 and GIT2 in the liver resembles the pattern in the lung, where only GIT2 expression was observed in the hepatocytes (Figures 4C and 4D), but both GIT1 and GIT2 were found in the cells forming the vasculature and bile ducts.
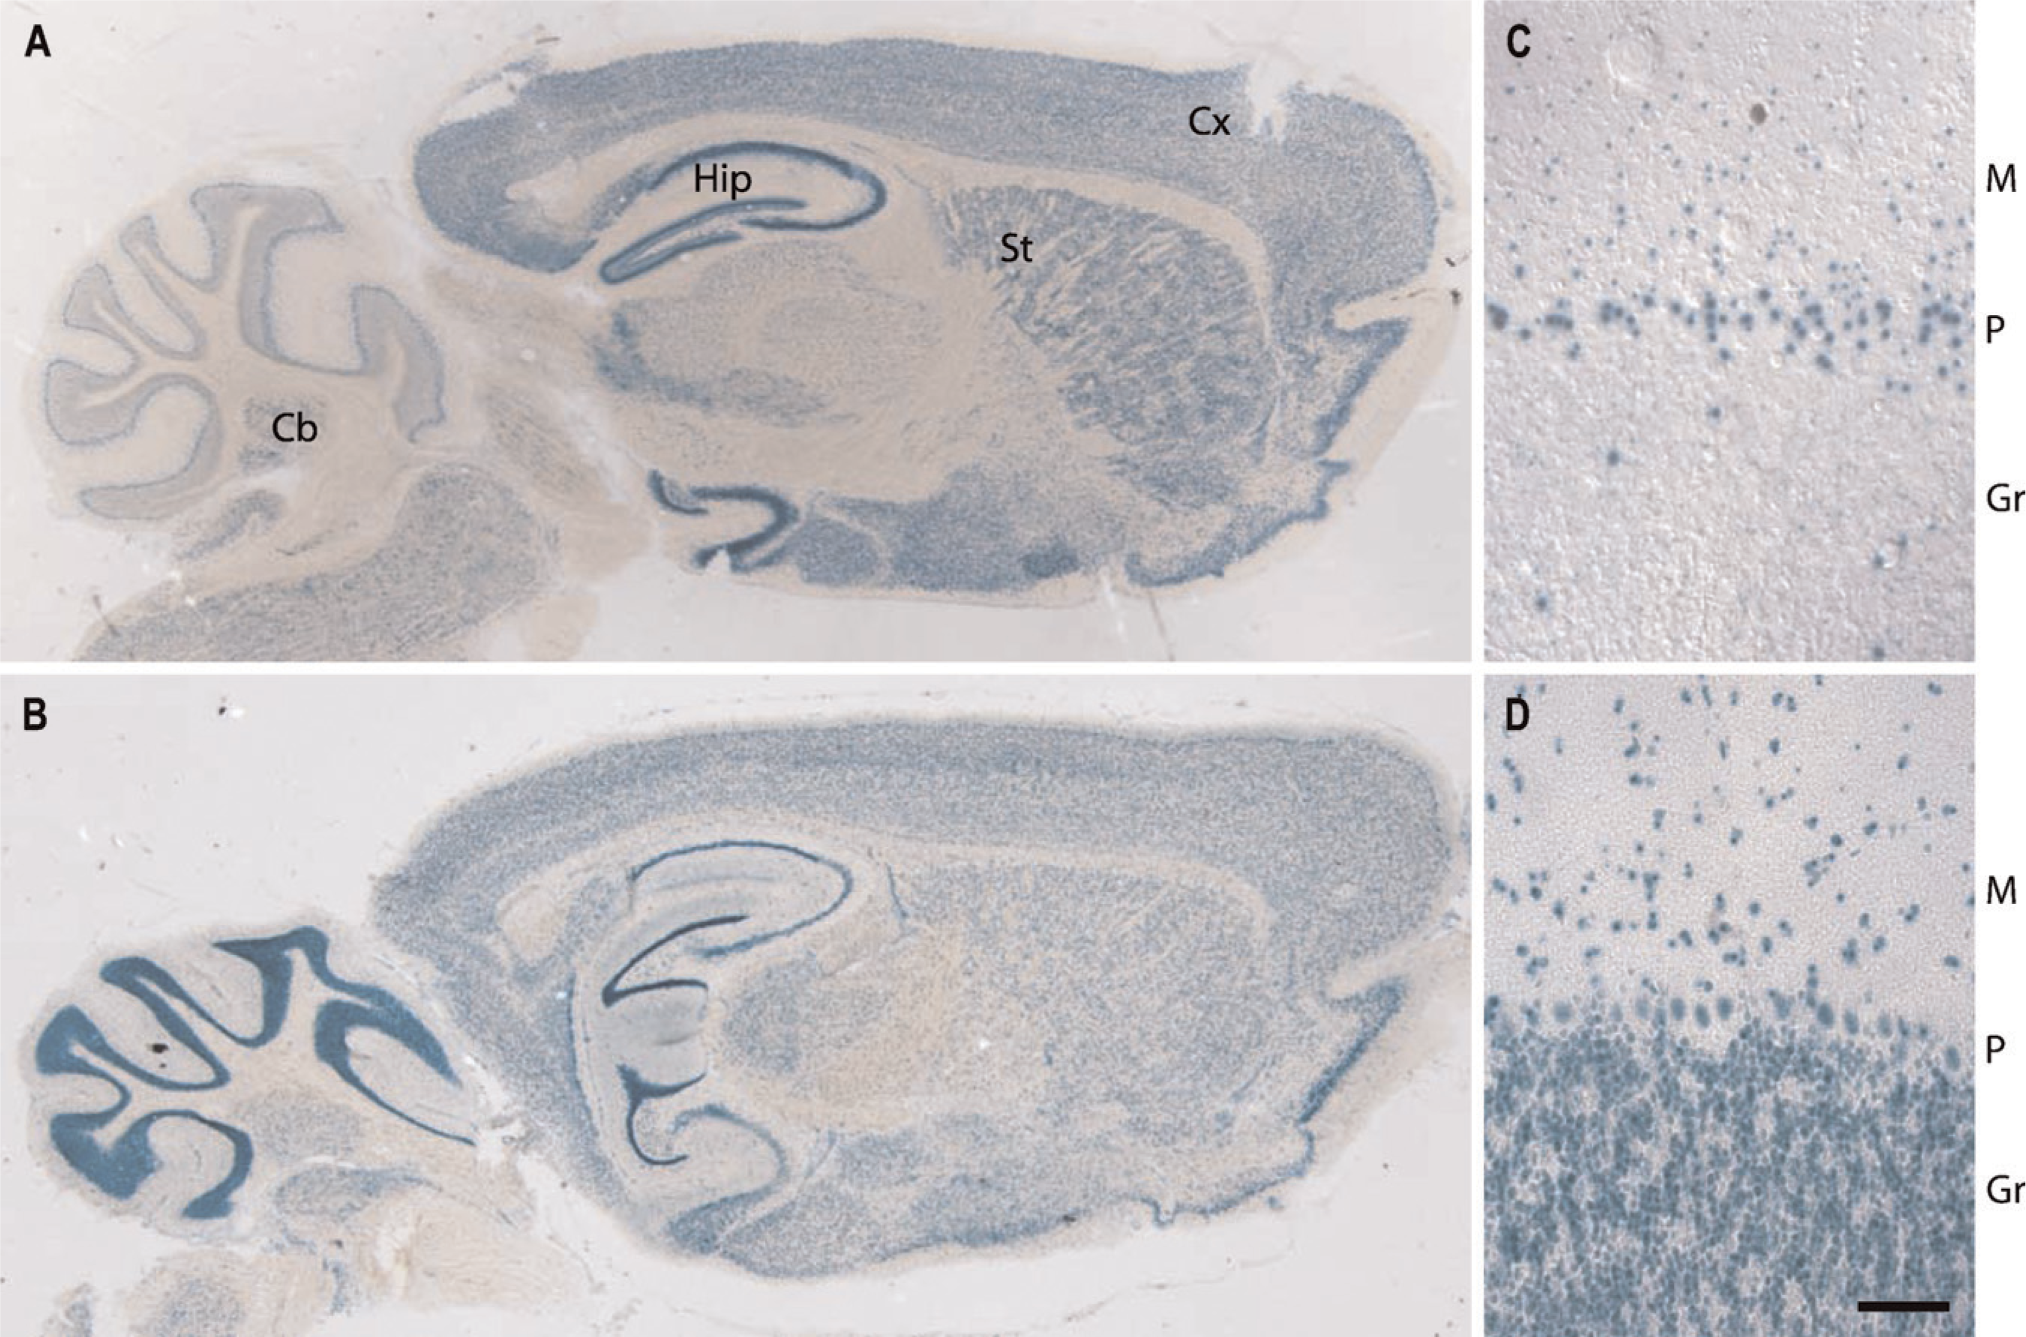
GIT gene expression in the brain. Sagittal sections of brains show similar GIT1 (
Myocytes Express GIT2 but Are Devoid of GIT1
We next examined cardiac muscle, skeletal muscle, and smooth muscle for β-Gal activity (Figure 5). Staining for GIT1 and GIT2 appears consistently distinct in all three muscle types. Visualizing GIT2 expression revealed the large nuclei of myocytes (Figures 5B, 5D, and 5F), in accordance with corresponding hematoxylin and eosin (H&E)-stained muscle sections (not shown). Additionally, GIT2 was also present less frequently in smaller nuclei, suggesting expression in non-myocyte interstitial cells. In contrast, muscle tissues from GIT1 animals do not show staining reminiscent of large myocyte nuclei (Figures 5A, 5C, and 5E). Instead, GIT1 staining in skeletal, smooth, and cardiac muscle is present only in small, non-myocyte nuclei; however, this GIT1 staining in skeletal muscle is particularly sparse. Whether these interstitial cells represent immature myocytes, fibroblasts, capillary endothelial cells, or other cell types remains unclear at present. Nonetheless, although GIT2 is present in mature myoctes and in some muscle interstitial cells, GIT1 is present only in interstitial cells.
Differentiation-dependent GIT Expression in Testis and Coexpression in Ovaries
We first sectioned testis and found GIT1 and GIT2 expressed in a striking, mutually exclusive manner (Figure 6). Testis consists of a system of seminiferous tubules in which spermatogenesis takes place. The precursor spermatogonia cells line the periphery of the tubules and move toward the center during their differentiation to become mature spermatids, which then progress down the lumen of the tubule. GIT2 is expressed in the intertubular space where Leydig cells, macrophages, and blood vessels reside (Figure 6B). Furthermore, GIT2 is expressed at the periphery of the seminiferous tubules where the spermatogonia reside but not in cells in the center of the tubules, suggesting a deactivation of the GIT2 gene during early spermatid differentiation. In stark contrast, GIT1 is absent from the intertubular space and the periphery of the tubules but is strongly expressed in the center of the tubules (Figure 6A). This staining indicates an activation of the GIT1 gene during the final steps of spermatid differentiation. In addition, GIT1 is also expressed in dispersed cells within the tubules. These nuclei could mark the Sertoli cells, which guide the differentiating spermatocytes from the periphery to the center of the seminiferous tubules (Figure 6A). This switch of gene expression during sperm cell differentiation represents the most striking example of differential regulation of the GIT1 and GIT2 genes observed in the mouse.
Expression of GIT1 and GIT2 in the lung (
We then proceeded to look for GIT gene expression in the ovary, with specific focus on the oocytes and the surrounding follicles (Figures 6C and 6D). In maturing follicles, both GIT1 and GIT2 are expressed in the oocytes and the cells lining the periphery of the follicles. In addition, both GIT1 and GIT2 are widely expressed beyond the follicles (data not shown).
Prevalent Expression of GIT2 but Specific Expression of GIT1 in Thymus and Spleen
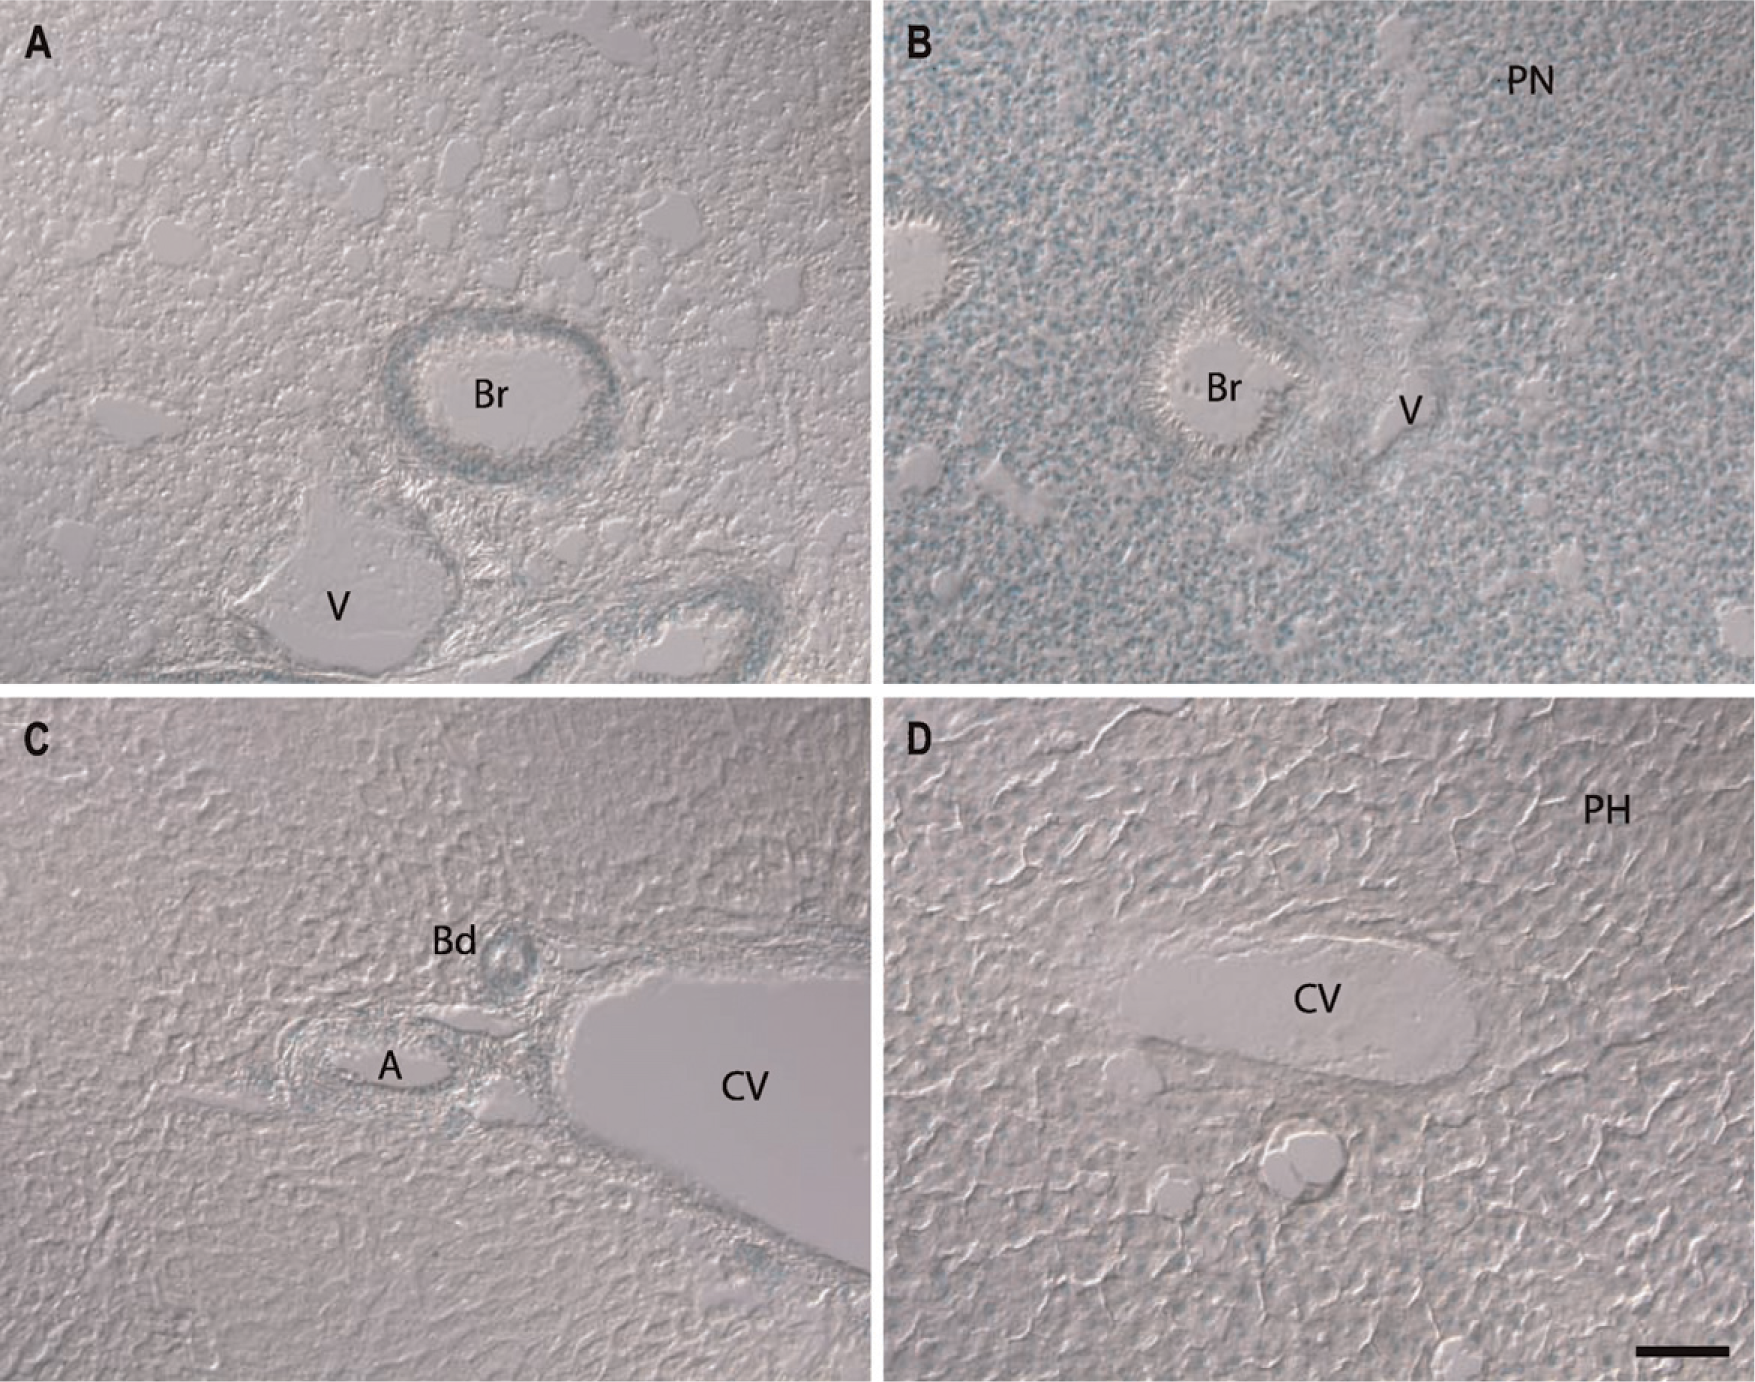
Finally, we were interested in revealing the expression pattern of the GIT genes in the spleen and thymus, where many cells of the immune system interact and mature (Figure 7). The spleen is the major site where blood-borne pathogens encounter a variety of immune cells including dendritic cells, macrophages, and T- and B-lymphocytes. Architecturally, the spleen consists of the red pulp surrounding the lobular white pulp. The boundary between red and white pulp is lined with macrophages and dendritic cells that present the antigens of encountered pathogens. Lining the boundary is a layer of marginal zone B-cells awaiting signals to migrate to the white pulp, which itself is populated with T-cells in a central area and B-cells in more peripheral follicles. In the spleen, GIT1 is expressed in a small subset of cells that are evenly dispersed throughout the organ (Figure 7A). The nature of this cell type is not clear. On the other hand, GIT2 is expressed throughout the spleen, but is especially prominent along the boundary between the red and white pulp where macrophages, dendritic cells, and marginal zone B-cells reside (Figure 7B). In addition, GIT2 expression is widespread in the white pulp, where both T- and B-cells are present.
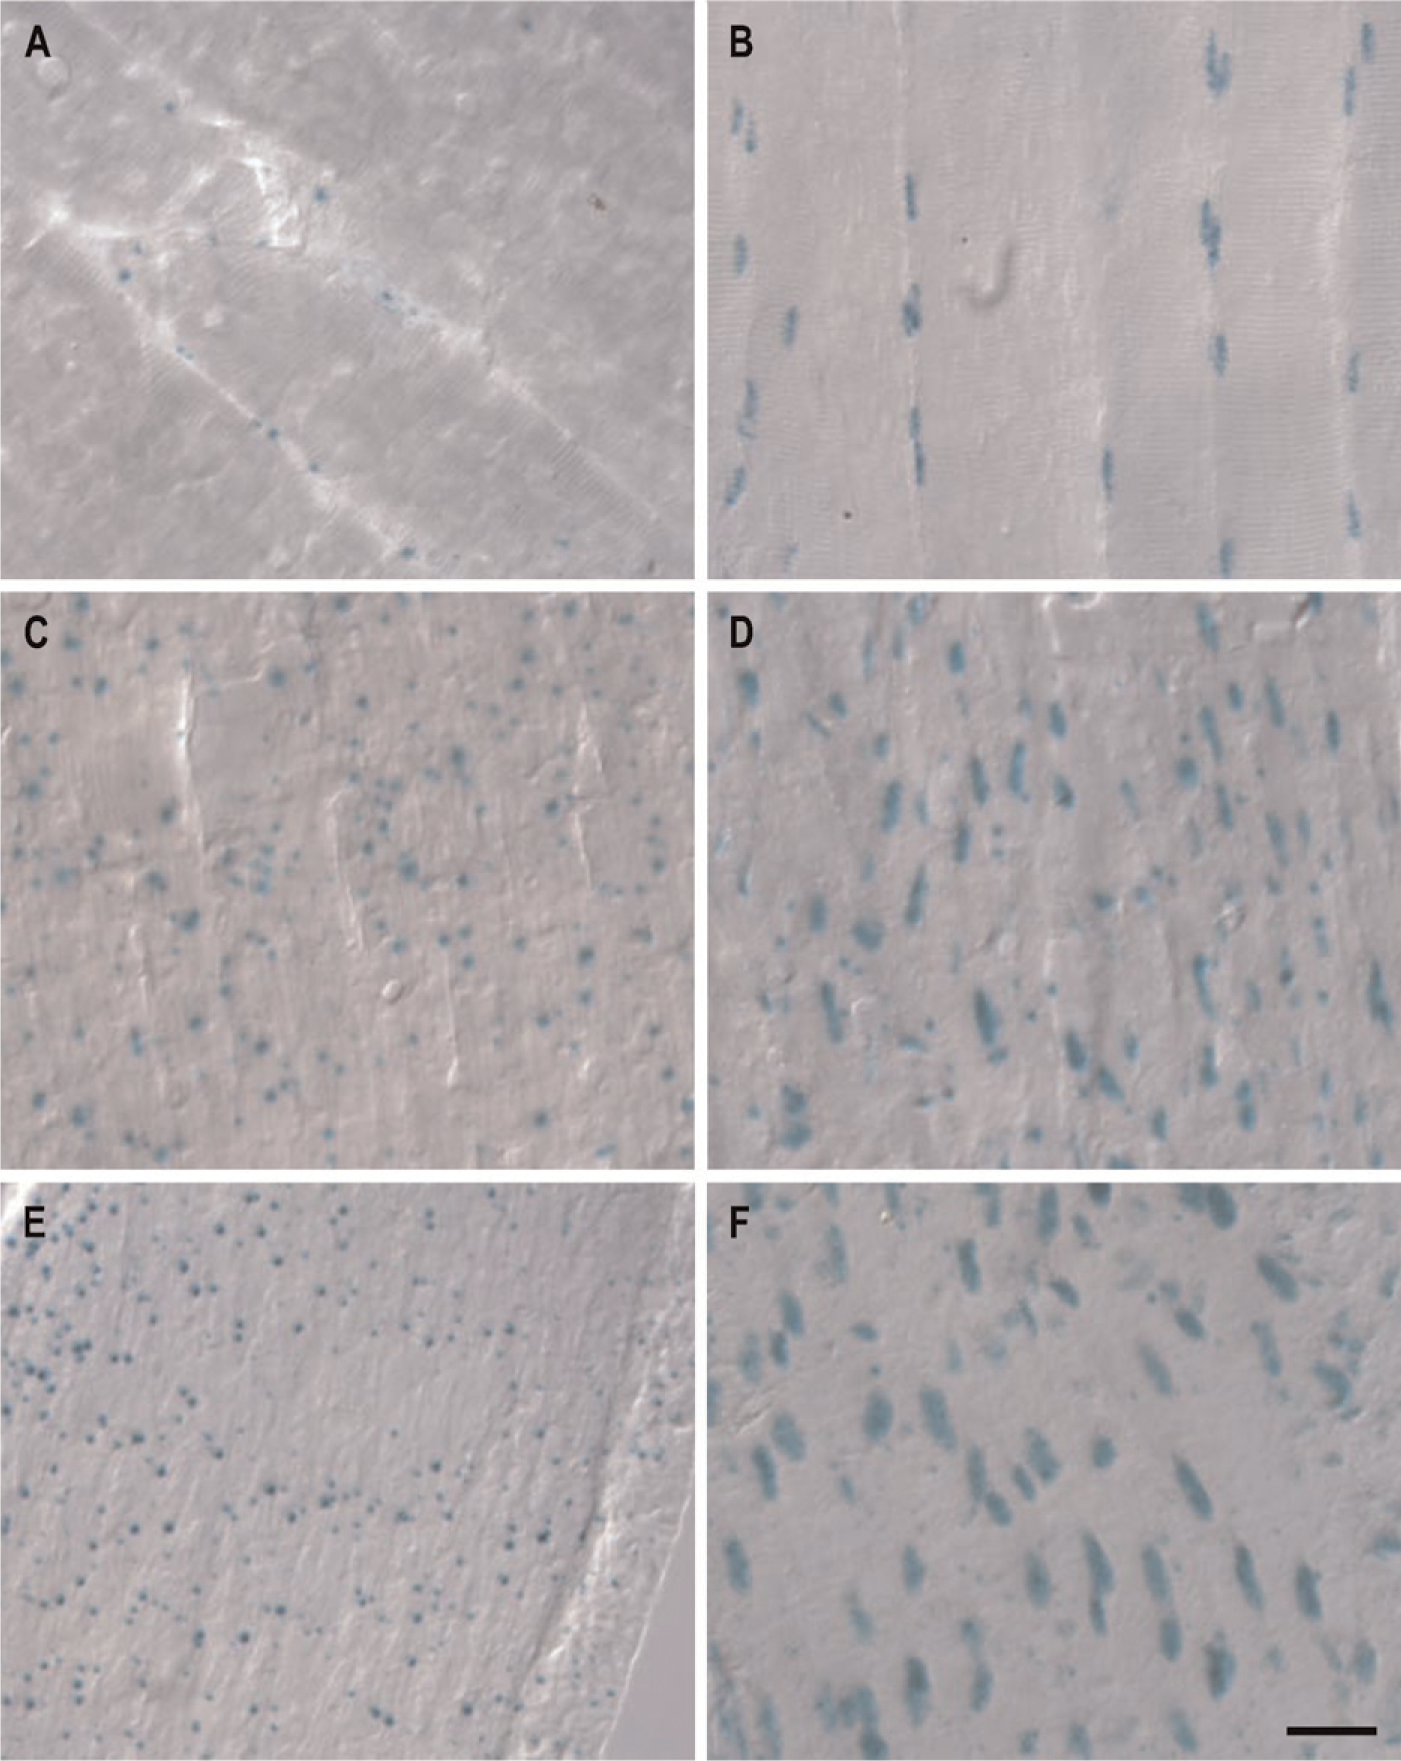
GIT1 and GIT2 expression in skeletal muscle (
The thymus provides an environment for immature T-cells to proliferate and mature as well as a location for positive and negative selection of T-cells with an appropriate repertoire of antigen receptors. In the peripheral cortex where T-cells proliferate, only sparse and weak GIT1 expression was detected (Figure 7C). In contrast, GIT2 expression is more prominent along the outer periphery of the cortex where less mature thymocytes reside (Figure 7D). In the central medulla, GIT1 appears to be expressed in a very specific cell subtype, whose identity is currently unknown. GIT2 expression in the medulla, however, seems more broad but not ubiquitous. In both spleen and thymus, GIT2 is much more prominently expressed than GIT1, but GIT1 is expressed in some subpopulations of cells in both organs. Further delineation of these populations will require more detailed examination.
GIT1 Protein Staining Confirms GIT1 Gene Expression Pattern
To assess the correlation between GIT1 gene expression and protein expression in cerebellum and testis, tissues from WT mice were stained with a GIT1-specific antibody (Figure 8). In the cerebellum, immunohistochemical staining revealed strong GIT1 protein immunoreactivity only in the Purkinje cells (Figure 8A), as expected from the X-Gal staining pattern (Figure 3C). In testis, GIT1 protein expression was observed in mature spermatocytes within the tubule lumen (Figure 8B), which is also in agreement with GIT1 gene expression revealed by X-Gal staining (Figure 6A). These results confirm the correlation between GIT1 genetrap marker expression and protein expression.
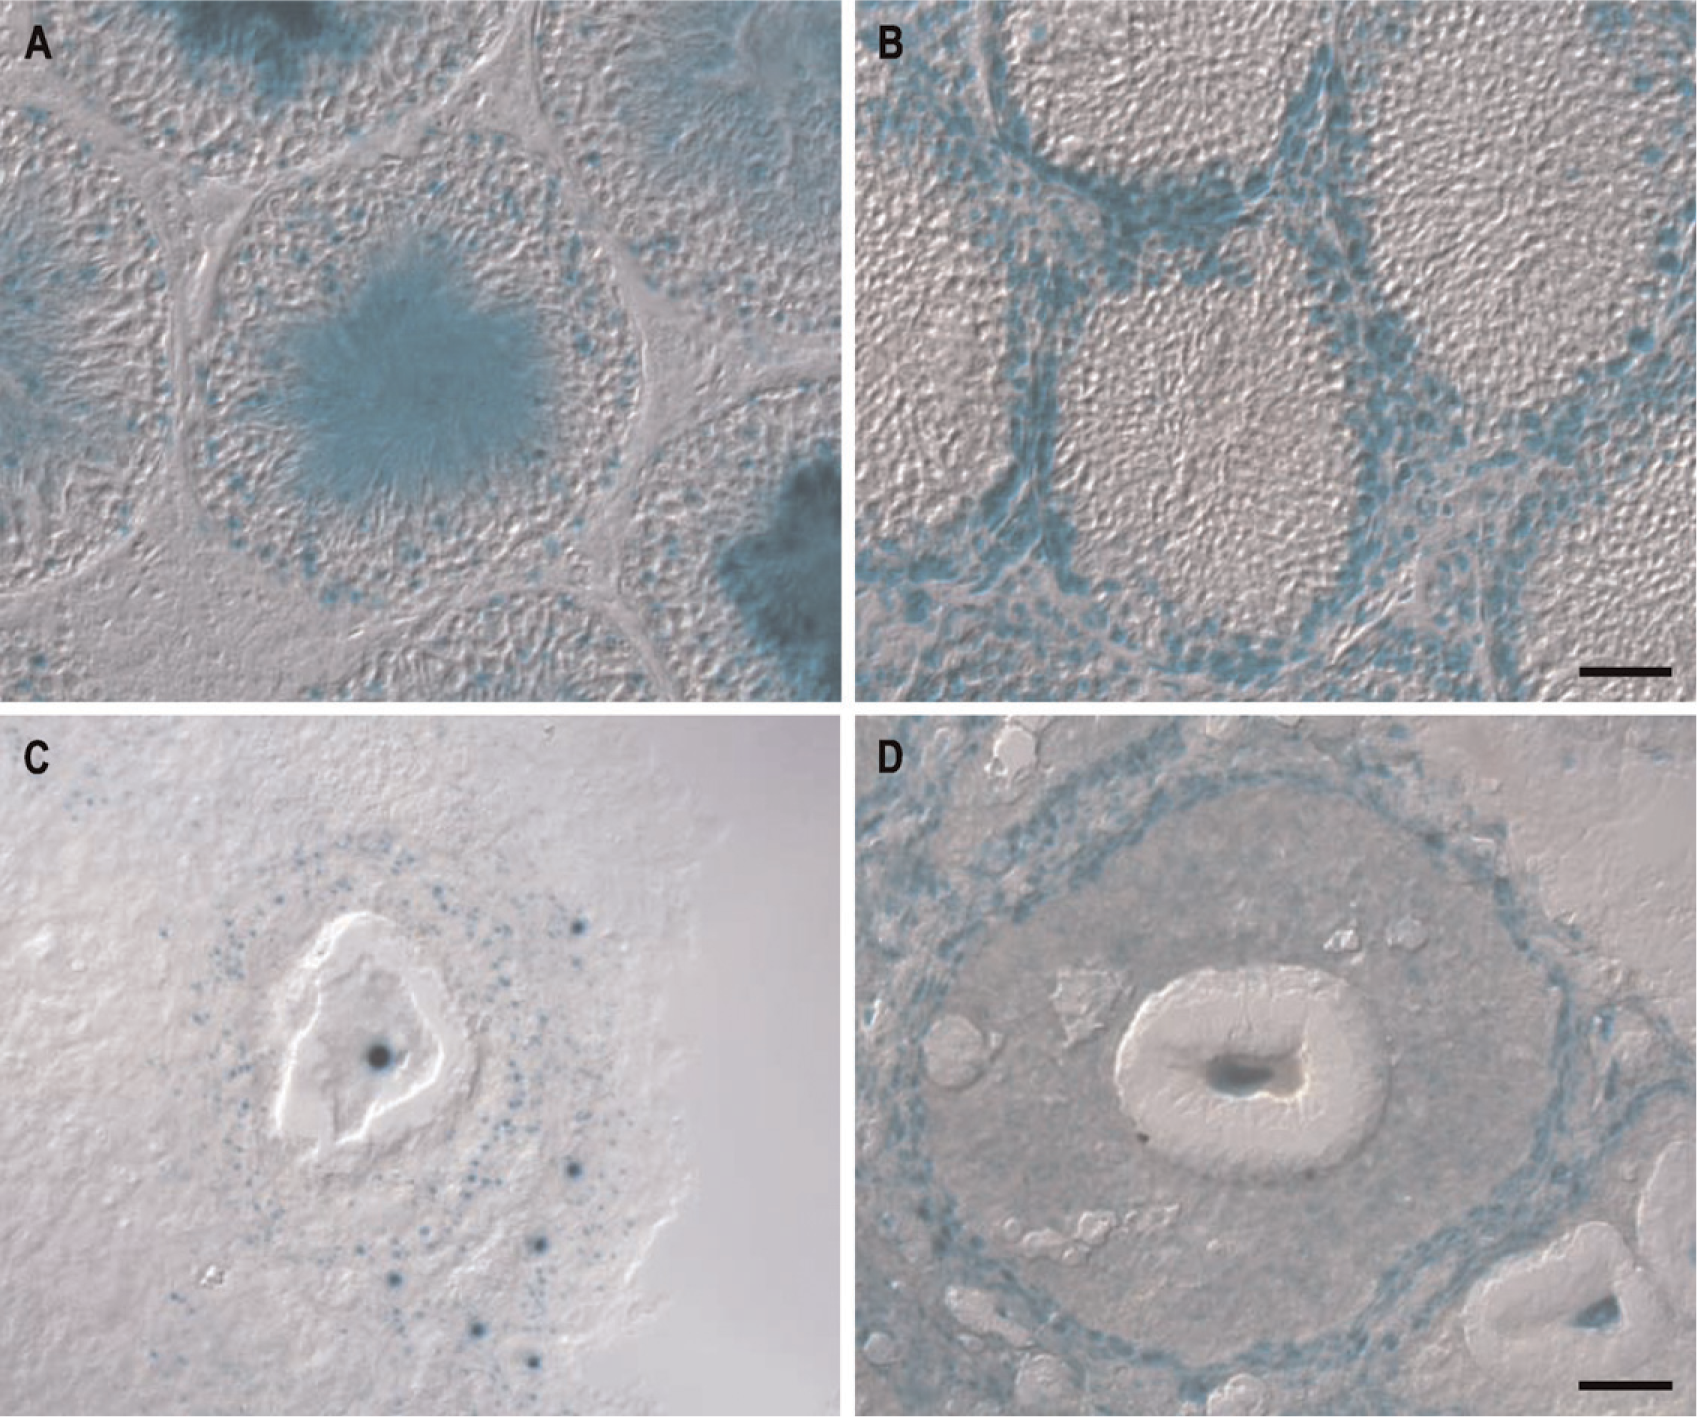
GIT expression in testis (
Discussion
Earlier studies using Northern blotting revealed apparently ubiquitous expression patterns for both the GIT1 and GIT2 gene transcripts in rat and in human (Premont et al. 1998, 2000). However, such studies provide no details of the cellular distribution of these isoforms within any tissue or organ. Because GIT1 and GIT2 can form heterodimeric complexes when they are coexpressed (Premont et al. 2004), it is possible that they form mixed complexes with potentially mixed properties rather than separate homodimeric complexes with potentially distinct properties. Furthermore, the GIT2 transcript undergoes extensive, tissue-specific alternative splicing to generate distinct GIT2 protein variants (Premont et al. 2000). If these alternative GIT2 forms must heterodimerize with GIT1, this would seem to limit functional diversity. It is thus of great interest to know whether the GIT1 and GIT2 proteins are indeed coexpressed in cells in native tissues or are present in distinct cell types within an organ. To address this, we have utilized genetrap ES cells to generate mouse lines with GIT1 and GIT2 gene expression markers.
This study has confirmed the expected broad tissue distribution of both GIT1 and GIT2 transcripts for the mouse. However, clear differences are evident when the GIT1 marker is compared with the GIT2 marker. Overall, GIT2 seems to be nearly ubiquitously expressed, whereas GIT1 is expressed in a much more limited fashion, with many cell types appearing to entirely lack GIT1. We validated this differential expression by using a GIT1-specific antibody to stain two WT mouse tissues having differential GIT1 and GIT2 expression—cerebellum and testis—revealing identical cell type staining for GIT1 protein and the GIT1 genetrap marker. The only obvious location where GIT1 appears exclusively expressed is the center of seminiferous tubules in the testis where mature spermatids can be found (Figures 6A and 6B). In contrast, exclusive GIT2 expression was observed in the granule cells in the cerebellum (Figures 3C and 3D), the pneumocytes of the lung (Figures 4A and 4B), the hepatocytes in the liver (Figures 4C and 4D), and all muscle cells examined (Figure 5).
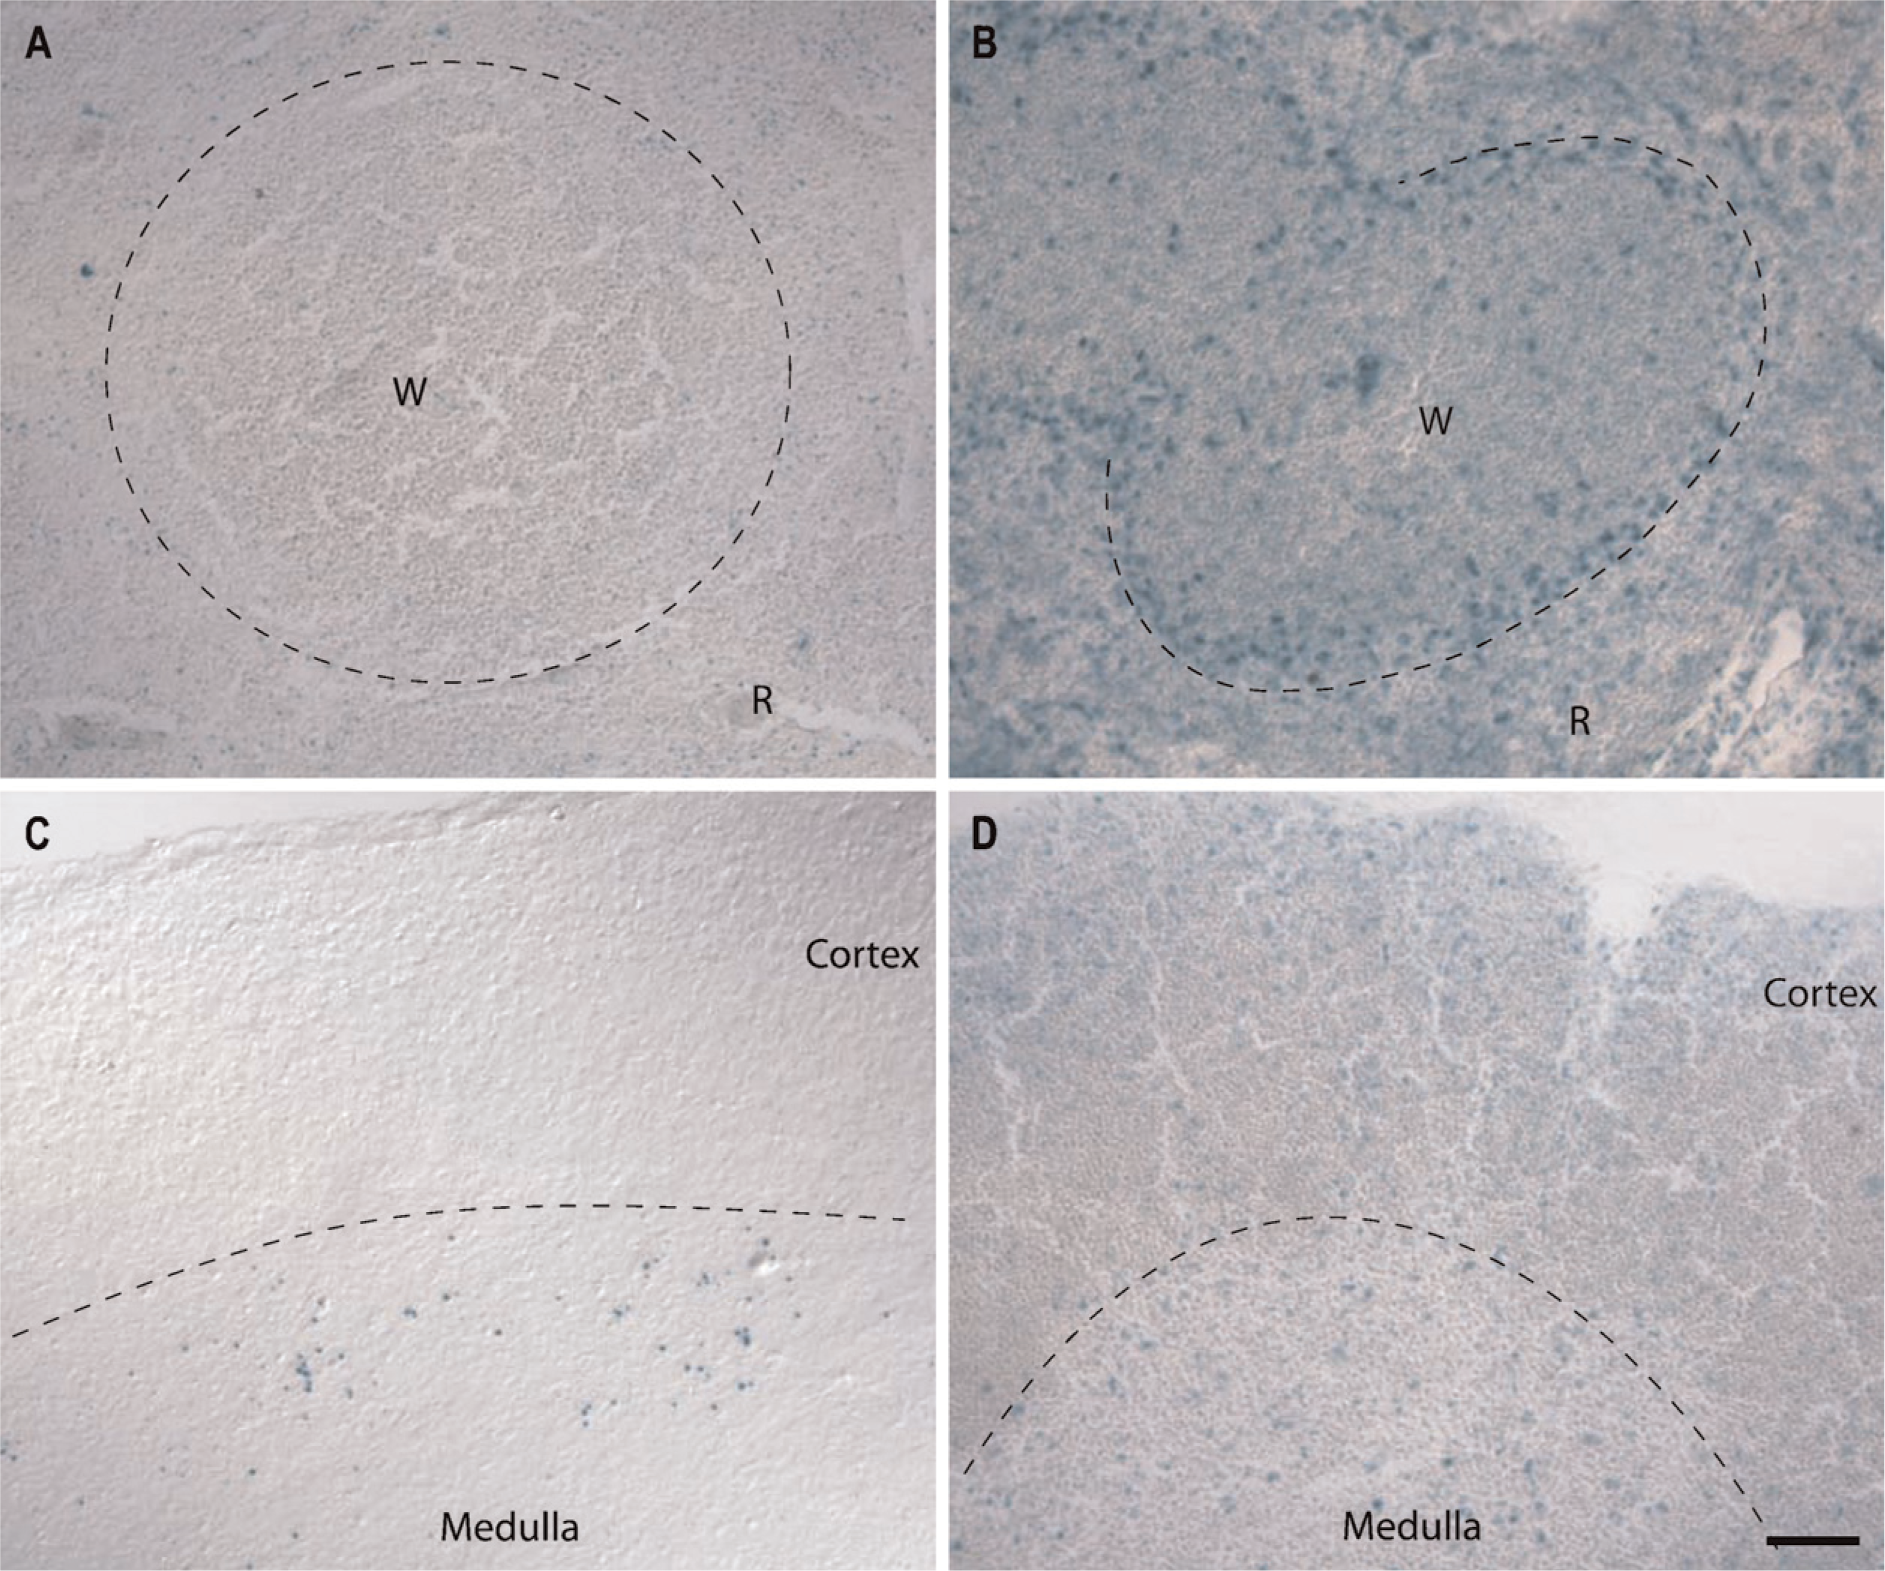
GIT expression in the spleen (
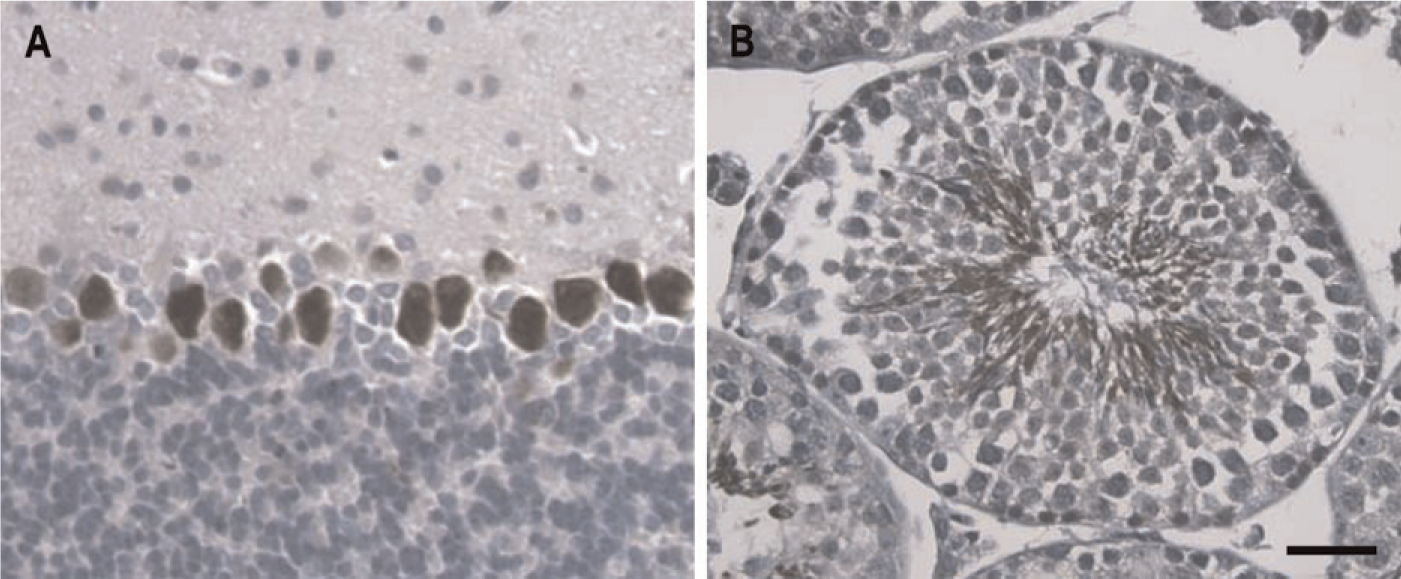
Immunohistochemical staining for GIT1 protein in WT cerebellum and testes. GIT1-specific antibody H-170 was used to stain for GIT1 proteins. In the cerebellum, GIT1 protein is detected only in the Purkinje cells (
In testes we observe a pattern of GIT1 and GIT2 expression that strongly suggests a developmental shift in expression between these isoforms. Immature spermatogonia lining the outer periphery of testis tubules strongly and exclusively express GIT2, whereas mature spermatids in the lumen of these tubules strongly and exclusively express GIT1. Therefore, during sperm development, expression of GIT2 ceases and expression of GIT1 commences. Despite the prominent expression of both GIT1 and GIT2 in testis, their deficiency does not affect male fertility in the homozygous state, suggesting that GIT gene expression is not absolutely required for normal sperm development and function (not shown).
The divergent expression patterns of the GIT1 and GIT2 genes suggest that these two isoforms may well play distinct roles in the body, rather than merely redundant roles. Although these two proteins are very similar overall and are able to heterodimerize (Premont et al. 2000, 2004), there is some functional evidence for distinct regulation of GIT1 and GIT2. Turner and colleagues recently reported that chicken GIT2/PKL requires tyrosine phosphorylation at three sites for binding to paxillin (Brown et al. 2005). In the absence of Src family kinases phosphorylating these sites, GIT2 is unable to localize to focal adhesions, whereas GIT1 shows no defect in localization (Brown et al. 2005). We recently showed that GIT1 bearing mutations preventing tyrosine phosphorylation of these conserved sites is still able to bind paxillin (Schmalzigaug et al. 2007). In endothelial cells, Garcia and colleagues reported distinct patterns of GIT1 and GIT2 phosphorylation and recruitment to adhesions in response to cell activation (Shikata et al. 2003b).
The present work provides the first look at the global patterns of GIT1 and GIT2 gene expression in mouse tissues. With this information in hand, it is now possible to focus on specific physiological processes that will be regulated by one or the other GIT protein only, or potentially by both proteins. Thus, the recent report that GIT2 is important in neutrophil function (Mazaki et al. 2006) will also likely be true for other immune cell types such as lymphocytes, which appear to have minimal GIT1 expression. More detailed studies using these genetrap mouse lines will allow precise characterization of the expression of GIT1 and GIT2 in specific cell types in tissues under normal and pathophysiological conditions. Furthermore, because the genetrap replaces expression of the normal GIT gene transcripts with the marker fusion, these mouse lines will be useful to explore the consequences of gene knockout on physiological functions.
Footnotes
Acknowledgements
H.P. is supported by a Leukemia and Lymphoma Society Special Fellowship. R.T.P. is supported by National Institutes of Health Grants GM-59989 and DA-016347.
We thank Cheryl Bock and the Duke Comprehensive Cancer Center Transgenic Facility for creating the GIT2 genetrapped mice and the UCSF Comprehensive Cancer Center Transgenic/Targeted Mutagenesis Core Facility for creating the GIT1 gene-trapped mice.