
Abstract
We evaluated novel fluorescent proteins (FPs) as reporters for gene transfer in animals and cells with the aim to develop more-sensitive assays for vector development and the optimization of gene transfer strategies in gene therapy. Adeno-associated virus serotype 5 vectors carrying an expression cassette with a chicken β-actin promoter encoding the green FPs ZsGreen1, AcGFP1, hMGFP (with and without intron), and EGFP and the red FPs DsRed2 and TurboRFP were administered to mice at identical doses for each organ to target liver, lung, and muscle. Despite the fact that all FPs were expressed from an identical vector backbone, the observed number of fluorescent cells and fluorescence intensities varied between, but was consistent within, each combination of a specific protein and organ. The highest number of fluorescent cells was observed in liver with EGFP and in lung with ZsGreen1 and EGFP. In muscle, AcGFP1 and ZsGreen1 produced the most-intense fluorescence in fibers. In contrast, in culture cells, ZsGreen1 showed substantially stronger fluorescence than all other proteins. Our data demonstrate that each FP has tissue-specific expression profiles that need to be taken into consideration when comparing the performance of vectors in different organs.
G
GFP is an important tool as a reporter gene for gene therapy studies that allows for the testing of expression patterns of viral vectors in animal models. To enable the detection of low levels of expression, it is important to have reporter genes available with the highest sensitivity possible. We therefore tested several novel FPs for their sensitivity as reporter genes in mouse tissues, i.e., AcGFP1, ZsGreen1, hMGFP (“Monster Green”), DsRed2, and TurboRFP (summarized in Table 1). We transduced organs in mice that are most relevant for gene therapy (liver, lung, and muscle) to analyze the fluorescence pattern of these proteins. To this end, adeno-associated virus serotype 5 (AAV2/5) was used as vector for gene transfer containing a chicken β-actin (CB) promoter for transgene expression. We have previously shown that AAV2/5 yields good expression levels in all three tissue types (Hildinger et al. 2001; Auricchio et al. 2002; Louboutin et al. 2005), thus allowing comparison of the performance of different FPs within each organ. In addition, all the FPs were evaluated in culture cells by plasmid transfection and transduction with AAV2/5.
One of the FPs, hMGFP, originally contained a chimeric intron within the 5′ untranslated region of the gene, whereas all other constructs were intron-free. Introns are known to enhance gene expression (Buchman and Berg 1988; Palmiter et al. 1991; Nott et al. 2003). However, to minimize variations in expression levels when comparing hMGFP with the other FPs, we constructed a version of hMGFP without intron. Both the intron-free and intron-containing constructs of hMGFP were tested in this study.
Comparison of properties of FPs used in this study
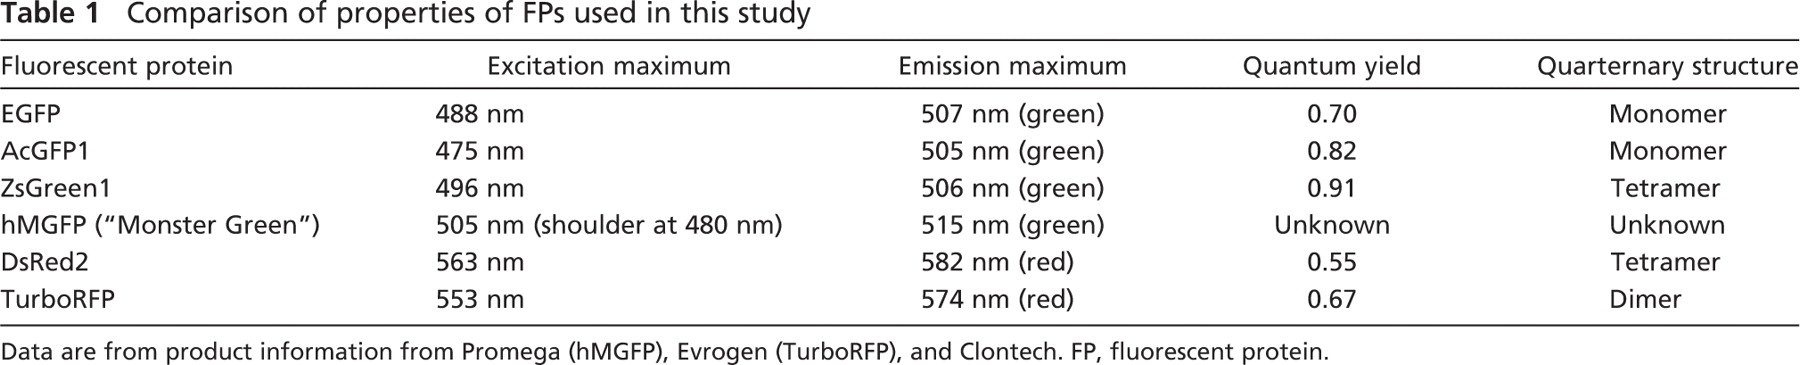
Data are from product information from Promega (hMGFP), Evrogen (TurboRFP), and Clontech. FP, fluorescent protein.
Materials and Methods
Vectors
For all experiments, the transgene was expressed from AAV2/5 driven by a CB promoter and carrying the bovine growth hormone poly-adenylation signal. Plasmids containing the genes of FPs were obtained from Clontech Laboratories (Mountain View, CA) (pZsGreen1-N1, pAcGFP1-N1, pDsRed2-N1), Promega (Madison, WI) (phMGFP), and Evrogen (Moscow, Russia) (pTurboRFP-N; obtained through Wako Chemicals, Richmond, VA). The genes were excised from the plasmids and cloned into the cis-plasmid for vector production. In the case of phMGFP, the gene was isolated either by restriction digest with PstI + XbaI, which retained the 5′-located intron with the gene, or with EcoRV + XbaI, which generated an intronless version of the gene. AAV vectors were produced by transencapsidation in human embryonic kidney (HEK) 293 cells using a triple transfection method and purified by CsCl gradient sedimentation as described (Gao et al. 2002).
Vector Administration to Animals
Six- to eight-week-old male C57/BL6 mice received each vector for either liver-, lung-, or muscle-targeted transgene expression. The study was performed twice with each n = 3 per group for each organ. For expression in liver, 1.5 × 10¹¹ genome copies in 100-μl PBS were injected into the tail vein; for lung, 1 × 10¹¹ genome copies in 50-μl PBS were administered into the nose; and for muscle, 4 × 10¹⁰ genome copies in 25-μl PBS were injected into the quadriceps. Organs were harvested 21 days later and processed as described.
Processing of Tissues for Detection of FPs
Organs or parts thereof (liver, lung, muscle) were processed by overnight fixation in 10% formalin at room temperature followed by washing in PBS (2 × 1 hr each at 4C), freezing in OCT compound, cryosectioning, and coverslipping (standard protocol). Alternatively, we tested freezing the tissues in OCT compound without prior fixation, then cryosectioning, fixation of sections in 4% paraformaldehyde in PBS (15 min), washing in PBS (3 × 5 min), and coverslipping. Coverslipping was performed with Vectashield (Vector Laboratories; Burlingame, CA) containing 4′,6-diamidino-2-phenylindole (DAPI) as nuclear counterstain. Lungs were inflated with a mixture of PBS and OCT prior to fixation or freezing to prevent them from collapsing.
Expression of FPs in Cells
HEK 293 cells were transiently transfected with plasmids (500ng DNA per well of 6-well plates at 75% confluency) carrying the expression cassette for FPs according to a standard calcium phosphate protocol. The plasmids were identical to the cis-plasmids used in the triple-transfection protocol to generate the vector. For transduction with AAV vectors, CHO cells were incubated with 5 × 10⁴ vector genome copies per cell. The vectors used for transduction of cells were identical to the vectors administered to animals. Images of live or fixed cells were taken 24 hr after transfection and 72 hr after transduction with the vectors.
For flow cytometry, cells were harvested 48 hr after transfection and 72 hr after transduction by mild trypsinization and subsequently washed in PBS + 2% FBS. Viable cells were selected by forward- and side-scatter profiles to quantify fluorescence intensity. Exactly 5000 events of viable cells were collected for analysis of transduced CHO cells. Flow cytometry was performed on an FC500 flow cytometry system (Beckman-Coulter; Miami, FL). Green fluorescence was detected through a 525-nm bandpass filter after excitation with a 488-nm Ag laser.
Microscopy and Image Analysis
Tissue sections and cells expressing FPs were viewed with the Chroma GFP filter set 41017 for proteins with a green emission spectrum, and Chroma filter set 42005 for proteins with red fluorescence (Chroma; Rockingham, VT). Images were recorded with a digital camera at identical settings for each set of samples. For morphometric analyses, we evaluated 15 images taken with a 10× objective for each organ and FP. Lung sections were analyzed for the number of fluorescence-positive cells, which were counted with the Image-Pro Plus counting module (Media Cybernetics; Bethesda, MD). For liver, it was not possible to count individual fluorescent hepatocytes due to the clustering of neighboring cells. We therefore determined the relative liver area occupied by fluorescent cells using ImageJ software (Rasband 1997-2006; National Institutes of Health, Bethesda, MD, http://rsb.info.nih.gov/ij/).
Results
Expression of FPs in Culture Cells: ZsGreen1 Yields Strongest Fluorescence
The expression of FPs in cells was examined after transfection of HEK 293 cells with plasmids and after transduction of CHO cells with AAV vectors. HEK 293 cells (the cell line that is used for vector production) were transfected with the cis-plasmids to test the plasmids for proper expression but also to demonstrate the maximal fluorescence potential of the FPs. CHO cells were used for transduction to test the actual vectors, because this cell line is easier to infect with AAV than HEK 293 cells.
After transfection with plasmids carrying the same expression cassette as the AAV vectors (the “cis-plasmid”), all the FPs tested were visible in unfixed HEK 293 cells when transfected with equal amounts of plasmid DNA and visualized 24 hr later (Figure 1). There were, however, differences in the percentage of cells with visible fluorescence as well as in the fluorescence intensity of those cells. Microscopically, cells transfected with ZsGreen1 showed both the highest number of positive cells and the brightest fluorescence (Figure 1). All other FPs were visible only in a lower percentage of cells and showed also a decreased brightness as compared with ZsGreen1. Cells expressing AcGFP1, hMGFP, EGFP, TurboRFP, and DsRed2 displayed about the same number of positive cells, as judged by microscopic evaluation. Also, there was no visible difference in the expression pattern between hMGFP with and without intron. For a more quantitative evaluation, we performed flow cytometry on transfected HEK 293 cells, demonstrating that cells expressing ZsGreen1 had an ∼10-fold brighter fluorescence than EGFP (Figure 2A).
Similar results were obtained by transduction with viral vectors, although lower percentages of cells can be transduced compared with plasmid transfection. Again, ZsGreen1 was visible in the highest number of cells and displayed the strongest fluorescence, as observed microscopically (Figure 1) and by flow cytometry (Figures 2B and 2C). A fluorescence signal could be detected by flow cytometry in ∼80% of cells transduced with ZsGreen1-expressing vector. EGFP and AcGFP1 fluorescence was detectable in ∼20% of the cells, whereas less than 0.2% of the cells were hMGFP-positive, for vectors both with and without intron (Figure 2C). In addition, ZsGreen1 was first visible microscopically earlier than 24 hr after starting the incubation of cells with vector, whereas all the other proteins could first be observed only later.
Effect of Fixatives on Fluorescence
Standard protocols for GFP detection in tissues require fixation of the sample, typically before freezing and sectioning. We therefore tested on transfected and transduced culture cells (HEK 293, CHO) how far fixation interferes with the fluorescence of the proteins. When we mimicked the fixation conditions applied for the processing of the tissues, i.e., overnight fixation in 10% formalin, all of the green FPs (ZsGreen1, AcGFP1, hMGFP, EGFP) as well as TurboRFP tolerated fixation very well, showing virtually no loss in their fluorescence intensity (Figure 1). However, we observed a relatively strong decline in the fluorescence intensity in DsRed2 after fixation with formalin and also with paraformaldehyde, leaving almost no cells visible with red fluorescence except for cells that originally had shown a very strong fluorescence (Figure 1). This effect could be observed even after a short fixation time of 15 min. Removal of the fixative and incubation of the cells in PBS for 1 hr failed to reconstitute the original fluorescence intensity of DsRed2.
We next tested which sectioning protocol would result in the strongest fluorescence after gene transfer into liver, lung, and muscle. Best results were achieved when the tissues were first fixed overnight in formalin, then washed in PBS, and finally frozen in OCT for cryosectioning (standard protocol). In contrast, tissues frozen without prior fixation and then cryosectioned showed a dramatic reduction in fluorescence, regardless of whether the sections were fixed later in paraformaldehyde or remained completely unfixed. The FPs appeared to have diffused out of the cells of their origin if the tissue was not fixed before sectioning, yielding a diffuse background fluorescence in the sections, with only a few cells remaining fluorescent. For the following comparison of different FPs expressed in organs, we therefore describe only the tissues processed according to the standard protocol, i.e., tissues that had been fixed overnight in formalin before cryosectioning.
Organ-specific Expression of FPs in Liver, Lung, and Muscle
The expression of FPs in tissue sections was evaluated according to the relative number of positive cells within each organ and according to the fluorescence intensity displayed by those cells. Expression of the FPs from AAV2/5 was visible in liver in hepatocytes (Kupffer cells or other cell types in the liver appear not to be transduced at any significant levels), in muscle tissue in fibers, and in lung, mainly in alveolar cells, where occasionally epithelial cells of bronchioles also had been transduced. In liver, transduced hepatocytes were typically not evenly distributed, but were often concentrated around blood vessels such as central veins, a phenomenon that has been described before (Xiao et al. 1998). Serial sectioning from different sites (depths) within the tissue block showed that the observed expression patterns appeared to be consistent throughout the whole organ.
The original goal of this study was to identify a single FP that yields the strongest fluorescence and therefore the highest sensitivity when expressed in all three organs. Interestingly, we observed differences in the expression levels of the individual FPs depending on the organ in which they were expressed. The expression patterns for each FP were consistent within each group, and representative images are shown.
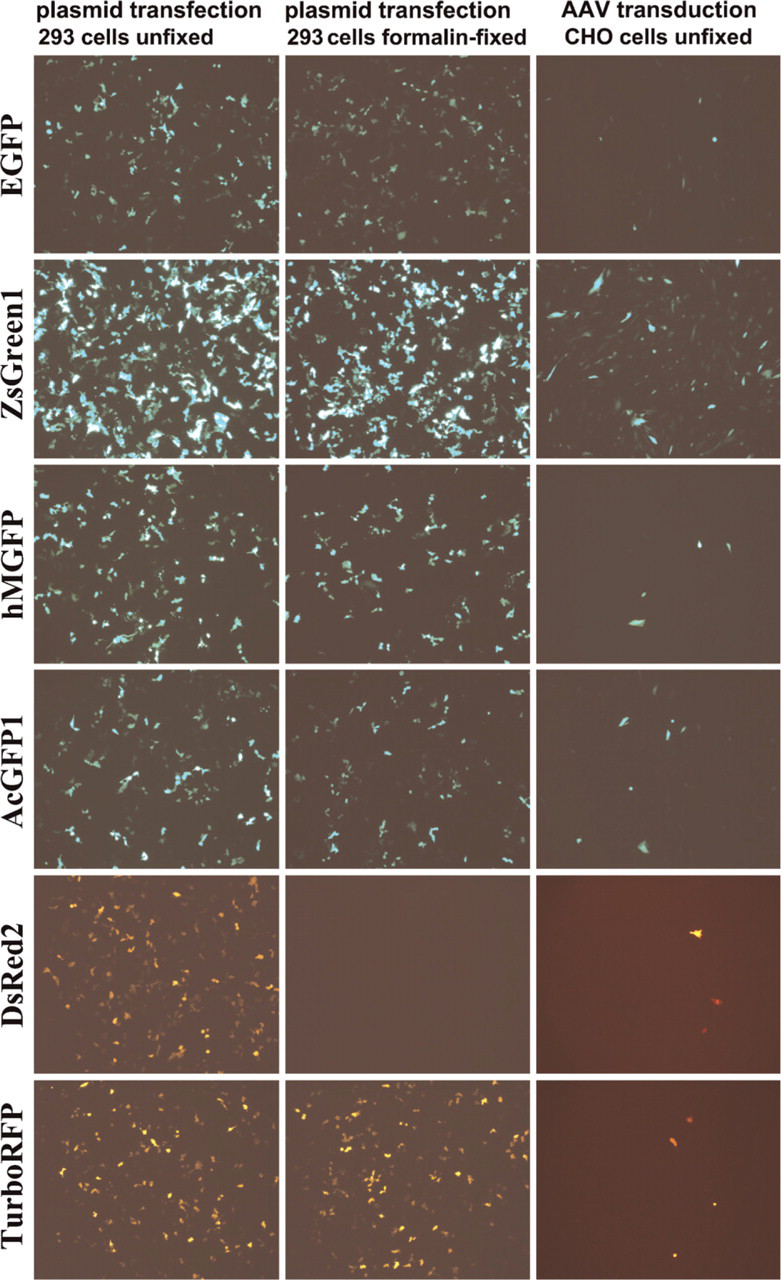
Expression of fluorescent proteins (FPs) as indicated in HEK 293 cells after transfection with plasmids (500 ng DNA/well of 6-well plate) in live cells (left column) and after formalin-fixation (middle column), and in live CHO cells after transduction with adeno-associated virus serotype 5 (AAV2/5) (5 × 10⁴ genome copies per cell, right column). ZsGreen1 produces the strongest fluorescence in cells.
EGFP, which served as reference to compare the other FPs, performed particularly well in liver, but demonstrated also a strong fluorescence in lung comparable to ZsGreen1 (Figure 3). All other proteins yielded only smaller numbers of fluorescent hepatocytes relative to EGFP. In muscle, EGFP appeared to generate a somewhat weaker fluorescence than AcGFP1 and ZsGreen1 (Figure 3).
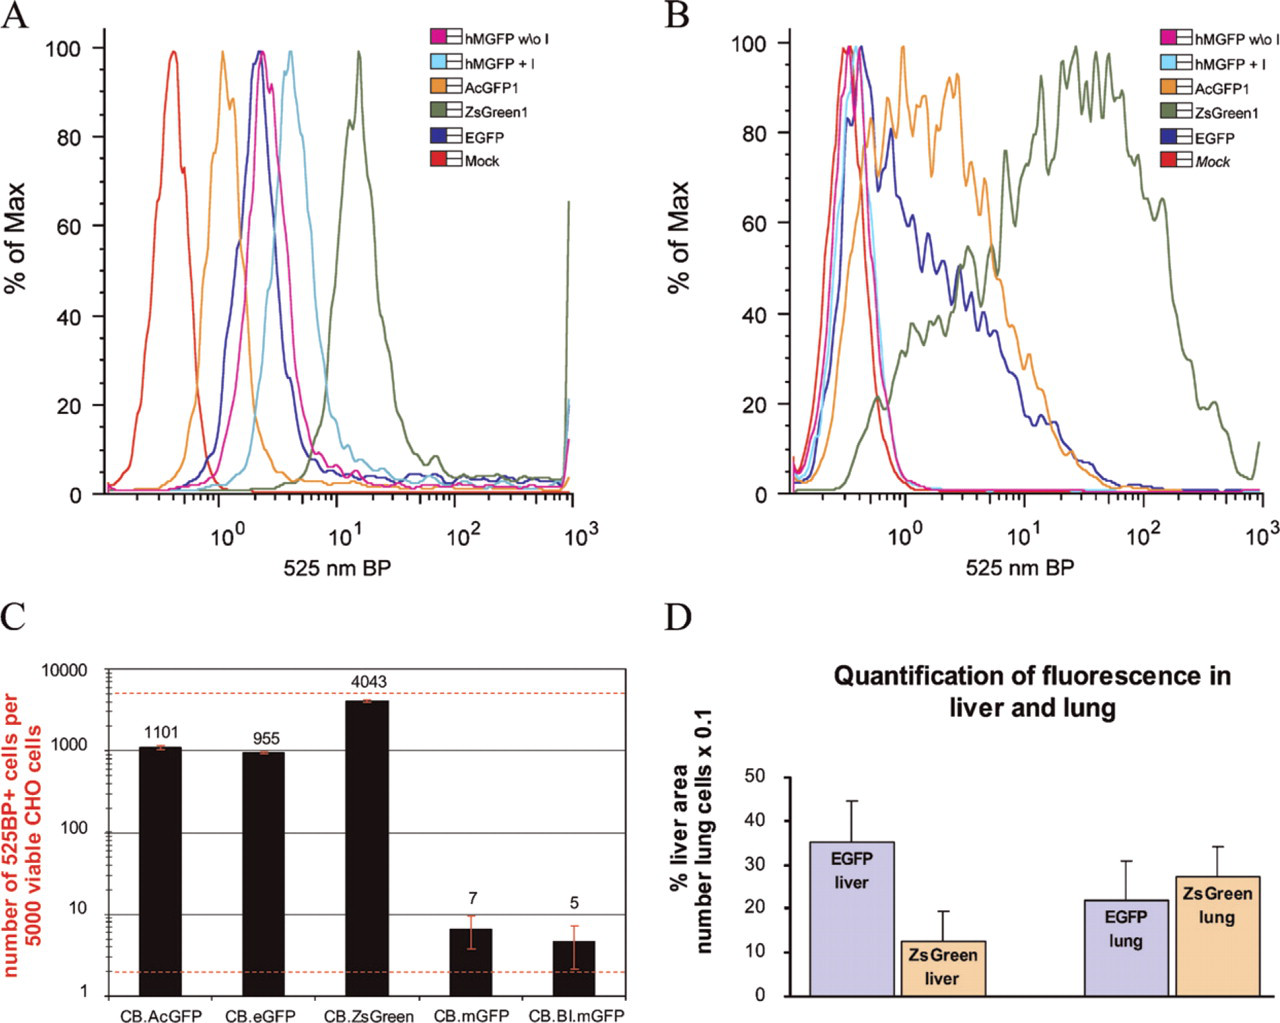
Quantification of fluorescence. (
ZsGreen1 showed high levels of positive cells in lung and intense fluorescence in muscle, as was expected from its performance in culture cells, but surprisingly yielded lower numbers of fluorescent hepatocytes in liver than EGFP (Figure 3; see also graph in Figure 2D). However, although ZsGreen1 was visible in liver in only about half as many cells as EGFP, ∼10% of those positive cells displayed a very high fluorescence that was more intense than in any of the other proteins.
AcGFP1 was visible in muscle with a fluorescence at least as intense as ZsGreen1, but yielded considerably lower numbers of positive cells in lung and liver than EGFP or ZsGreen1 (Figure 3). Still, the maximal fluorescence intensity of AcGFP1-positive cells in lung and liver was comparable to that of EGFP.
hMGFP, expressed from transgenes both with and without intron, could hardly be detected at all in any of the organs, despite its visible fluorescence in transduced culture cells and its proven resistance to formalin fixation. Only a few isolated fluorescent cells in lung and fibers in muscle were visible in some of the animals (data not shown).
DsRed2 showed only very weak fluorescence in liver and a somewhat stronger signal in muscle, but was virtually undetectable in lung. We could, however, observe a few isolated hepatocytes with a stronger fluorescence in liver (Figure 4). This weak fluorescence was obviously due to the intolerance of DsRed2 to fixation as we had tested in culture cells.
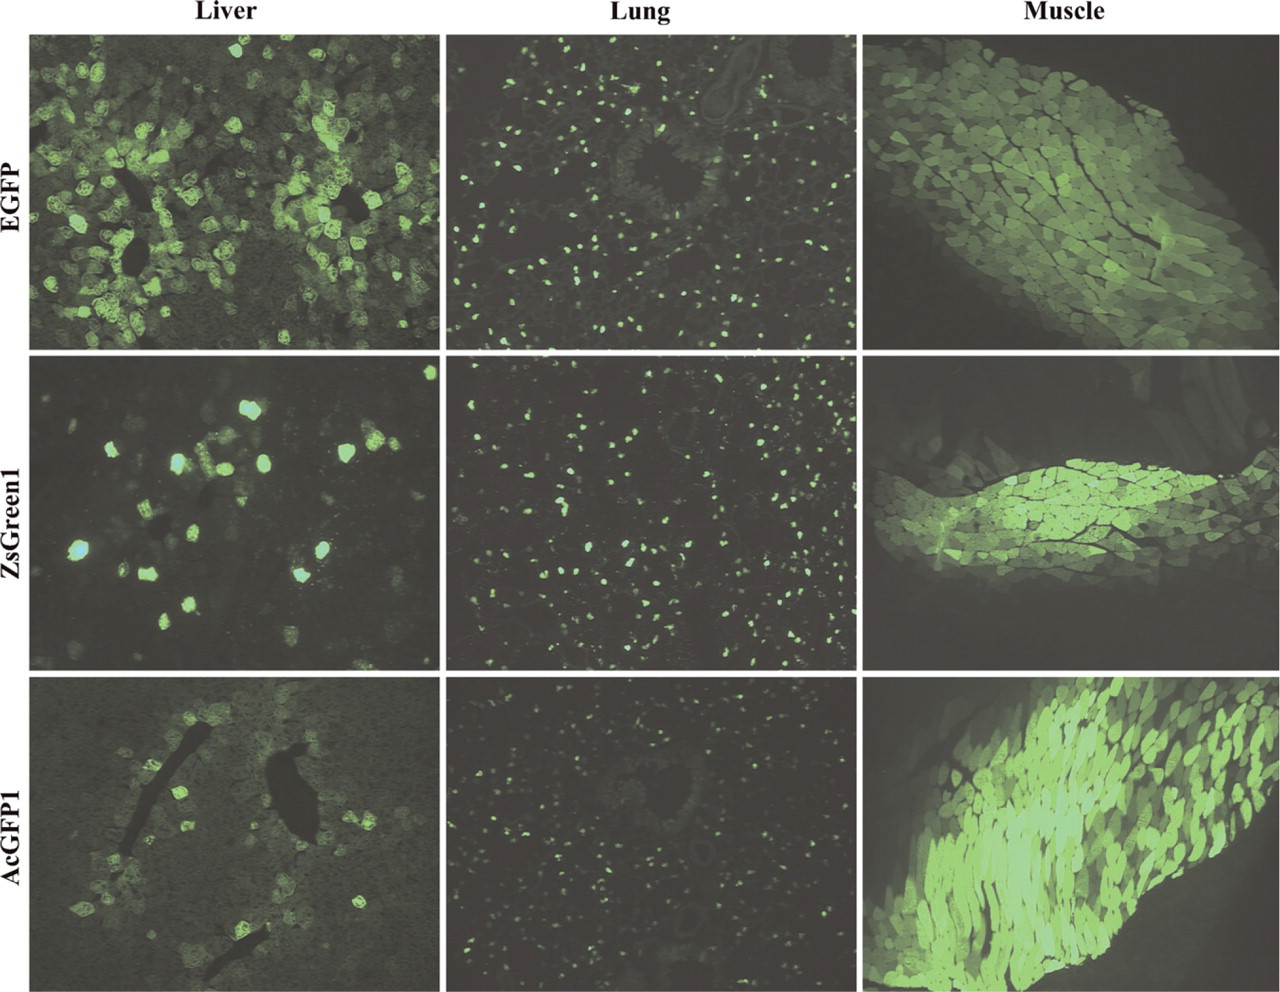
Expression of green FPs in liver, lung, and muscle. Mice had received identical doses of AAV2/5 expressing EGFP, ZsGreen1, and AcGFP1 (top, middle, and bottom row, respectively). Representative images show organ-specific expression patterns for each protein.
TurboRFP was visible in muscle fibers with a bright fluorescence, but yielded only low numbers of fluorescent cells in lung and liver. Similar to ZsGreen1, the few positive hepatocytes in liver showed mostly a very bright fluorescence (Figure 4).
These results suggest that each FP expressed from an AAV vector develops an individual fluorescence pattern depending on the organ in which it is expressed. Based on our results, in liver, EGFP produces the highest number of positive hepatocytes; in lung, ZsGreen1, along with EGFP, yields the most fluorescent cells; and in muscle, AcGFP1, ZsGreen1, and, to a slightly lesser degree, EGFP and TurboRFP lead to the most intense fluorescence (Table 2).
Because a possible explanation for these different expression patterns would be organ-specific differences in the immunogenicity of the proteins, leading to the elimination of transgene-expressing cells or muscle fibers, we examined hematoxylin and eosin (H and E)-stained paraffin sections from the livers of all animals. We could not detect any histological differences between livers from mice expressing a certain FP. In all liver sections, a few small infiltration sites were visible, indicating a mild inflammatory response irrespective of the type of transgene expressed (not shown). Also, we could not detect any remarkable infiltration sites or necrotic muscle fibers in cryosections of lung and muscle that would have been consistent with an immune reaction against transduced tissues.
Discussion
A major observation of this study was the finding that each of the six tested FPs expressed from AAV2/5 showed an organ-specific fluorescence pattern that was different between the tested FPs and was very different from the fluorescence levels obtained in transfected or transduced culture cells. Each combination of FP and organ appeared to produce its own consistent fluorescence pattern. Therefore, fluorescence levels from a given FP in culture cells do not necessarily predict the fluorescence patterns that will be obtained in a certain organ. For example, ZsGreen1 produced the strongest fluorescence in culture cells but only relatively few hepatocytes in the liver were positive. In contrast, EGFP gave lower fluorescence intensities in culture cells but higher numbers of fluorescent hepatocytes compared with ZsGreen1.
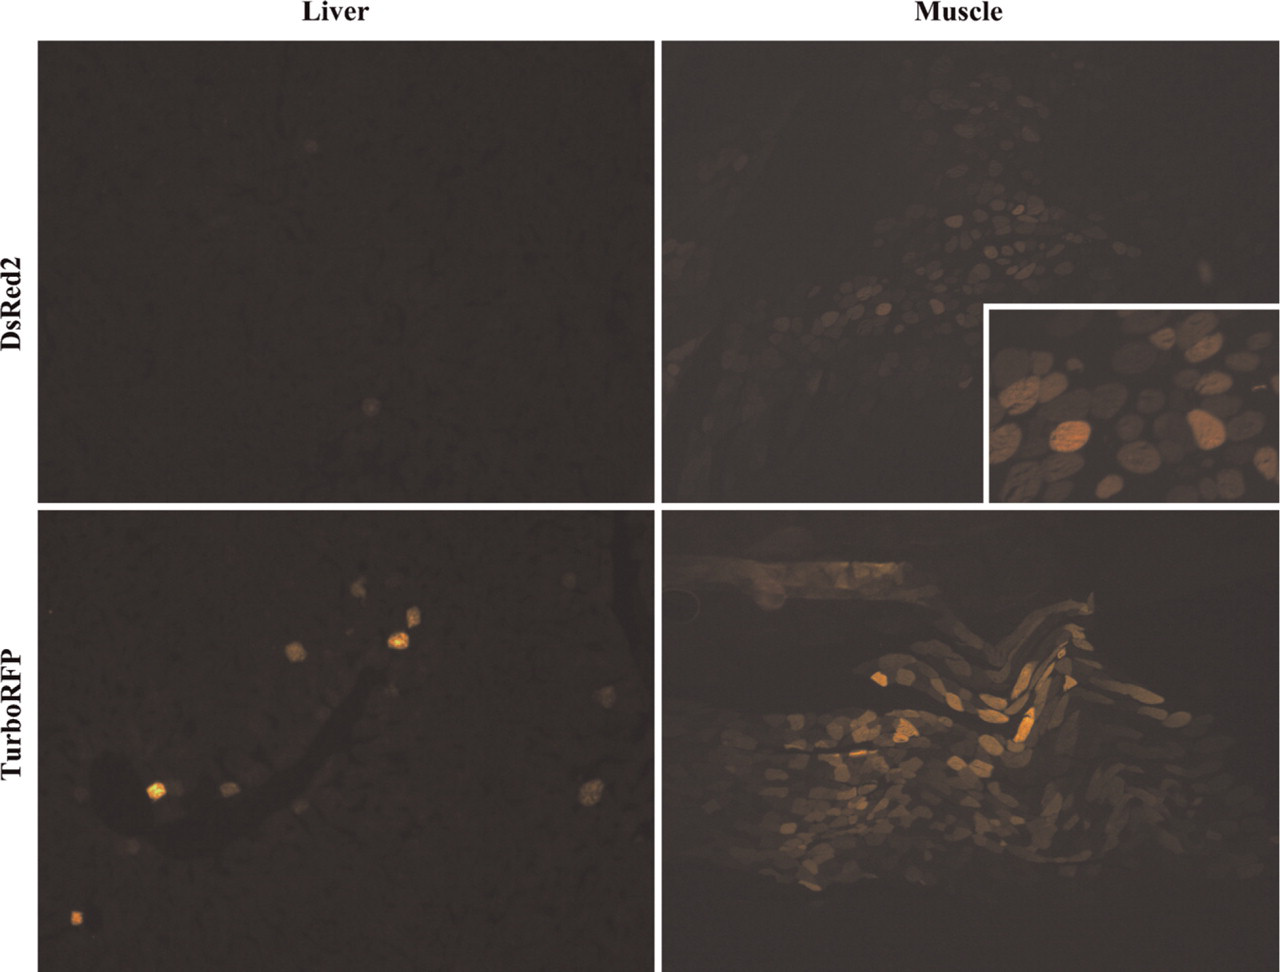
Expression of red FPs in liver and muscle. Mice had received identical doses of AAV2/5 expressing DsRed2 (top) and TurboRFP (bottom). DsRed2 fluorescence was severely reduced by fixation. Inset shows part of the section at higher magnification.
Tissue-specific performance of the tested FPs
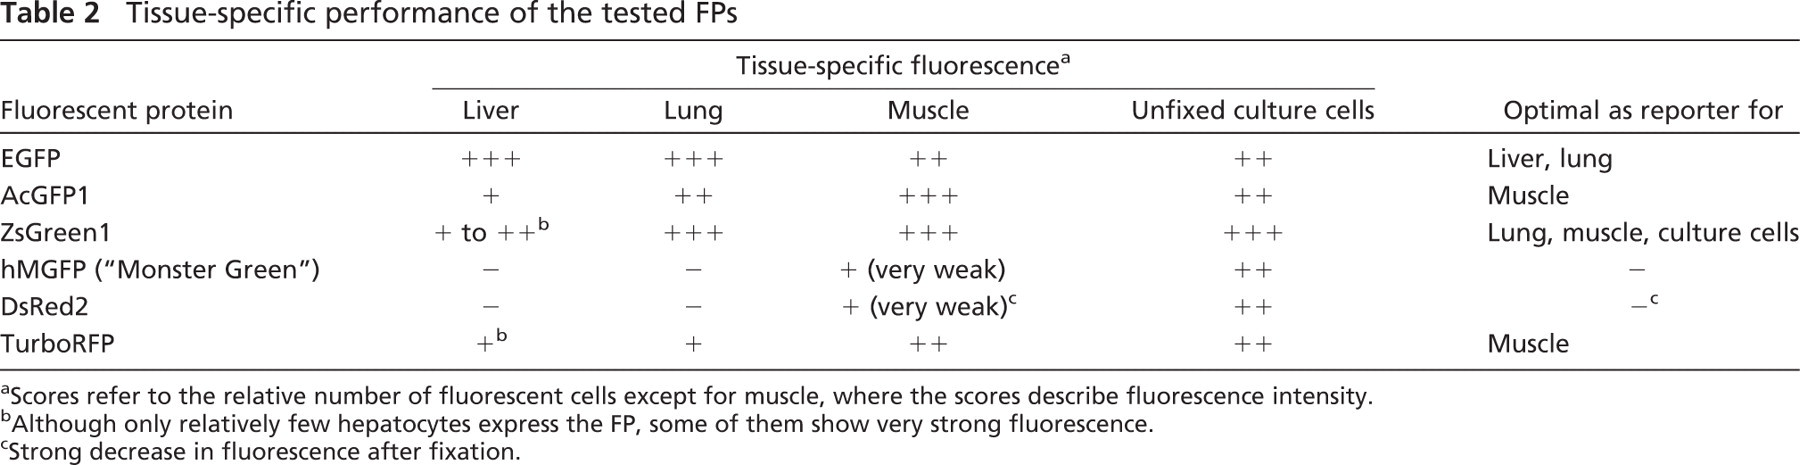
Scores refer to the relative number of fluorescent cells except for muscle, where the scores describe fluorescence intensity.
Although only relatively few hepatocytes express the FP, some of them show very strong fluorescence.
Strong decrease in fluorescence after fixation.
It is unclear why the FPs show a specific fluorescence pattern depending on the organ in which they are expressed, a behavior that is apparently unrelated to the vector. Using the results from transfections and transductions of culture cells as a measure, ZsGreen1 appears to be underperforming in liver, AcGFP1 and TurboRFP in lung and liver, and hMGFP in lung, liver, and muscle. A histologic examination of the organs did not reveal any abnormalities or histopathologic differences between the groups. We could not detect any pronounced inflammatory reactions such as large infiltrates, and there were no signs of apoptotic events that would have led to the formation of detectable apoptotic bodies in the H and E-stained liver sections. However, the histopathologic appearance of the organs does not necessarily rule out that immunogenicity plays a role in the different expression patterns. Each FP might elicit an immune response of different intensity, leading to the observed variations in fluorescence.
Transgene or cell type-specific posttranscriptional or posttranslational modifications affecting the half-life of the mRNA or the protein could play a more important role in the observed differences in fluorescence patterns (reviewed by Wilusz et al. 2001; Mata et al. 2005). In an earlier study, we found that gene transfer of β-galactosidase in lung gives a much lower visible expression than with alkaline phosphatase as transgene expressed from identical vectors, showing that the type of transgene can have an impact on the detectable expression levels that appears to be independent from the intrinsic sensitivity of the reporter molecule. Using a nuclear-targeted version of LacZ circumvented this problem, suggesting the presence of cytoplasmic factors that impact the stability of β-galactosidase (Bell et al. 2005).
It is noteworthy that ZsGreen1, which overall produced the most intense fluorescence, forms tetramers, which might increase its half-life compared with the other monomeric or dimeric FPs. It was shown that nuclear-localization signal-containing fusion proteins with DsRed1 were unable to enter the cell nucleus, whereas similar constructs with DsRed2 were transported into the nucleus (Soling et al. 2002). DsRed1 and DsRed2 differ by several amino acid substitutions, demonstrating that different FPs can be localized differently within the cell and therefore could be subject to different half-lives. The intracellular localization of FPs can also affect their fluorescence intensity. EGFP targeted to the endoplasmatic reticulum produced a significantly weaker fluorescence than cytosolic EGFP (Zou et al. 2005).
Our observations have implications for biodistribution studies that are evaluating the organ-targeting properties of vectors. A certain reporter gene might produce lower levels of signals than other transgenes, depending on the organ of expression, and thus could lead to the wrong choice of vector for therapeutic gene transfer. Therefore, the organ-specific potential of each FP should be taken into consideration when performing expression assays with fluorescent reporters. As summarized in Table 2, we find EGFP best suited for liver gene transfer, ZsGreen1 and EGFP for lung studies, and ZsGreen1 and AcGFP1 for muscle studies.
In contrast to our finding that DsRed2 fluorescence is compromised by fixation, others have used DsRed2 successfully as a reporter in specimens fixed with para-formaldehyde (Maruyama et al. 2004; Webster et al. 2005; Weber et al. 2006) or even acetone (Tolar et al. 2007). It might be possible that the results published by others show only high expression levels (and most of these images were acquired by the more-sensitive confocal microscopy) and actually missed lower concentrations of DsRed2. In fact, we were able to detect DsRed2 in some of the muscle tissue, presumably expressed at high levels but only visible with weak fluorescence due to the fixation (Figure 4). The survival of DsRed2 fluorescence might also depend on other factors that change during fixation, such as salt concentrations, pH, etc.
Fixation of the tissues before cryosectioning was essential to prevent the FPs from diffusing away from the cells of their origin. The phenomenon of diffuse fluorescence in cryosections prepared from unfixed tissues has been described before for EGFP (Jockusch et al. 2003) and, according to our observations, appears to be a peculiar property of all FPs.
Footnotes
Acknowledgements
Funding for this work was provided by the National Institutes of Health, Grants P01 HL-059407, R01 HL-049040, and P01 HL-051746.
We thank the Vector and Quality Control Cores and the animal models group of the University of Pennsylvania for their help.