
Abstract
Regulatory T cells (Treg) are a subset of T lymphocytes that play a central role in immunologic tolerance and in the termination of immune responses. The identification of these cells in normal and inflammatory conditions may contribute to a better understanding of underlying pathology. We investigated the expression of FOXP3 and GITR in normal skin and in a panel of different inflammatory dermatoses. Immunohistochemical double stainings in skin tissue sections revealed that FOXP3 and GITR were almost exclusively present on T cells that express both CD4 and CD25. Further, immunohistochemical double staining, as well as fluorescence-activated cell sorter analysis, on peripheral blood T cells showed that most FOXP3+ cells expressed GITR and vice versa, whereas a minority were single-positive for these markers. The mean frequency of FOXP3+ T cells in spongiotic dermatitis, psoriasis, and lichen planus was in the same range (25-29%), but the frequency of these cells in leishmaniasis appeared to be lower (∼15%), although this was not statistically significant. The mean frequency of GITR+ T cells was fairly similar in all conditions studied (14-20%). Normal human skin also contained FOXP3+ and GITR+ cells in the same frequency range as in diseased skin, but the absolute numbers were, of course, much lower. In conclusion, frequencies of FOXP3+ and GITR+ T cells were similar in all inflammatory skin diseases studied and normal skin, despite the well-known differences among the inflammatory conditions under investigation.
R
The functional activity of effector T cells and Treg must be in proper balance to achieve adequate immune responses. Consequently, abnormalities in number and function of Treg disturb this control mechanism of immune regulation and may contribute to the pathogenesis of a given disease. Thus far, studies on human Treg have mostly been carried out on the CD4+CD25high subset of T cells from peripheral blood samples obtained from either healthy or diseased individuals. Little is known about the presence or distribution of Treg in normal and diseased human tissue because of a lack of specific markers. CD25 is strongly and constitutively expressed by Treg, but identification of CD4+CD25+ cells is not an option, because recently activated T cells also express CD25. A suitable marker that has been put forward to identify Treg is the transcription factor FOXP3, a member of the forkhead winged helix protein family of transcription factors (Fontenot et al. 2003). Another marker associated with Treg activity is the glucocorticoid-induced tumor necrosis factor receptor (GITR) (McHugh et al. 2002). Several lines of evidence have shown that GITR, unlike CD25, directly affects the maintenance of immunological tolerance and, in particular, the function of Treg (Shimizu et al. 2002; Stephens et al. 2004). GITR, however, is not exclusively expressed by Treg, because it is known to be expressed by recently activated T lymphocytes.
At present, little is known about the distribution or frequency of Treg in normal and diseased skin. Therefore, we studied FOXP3- and GITR-positive T cells in normal skin and a panel of inflammatory skin disorders. In the first part of the study, we evaluated the coexpression of FOXP3, GITR, CD4, and CD25, using an immunohistochemical double-staining approach. For optimal evaluation of double staining, we used spectral imaging, a new and powerful computer-assisted optical technique that improves perceptibility of each individual color in immune double stains. In the second part of the study, we investigated the frequency of the putative Treg markers FOXP3 and GITR in normal skin as well as in the lesional skin of several different types of inflammatory skin diseases, including hypersensitivity reaction of the skin (spongiotic dermatitis), infectious skin disease (leishmaniasis), psoriasis, and lichen planus.
Materials and Methods Flow
Cytometry
Mononuclear cells were purified from peripheral blood from healthy donors using Lymphoprep (1.077 g/ml; Axis-Shield Poc AS, Oslo, Norway) density gradient centrifugation. Nonspecific binding of antibodies was prevented by incubating the cells in phosphate-buffered saline containing heat-inactivated 10% normal human serum, 10% fetal bovine serum, and 0.1% sodium azide. Cells were indirectly stained with anti-GITR extracellular domain antibody (clone 110416; R & D Systems Europe Ltd, Abingdon, UK) and FITC-conjugated F(ab′)2 fragments of goat anti-mouse IgG and IgM (Jackson ImmunoResearch Laboratories, Inc.; West Grove, PA). Then cells were incubated for 10 min at 4C with normal mouse serum (Dako; Glostrup, Denmark) followed by PerCP Cy5.5-conjugated anti-CD4 (Becton Dickinson; Mountain View, CA) and allophycocyanin-conjugated anti-CD25 (eBioscience; San Diego, CA). Finally, cells were intracellularly stained with phycoerythrin-conjugated anti-FOXP3 (clone PCH101; eBioscience) according to the manufacturer's protocol, using fixation and permeabilization buffers from the same provider. Isotype-matched antibodies were used as controls to adjust the instrument settings of the flow cytometer. Flow cytometry was conducted on a FACSCalibur (Becton Dickinson) and analyzed by WinMDI 2.8 software (internet freeware).
Tissue Specimens
Well-documented formalin-fixed paraffin-embedded specimens from lesional skin of psoriasis (n=13), spongiotic dermatitis (n=13), lichen planus (n=12), and leishmaniasis (n=12) patients were retrieved from the archives of our department. Samples of normal adult human skin (n=14) were obtained from residual specimens discarded after plastic surgery of the breast or abdomen, and were formalin fixed and paraffin embedded. Additional snap-frozen tissue of normal skin (n=8), and that of lichen planus (n=2) and psoriasis (n=2) patients was used for a number of immunodouble staining experiments. Serial sections (5 μm) were prepared from all skin specimens. Acquisition of tissue samples was approved by the institutional medical ethical committee, and the study was conducted according to the Declaration of Helsinki Principles.
Single Staining
Immunohistochemical single staining on paraffin sections was performed using a standard polymer-peroxidase technique. After deparaffination and rehydration, endogenous peroxidase activity was blocked with methanol containing 0.3% peroxide. Heat-induced antigen retrieval was performed using 10 mM Tris-HCl and 1 mM EDTA, pH 9.0, in a microwave oven for 15 min. Then sections were covered with serum-free protein block (Dako), followed by different primary antibodies. After incubation with polyclonal rabbit anti-CD3 (SP7; Labvision, Fremont, CA) or anti-FOXP3 (clone 236A/E7; Abcam, Cambridge, UK), EnVision+ anti-rabbit/horseradish peroxidase (HRP) polymer (Dako) or EnVision+ anti-mouse/ HRP polymer, respectively, were used as second step. In the case of polyclonal goat anti-GITR (R & D Systems Europe Ltd), an intermediate step with rabbit anti-goat immunoglobulin (Dako) was applied, followed by EnVision+ anti-rabbit/ HRP polymer. Finally, peroxidase activity was developed using a liquid diaminobenzidine (DAB+) chromogen system (Dako).
Double Staining
Double-staining combinations CD25-FOXP3 and CD4-FOXP3 were performed on formalin-fixed cryostat sections. The following sequence of steps was applied: endogenous peroxidase activity was blocked with sodium azide and peroxide in Tris-buffered Saline (TBS); serum-free protein block; FITC-conjugated CD4 or CD25 antibodies (both from Dako); rabbit anti-FITC (Dako); HRP-conjugated goat anti-rabbit immunoglobulins (Dako); peroxidase activity visualization with DAB+; heat-induced antigen retrieval using Tris-HCl/EDTA, pH 9.0; serum-free protein block; FOXP3 antibody 236A/E7; alkaline phosphatase (AP)-conjugated goat anti-mouse immunoglobulins (Dako); AP activity visualization with liquid permanent red (LPR; Dako).
A double staining combination FOXP3-GITR was performed on the formalin-fixed and paraffin-embedded skin samples. The following sequence of steps was applied: blocking of endogenous peroxidase activity using methanol and peroxide; heat-induced antigen retrieval using Tris-HCl/EDTA, pH 9.0; serum-free protein block; a cocktail of FOXP3 antibody 236A/E7 and GITR antibody (goat derived); unlabeled rabbit anti-goat immunoglobulin (Dako); EnVision+ anti-rabbit/HRP (Dako); peroxidase activity visualization with DAB+ kit; normal rabbit serum; AP-conjugated rabbit anti-mouse immunoglobulin (Dako); and finally, visualization of AP activity with LPR.
Double staining combinations CD25-GITR and CD4-GITR were performed on acetone-fixed cryostat tissue sections. The following sequence of steps was applied: blocking of endogenous peroxidase activity using sodium azide (0.1%) and peroxide (0.3%) in TBS; serum-free protein block; anti-GITR overnight at 4C; biotinylated swine anti-goat immunoglobulin (BioSource; Camarillo, CA); AP-conjugated streptavidin (Dako); AP activity visualization with LPR; normal goat serum; CD4 or CD25 antibody; EnVision+ anti-mouse/HRP polymer; peroxidase activity visualization with DAB+.
Negative and “half” (omission of one antibody of the combination) double-staining control experiments were performed with matched species or mouse isotype control reagents using similar immunoglobulin concentrations.
Spectral Imaging
In this study, we used the Nuance spectral imaging system (CRi; Woburn, MA) for the analysis of all brown-red double-stained specimens. Because spectral imaging unmixes colors based on their spectral characteristics, the visual contrast between the colored reaction products is no longer important (Levenson and Mansfield 2006). Therefore, we opted for two crisp reaction products in a red-brown color combination, composed of DAB and LPR, respectively. Spectral imaging data cubes were taken from 460-660 nm at 10-nm intervals and analyzed with the Nuance software. Spectral libraries of single-red (LPR) and single-brown (DAB) were obtained from the control slides. The resulting library was applied to the double-stained slides, and the DAB and LPR reaction products were then spectrally unmixed into two individual black-and-white images, representing the localization of each of the reaction products. Fluorescence-like images composed of pseudocolors showing colocalization (FOXP3/CD4, FOXP3/CD25, and FOXP3/GITR) were created by overlaying the individual images using Adobe Photoshop (version 8.0; Adobe Systems, San Jose, CA). Colocalization of membrane staining (CD25/GITR and CD4/GITR) was visualized with image analysis software (Image Pro Plus, version 5.01; Media Cybernetics, Silver Spring, MD) by applying the Boolean “AND” operation. This operation combines individual unmixed images into a new image consisting solely of colocalized (double-stained) pixels, thus representing double-stained cells only.
Quantification
Quantification of the frequency of immunostained cells in the different inflammatory conditions was performed in the single-stained serial sections. The center section was stained for CD3, whereas the two adjacent serial cut sections were stained for FOXP3 and GITR, respectively. Frequency of FOXP3- and GITR-positive cells in all the inflammatory lesions was determined as follows: a digital overview image of each CD3-stained section was captured at a low-power magnification (10 × 2), and four areas with the highest density of CD3-positive cells in the dermis were manually marked using image analysis software (Image Pro Plus). Next, these selected areas were retraced at high-power (10 × 20) magnification in the corresponding set of adjacent GITR-, CD3-, and FOXP3-stained sections, and digital images of these spots were captured. The total numbers of positive cells in interrelated images were counted using the “manual tag” option of Image Pro Plus, and the percentage of GITR- and FOXP3-positive cells was expressed as percentage of CD3-positive cells. Because of the relatively low numbers of lymphocytes in normal human skin, all dermal CD3-, FOXP3- and GITR-positive cells in the entire section were counted.
Statistical Analysis
Statistical differences between the different inflammatory conditions were evaluated by ANOVA, followed by a posthoc Bonferroni test. p<0.05 was considered statistically significant.
Results
Expression of FOXP3 and GITR by Peripheral Blood T Cells
We first estimated the association of Treg markers FOXP3 and GITR using the well-defined and easily accessible CD4+CD25high Treg subset in peripheral blood. One representative example out of four separate experiments is illustrated in Figure 1. On the basis of CD4 expression and side scatter pattern, CD4+ lymphocytes were selected (Figure 1A) for further analysis. CD4+CD25high, CD4+25low, and CD4+CD25neg subsets were gated (Figure 2B) according to the original report on the identification of human Treg by Baecher-Allan et al. (2001) and analyzed for the expression of FOXP3 and GITR. In agreement with the current literature (McHugh et al. 2002; Roncador et al. 2005), almost all T cells in the CD4+CD25high subset clearly expressed FOXP3, and the majority had a weak or moderate expression of GITR (Figure 2G). The CD4+ CD25low subset (Figure 2F) consisted of two populations. The majority (∼75%) did not express FOXP3, but 20% of this latter population did show a weak expression of GITR. The second population of T cells in the CD4+CD25low subset was FOXP3+, and ∼40% of these cells also expressed GITR. Finally, the expression of FOXP3 and GITR in the CD4+CD25neg subset was negligible (Figure 1E). These results confirm data from the literature that FOXP3 is a good indicator for CD4+CD25high Treg. Furthermore, it shows that the majority of the CD4+CD25+FOXP3+ T cells coexpresses GITR and that a minor proportion is GITRneg.
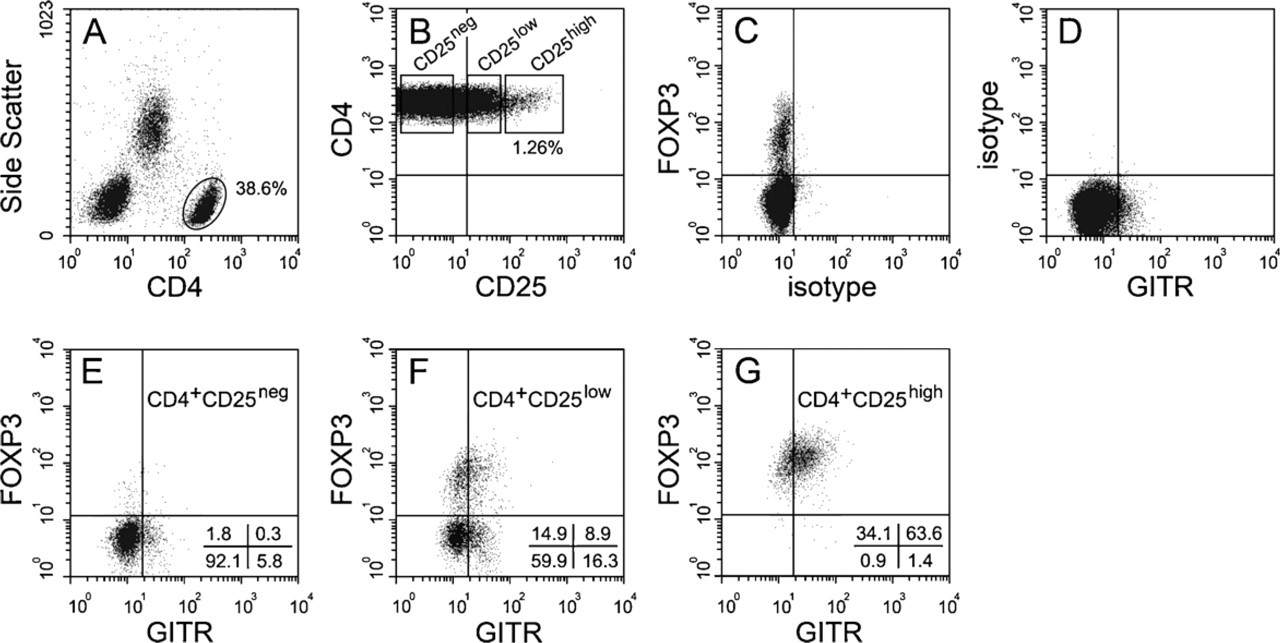
Fluorescence-activated cell sorter analysis showing the expression of FOXP3 and GITR on regulatory T cells (Treg) in freshly drawn human peripheral blood. Treg were gated by their expression of CD4 (
Phenotype of FOXP3- and GITR-positive Cells in Inflammatory Dermatoses
To get a clear view of the phenotype of FOXP3+ and GITR+ cells in situ, we performed immunohistochemical double staining of FOXP3 with GITR, CD4, or CD25 and GITR with CD4 or CD25. Double staining was performed on sections from patients with psoriasis, lichen planus, and normal skin. Representative examples are illustrated in Figure 2, which shows sections from psoriatic lesional skin. FOXP3+ T cells were almost always CD4+CD25+, and the majority also expressed GITR. However, FOXP3+GITRneg cells were present (~10%) in all specimens studied, and, very occasionally, CD25negFOXP3+ cells were encountered (<1%). GITR expression was observed exclusively in coexistence with cells that also express CD4 and CD25 (see Figures 2N and 2P, as well as Figures 2R and 2T, which are identical, implying complete overlap). Approximately 25% of the GITR+ cells showed no colocalization with FOXP3.
Frequency of FOXP3- and GITR-positive Cells in Inflammatory Dermatoses
Next, we performed immunohistochemical single stainings to determine the frequency of FOXP3+ and GITR+ T cells in a large series of skin sections. In Figure 3, representative examples of adjacent sections stained for FOXP3, CD3, and GITR, respectively, are illustrated for normal skin (Figures 3A-3C), spongiotic dermatitis (Figures 3D-3F), psoriasis (Figures 3G-3I), and leishmaniasis (Figures 3J-3L). FOXP3+ and GITR+ T cells were easily detectable in normal skin, as well as in all different types of inflammatory skin diseases. The mean frequency of FOXP3+ and GITR+ cells, expressed as a percentage of the total numbers of CD3+ cells, is summarized in Figure 4. The mean frequency of FOXP3+ T cells was similar in normal skin, spongiotic dermatitis, psoriasis, and lichen planus, but appeared to be lower in leishmaniasis (Figure 4A). This difference was, however, not statistically significant. Although the density (FOXP3+cells/mm2) was higher in inflammatory samples compared with normal skin, we did not observe any significant differences in the density of FOXP3+ cells among the different inflammatory conditions (data not shown).
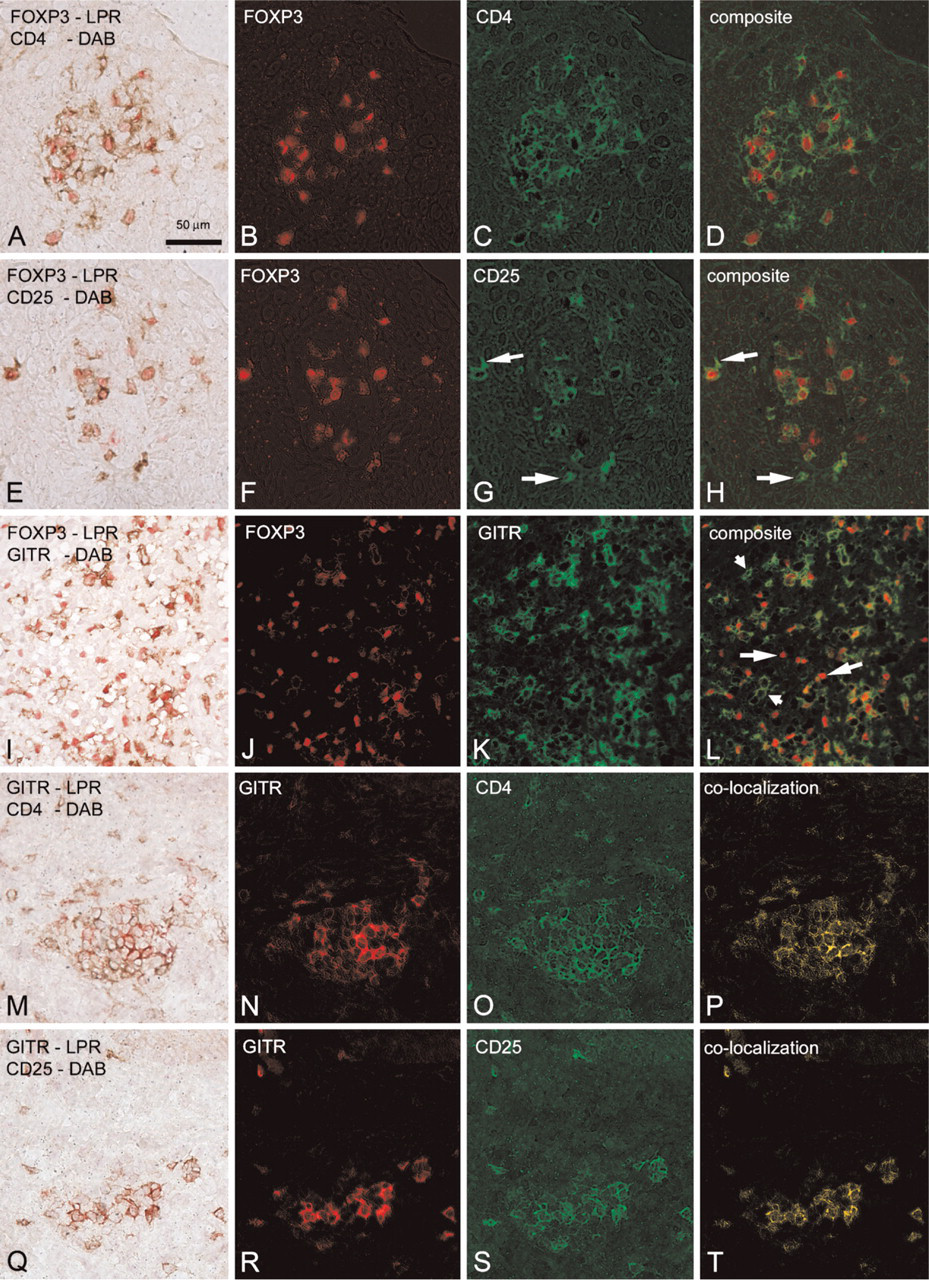
Representative examples of the original double staining, individual spectral images (in pseudocolor), and the composite or overlay images. All images are from the same psoriasis patient. In the left column, the original double staining, in which it is difficult to recognize double-stained cells, is illustrated. In the second and third columns, spectrally unmixed images, representing the original red or brown color only, are depicted in red and green pseudocolors, respectively. In the last column, the composite image or the double-stained cells only, which are now easily recognizable, are depicted. (
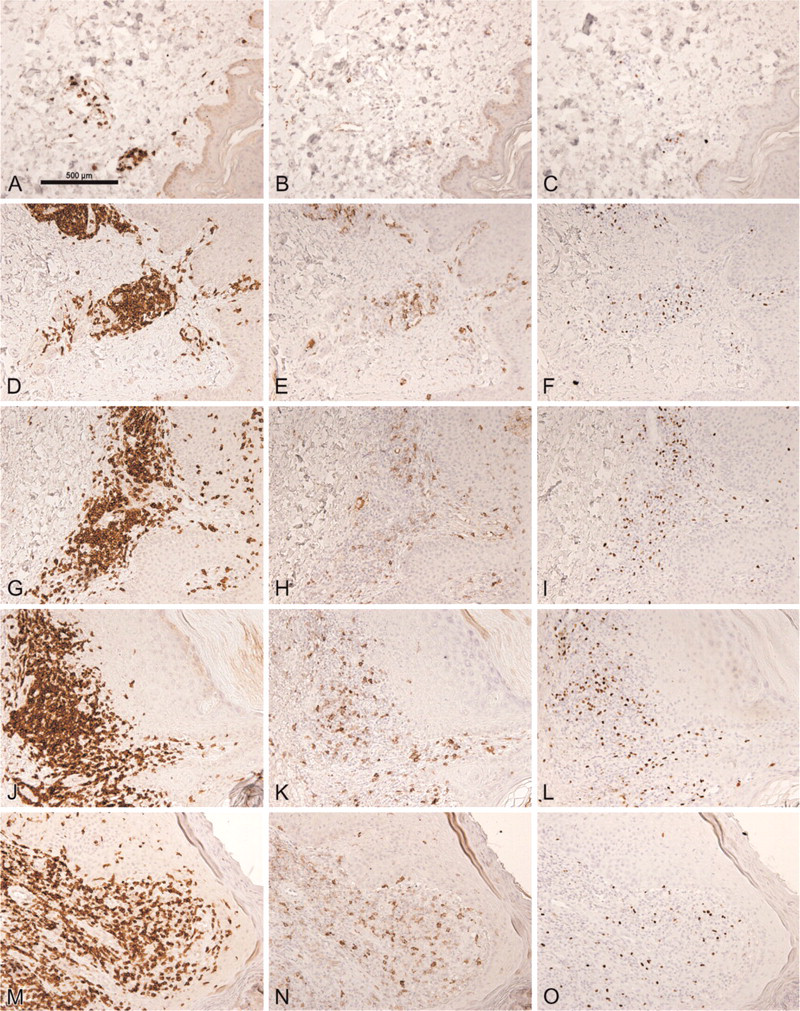
Distribution of CD3 (left column), GITR (middle column), and FOXP3 in adjacent sections of normal skin (
Approximately 20% of the CD3+ T cells in normal human skin expressed GITR (Figure 4B). The variation of GITR+ cells in the different skin diseases was smaller than observed with FOXP3. No significant differences in frequency of GITR+ cells between any of the skin diseases and normal skin could be detected.
Discussion
There is mounting interest in the role of Treg in autoimmunity and chronic inflammatory diseases. In the current literature, most studies have investigated the functional properties of peripheral blood-derived Treg in vitro and the role of Treg in different types of animal models of inflammation or autoimmunity (Baecher-Allan and Hafler 2004; Nielsen et al. 2004; Londei 2005). Little is known about Treg in normal or diseased human tissue. Although the identification of Treg in peripheral blood is relatively simple [CD4+CD25high T cells by fluorescence-activated cell sorter (FACS) analysis], the identification of these cells in tissue specimens is much more difficult. Identification CD4+CD25high T cells using conventional immunohistochemical methods is not an option, because recently activated T cells also express CD25. Therefore, specific phenotypic markers are necessary to identify Treg in situ. In addition to the high expression of CD25, naturally occurring Treg also express CTLA-4, GITR, and FOXP3; the latter two were investigated in this study. Similar to CD25, GITR is expressed by recently activated T cells, and therefore is not exclusive for CD4+CD25+ Treg (McHugh et al. 2002). To date, FOXP3 is considered the best marker for Treg (Hori et al. 2003; Khattri et al. 2003). However, some caution should be taken, because it has been reported that human non-regulatory CD4+ or CD8+ T cells are capable of FOXP3 expression (Walker et al. 2003; Yagi et al. 2004) and that virtually all human FOXP3neg CD25neg T cells may transiently attain the classic phenotype of Treg upon activation, including coexpression of FOXP3 and CD25 and inhibition of proliferation of autologous CD4+CD25neg T cells (Pillai et al. 2007).
In the present study, we investigated the expression of two markers for Treg, FOXP3 and GITR, in relation with CD4 and CD25 in a panel of normal and diseased skin specimens. In agreement with the current literature, we confirmed the association of FOXP3 and GITR with the CD4+CD25high T lymphocytes in the peripheral blood of normal healthy individuals (McHugh et al. 2002; Roncador et al. 2005). Subsequently, we investigated the relationship of FOXP3 and GITR with CD4 and CD25 in normal and inflamed skin in situ and found that all GITR+ and almost all FOXP3+ cells coexpressed CD4 and CD25, similar to the situation in peripheral blood. However, we did not observe a complete overlap in the expression of FOXP3 and GITR in situ. Approximately 10% of the FOXP3+ cells did not express GITR, whereas 25% of the GITR+ cells did not express FOXP3. The latter (GITR+FOXP3neg) may represent recently activated T cells, which are known to express GITR (McHugh et al. 2002). Why some cells are FOXP3+ in the absence of GITR is not clear, because FOXP3 is a transcription factor that induces GITR expression (Fontenot et al. 2003). Also from our FACS data, it appeared that there is a population of FOXP3+GITRneg T cells. It could be that the level of GITR is not high enough to be detected in all Tregs. Our results confirm data from the literature that FOXP3 is a good marker for identifying Treg in situ, whereas GITR is not.
In the second part of the study, we compared the frequency of Treg between normal skin and different types of inflammatory skin diseases. On average, the frequency of FOXP3+ T cells was similar in normal skin, spongiotic dermatitis, psoriasis, and lichen planus but was, although not significantly so, lower in leishmaniasis. However, in this respect, it is important to note that there was considerable variation of FOXP3+ cells among the specimens of each group. Moreover, these frequencies were not only variable in pathologic skin, which could be a result of the stage of the inflammatory process, but in normal human skin also, a large variation in the frequency of FOXP3+ T cells was found among the different patients. Still, on average, it appears that these different pathologic conditions of the skin are not related to an abnormal (local) frequency of Treg. This does not necessarily mean that Treg are not involved in the pathogenesis of any of the investigated diseases. For instance, in psoriasis, it has been observed that it is not the frequency but rather the functional suppressor potential of Treg in peripheral blood and dermis of psoriasis patients that is decreased, which may contribute to the unrestrained hyperproliferation/activation of effector T cells in psoriatic lesional skin (Sugiyama et al. 2005).
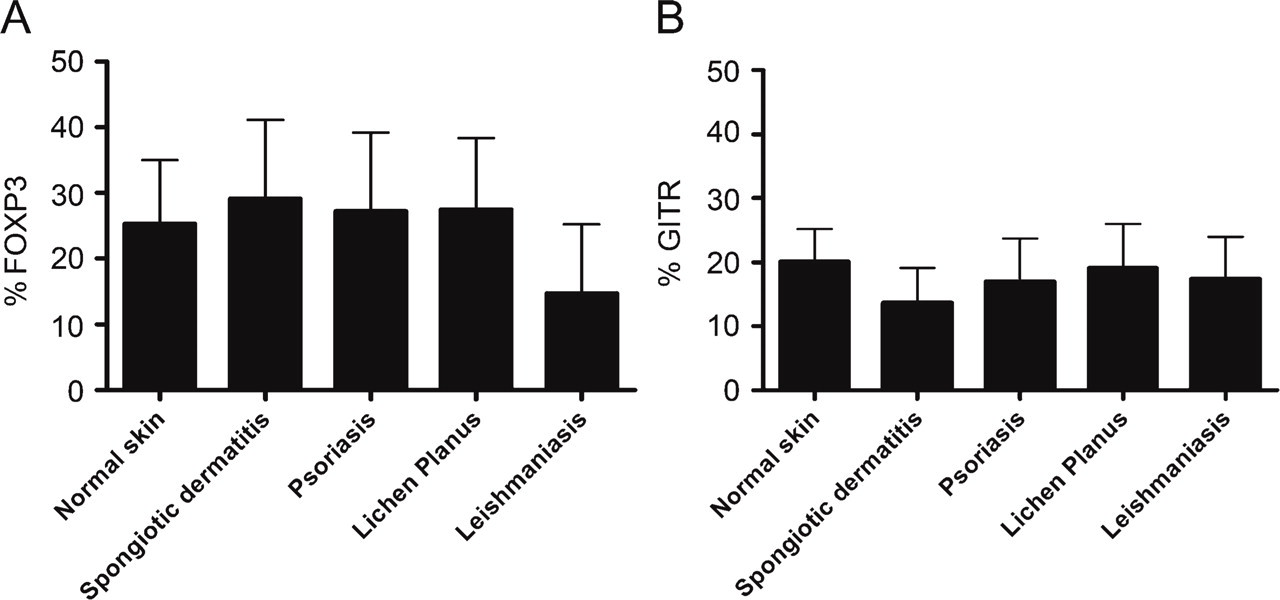
The mean frequency of FOXP3- (
Verhagen et al. (2006) recently reported the absence of FOXP3+ cells in normal, psoriatic, and atopic dermatitis skin specimens. These findings are in sharp contrast with our results, where FOXP3+ cells were easily detectable in all skin specimens studied. These contrasting results can probably be explained by differences in the fixation protocol. We found that FOXP3 is best detected after formalin fixation of the specimens, including cryostat sections, which is not a standard technical procedure for frozen specimens. Results by Sugiyama et al. (2005), who were able to demonstrate the presence of Treg in single-cell suspensions isolated from psoriatic skin by means of flow cytometry, support our observation that Treg are present in human skin.
In summary, naturally occurring Treg are easily detectable in tissue sections from normal as well as diseased skin specimens by the markers FOXP3 and, to a lesser extent, with GITR. Although the frequency of these cells may vary considerably, the mean frequency of these cells seems to be fairly steady irrespective of skin condition.
Footnotes
Acknowledgements
The authors thank Al Floyd (CRi; Woburn, MA) for assistance with spectral imaging experiments and Mrs. H. Ploegmakers for technical assistance.