
Abstract
Increased levels of endothelin-1 (ET-1) in the carotid body (CB) contribute to the enhancement of chemosensory responses to acute hypoxia in cats exposed to chronic intermittent hypoxia (CIH). However, it is not known if the ET receptor types A (ETA-R) and B (ETB-R) are upregulated. Thus, we studied the expression and localization of ETA-R and ETB-R using Western blot and immunohistochemistry (IHC) in CBs from cats exposed to cyclic hypoxic episodes, repeated during 8 hr for 4 days. In addition, we determined if ET-1 is expressed in the chemoreceptor cells using double immunofluorescence for ET-1 and tyrosine hydroxylase (TH). We found that ET-1 expression was ubiquitous in the blood vessels and CB parenchyma, although double ET-1 and TH-positive chemoreceptor cells were mostly found in the parenchyma. ETA-R was expressed in most chemoreceptor cells and blood vessels of the CB vascular pole. ETB-R was expressed in chemoreceptor cells, parenchymal capillaries, and blood vessels of the vascular pole. CIH upregulated ETB-R expression by ∼2.1 (Western blot) and 1.6-fold (IHC) but did not change ETA-R expression. Present results suggest that ET-1, ETA-R, and ETB-R are involved in the enhanced CB chemosensory responses to acute hypoxia induced by CIH.
C
ETs are potent vasoconstrictor peptides, initially isolated from cultures of porcine endothelial cells (Yanagisawa et al. 1988). The three isoforms (ET-1, ET-2, and ET-3) signal through two types of heptahelicoidal G protein-coupled transmembrane receptors, ETA-R and ETB-R (Rubanyi and Polokoff 1994). A growing body of evidence indicates that ETs, predominantly ET-1, modulate the oxygen-sensing process in the CB. Indeed, ET-1 produces a potent dose-dependent chemosensory excitation in situ (McQueen et al. 1994) and in the perfused CB in vitro (Rey et al. 2006a). McQueen et al. (1995) and Spyer et al. (1991) reported the binding of [125I]-ET-1 in blood vessels and chemoreceptor (glomus) cells of rat and cat CBs. Moreover, several studies have confirmed the presence of ET-like immunoreactivity in blood vessels and glomus cells of the rat (He et al. 1996; Chen et al. 2002a,b) and cat CB (Rey et al. 2006a). However, some studies have shown that ET-1 is also located in the interlobular areas of the cat CB (Rey et al. 2006a,b) and rat CB vascular endothelium, with faint or negative staining of glomus cells (Ozaka et al. 1997). Two different groups (Chen et al. 2002a,b) reported the presence of ETA-R in rat glomus cells and interlobular vasculature using immunohistochemistry (IHC). Interestingly, both studies showed that chronic sustained hypoxia increases ET-like immunoreactivity and ETA-R expression in the rat CB. However, it is not known whether CIH increases the expression of ETA-R and ETB-R in the CB. Therefore, the aim of this work was to study the expression and localization of ETA-R and ETB-R in control and CIH-treated CBs using Western blot and IHC. In addition, we studied if ET-1 is present in the glomus cells of control and CIH-treated CBs using double-labeling immunofluorescence for ET-1 and tyrosine hydroxylase (TH), a marker for glomus cells (Wang et al. 1991).
Materials and Methods
Animals and Exposure to CIH
CBs were obtained from eight male adult cats (3.4 ± 0.8 kg, mean ± SD). The experimental protocol was approved by the Ethical Committee of the Facultad de Ciencias Biologicas of the P. Universidad Católica de Chile and performed according to the Guiding Principles in the Care and Use of Animals of the American Physiological Society. Four awake cats were housed in a cylindrical chamber, which was flushed with 100% N2 and compressed air using timed solenoid valves, as previously described (Rey et al. 2004). This gas alternation reduced PO2 to a minimum of ∼75 Torr in ∼100 sec and then returned to near 150 Torr, reducing the PO2 <100 Torr for 60 sec. This pattern was repeated 10 times per hour during 8 hr for 4 days. Four cats were randomly assigned to the control group and exposed to the same protocol in the chamber, replacing N2 with air. The morning after the end of CIH or sham treatment, cats were anesthetized with sodium pentobarbitone (40 mg/kg, IP), followed by additional doses (8-12 mg, IV) given to maintain a surgical level of anesthesia (stage III, plane 2). Both CBs along with the common carotid artery bifurcation were excised from the cats and dissected free from connective tissue in a separate chamber. One CB from each animal was stored at −70C in PBS, pH7.8, for Western blot analysis, whereas the other CB was fixed in 10% neutral-buffered formalin for 24 hr, dehydrated, embedded in paraffin, cut in 5-μm-thick sections, and mounted in silanized glass coverslips for double immunofluorescence and IHC studies.
Antibodies
For details on all the antibodies used in this study, see Table 1.
Western Blot
Eight CBs from control and CIH-treated cats (n=4 in both groups) were individually homogenized in 100 μl of lysis buffer containing 10 mM Tris-HCl, pH 7.4, 150 mM NaCl, 0.5% Triton X-100, 3 mM phenylmethylsulfonylfluoride and 1X protease inhibitor cocktail (Roche Diagnostics GmbH; Mannheim, Germany). Protein sample concentration was determined according to the method described by Lowry et al. (1951). Equal amounts of protein (75 μg) from each CB were resolved by SDS-PAGE on 10% gels under reducing conditions and transferred overnight to 0.2-μm nitrocellulose membranes (Protran BA83; Schleicher & Schuell BioScience, Keene, NH) at 4C. Membranes were blocked with 5% skim milk in PBS, pH 7.4, for 1 hr and incubated with rabbit anti-ETA-R or rabbit anti-ETB-R primary antibodies for 18 hr at 4C. After incubation, membranes were washed six times with PBS, pH 7.4, for 10 min and incubated for 2 hr at room temperature with a horseradish peroxidase-conjugated anti-rabbit antibody in 5% skim milk in PBS, pH 7.4. Finally, membranes were washed with PBS/Tween-20 0.05% three times for 15 min and then exposed to X-ray films (Kodak Biomax MR; Eastman Kodak Company, Norwalk, CT) for 5 min using an ECL chemiluminscence kit (Western Lightning NEL-103; Perkin-Elmer, Norwalk, CT). To confirm equal protein loading, membranes were stripped in a 62.5-mM Tris-HCl, pH 6.8, solution containing 100 mM 2-mercaptoethanol and 2% SDS for 30 min at 50C, washed and reprobed with a monoclonal β-actin antibody for 2 hr at room temperature, and detected as described above. Films were scanned ina flatbed scanner (N676U; Canon, Tokyo, Japan) at 1200 dpi, and optical density (OD) was measured with the ImageJ software (version 1.34s; National Institutes of Health, Bethesda, MD). Densitometry was standardized to β-actin optical density for each sample and expressed as fold-control values. Positive controls consisted of cat lung tissue homogenates, and negative controls were done preincubating ETA-R and ETB-R antibodies with an excess of blocking peptide according to manufacturers' instructions.
Antibodies used in the study
ET-1, endothelin-1; IHC, immunohistochemistry; WB, Western blot; HRP, horseradish peroxidase.
IHC and Double-immunofluorescence Staining
We studied sections passing through the CB equator (parenchyma), identified as the highest profile section in the samples. Peripheral sections through the CB vascular pole were also studied. For further anatomical details, see Heath and Smith (1992). Deparaffinized and rehydrated histological sections were subjected to heat-induced antigen retrieval using 10 mM citrate buffer, pH 6.0, in a 900-W microwave oven for a total time of 21 min and cooled at room temperature for 1 hr. Samples were treated with 10% H2O2 for 10 min to quench endogenous peroxidase activity. After rinsing in 50 mM Tris-PBS, pH 7.8, for 5 min, all slides were incubated for 30 min with protein block solution (X-0909; DakoCytomation, Carpinteria, CA). Sections were incubated for 18 hr at 4C with rabbit anti-ETA-R, rabbit anti-ETB-R, or monoclonal anti-TH primary antibodies. Immunostaining was performed using a biotin-streptavidin-peroxidase system (LSAB+, Dako-Cytomation). After washing, samples were treated for 15 min with 0.1% 3,3′-DAB in buffer containing 0.05% H2O2. Slides were counterstained with Harris' hematoxylin and permanently mounted. Positive controls consisted of femoral artery and myocardium. Specificity of the staining was determined by incubation of sections in the absence of the primary antibody or by preincubation with an excess of antigen peptide.
For double immunofluorescence, slides were incubated for 18 hr at 4C with a mix of rabbit anti-ET-1 antiserum and mouse monoclonal anti-TH antibody diluted in PBS-1% BSA, washed twice with PBS, pH 7.4, 0.05% Tween-20, and finally with PBS, pH 7.4. Sections were exposed to a 36-W conventional fluorescent tube for 30 min at a 10-cm distance to reduce tissue autofluorescence, as previously described by Neumann and Gabel (2002). All steps following photobleaching were done in the dark. Slides were sequentially incubated with anti-rabbit fluorescein-conjugated IgG and anti-mouse rhodamine-conjugated IgG secondary antibodies for 1 hr. After incubation, excess antibody was washed three times with PBS. Finally, preparations were mounted with VectaShield (H-1000; Vector Laboratories, Burlingame, CA) and dried for 2 hr. Immunostained sections were photographed with a Nikon DXM1200 CCD camera coupled to a Nikon Eclipse E400 microscope (Nikon Corp.; Tokyo, Japan) using a X40 objective.
IHC Image Analysis
Immunostained sections were photographed with a Nikon CoolPix 4500 (Nikon; Belmont, CA) camera coupled to a Zeiss Axiolmager AX.10 microscope (Carl Zeiss; Peabody, MA) using a × 100 objective with a 0.14 μm/pixel resolution. The luminance of the incident light was calibrated for each section to assign pixel values from 0 (no light transmission) to 255 (full light transmission). Thirty six fields corresponding to four CBs were photographed for ETA-R or ETB-R IHC in each experimental group. A total of 72 fields were analyzed for each marker. All images were centered in a cluster of 6-10 glomus cells, identified according to morphological features and TH immunoreactivity. Images were loaded into the Image J software (version 1.34s, National Institutes of Health) for analysis. The glomus cell clusters were manually delineated and extracted from the surrounding tissue to a separate image file, saved in tiff format. The mean area of the clusters was 2594 ± 8 μm2 and was not statistically different among all conditions (p>0.05, Kruskal-Wallis test, for individual values see Table 2). ETA-R and ETB-R immunoreactivity signal was extracted from the images with a color deconvolution algorithm (Ruifrok and Johnston 2001), integrated in the ImageJ software. Because sample areas were similar among experimental conditions and markers, we quantified the mean positive signal intensity with the Image Pro-Plus 4.5 software (Media Cybernetics; Silver Spring, MD). After conversion of pixel luminosity values to an OD scale, the integrated optical density (IOD) was measured in the previously extracted positive staining images and normalized by the glomus cells cluster area in each microphotograph. The signal intensity (I) was calculated as I = 10·ΣGOD/A in dB/μm2, ΣGOD is the IOD and A is the area of positive staining (μm2). The mean value of 36 fields was calculated to represent the area of positive ETA-R and ETB-R immunoreactivity signal intensity for each experimental group. A total of 144 images were analyzed.
Statistical Analysis
Results were expressed as means ± SEM. Statistical difference between two groups was assessed with the Mann-Whitney test. The level of statistical significance was p<0.05.
Results
Western Blot
ETA-R and ETB-R were detected as single bands of ∼49 kDa and ∼47 kDa, respectively, in the CB homogenates (Figure 1A). Densitometric analysis showed that CIH did not change ETA-R expression (1.14 ± 0.19-fold; Figure 1B, left panel). In contrast, CIH increased the ETB-R by 2.05 ± 0.33-fold (p<0.05; Figure 1B, right panel). Positive lung controls showed a single ∼50-kDa band for ETA-R (Figure 1C, Lane 1) and two bands (∼57 kDa and ∼50 kDa) for ETB-R (Figure 1C, Lane 3). Preincubation with excess blocking peptide eliminated all bands (Figure 1C, Lanes 2 and 4).
Immunohistochemistry image analysis
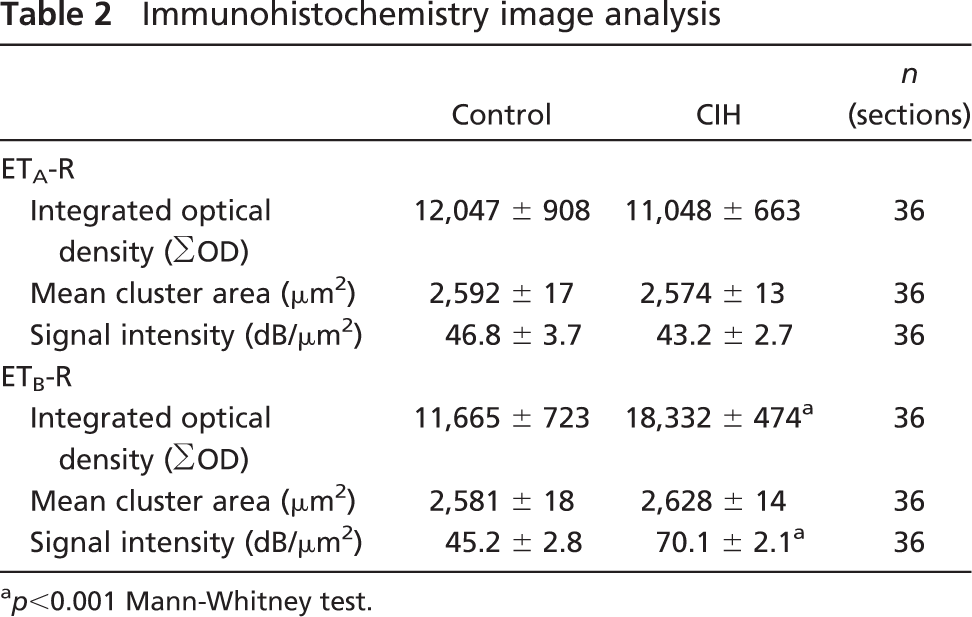
p<0.001 Mann-Whitney test.
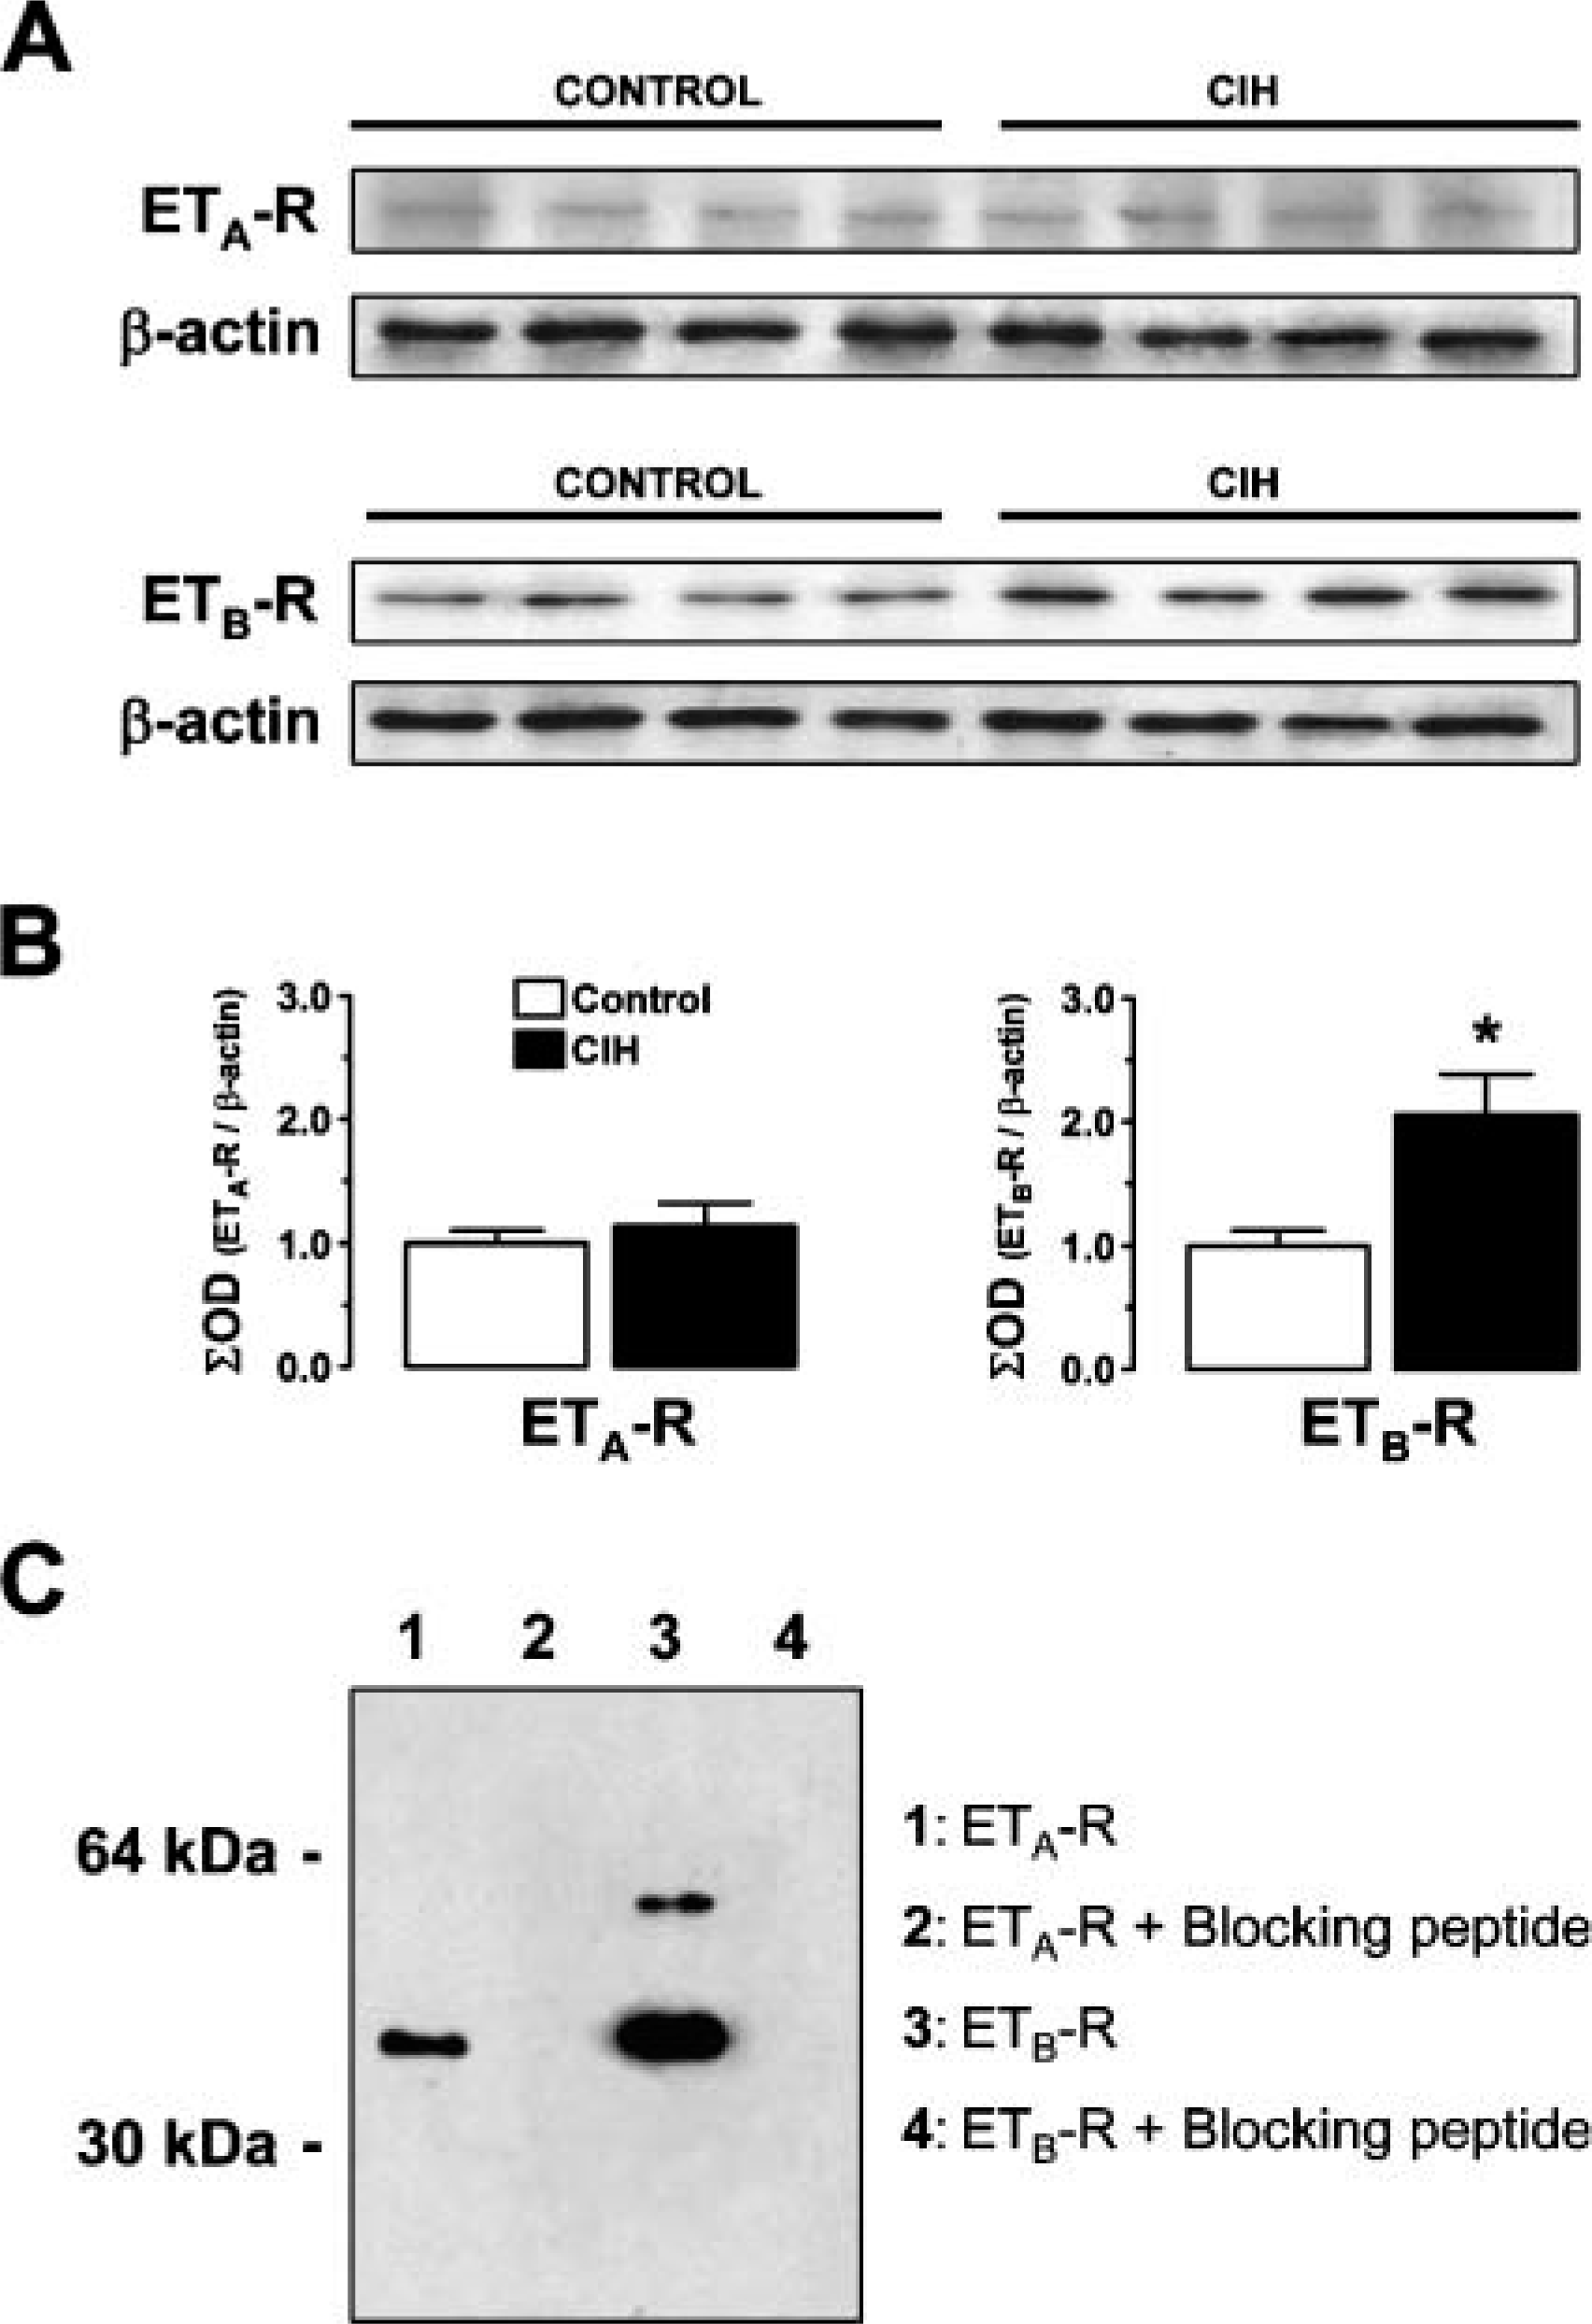
Analysis of endothelin (ET) receptor types A and B (ETA-R and ETB-R) protein expression in the carotid body (CB). Homogenates from individual CBs from control and chronic intermittent hypoxia (CIH)-treated cats (n=4, both groups) were resolved by SDS-PAGE. Each lane represents a single CB. (
ET Receptor IHC
ETA-R and ETB-R staining were found in both control and CIH-treated CBs. ETA-R immunoreactivity was localized in the cytoplasm of TH-positive cells, corresponding to glomus cells (Figure 2A and inset). Perilobular vessels in the CB parenchyma did not show ETA-R immunoreactivity (Figure 2A). However, peripheral sections of the CB corresponding to the vascular pole showed intense ETA-R immunoreactivity in the endothelium and tunica media of arterioles and venules (Figure 2B). ETB-R staining was ubiquitously found in the cytoplasm of glomus cells and the endothelium of capillaries located in the interlobular space within the parenchyma (Figures 2C and 2D). The tunica media of arterioles and venules was also positive for ETB-R staining in the CB vascular pole (Figure 2E). Digital analysis of the signal intensity of ETA-R in glomus cells did not show differences between control and CIH-treated CBs (0.92 ± 0.06-fold). However, the ETB-R signal intensity increased in the glomus cells of the CIH-treated group (1.58 ± 0.05-fold, p<0.001, Figure 2D) as compared with the signal intensity found in glomus cell clusters from control CBs (Figure 2C). Table 2 summarizes the quantification for ETA-R and ETB-R immunoreactivity in both groups. We did not detect any qualitative difference in staining intensity of ETA-R and ETB-R within the blood vessels when we compared CBs from control and CIH-treated cats. Samples incubated with primary antibodies preadsorbed with an excess of control antigen did not show immunostaining for ETA-R (Figure 2F) or ETB-R (Figure 2G).
Double Immunofluorescence for ET-1 and TH
ET-1 immunoreactivity was found in both the parenchyma (Figure 3A) and blood vessels of the CB vascular pole (Figure 3D). In contrast, TH-positive glomus cells were mostly found in the CB parenchyma (Figure 3B) and only occasionally observed in the CB vascular pole (Figure 3E). Double-positive staining for ET-1 and TH was abundant within the cell clusters located in the CB parenchyma (Figure 3C) and scarce in the peripheral zones close to the vascular pole (Figure 3F). Positive femoral artery controls showed an intense green fluorescence for ET-1 in the endothelium and tunica media of the vessel (not shown). Samples incubated without the primary antibody were devoid of fluorescein and rhodamine fluorescence (not shown). We did not notice any qualitative difference in the localization of ET-1 and TH immunoreactivity when we compared CBs from control and CIH-treated cats.
Discussion
Our results extend previous observations regarding the immunolocalization of ETs, ETA-R, and ETB-R in the normoxic cat CB and provide new information on the effects of CIH. Present IHC and Western blot data show that both normoxic and CIH-treated CBs express ETA-R and ETB-R. However, early exposure to CIH selectively increased the expression of ETB-R in glomus cells, whereas ETA-R levels remained unchanged. In addition, we found that ET-1 immunoreactivity was widely distributed in normoxic and CIH-exposed CBs. Double immunofluorescence for ET-1 and TH showed that the central parenchyma of the cat CB presents abundant immunoreactive ET-1 and TH-positive cells, indicating that cat glomus cells express ET peptides in normoxia and after CIH exposure. In addition, ET-1 immunoreactivity was found in blood vessels of the CB vascular pole, suggesting that ET-1 plays a relevant role in the regulation of the CB vascular tone (see Rey and Iturriaga 2004).
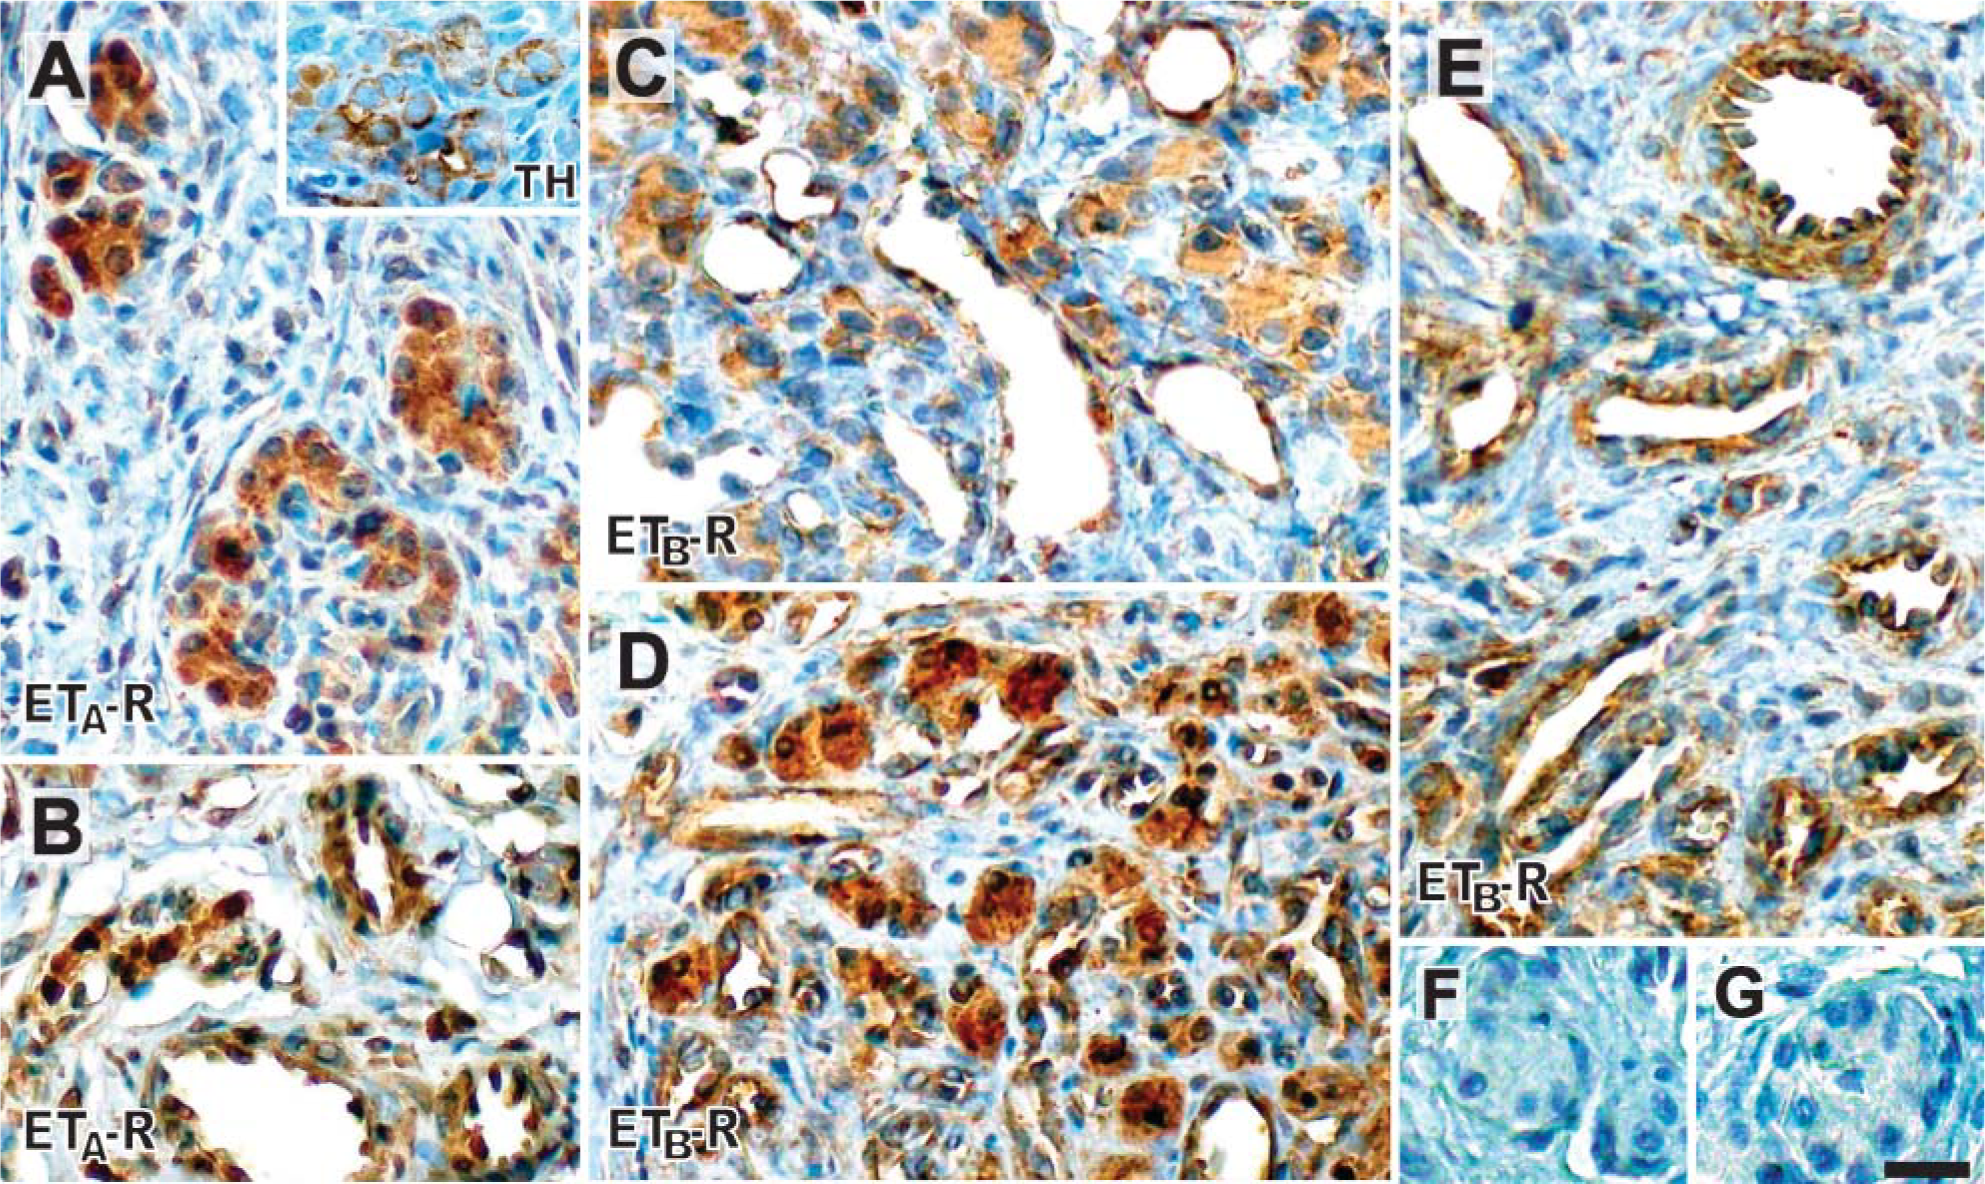
Immunohistochemistry of ET receptors in the CB. ETA-R immunoreactivity is located in cells within the CB lobules (
It is known that sustained hypoxia upregulates ET-1 expression in the rat CB (Chen et al. 2002a,b). Moreover, Chen et al. (2002a) found that sustained hypoxia enhances rat CB chemosensory responses to acute hypoxia in a time-dependent manner. The enhanced chemosensory response to hypoxia was reversed by BQ-123, an ETA-R antagonist, and was associated with increased ETA-R and ET-1 expression in the CB. Another study found similar effects of sustained hypoxia on ETA-R and ET-1 expression, which were attributed to potentiation of the ET-1-induced intracellular Ca2+ increase in hypoxic glomus cells (Chen et al. 2002b). Thus, the available information indicates that ET-1 and ETA-R are upregulated in the CB exposed to chronic sustained hypoxia. To our knowledge, there is a lack of information regarding the expression and localization of ETB-R in the normoxic and chronic hypoxic CB. Western blot analysis showed that ETB-R was expressed in the normoxic CB and after 4-day exposure to CIH, a stimulus that increases ET-1 expression by ∼10-fold in the cat CB (Rey et al. 2006b). IHC analysis confirmed that ETB-R is expressed in CB glomus cells and blood vessels. Thus, in addition to the already reported expression of ETA-R in the CB (Chen et al. 2002a,b), ETB-R is also expressed in glomus cells. Western blot analysis showed a selective upregulation of ETB-R in the CBs exposed to CIH, without changing the ETA-R expression. This observation was confirmed by the IHC image analysis performed in glomus cells. We restricted the IHC image analysis to glomus cell clusters because analysis of vascular elements demands numerous sections from several animals to assess a significant number of each blood vessel type. Accordingly, we cannot preclude the possibility that CIH may also increase ETB-R expression in CB blood vessels. In a previous report, Prabhakar (2001) compared the response of PC12 cells transcriptome to chronic sustained and intermittent hypoxia using microarrays and found that the ETB-R mRNA was selectively upregulated by CIH. Similar to glomus cells, pheochromocytome PC12 cells present an oxygen-sensing phenotype (Thompson et al. 1997) and therefore are capable of catecholamine secretion in response to hypoxia (Taylor and Peers 1998). Thus, PC-12 cells are a suitable model for studying oxygen-sensing mechanisms. A recent study by Kim et al. (2004) showed that CIH potentiates PC12 cells catecholamine release in response to acute hypoxia. Interestingly, Gardner et al. (2005) found that ATP release induced by high extracellular potassium was inhibited dose-dependently by sarafotoxin 6c, an ETB-R agonist. Moreover, this effect was reversed by ETB-R but not by ETA-R blockade. It is worth mentioning that ATP seems to be an excitatory neurotransmitter in the hypoxic response of the mammalian CB (Iturriaga and Alcayaga 2004).
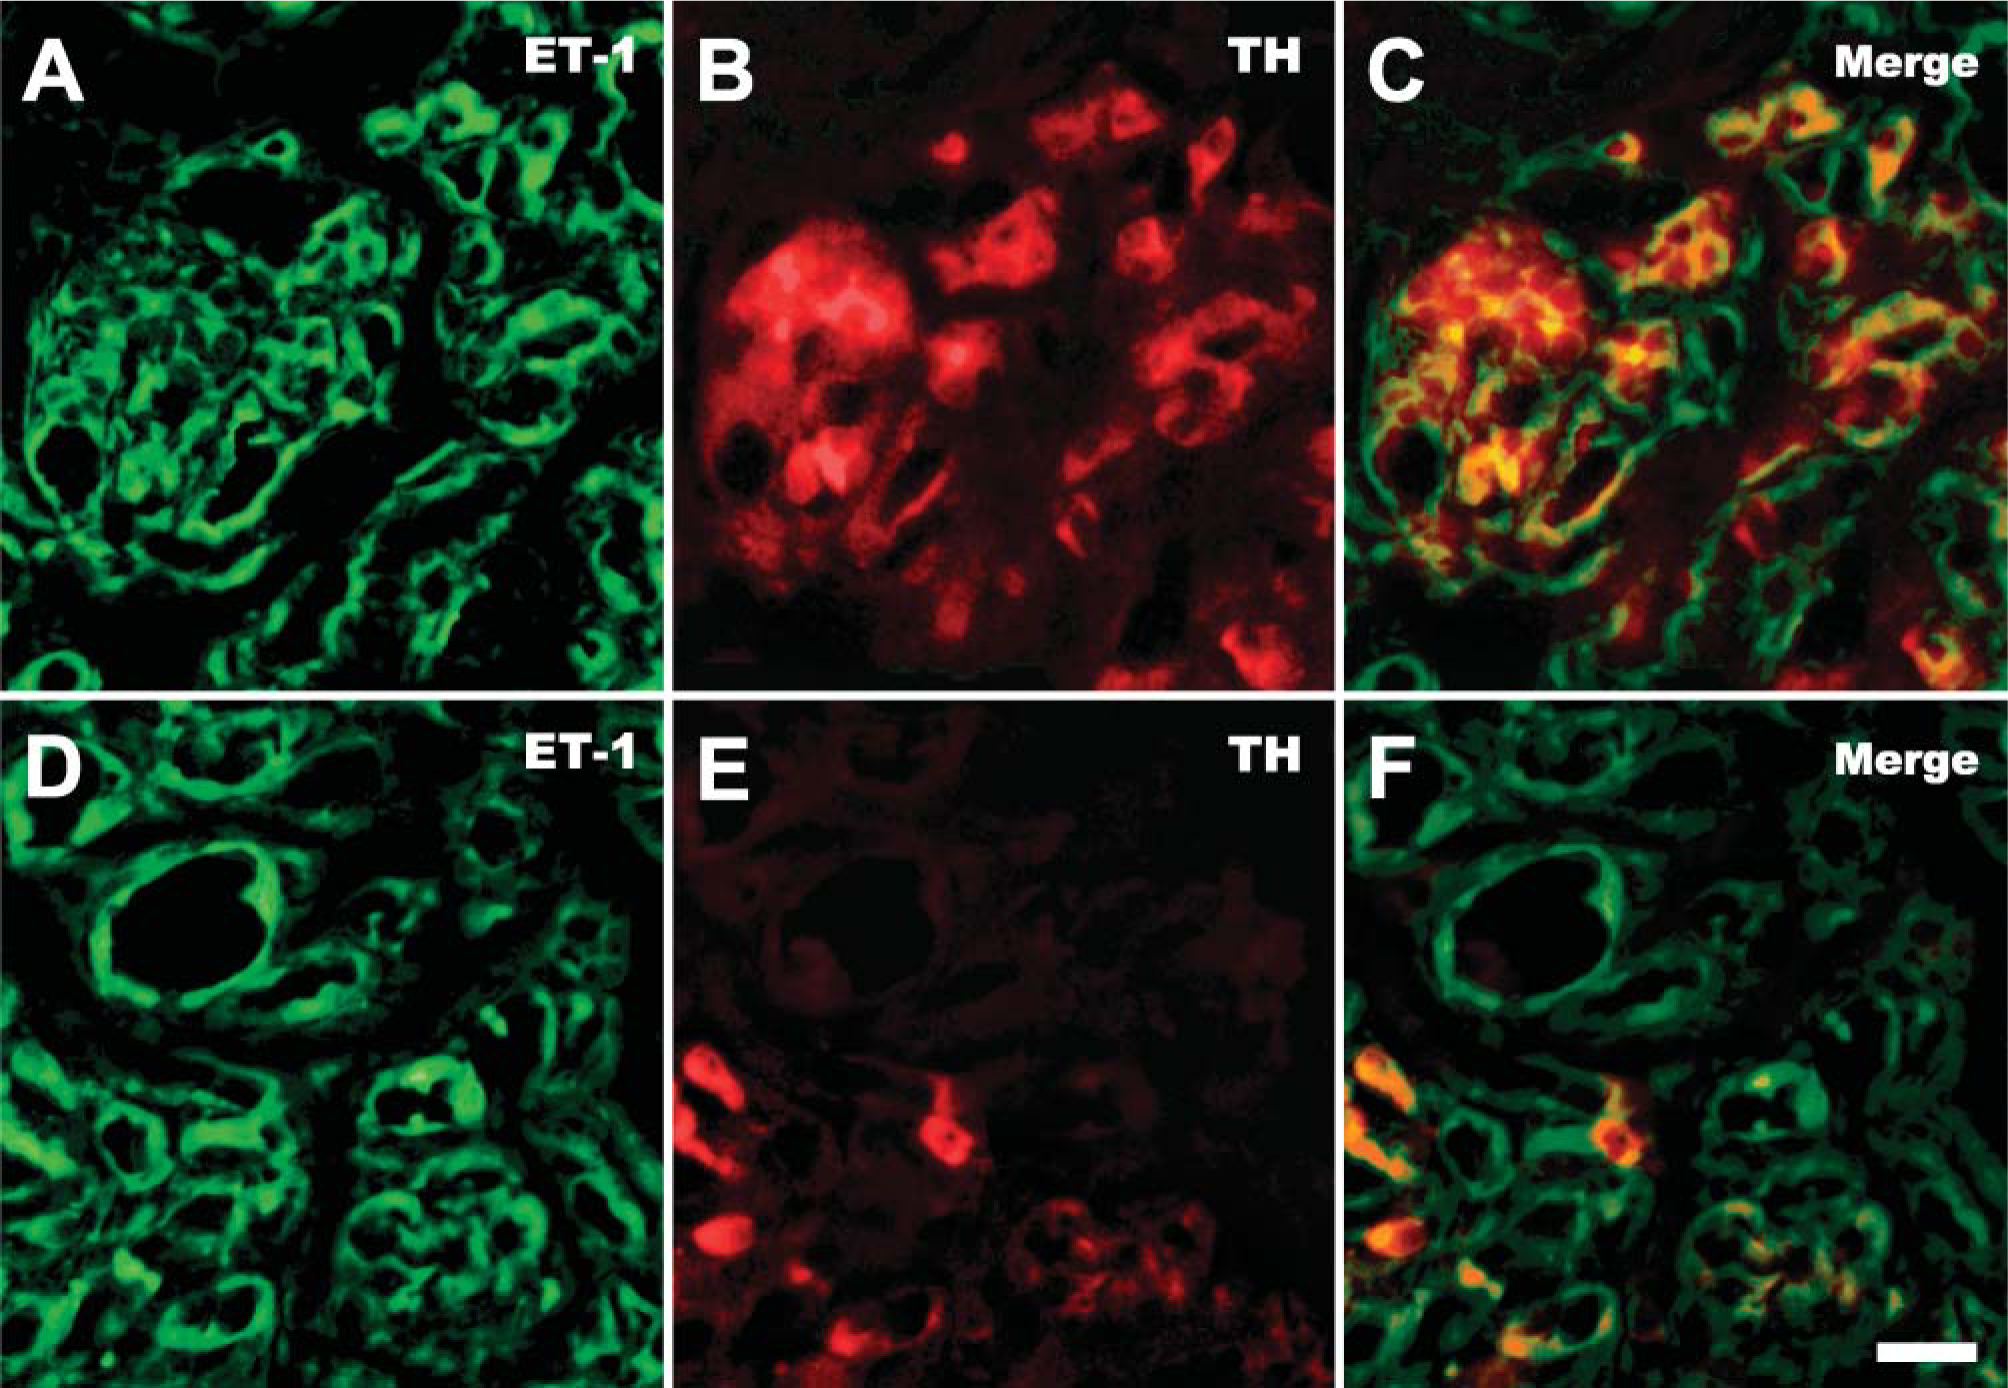
Double-labeling immunofluorescence of the CB for ET-1 (green fluorescence) and the glomus cell marker TH (red fluorescence). Central sections through the CB parenchyma showed both ET-1 and TH fluorescence, and double ET-1 and TH-positive cells were found inside the CB lobules (
We previously reported that ET-1 expression is locally upregulated in the cat CB exposed to CIH for 4 days. Moreover, ET-1 contributes to the CIH-induced enhanced chemosensory responses, acting through ETAR and/or ETB-R (Rey et al. 2006b). Previous studies failed to show any effect of ETB-R blockade on the ET-1-induced intracellular Ca2+ increase in rat glomus cells (Chen et al. 2002b) and in the ET-1-mediated potentiation of the chemosensory response to acute hypoxia (Chen et al. 2000), suggesting that the excitatory effects of ET-1 are mainly mediated by ETA-R activation. In addition, pharmacological studies in the rat CB showed that ET-1 activates ETA-R, increasing the levels of cAMP and IP3. Meanwhile, ETB-R activation does not modify the increases of these messengers (Chen et al. 2000). However, these findings cannot preclude a physiological role for ETB-R in the CB. Indeed, expression of ETB-R in the blood vessels, endothelium, and glomus cells of the CB, together with the observation that CIH selectively upregulates this receptor, suggests that ETB-R is involved in the CB responses to CIH. It is known that ETB-R increases nitric oxide (NO) synthesis through endothelial NO synthase upregulation (Rubanyi and Polokoff 1994). Thus, activation of ETB-R may have an inhibitory effect on chemosensory discharges because NO is a tonic inhibitory modulator of CB chemoreception (Valdes et al. 2003). Therefore, ETB-R upregulation in the CIH-exposed CB may be a compensatory inhibitory mechanism by increasing the NO synthesis and counteracting the chemoexcitatory effect of ET-1. ET-1 increases basal CB chemosensory discharges, mainly due to its vasoconstrictor action, because exogenous application of ET-1 to the CB increases the chemosensory discharge in the vascularly perfused preparation. However, it is ineffective on the CB superfused preparation, known to be devoid of vascular control (Rey et al. 2006a). Thus, it is possible that ET-1 regulates CB blood flow through the activation of ETA-R and ETB-R. Nevertheless, these two receptors may have opposite effects on blood flow because it has been previously shown that ETA-R produces vasoconstriction in other tissues (Yanagisawa et al. 1988), whereas ETB-R induces vasodilation through NO release from the endothelium (Hirata et al. 1993).
ET-1 and TH-positive cells were found in the central parenchyma of the cat CB, confirming previous IHC observations showing that ET-1 is expressed in the glomus cells and blood vessels (Rey et al. 2006a,b). However, Ozaka et al. (1997) did not find ET-1 immunoreactivity in glomus cells of the rat CB. In addition, we found that double-positive ET-1/TH immunofluorescence was uncommon in CB histological sections passing through the peripheral vascular pole. In fact, these areas showed mostly ET-1 immunofluorescence, indicating that ET-1 expression is abundant in the cat CB vascular elements. We did not notice differences in the tissue distribution of ET-1 and TH between control and CIH-treated CBs.
In summary, present results indicate that ETA-R and ETB-R are expressed in the glomus cells of the CB parenchyma. ETA-R is found in the blood vessels of the vascular pole, whereas ETB-R is expressed in the endothelium and blood vessels of the CB parenchyma and vascular pole. Our results show that ET-1 is ubiquitously distributed in the CB blood vessels and endothelium, but it is also expressed in glomus cells as shown by ET-1 and TH-positive double immunofluorescence. A novel finding from this study is that CIH selectively upregulates ETB-R expression in glomus cells, in contrast to sustained hypoxia-induced ETA-R upregulation. We propose that the enhanced expression of the ET system by CIH contributes to the potentiation of the CB hypoxic chemosensory responses mostly through modulation of CB blood flow, but we cannot preclude direct effects of ET-1 on glomus cells. Thus, the interaction between ET-1, ETA-R, and ETB-R activation may contribute to the enhanced CB hypoxic chemosensory response after exposure to CIH through regulation of local CB blood flow and glomus cell excitability.
Footnotes
Acknowledgements
This work was supported by grants 1030330 and 1050707 from the National Fund for Scientific and Technological Development of Chile (FONDECYT).
We are indebted to Dr. Aquiles Jara from the Department of Nephrology, P. Universidad Catolica de Chile for supplying the ET-1 antibody.