
Abstract
Microarrays have been used to simultaneously monitor the expression of thousands of genes from biological samples, an approach that can potentially uncover previously unrecognized functions of genes. Microarray analyses can rarely be conducted retrospectively because of the requirement for RNA to be obtained from fresh or unfixed frozen tissues. Archived pathology specimens would need to be used for retrospective analyses, and these are typically preserved as formalin-fixed, paraffin-embedded (FFPE) tissue. Formalin-fixed tissues have been shown to yield compromised RNA compared with that obtained from frozen tissue. To begin to assess the performance of RNA extracted from FFPE samples on a microarray format, we compared RNA from a model system of pelleted lipopolysaccharidestimulated human bone marrow stromal cells that were snap frozen with RNA from FFPE cells. RNA integrity and Affymetrix quality control parameters were assessed, and differentially regulated genes were analyzed with Ingenuity Pathway Analysis software. Results demonstrate that both snap-frozen and FFPE samples yielded intact RNA suitable for amplification prior to Affymetrix GeneChip analysis. Although some transcriptional information was lost with RNA extracted from the FFPE samples, Ingenuity Pathway Analysis revealed that the major pathways identified as affected by drug treatment were similar. Results show that FFPE samples are amenable to Affymetrix GeneChip analysis, expanding the possibility for expression profiling on archived tissue blocks in pathology laboratories.
M
Gene expression analyses in FFPE tissues have been largely limited to in situ hybridization or PCR analyses of RNA (Ben-Ezra et al. 1991; Nouri Aria et al. 1993; Goldsworthy et al. 1999; Hayden et al. 2001; Lewis et al. 2001; Macabeo-Ong et al. 2001; Qian et al. 2001). Although informative, conventional PCR and in situ hybridization typically evaluate gene expression of only a few genes simultaneously. Although more expanded gene expression analyses of RNA extracted from FFPE tissue have been reported using multiplex real-time (RT) PCR and multiplex oligonucleotide bead arrays (Bibikova et al. 2004a,b; Tothill et al. 2005; Steg et al. 2006), there have been few reports of microarray analyses of RNA extracted from FFPE tissue. Gene expression has been profiled in FFPE gastric carcinoma samples using a cDNA microarray, and it was stated that expression data for fixed and unfixed tissues were comparable although comparative data were not presented (Lee et al. 2005). In another study, Affymetrix GeneChip analyses (Affymetrix; Santa Clara, CA) was performed using RNA extracted from FFPE samples, and it was shown that uveal melanoma samples clustered into two distinct molecular classes can be used to predict metastasis (Onken et al. 2004). Although these results would support the use of RNA extracted from FFPE samples for expression profiling without comparable data from unfixed tissue samples, the amount of information lost due to fixation and embedding cannot be assessed.
To date, there have been no studies that directly compare RNA extracted from FFPE with unfixed snap-frozen tissue samples on a microarray platform. To begin to understand the effects of fixation and embedding procedures on gene expression profiles, we chose to use a model system of primary human bone marrow stromal cell pellets, a preparation that would minimize cellular heterogeneity between samples. To affect a dynamic range of gene expression, particularly cytokine expression (Manthey et al. 1998; Nick et al. 1999), cells were stimulated with lipopolysaccharides (LPS) in the presence or absence of a small molecule p38 inhibitor. Quantity and quality of cellular RNA extracted from unfixed snap-frozen and FFPE cell pellets were compared as well as expression profiles obtained using the Affymetrix GeneChip platform. Veracity of microarray data was confirmed using TaqMan (Applied Biosystems; Foster City, CA) analysis of selected regulated genes.
Materials and Methods
Cell Culture Conditions and Drug Treatment
Primary human bone marrow stromal cells (BioWhittaker; Walkersville, MD) were plated to confluency and maintained in MyeloCult media (Stem Cell Technologies; Vancouver, BC) and supplemented with hydrocortisone to a final concentration of 1 μM. Cells were allowed to adhere overnight and were pretreated with a p38 inhibitor for 1 hr before addition of LPS. LPS (200 ng/ml; Sigma, St Louis MO) was added for 6 hr in the presence of inhibitor. Untreated cells in media containing vehicle alone (0.1% DMSO) were analyzed in parallel. SB-203580 (10 μM; Sigma) was used as an inhibitor of p38 MAP kinase.
Stromal Cell Pellet Processing
Cells were trypsinized with 0.25% trypsin, 0.1% EDTA for 5 min, washed in PBS, then pelleted. Pellets were either embedded in optimal cutting temperature (TissueTek OCT; Sakura Finetek, Torrance, CA), snap frozen in liquid nitrogen, and stored at −80C or resuspended in 10% neutral-buffered formalin and fixed for 18 to 24 hr at room temperature. Formalin-fixed cell suspensions were centrifuged, fixative decanted, washed in PBS, and then re-centrifuged, and PBS was decanted from the tube. To optimize sectioning and recovery of cells during paraffin processing, a specimen-processing gel (HistoGel; Richard-Allan Scientific, Kalamazoo, MI) was warmed in a microwave oven for 10 to 15 sec until reaching a liquid state. Approximately 500 μl of the gel was dispensed and added to the cell pellet. The gel was allowed to cool at room temperature. The embedded cell pellet was removed from the tube and placed in a cassette for paraffin processing. Cell pellets were processed on a VIP Tissue Processor (Sakura Finetek) and embedded in paraffin. Cell pellets were excised from OCT and paraffin with a clean diethylpyrocarbonate-treated scalpel and collected into RNase-free tubes. Excised cell pellets were used for RNA isolation.
RNA Isolation, Quantitation, and Quality Assessment
RNA was isolated from frozen OCT-embedded cryosections using the Absolutely RNA Microprep Kit (Stratagene; La Jolla, CA) according to manufacturer's instructions. RNA was isolated from the FFPE cell pellet using a modified version of the Optimum RNA Isolation Kit (Ambion). Modifications to the manufacturer's protocol included an overnight incubation in double the recommended volume of proteinase K working solution, incubation at 75C for 10 min prior to the addition of RNA extraction buffer, and double the recommended volume of RNA extraction buffer, alcohol, and wash solutions. Modifications were necessary to melt and/or dilute the HistoGel (Richard-Allan Scientific) contained within the sample. Following RNA isolation, both OCT and FFPE samples were concentrated into a volume of ~18 μl using the RNA Clean-up Kit-5 (Zymo Research; Orange, CA). The Ribogreen RNA Quantitation Kit (Invitrogen; Carlsbad, CA) was used to determine RNA yield, and RNA quality was assessed using the Agilent 2100 Bioanalyzer with the Pico LabChip Kit (Agilent Technologies; Palo Alto, CA) according to manufacturer's instructions.
cDNA Amplification, Microarray Hybridization, and Affymetrix GeneChip Analysis
Ten ng of total RNA was amplified and biotin labeled using a prototype of the whole transcriptome amplification (WTA) kit, WT-Ovation, according to manufacturer's instructions (NuGEN Technologies; San Carlos, CA). Following amplification and labeling/fragmentation, all samples were stored at −20C until use. The Nanodrop ND-1000 spectrophotometer (NanoDrop Technologies; Wilmington, DE) was used to determine the yield of amplified cDNA prior to and following biotinylation/fragmentation. Sample quality was assessed using the Agilent Bioanalyzer and the Nano LabChip Kit (Agilent Technologies). Hybridization cocktails were made according to the NuGEN Ovation Biotin User Guide using 3.7 μg of purified SPIA product (amplified single-stranded cDNA). SPIA Cocktails (3.4 μg) were hybridized onto HG-U133 Plus 2.0 Affymetrix GeneChips according to NuGEN specifications. Gene expression data was analyzed using Rosetta Resolver (Rosetta Biosoftware; Seattle, WA), and differentially regulated genes were identified. Probesets with fold changes of 1.5-fold or greater (p<0.00001) were considered differentially regulated. Effect of p38 inhibitor on LPS-stimulated gene expression is expressed as fold change compared with LPS stimulation in the absence of p38 inhibitor.
Real-time RT-PCR Analysis
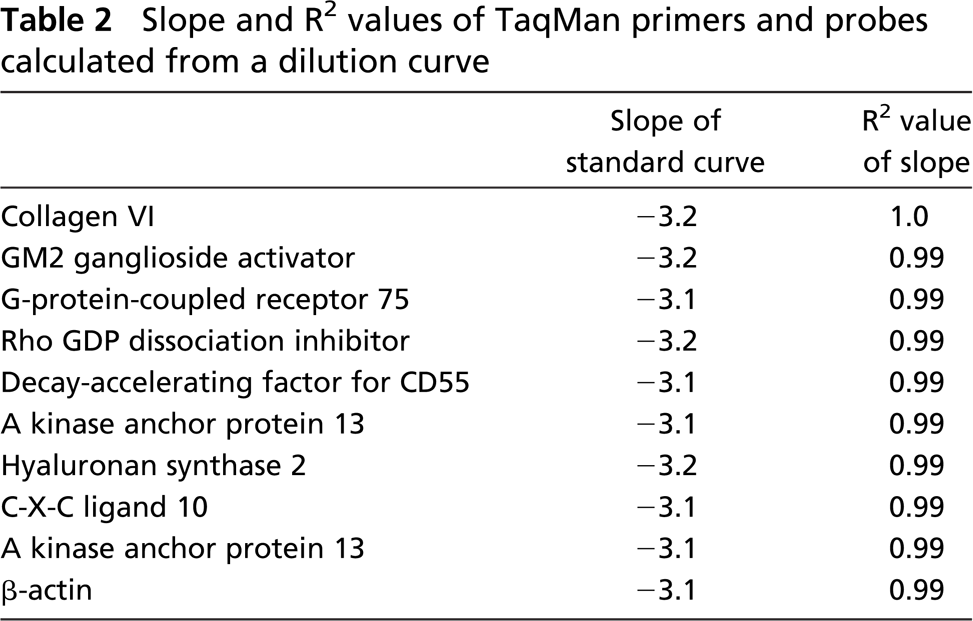
Primers and fluorogenic probes were designed from published cDNA sequences using Primer Express software (Applied Biosystems). Gene-specific primers and fluorogenic probes used for confirmatory TaqMan analysis were synthesized by Biosource (Camarillo, CA) and are listed in (Table 1). TaqMan PCR Core Reagent Kit was used for TaqMan realtime PCR to detect abundance of PCR products using WTA-amplified SPIA products as templates. Data were collected and analyzed on an ABI Prism 7900 Sequence Detection System (Applied Biosystems). Human bone marrow stromal cell cDNA was used to generate standard curves for each gene profiled, and the slopes and R2 values of the standard curves are presented in Table 2. Standard curves were generated for each gene, and transcript values were calculated relative to a dilution series of cDNA as described in User Bulletin #2, ABI Sequence Detection System (Applied Biosystems, November 21, 1997). Target quantities were normalized to 18S rRNA and calibrated using RNA from LPS-stimulated bone marrow stromal cells. All quantities were expressed as n-fold relative to the calibrator (LPS stimulation in absence of inhibitor).
Primer and fluorogenic probes utilized for real-time RT-PCR analysis
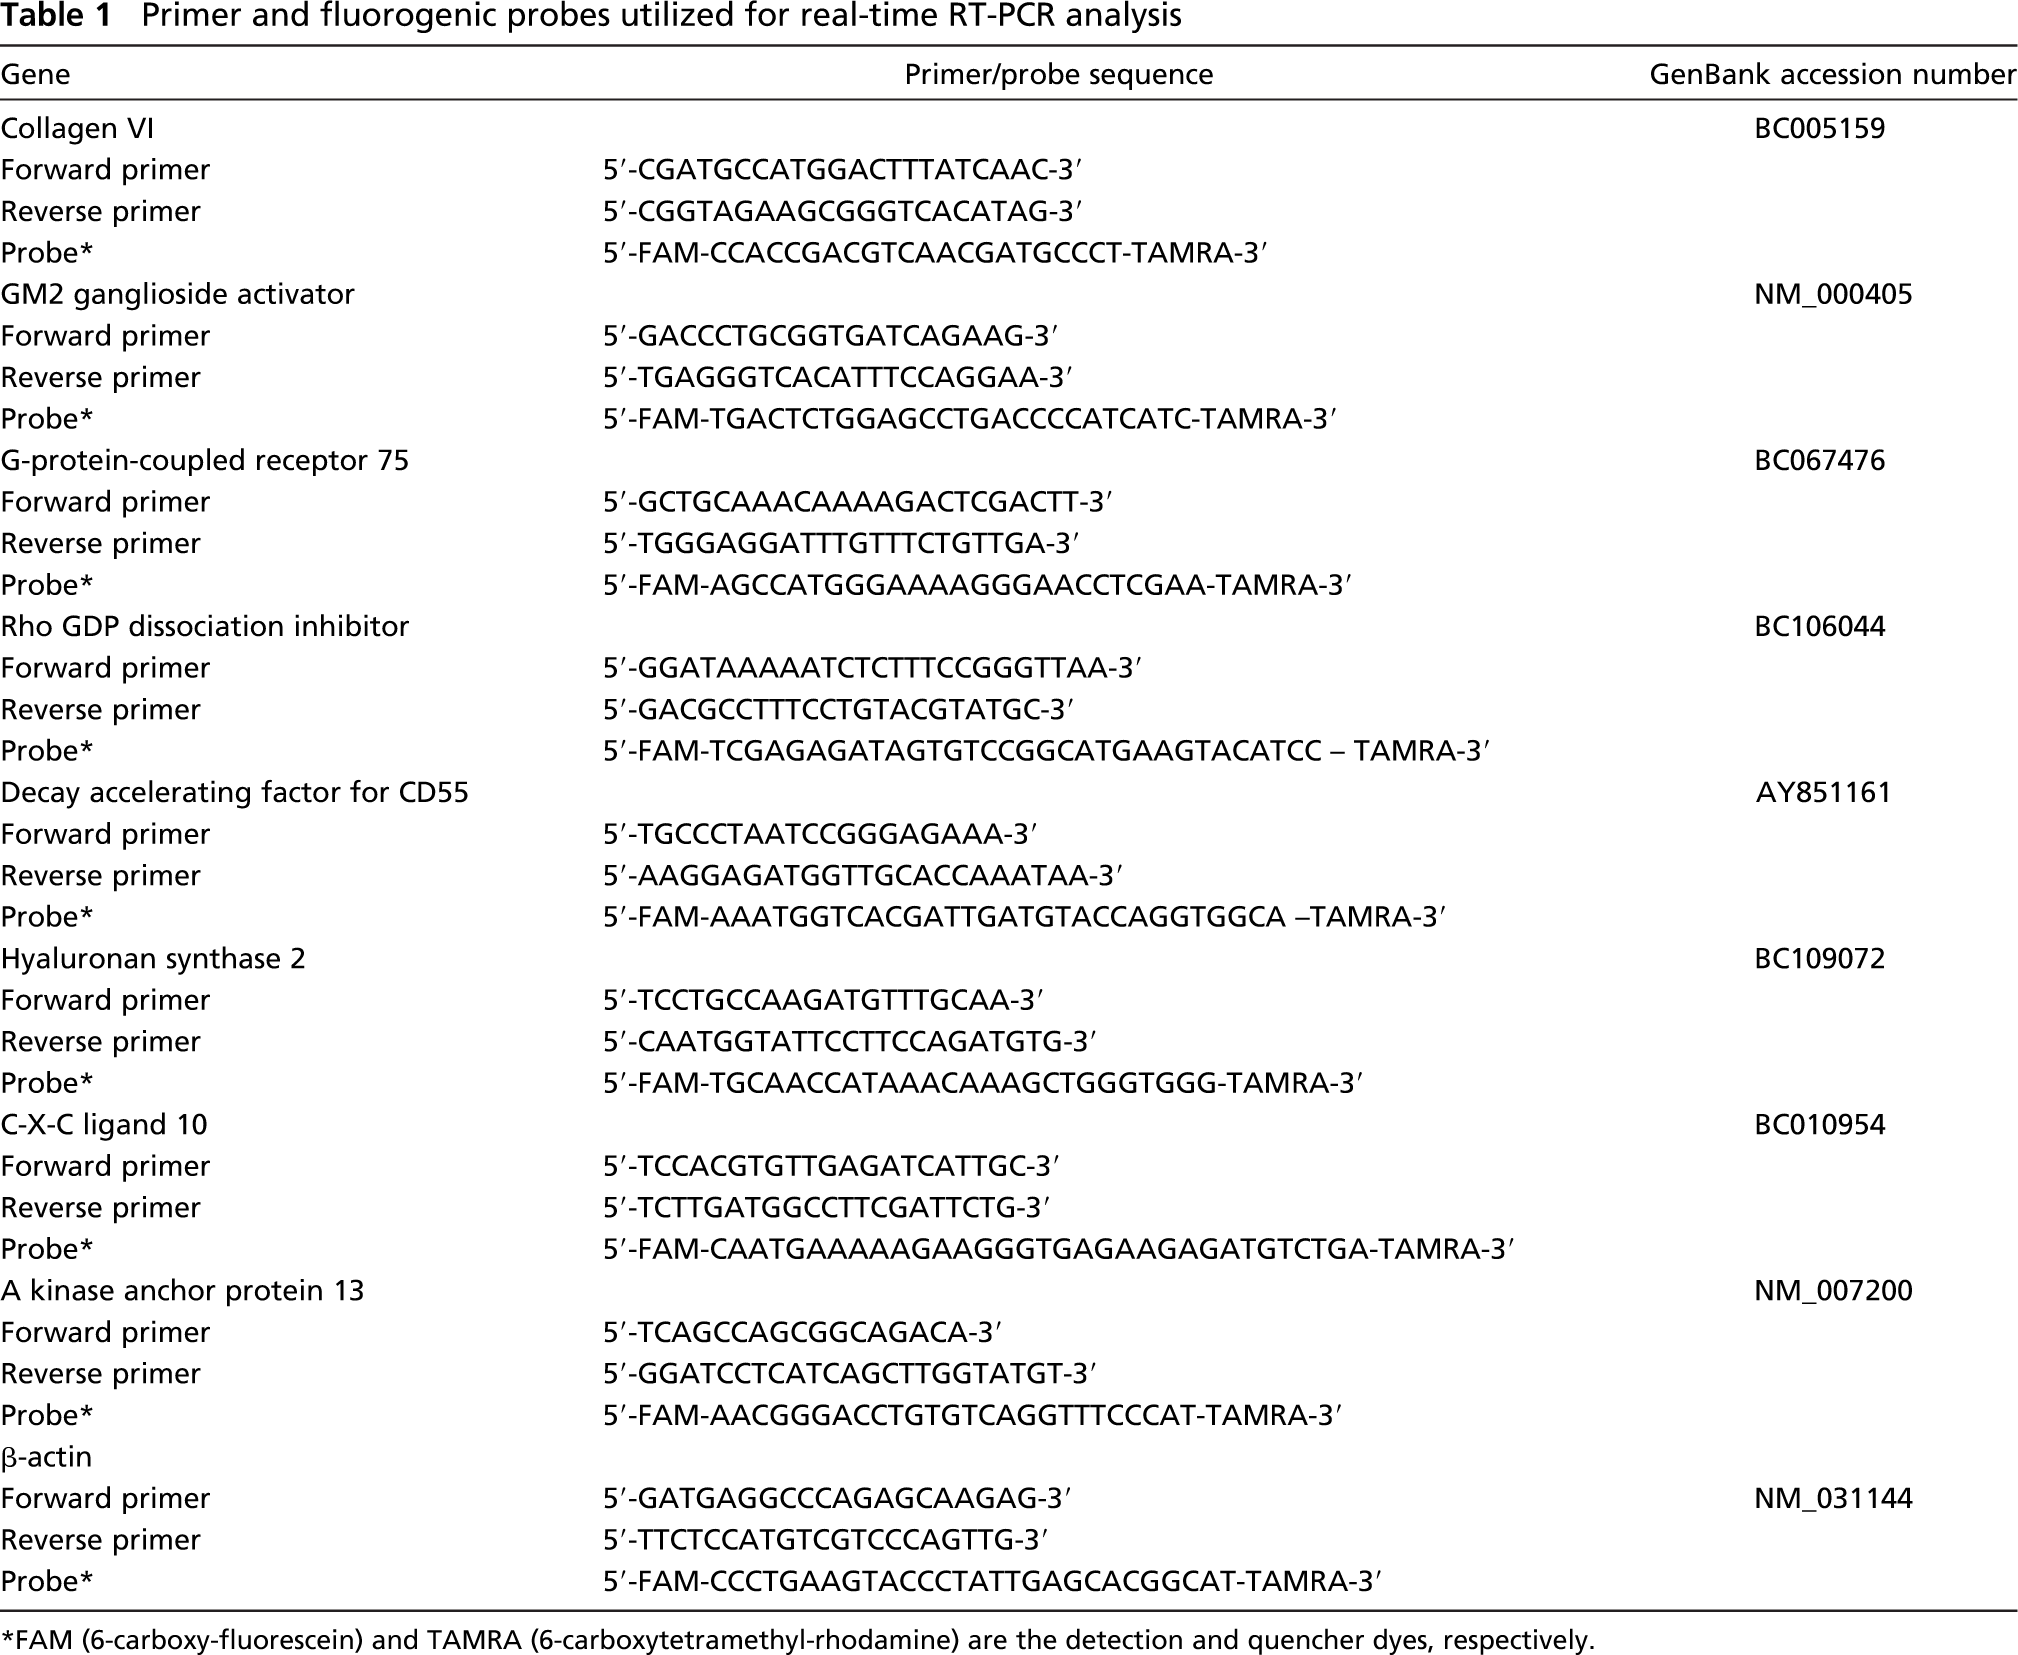
FAM (6-carboxy-fluorescein) and TAMRA (6-carboxytetramethyl-rhodamine) are the detection and quencher dyes, respectively.
Slope and R2 values of TaqMan primers and probes calculated from a dilution curve
Ingenuity Pathway Analysis
Differentially regulated genes identified in unfixed frozen and FFPE samples were analyzed using Ingenuity Pathways Analysis (Ingenuity Systems; Mountain View, CA). Analyses were conducted based on 1.5-fold up- or downregulated genes (p<0.00001). A data set containing gene identifiers and corresponding expression values were uploaded into the application. Each gene identifier was mapped to its corresponding gene object in the Ingenuity Pathways Knowledge Base (Ingenuity Systems). These genes, called Focus Genes, were overlaid onto a global molecular network developed from information contained in the Ingenuity Pathways Knowledge Base. Networks of these Focus Genes were then algorithmically generated based on their connectivity. Canonical pathway analysis identified the pathways from the Ingenuity Pathways Analysis library of canonical pathways that were most significant to the data set. Genes from the data set that met the 1.5-fold cutoff of p<0.00001 and were associated with a canonical pathway in the Ingenuity Pathways Knowledge Base were considered for the analysis.
Results
RNA Quantitation and Quality Assessment
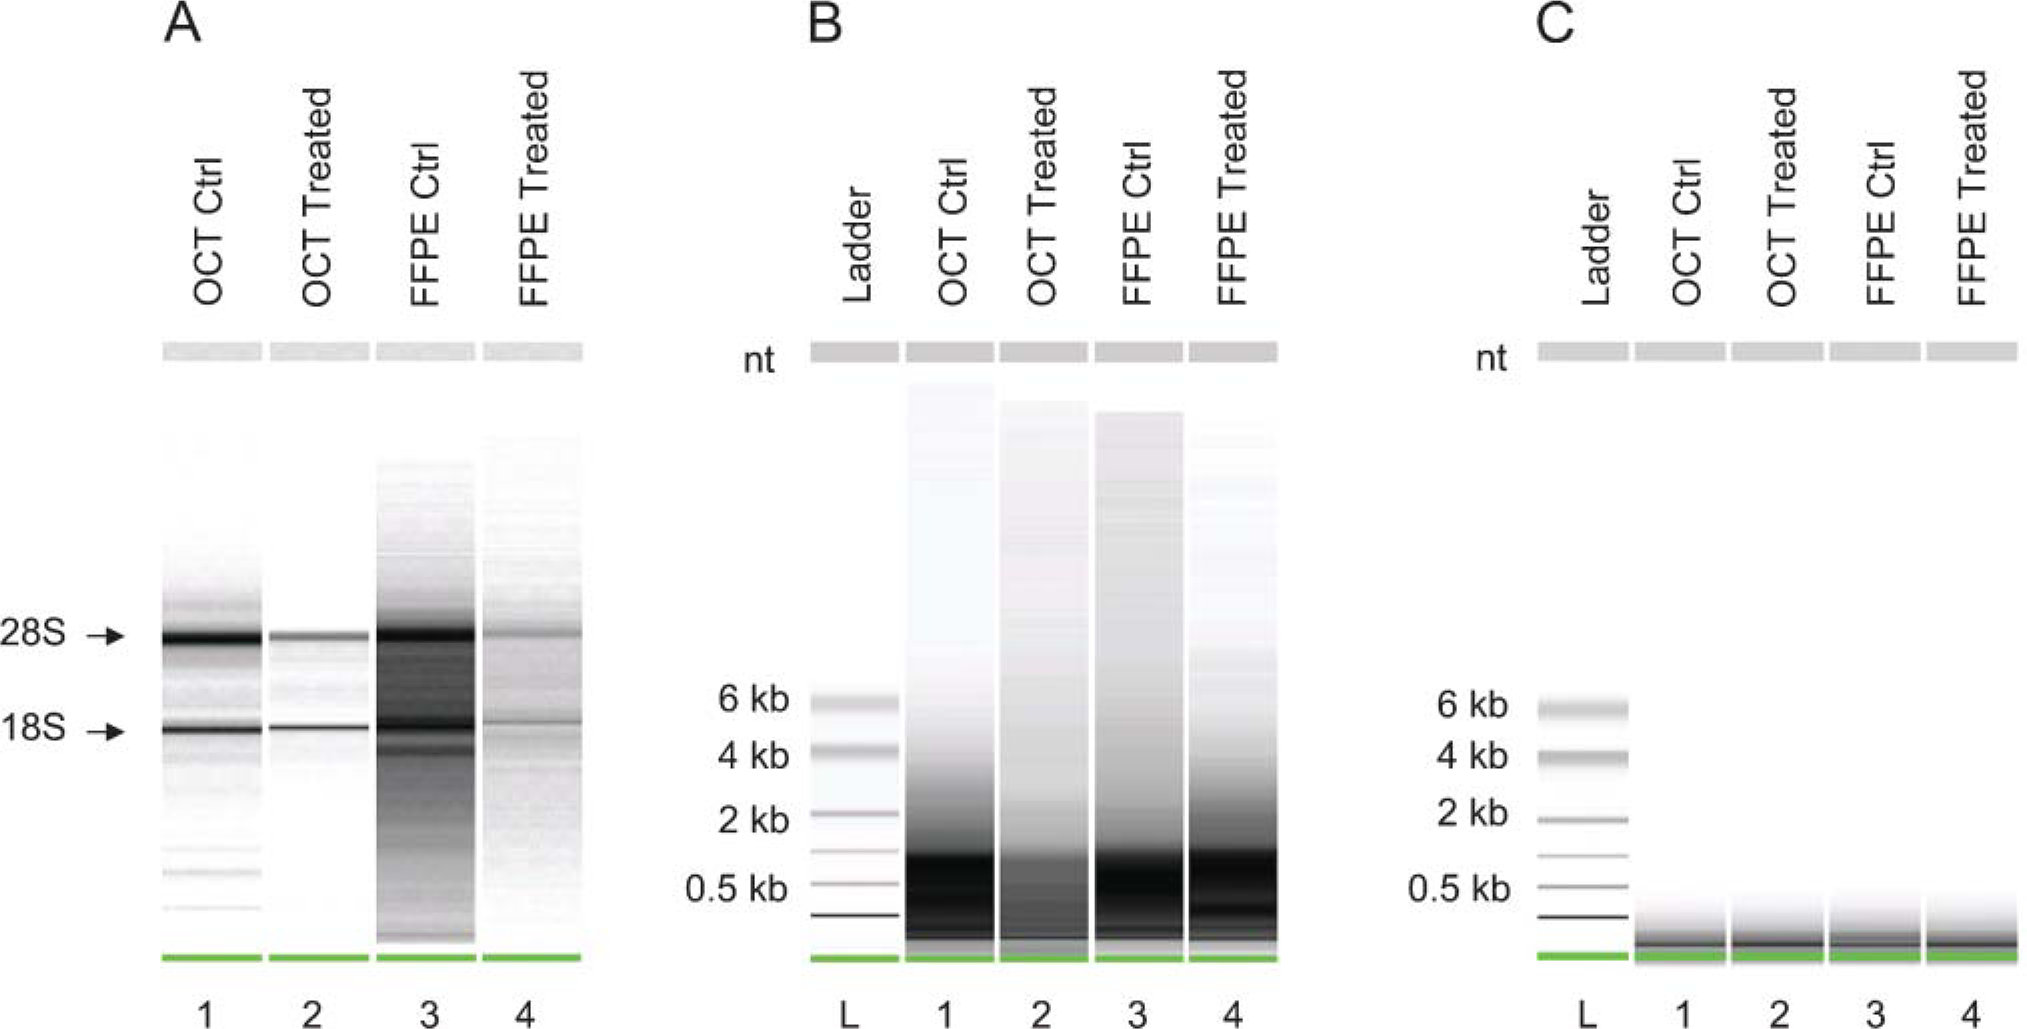
Treatment of the primary human bone marrow stromal cells with 10 μM SB-203580 had no effect on cell viability (data not shown). All FFPE and unfixed snap-frozen OCT-embedded samples yielded similar amounts of total RNA ranging from 200 to 400 ng. The Agilent bioanalyzer was run with 1 μl of total RNA, and the gel-like images demonstrated the quality of RNA (Figure 1A). RNA obtained from FFPE cell pellets fixed for 24 hr looked very similar to unfixed frozen OCT-embedded pellets. Although RNA extracted from FFPE pellets displayed clear 18S and 28S ribosomal bands indicating the presence of high molecular mass RNA, there was background smearing present between the 18S and 28S ribosomal bands and below the 18S ribosomal band. This smearing could be due to slight degradation in these samples. All WTA-amplified biotinylated products demonstrated a molecular size range from 100 to 1000 base pairs (bp), indicating that the snap-frozen and FFPE samples amplified similarly (Figure 1B). Fragmentation of the WTA-amplified SPIA biotinylated products were performed prior to hybridization to the Affymetrix GeneChips. Both snap-frozen and FFPE samples fragmented to ~80 bp (Figure 1C).
(
Affymetrix GeneChip Performance (Quality Control Metrics)
Affymetrix algorithms provide data from the GeneChip that include several measures of GeneChip performance. The average background is an estimate of non-specific binding. The β-actin and GAPDH 3î/5î ratios are designed to detect the 3î and 5î regions of the β-actin and GAPDH mRNA; the 3î/middle ratio looks at the mRNA transcript from the 3î to the middle of the mRNA transcript. These values give insight into the quality and integrity of the RNA. The scale factor is a metric inversely related to chip brightness. Percent present is a quality metric and is sensitive to RNA sampling, scanning, and data extraction. Quality control metrics from unfixed frozen and FFPE samples are presented in Table 3. The scale factor, background, and percent present are similar for both preparations. GAPDH 3î/5î and 3î/middle ratios were slightly higher for RNA extracted from FFPE pellets, suggesting that RNA quality was potentially compromised. The β-actin 3î/5î ratios were also slightly higher in the FFPE-treated sample when compared with the unfixed frozen-treated sample. The 3î/middle ratio was slightly higher in the FFPE control sample. These values for β-actin and GAPDH would indicate that the FFPE RNA, although showing intact 18S and 28S ribosomal bands, is potentially compromised when compared with the unfixed snap-frozen sample.
Regulated Genes From the Affymetrix GeneChip
Because the experimental design did not include technical or biological replicates, lists of differentially regulated genes were composed using a stringent p value (p≤0.00001) cutoff. The Affymetrix GeneChip system contains more than one oligonucleotide on the chip that provides a number of repeat experiments within a single chip to ensure the validity of hybridizations (Durier et al. 2003). Concordance between unfixed snap-frozen OCT-embedded and FFPE samples is presented using a Venn diagram (Figure 2). A total of 936 genes regulated by p38 (i.e., modulated by p38 inhibitor treatment, 1.5-fold change or greater, p≤0.00001) were detected using RNA from the unfixed frozen human stromal cell pellet in contrast to 390 genes from the FFPE cell pellet (1.5-fold change or greater, p≤0.00001). Of the genes identified in the unfixed snap-frozen cell pellet, 252/936 (23%) were common to both snap-frozen and FFPE preparations, whereas 62% (518/936) were unique to the snap-frozen preparation. Of the regulated genes identified, 138/936 (15%) were seen only in the FFPE sample.
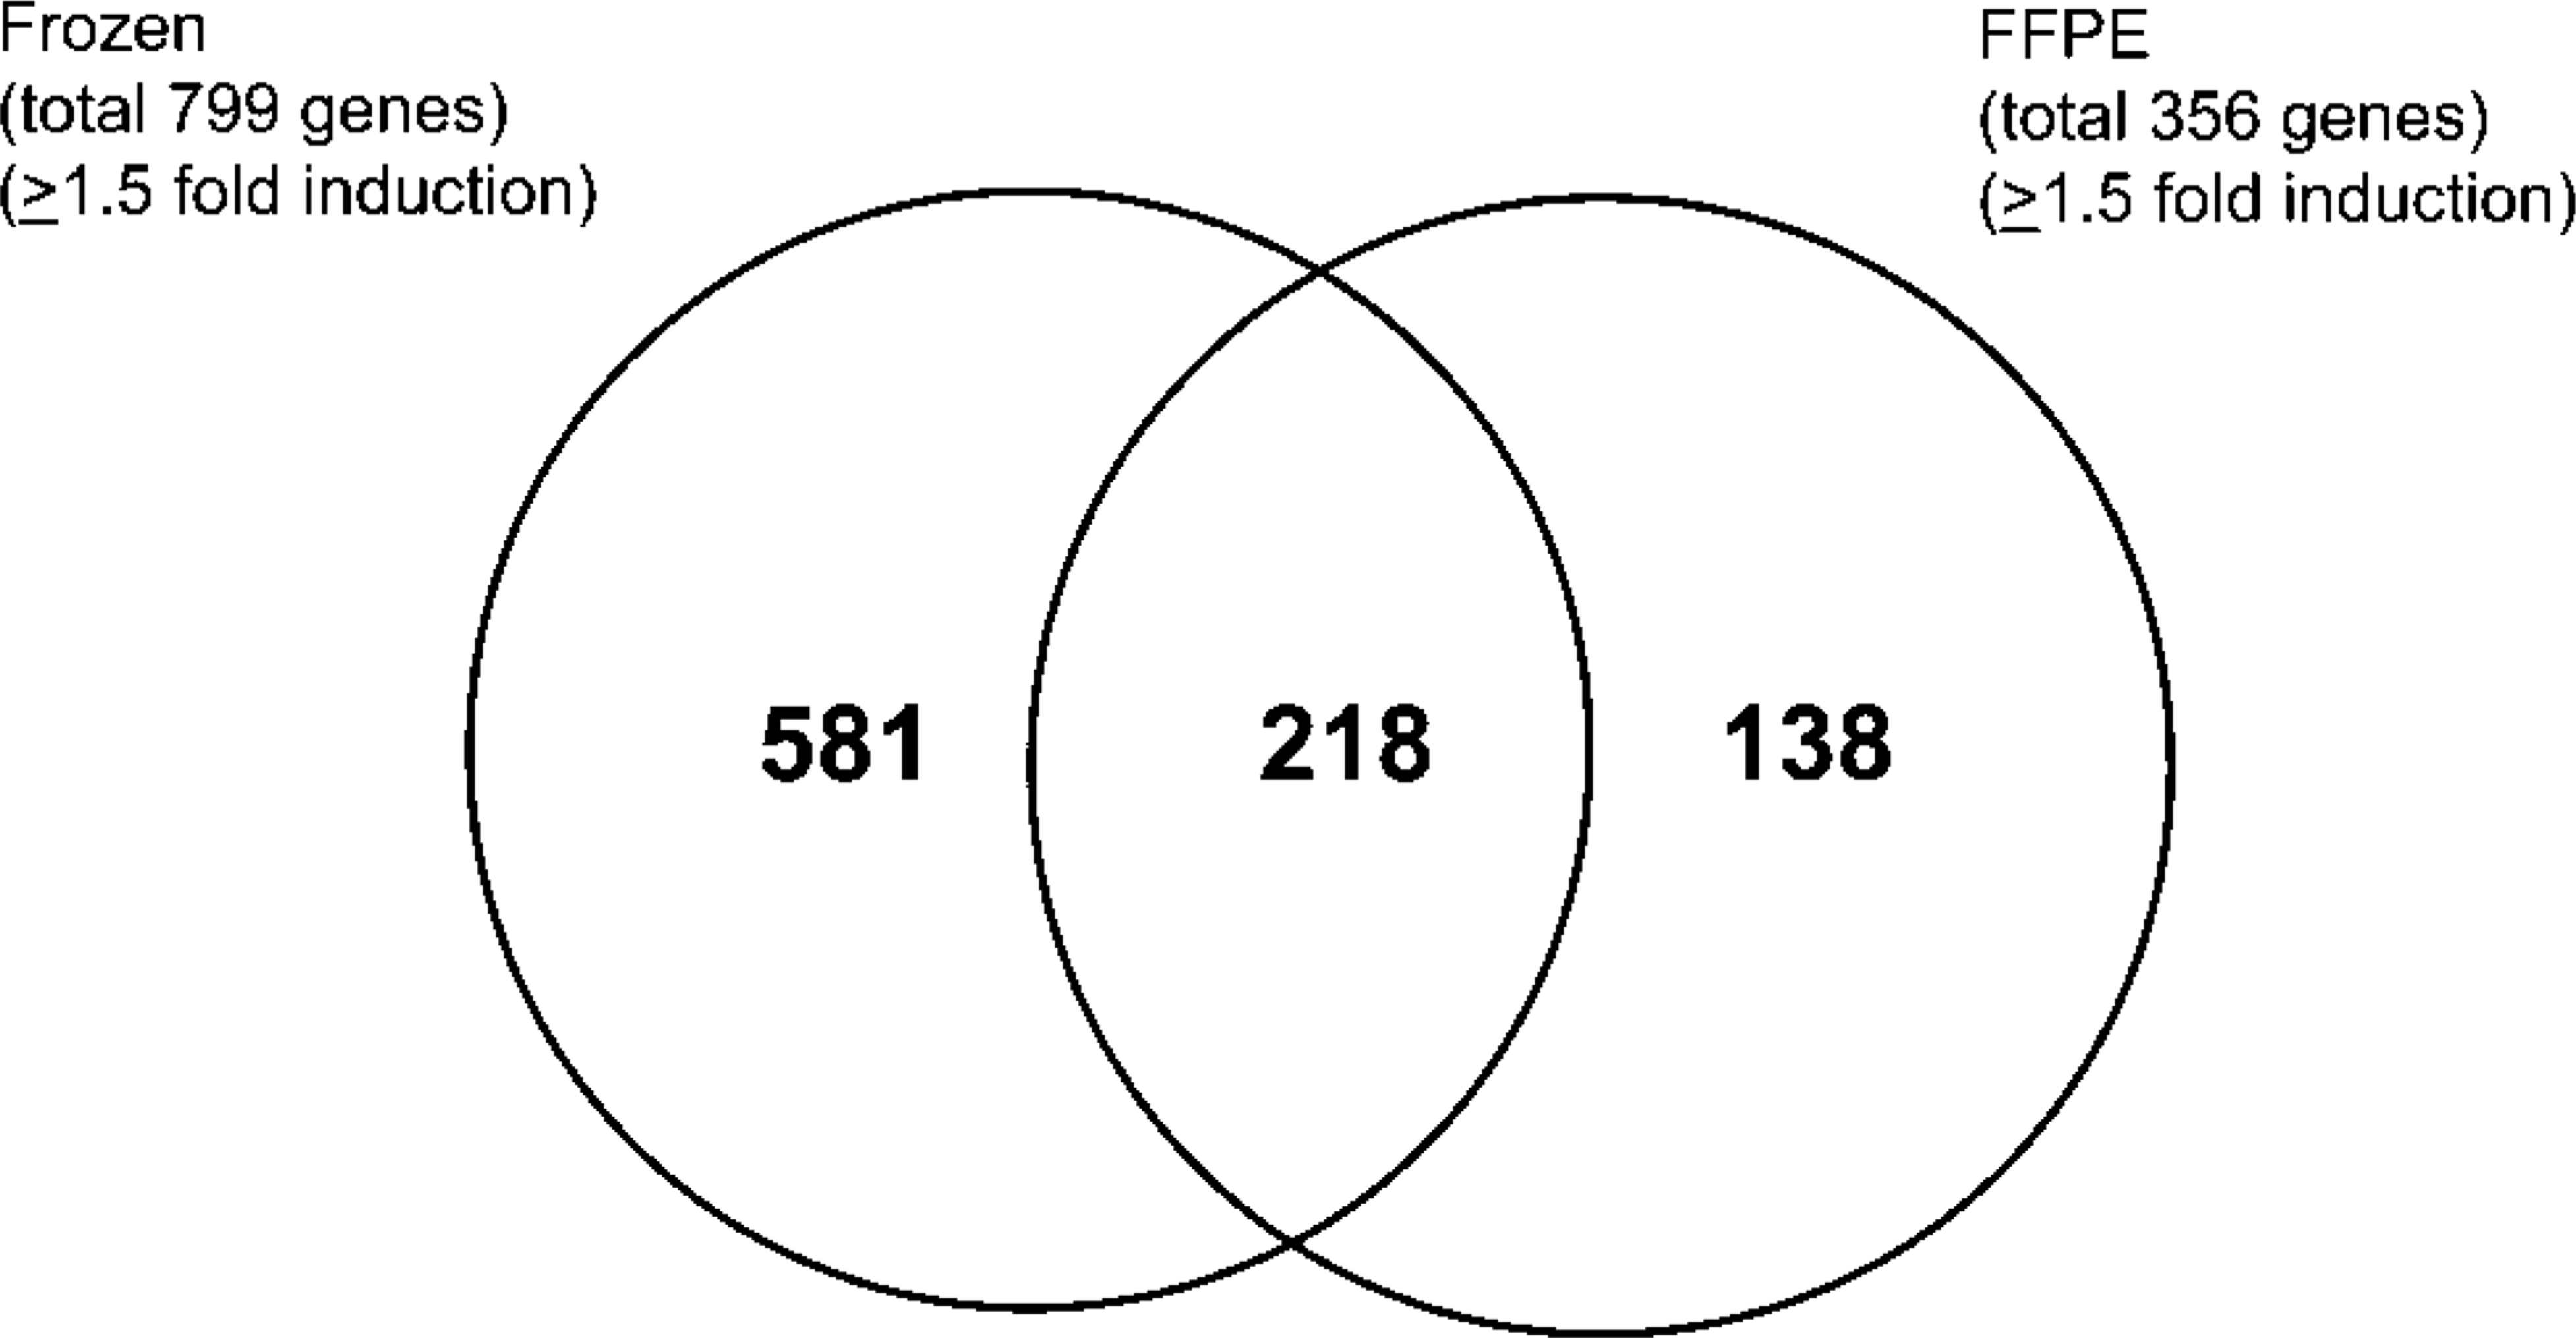
Venn diagram of genes regulated by p38 inhibitor treatment. Numbers are based on genes with 1.5-fold change or greater p<0.00001. Gene lists were created using the modified t-test and fold change to rank genes.
TaqMan Analysis of Selected Regulated Genes From the Affymetrix GeneChip
A standard curve generated from an efficient set of primers and probe in which the log of the input amount of DNA is plotted on the x-axis and the Ct is plotted on the y-axis should produce a slope of approximately −3.2. A small subset of p38-regulated genes were examined by TaqMan to confirm the results of the GeneChip analysis; all TaqMan primers and probe sets utilized produced a standard curve with a slope between −3.1 and −3.3 (Table 2). Fold change obtained from the Affymetrix GeneChip and TaqMan analysis are shown in Figure 3. TaqMan analysis revealed a 100% confirmation of selected snap-frozen and FFPE genes selected for evaluation. Our results show that for some genes [A kinase anchor protein 13, chemokine (C-X-C motif) ligand 10, and collagen type VI] the fold change determined by TaqMan closely matches the Affymetrix data, whereas for others (G-protein-coupled receptor 75, Rho GDP dissociation inhibitor) the Affymetrix fold change was less than that indicated by TaqMan.
Affymetrix HG-U133 Plus 2.0 GeneChip quality assessment
FFPE, formalin fixed, paraffin-embedded.
Affymetrix and TaqMan fold change for frozen and FFPE samples. (
Pathway Analysis of Regulated Genes Identified From FFPE and Frozen Samples
Following analysis of FFPE and frozen samples, the Global Functional Analysis feature of the Ingenuity Pathway Analysis software was used to visualize changes in key pathways affected by the p38 pretreatment. Outputs of the pathway analysis from frozen and FFPE were compared to determine if FFPE preparations could identify key p38-modulated pathways in spite of yielding a smaller number of regulated genes from microarray analyses. A selective representation of major gene functions and numbers of genes that were detected within each function for snap-frozen and FFPE preparations are listed in Figure 4A. Similar functions were identified with both preparations, although the numbers of genes identified from the FFPE sample were generally less when compared with the frozen sample. Both FFPE and unfixed snap-frozen samples identified gene expression, cancer, cell cycle, and cell division as major pathways regulated by p38 inhibition. Regulated genes were then classified into canonical pathways. Although fewer genes were identified in the regulated pathways from FFPE RNA, key canonical pathways were largely identified (Figure 4B). Both FFPE and unfixed snap-frozen samples identified NFKB, JAK/STAT, IL-6, and TGFB signaling as major p38-regulated pathways. However, some information seems to have been lost in the FFPE preparation because several regulated pathways were only recognized in data from the unfixed snap-frozen sample. Only the snap-frozen sample identified epidermal growth factor and neurotrophin signaling and inositol phosphate metabolism as key canonical pathways regulated by p38 pretreatment.
Discussion
Historically, it was considered that RNA extracted from FFPE tissue samples was too degraded to permit molecular analysis (Krafft et al. 1997). Previous studies reporting analysis using RNA from FFPE material mainly focused on PCR as an endpoint. Successful RT-PCR amplification was influenced by the age of the sample and postmortem time interval and was completely independent of the formalin-fixation periods. It has been shown that RNA extracted from these tissues varies with regard to degree of degradation, and successful PCR can be achieved if the amplicon size is restricted to <300 bp (Stanta and Schneider 1991; Foss et al. 1994; Lahr 2000; Specht et al. 2001). However, one of the most critical factors affecting the extent of RNA degradation is the speed at which tissue fixation occurs following sample collection (Start et al. 1992; Lukiw and Bazan 1997; Mizuno et al. 1998; Fitzpatrick et al. 2002). Time delay to fixation and tissue sample size affecting fixation penetration are key variables to consider if interested in downstream RNA analysis. If the tissue to be fixed is large, the time it takes for the fixative to fully penetrate increases, which may lead to RNA degradation by endogenous tissue RNases. In the present study, cell pellets were small and fixed rapidly, factors that likely contributed to the high-quality RNA that was extracted from the FFPE preparations. In addition, the most successful isolation methods for RNA from FFPE tissues involve the use of proteinase K that solubilizes tissue proteins and reverses monomethyl nucleotide modification. Importantly, the commercial kit from Ambion used in the present study also includes a proteinase K treatment to break the RNA-protein cross-links.
Ingenuity Pathway Analysis of differentially expressed genes from frozen and FFPE samples. (
The results demonstrate successful isolation of high-quality RNA from FFPE samples that is amenable to amplification and Affymetrix GeneChip analysis. Gene-Chip performance parameters were similar for RNA extracted from unfixed snap-frozen and FFPE samples with only slight differences observed in 3î/5î ratios.
The results also demonstrate that it is possible to obtain valuable gene expression and biological pathway data from RNA extracted from FFPE samples in spite of only capturing 23% of the regulated genes detected from the frozen cell pellet. Failure to capture a larger percentage of the regulated genes in FFPE samples may be a consequence of some level of RNA degradationor loss due to excessive cross-linking. Based on the quality of FFPE RNA indicated by the Agilent gel-like image, it was surprising there was not a higher concordance of regulated genes between the two preparations. Other factors may be contributing to the observed differences in yield of the number ofp38-regulated genes.
Studies comparing RNA extracted from unfixed snap-frozen and FFPE samples have been conducted where PCR was the endpoint. It was shown using TaqMan that mRNA levels from FFPE samples can be reproducibly and precisely determined, and that values are comparable to matched frozen samples using a panel of seven genes (Specht et al. 2001). Another study using TaqMan in matched frozen and FFPE samples demonstrated significant concordance; however, total RNA from the FFPE samples failed to amplify prior to cDNA synthesis and TaqMan (Steg et al. 2006). Because no assessment of RNA quality was presented, it is difficult to determine why RNA amplification failed. A recent study has shown that an oligonucleotide bead array platform was able to simultaneously measure gene expression of 230 genes and demonstrated overlap in differentially expressed genes; however, 50% fewer regulated genes were identified from RNA extracted from FFPE samples when compared with snap-frozen samples (Bibikova et al. 2004a,b).
Results from the present study show that, for the most part, Affymetrix fold changes were less than determined by TaqMan. This discrepancy is most likely due to the increased sensitivity and larger dynamic range of the TaqMan PCR platform and the compression of fold change values for the highly regulated genes using the Affymetrix platform (Baum et al. 2003; Allemeersch et al. 2005). Validation of primers and probe sets by means of generating standard curves is important because it demonstrates a well-defined mathematical relationship between input amount of DNA and measurement of amplification (Ct), which lends credence to the data generated from the unknown samples. It is important for the slopes of the standard curves to be similar for the genes to be tested because it demonstrates similar PCR efficiency for the primers and probes. Slopes for primers and probes used in the present study were similar.
With the current protocol used in the present study, results showed fewer regulated genes were preserved using RNA from FFPE samples when compared with unfixed frozen samples. In spite of this loss, Ingenuity Pathway Analysis of the regulated genes showed that the majority of major gene functions and canonical pathways could be captured from the FFPE samples, and that there was 100% concordance with Affymetrix gene changes using a selected confirmatory TaqMan gene panel. These data are encouraging and show that valuable global gene expression data can be obtained from FFPE samples. Because formalin fixation and paraffin embedding is the standard protocol for tissue preparation in pathology laboratories, the ability to obtain global transcriptional profiles from RNA obtained from these samples could facilitate the discovery of molecular signatures associated with disease, classification of clinical phenotypes, and determination of cancer prognosis. Although some regulated gene expression information is lost in FFPE samples when compared with frozen samples, the human Affymetrix GeneChip used in this study contained 47,000 transcripts and variants. Even a small percentage of that total can provide a vast amount of gene expression data. Additional technical advances in microarray design with more 3î bias may improve the relative yield of regulated genes from FFPE samples.
Footnotes
Acknowledgements
We thank Janice Kane and Rosanna Mirabile for expert technical assistance.