
Abstract
On the proteomic level, all tissues, tissue constituents, or even single cells are heterogeneous, but the biological relevance of this cannot be adequately investigated with any currently available technique. The analysis of proteins of small tissue areas by any proteomic approach is limited by the number of required cells. Increasing the number of cells only serves to lower the spatial resolution of expressed proteins. To enhance sensitivity and spatial resolution we developed Proteohistography. Laser microdissection was used to mark special areas of interest on tissue sections attached to glass slides. These areas were positioned under microscopic control directly on an affinity chromatographic ProteinChip Array so that cells were lysed and their released proteins bound on a spatially defined point. The ProteinChip System, surface enhanced laser desorption/ionization time-of-flight mass spectrometry (SELDI-TOF-MS), allows the laser to be steered to up to 215 distinct positions across the surface of the spot, enabling a high spatial resolution of measured protein profiles for the analyzed tissue area. Protein profiles of the single positions were visually plotted over the used tissue section to visualize distribution proteohistologically. Results show that the spatial distribution of detectable proteins could be used as a Proteohistogram for a given tissue area. Consequently, this procedure can provide additional information to both a matrix-assisted laser desorption/ionization (MALDI)-based approach and immunohistochemistry, as it is more sensitive, highly quantitative, and no specific antibody is needed. Hence, proteomic heterogeneity can be visualized even if proteins are not known or identified.
Keywords
D
Immunohistochemistry (IHC) allows a very precise spatial resolution but requires prior knowledge about the identity of the protein to be detected and a specific antibody to be available. Even then, only one protein can be measured per experiment. Furthermore, it is difficult to quantify the results. Previously, matrix-assisted laser desorption/ionization (MALDI) has been used by other groups to detect protein profiles directly from tissue (Chaurand et al. 2004). However, this technique is also not quantitative.
The ProteinChip technology, surface-enhanced laser desorption/ionization time-of-flight mass spectrometry (SELDI-TOF-MS), uses chromatographic surfaces able to retain proteins depending on their physicochemical properties followed by direct analysis via time-of-flight mass spectrometry (TOF-MS) (Hutchens and Yip 1993). This technique does not require large amounts of samples, making it ideal for small biopsies or microdissected tissue (Schütze and Lahr 1998; von Eggeling et al. 2000; Melle et al. 2003). We have previously shown that whole tumor biopsies as starting material are too heterogeneous for marker detection (Melle et al. 2005), hence the need to combine laserbased microdissection with ProteinChip technology to identify protein markers in a range of cancers (von Eggeling et al. 2001; Melle et al. 2004; Zhang et al. 2004). Further, it has been shown that this technique is quantitative and highly reproducible (Liggett et al. 2004; Semmes et al. 2005; Vorderwulbecke et al. 2005).
In this study we used ProteinChip technology for the direct proteomic analysis of tissue areas of interest. Therefore, we placed these areas under microscopic control directly on the spot where the lysis took place and proteins were bound specifically to the affinity chromatographic surface. On this spot, up to 215 distinct points could be addressed, ionized, and read out by the laser of the ProteinChip System (PCS 4000; Ciphergen Biosystems Inc., Fremont, CA). In this way we analyzed different heterogeneous tissue areas.
Materials and Methods
Preparing Tissue Samples
Surgically obtained tissue samples (liver: hepatocellular carcinomas and non-tumorous tissue; stomach: gastric carcinomas and normal mucosa; colon: colon carcinomas and normal mucosa) were collected fresh, snap frozen in isobutanol and liquid nitrogen, and stored at −80C. From these samples, 7-μm cryostat sections were prepared. One section was stained with hematoxylin-eosin and examined microscopically to detect tissue areas of interest for Proteohistography (PHG). On a corresponding unstained tissue section mounted on a microscope slide coated with a 1.35-μm polyethylene naphthalate membrane (PEN; Palm, Bernried, Germany), tissue areas the size of a single ProteinChip Array spot were marked by a laser microdissection and pressure catapulting microscope (LMPC; Palm, Bernried, Germany) (∼1.8 × 1.4 mm) by lines and one small circle in the upper right corner (Figure 1).
Applying Tissue Sections Onto ProteinChip Arrays
A Q10 ProteinChip Array (strong anion exchanger; Ciphergen Biosystems Inc.) was activated (see Melle et al. 2004) and wetted with 0.5 μl lysis buffer (100 mM Na-phosphate (pH 7.5), 5 mM EDTA, 2 mM MgCl2, 3 mM 2-β-mercaptoethanol, 0.1% CHAPS, 500 μM leupeptin, and 0.1 mM phenylmethylsulfonyl fluoride). Under control of a stereomicroscope (Stemi 2000c; Carl Zeiss, Oberkochen-Jena, Germany), the slide was turned upside down, and the tissue section was placed on the spot of the ProteinChip array. The LMPC-marked tissue area was aligned exactly horizontal to the ProteinChip Array spot (Figure 1). Tissue lysis on the spot was performed for 1.5 hr at 4C in a humidity chamber.
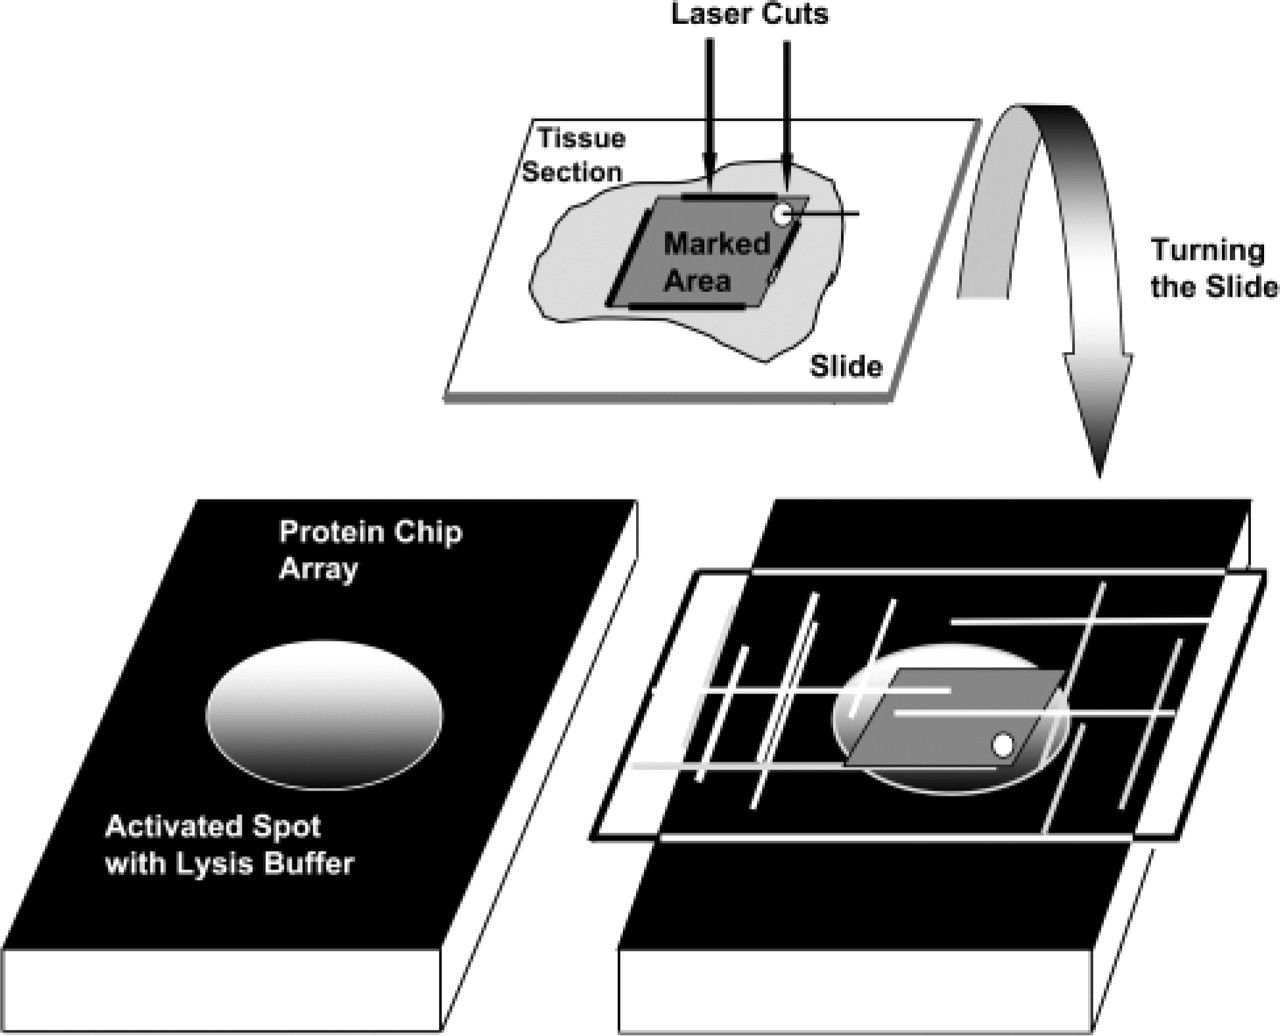
Principle of Proteohistography (PHG): tissue areas the size of a single ProteinChip Array spot were marked by a laser microdissection microscope (×1.8 ×1.4 mm) by lines and one small circle in the upper right corner. Under control by a stereomicroscope, the slide was turned upside down and the tissue section was placed on the spot of the ProteinChip Array wetted with lysis buffer. The laser capture microdissection-marked tissue area was aligned exactly horizontal to the ProteinChip Array spot.
ProteinChip Array Analysis
After lysis, the slide was removed from the ProteinChip Array. The spots were washed three times with 5 μl of a washing/binding buffer (100 mM Tris-buffer, pH 8.5, with 0.02% Triton X-100) and rinsed two times with water. On dried spots, 2 × 0.5 μl sinapinic acid (saturated solution in 0.5% TFA/50% acetonitrile) was applied. Mass analysis was performed in a ProteinChip Reader (PCS 4000; Ciphergen Biosystems Inc.) with a manual data collection protocol. This includes 20 laser shots to the 215 (in case of lysates) or 114 (in case of tissue sections) addressable points, with a laser energy of 1600 nJ. For each point, data were averaged to a spectrum (Figure 2).
Analysis of Data
Spectra were normalized with total ion current and cluster analysis of the detected signals, and the determination of respective p values and coefficient of variation (CV) were carried out with the CiphergenExpress Program (Version 3.0; Ciphergen Biosystems Inc.).
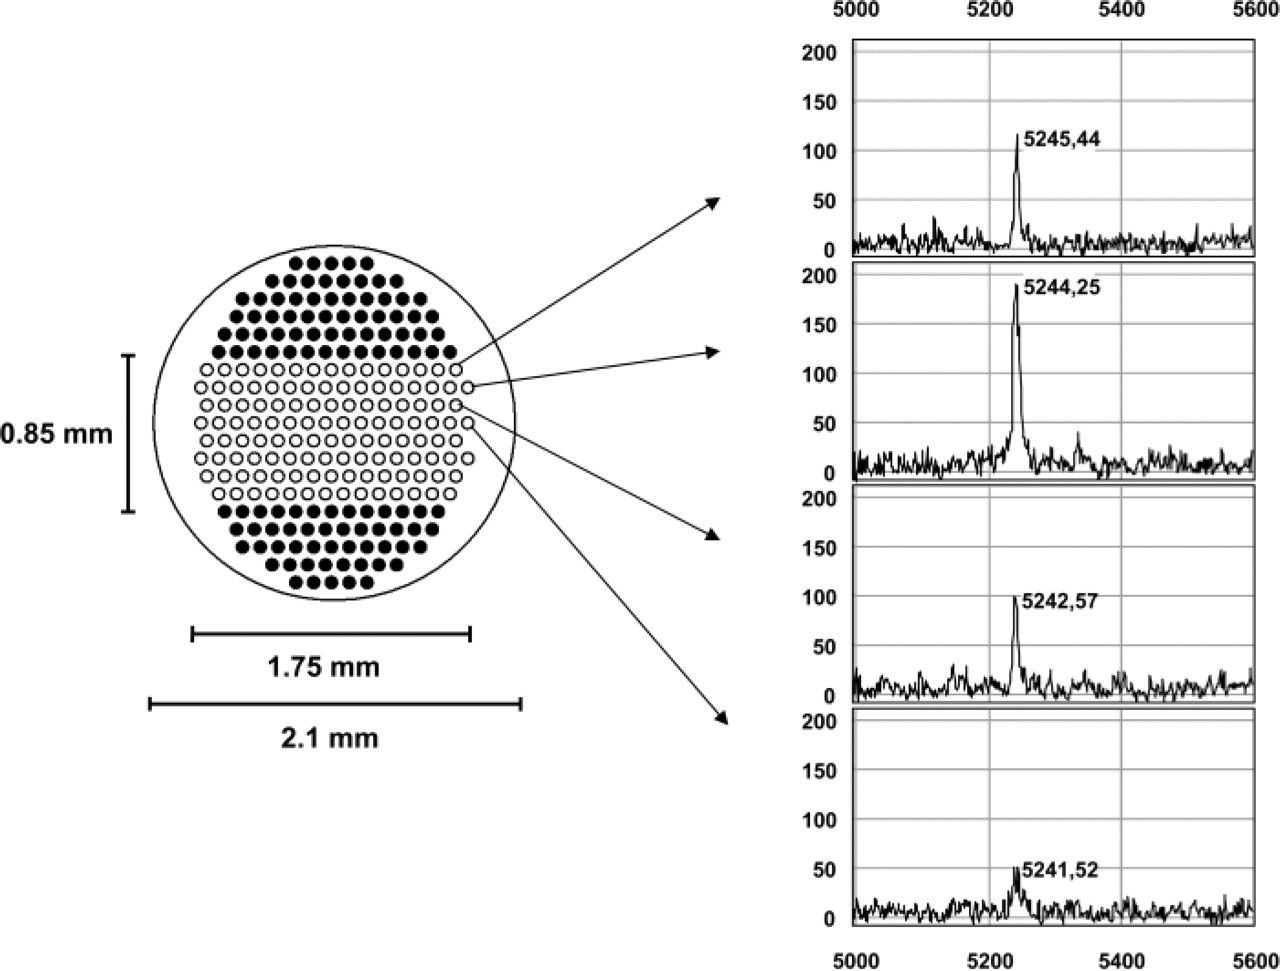
Depiction of the addressable laser position on a spot of a ProteinChip Array. Positions of the empty circles were used for PHG. Intensities of a single peak (e.g., 5.2 kDa) were used for the generation of Figure 3.
Data from analyzed tissue areas were further transferred to Excel 2002 (Microsoft Corp.; Redmond, WA) and location (x/y-axis) was plotted against intensity in a surface plot.
Results
Before PHG, reproducibility of the single addressed position on the spot was checked by applying a protein lysate from liver tissue to Q10 ProteinChip Array. CV was calculated for all clustered peaks (n=20; range 2 kDa to 20 kDa). The range was between 18% and 37%. PHG was performed by direct application of a cirrhotic liver section containing fatty degenerated and non-fatty regions onto the spot of a ProteinChip Array. After lysis, spectra from the single laser position were read out with the PCS 4000 system, and two exemplary peaks each were plotted according to the location and intensity (Figures 3A and 3B). For the peaks at 5.2 kDa and 13.9 kDa, a clear difference between the left and right areas could be seen. The peak at 13.9 kDa (Figure 3A) would appear to be a protein mainly expressed in the fatty degenerated part of the liver section, and its concentration is decreased in the direction of the non-fatty part. The reverse is true for the peak at 5.2 kDa (Figure 3B). Peaks with an equal distribution over the entire tissue also exist (data not shown).
Discussion
One of the most promising proteomic tools for the detection of new proteomic cancer biomarkers is ProteinChip (Ciphergen Biosystems Inc.) technology (e.g., Petricoin et al. 2002 a; Rosty et al. 2002). This technique has been predominantly used for body fluid analyses: serum (Petricoin et al. 2002 a, b); urine (Vlahou et al. 2001); nipple aspirate fluid (Paweletz et al. 2001); and pancreatic juice (Rosty et al. 2002), as they are fast and easy to analyze by direct application to the ProteinChip Arrays. If markers can be found, they are ideal for screening high-risk individuals or even individuals without elevated risk (Uchida et al. 2002; Kozak et al. 2003; Shiwa et al. 2003; Ye et al. 2003; Zhang et al. 2004).
In contrast to serum (Busch et al. 2005), the analysis of tissues or fractionated cells is more time-consuming because microdissection or cell sorting is necessary; however, the chance of finding a reliable tumor marker might be higher than in serum (Melle et al. 2005). As a minimum, there is a greater chance to obtain more information about the biological mechanisms leading to the genesis and progression of cancer.
Even the combination of laser-based microdissection and ProteinChip Arrays does not enable the analysis of functional or clonal heterogeneity of tissue in detail. Also, MALDI-TOF-MS-based approaches (Yanagisawa et al. 2003; Schwartz et al. 2004) allow only a spatial resolution down to the millimeter range and are additionally not quantitative because proteins are bound not specifically on the surface of the plate. Therefore, we developed PHG by applying defined tissue areas directly to single spots of chromatographic ProteinChip Arrays. PHG is an efficient method to illustrate the proteomic complexity and heterogeneity of morphologically defined tissue areas in situ and to assign proteins or peptides of defined mass to tissue structures quantitatively. The CV for the single addressed positions on the spot is only slightly higher than from spot to spot (Semmes et al. 2005), where all measured positions are averaged. This indicates that the measurement of single positions on the spot is valid and reproducible and allows for quantitative conclusions. In its present state, PHG does not reach the high resolution of IHC, where even different locations of proteins in the cell can be visualized. In contrast to the MALDI-based approach and especially in contrast to IHC only small tissue areas (∼1 to 2 mm) can be analyzed at the same time.
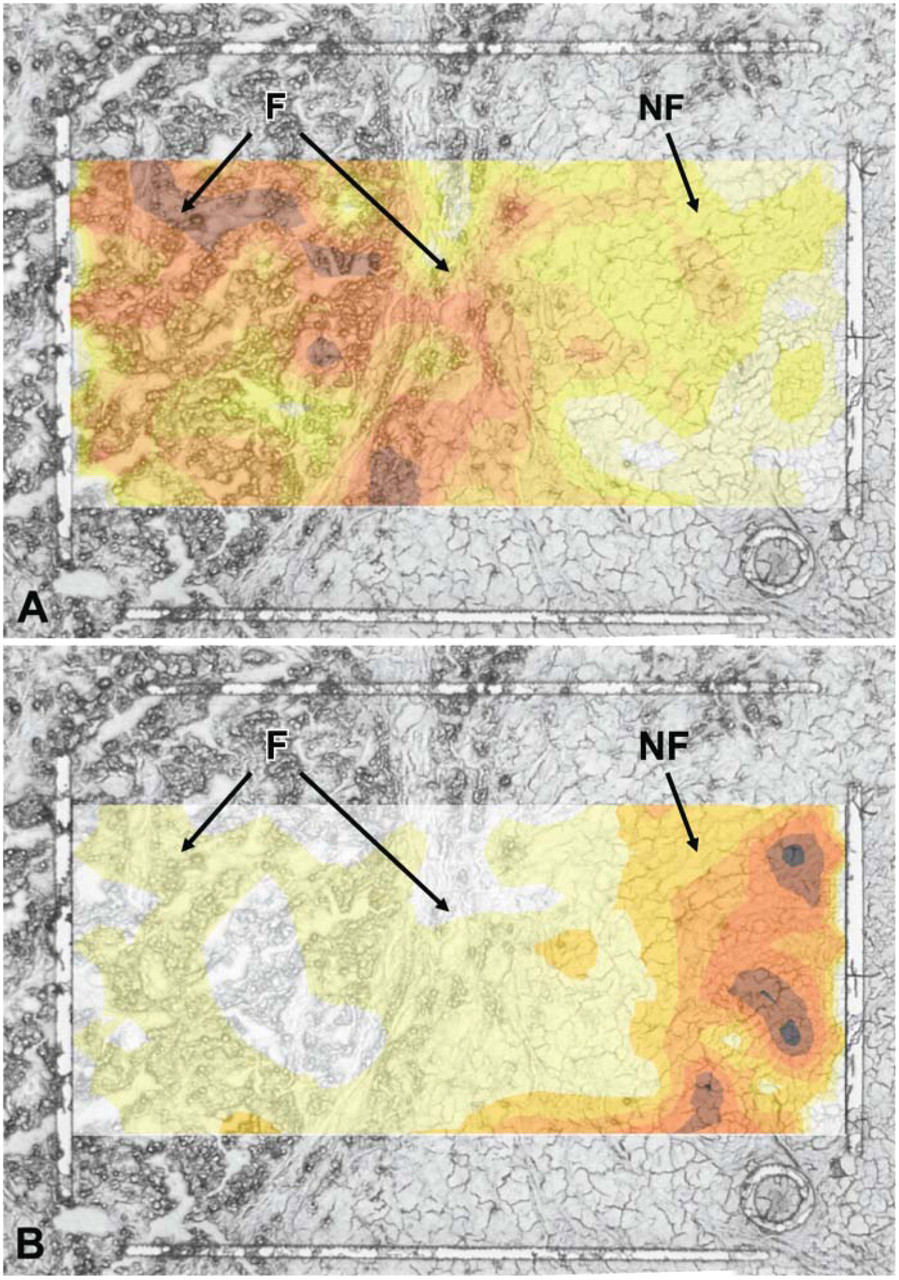
Tissue section of a cirrhotic liver; original magnification ×60. F: fatty degenerated liver tissue. NF: non-fatty liver tissue. Expression intensity increases with darkness of color. (
Nevertheless, this method may enable the detection of functional or clonal proteomic heterogeneity in morphologically “homogeneous” tissue areas because the spatial resolution is in the 100-μm range. This may be a way to detect cell complexes within such “homogeneous” tissue areas, which are proteomically—but not morphologically—different from the surrounding cells. In this way, detected proteins can be identified and antibodies against these proteins produced. These antibodies can be used in IHC to detect tissue areas that express the proteins primarily detected by PHG.
As demonstrated here, in proof of principle it may be possible to detect and to analyze the clonal heterogeneity of tumor tissues and to find cell complexes with invasive and/or metastatic properties that could not be recognized morphologically. In corresponding tissue sections such clonal areas can be microdissected and analyzed further.
Footnotes
Acknowledgements
This work was support by a grant from the German Federal Ministry of Education and Research (BMBF) and the Interdisciplinary Center for Clinical Research (ICCR), Jena, Germany.