
Abstract
Nidogen-1 and −2 are key components of basement membranes (BMs). Despite the presence of nidogen molecules in the parenchyma of the developing liver, no BMs are formed therein. This suggests that, in the liver, nidogens may also have functions other than BM formation. As a first step toward the elucidation of the possible cell biological functions of nidogens in the developing liver, we aimed to study their cellular origin. We localized expression of nidogen-1 and nidogen-2 on prenatal days 12, 14, and 16 in the developing mouse liver using in situ hybridization at the light and electron microscopic level and light microscopic immunohistochemistry. Our results show that nidogens are produced both in portal anlagen and in the parenchyma during liver development. In the parenchyma, transcripts can be found in hepatocytes, precursors of stellate cells, endothelial cells and, most interestingly, hematopoietic cells. Using real-time PCR, we found that the gene expression for both proteins shows a decrease from day 14 to day 16 concomitant with a decrease in the hepatic hematopoiesis. We suggest that nidogens may, to some extent, take part in the regulation of hepatic hematopoiesis.
N
Materials and Methods
mRNA Extraction
For the extraction of RNA, five liver tissue samples were taken from New Mexico Research Institute (NMRI) mice from day 12, three samples from day 14, and two samples from day 16. For each developmental day, ∼30 mg was pooled and frozen in liquid nitrogen, pulverized with a mortar and pestle, mixed in TRIZOL (Biozol; Eching, Germany), and incubated for 10 min at room temperature. Following a centrifugation step, the aqueous phase was transferred to an RNAeasy mini-columm (RNAeasy Midi Kit; Qiagen, Hilden, Gemany) processed according to the manufacturer's instructions and treated with DNAfree (Ambion; Huntingdon, UK). The quality of the RNA was tested with an Agilent 200 Bioanalyser RNA chip (Agilent; Palo Alto, CA). RNA was reverse-transcribed into cDNA with the help of the Advantage RT-for-PCR kit (BD Bioscience; Palo Alto, CA) applying Moloney murine leukemia virus reverse transcriptase and oligo (dT)18 primer.
Standard RT-PCR
PCR conditions were optimized by applying the gradient function of the DNA engine Opticon 2 (MJ Research; Waltham, MA) for nidogen-1 primers (forward: CCTCCTCAAATTCCAGCTCC, reverse: TCTCAAACACCCACACACC) to amplify a 243-bp transcript and nidogen-2 primers (forward: CTTTGACCCCTTCTCCAAAC, reverse: ACTGATATAACACCATCCCTCC) to amplify a 183-bp transcript. PCR was performed in a total volume of 25 μl with 1 μl cDNA derived from liver tissue samples on days 12,14, and 16, respectively; 2.5 μl 10X reaction buffer, 0.5 μl dNTP, 1 μl of each primer, 0.125 μl hotstarTaq DNA polymerase (Qiagen), and 19 μl water. With the DNA Opticon 2, after an initial activation step of 15 min at 95C, further steps were as follows: 35 cycles of denaturing for 30 sec at 94C, annealing for 30 sec at 55C for nidogen-1 and 57C for nidogen-2, elongation for 30 sec at 72C, and, finally, an extension step of 10 min at 72C. Ten μl of each sample was loaded onto a 1.5% agarose gel and an electrophoresis was run.
Quantitative Real-time PCR
To optimize the real-time PCR conditions for quantification, optimal magnesium chloride concentration was determined by adding 12.5 μg of 2X QuantiTect SYBR Green PCR Master Mix (Qiagen), 1 μl of each primer, and 150 ng of cDNA to a final volume of 25 μl. Cycling was performed following the protocol described above. Data acquisition was carried out after each extension step, and a melting curve was performed in 0.1C steps from 50C to 95C. Direct PCR product detection was monitored in real-time by measuring the increase caused by the binding of SYBR Green to cDNA. Real-time PCR efficiencies were calculated from the given slopes in the Opticon 2 Monitor software according to the equation E = 10(-1/slopes) (Pfaffl 2001). To confirm precision and reproducibility, intra-assay was determined in three repeats within one DNA engine Opticon 2 run. Inter-assay variation was investigated in three different experiments run on 3 days. Inter-test variation was <2.25% and intra-test variation was <1.68% for nidogen-1 experiments and <1.54% and <1.10% for nidogen-2 experiments, respectively.
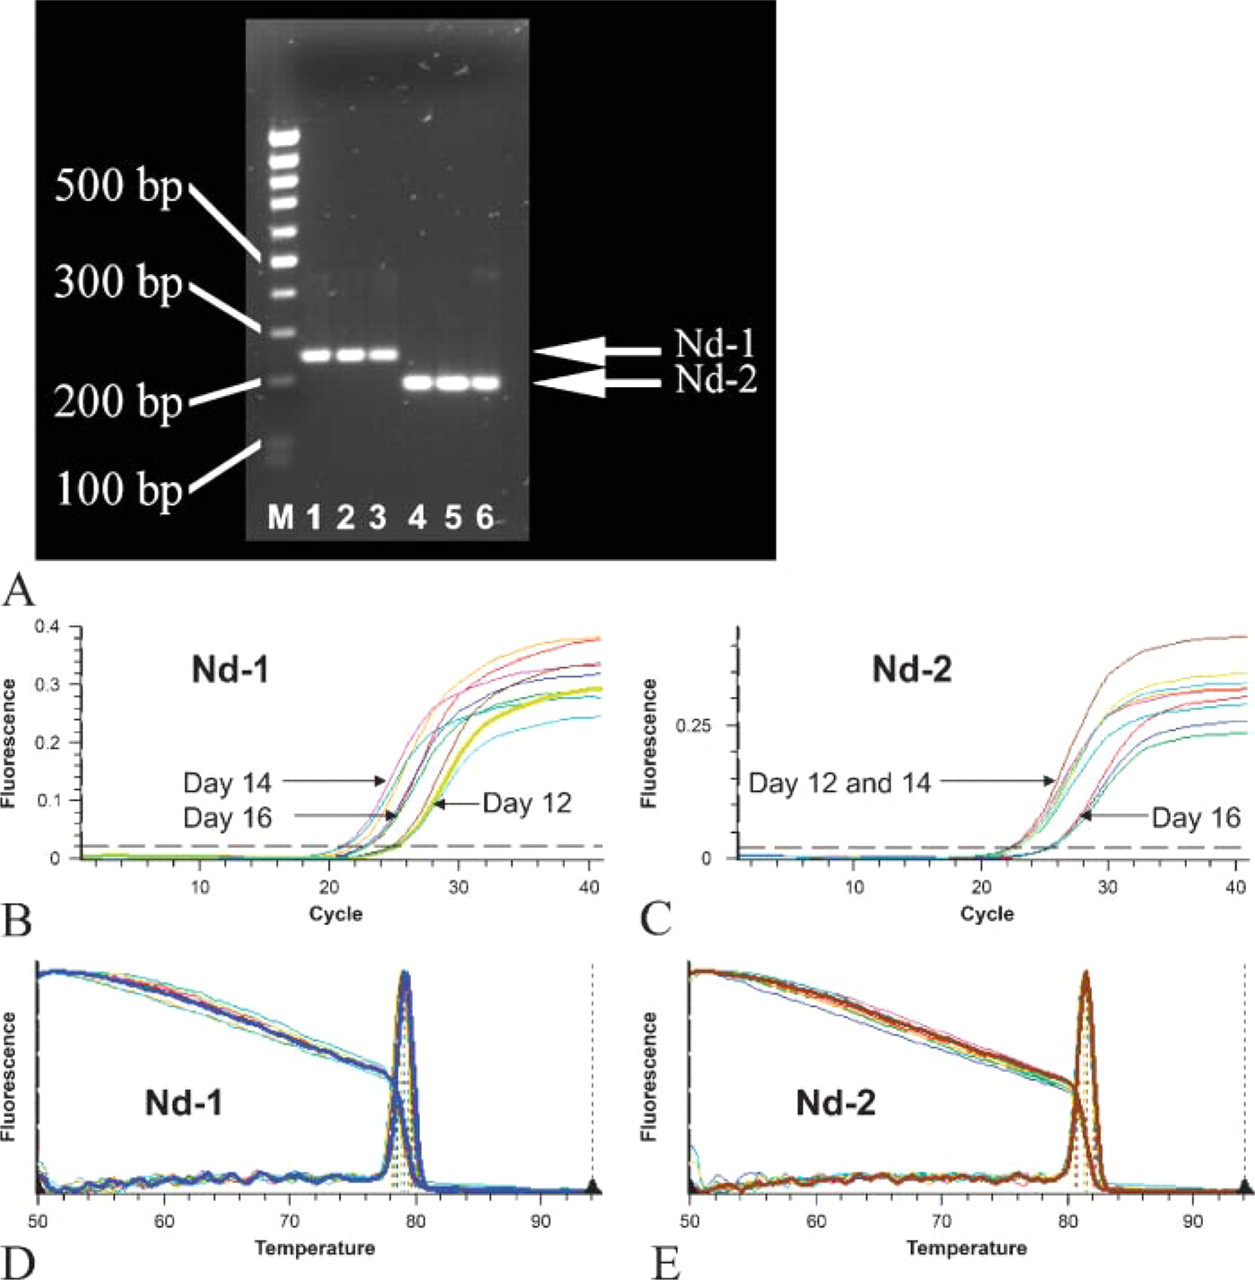
Expression of nidogen-1 and nidogen-2 in the developing mouse liver after PCR analysis. (
Embedding of the Tissue
Embryos on day 12 and fetuses on day 14 and day 16 were taken from NMRI mice and quickly dissected in PBS. Following fixation with 4% phosphate-buffered formaldehyde, liver tissue fragments or whole 12-day-old embryos were embedded in paraffin. Five-μm paraffin sections were then used for histology, light microscopic in situ hybridization, or immunohistochemistry. Other tissue fragments were fixed in a mixture of 4% paraformaldehyde and 0.5% glutaraldehyde and embedded in LR-Gold as previously described (Miosge et al. 2000a,b; Quondamatteo et al. 2004).
In Situ Hybridization: Light and Electron Microscopy
A 276-bp EcoRI/HincII fragment of EST clone AA215199 corresponding to bp 2026-2293 of mouse nidogen-2 (Kimura et al. 1998), coding for amino acids 632-720, and an Acc I/BgIII fragment of mouse nidogen-1 corresponding to bp 621-1066 (Mann et al. 1989), coding for amino acids 201-348 were used for hybridization. Non-radioactively labeled sense (used for negative controls) and antisense RNAs were produced in vitro with the digoxigenin-labeling kit (DIG; Boehringer, Mannheim, Germany). For light microscopic in situ hybridization, 5-μm paraffin sections, after appropriate pretreatment, were incubated with digoxigenin-labeled RNA probes and processed according to our standard protocol (Krengel et al. 1996). Electron microscopic in situ hybridization was carried out using the same RNA probes and carried out according to our standard protocol for electron microscopic in situ hybridization (Miosge et al. 2000a,b), and the sections were examined under a LEO 906E electron microscope (LEO Elektronenmikroskopie GmbH; Oberkochen, Germany). Negative controls were performed by hybridizing sections using a sense RNA probe substituted for the corresponding antisense RNA probe.
Light Microscopic Immunohistochemistry
An affinity-purified monoclonal antibody JF4 (2.2 mg/ml) against murine recombinant nidogen-1 (Chemicon; Hofheim, Germany) and an affinity-purified rabbit antibody against recombinant nidogen-2 (0.4 mg/ml; kindly provided by the group of Dr. R. Timpl, MPI for Biochemistry, Martinsried, Germany) were applied. For immunohistochemistry, 5-μm paraffin sections were used, and immunohistochemistry was carried out as previously described (Miosge et al. 2000b).
Results
Real-time PCR
RT-PCR was performed on days 12, 14, and 16 of mouse development. A clear band was seen for nidogen-1 at ∼243 bp on all days investigated. A similar pattern was observed for nidogen-2 at ∼183 bp at the same developmental stages (Figure 1A). We then investigated, by means of real-time PCR, the relative amounts of nidogen-1 and nidogen-2 expression at these different time points ofdevelopment. The transcripts investigated showed high real-time PCR efficiency rates for nidogen-1 (E = 2.08) and nidogen-2 (E = 2.04) in the investigated range of 2.5 to 250 ng input (n = 3) (Pearson coefficient r = 0.99). Subsequently, the threshold cycle (ct), the cycle number at which the amount of amplified gene of interest reached a fixed threshold, was determined. Realtime PCR revealed for nidogen-1 on day 12 mean ct values of 24.33 ± 1.28, on day 14 values of 21.66 ± 0.19, and on day 16 values of 23.15 ± 0.54. For nidogen-2 on day 12 mean ct values were 23.33 ± 0.21, on day 14 they were 22.65 ± 0.25, and on day 16 values were 25.06 ± 0.20 (Figures 1B and 1C). Results of a relative quantification showed a relative increase in nidogen-1 mRNA expression compared with the total gene expression of the developing liver tissues from day 12 to day 14 (7.06 ± 1.2-fold) and a relative decrease from day 14 to day 16 (0.3 ± 0.1-fold). On the other hand, relative mRNA expression level for nidogen-2 was highest on day 12 and decreased continuously from day 12 to day 14(1.6 ± 0.2-fold) and from day 14 to day 16 (0.1 ± 0.2-fold). Validity of the PCR results was confirmed by sequencing the PCR products and by the melting curves, as shown here for nidogen-1 (Figure 1D) and for nidogen-2 (Figure 1E).
Histology
In the liver parenchyma a conspicuous presence of hematopietic precursors intermingling with hepatic cells was already seen on day 12 (Figure 2A). Clusters of various-size cells containing hepatic as well as hematopoietic precursors were visible on days 14 (Figure 2B) and 16 (Figure 2C) as well. Developing microvessels were seen among the parenchyma cell clusters in all stages. In some regions with a lower density of hematopoietic precursors, early trabecular organization of the hepatocytes could be visualized. However, cell density was mostly very high in liver parenchyma in all these stages and a precise distinction of the individual cell types and, particularly, among the individual hematopoietic precursors, was not always possible by means of light microscopy. Additionally, on day 16 the early portal anlagen were visible (Figure 2D). In contrast to the parenchymal areas, individual structures of the portal anlagen were clearly recognizable by light microscopy. Portal vein branches were surrounded by a thin sheath of connective tissue as well as by outerlimiting-plate hepatocytes and newly formed bile ducts (Figure 2D). At the ultrastructural level, after embedding in LR-Gold (Figure 2E), hepatocytes were mostly seen as irregular in shape with prolongations and only in later phases did they begin to show a polygonal form. Stellate cells were smaller and located in the proximity of microvessels. In early stages (Figure 2E) these were lined by continuous endothelial cells that showed the first signs of fenestrations on day 16. In all stages, hematopoietic precursors were roundish and surrounded the hepatocytes. Among the hematopoietic precursors, megakaryoblasts were easily recognized by their typical irregular profile and large dimension. Precursors of the red line had a round nucleus, whereas the nucleus of myelomonocytic cells showed a lateral indentation. A further distinction between granulocytic and monocytic precursors was not made because a clear differentiation of specific from unspecific granula is not possible after LR-Gold embedding.
Gene expression for nidogen-1 and nidogen-2 during mouse liver development
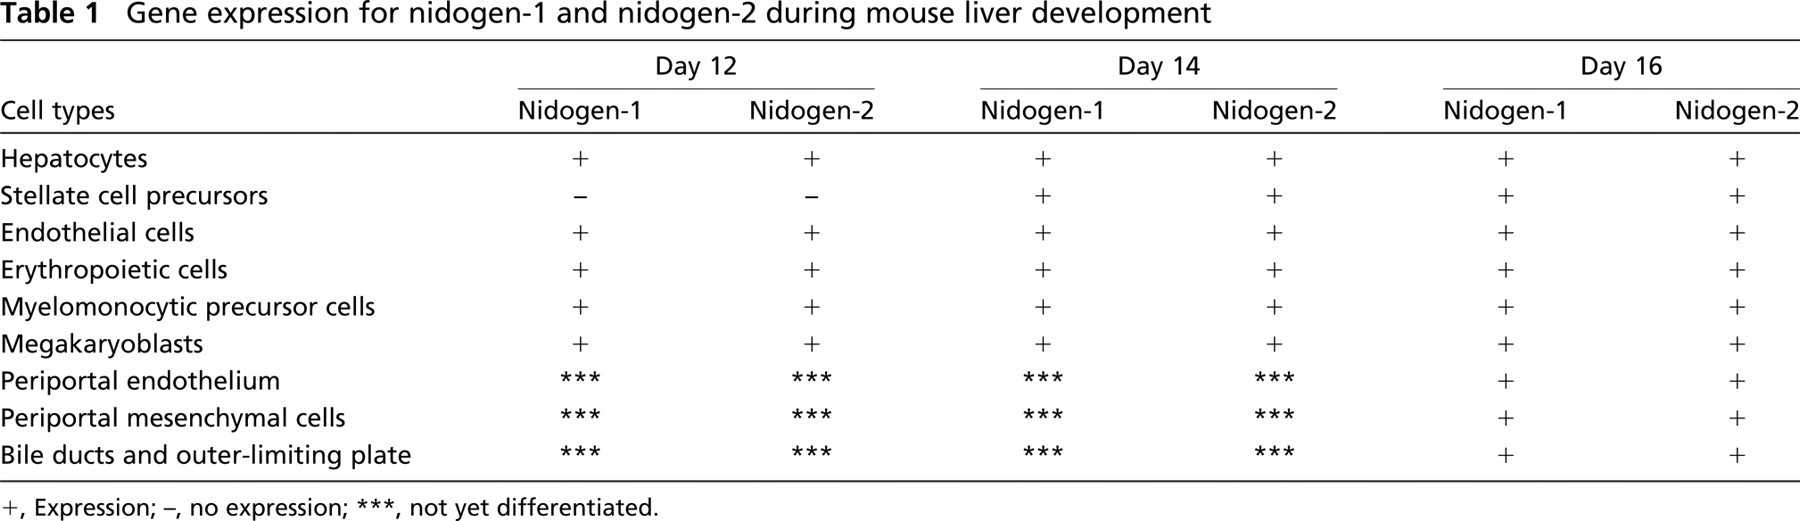
+, Expression; -, no expression; ∗∗∗, not yet differentiated.
Localization of Nidogen Gene Expression
To establish the cellular origin of nidogen-1 and nidogen-2 in the mouse liver anlage on days 12, 14, and 16 of mouse development, we performed light and electron microscopic in situ hybridization. Localization of nidogen expression is summarized in Table 1.
Light Microscopy
On day 12, an irregular positive staining for nidogen-1 in the liver parenchyma was observed at this stage of development (Figure 3A). In contrast, clear positive staining for nidogen-2 was seen in the entire parenchyma of the liver anlage (Figure 3C). Control reactions with sense probes showed no staining for either nidogen-1 (Figure 3B) or nidogen-2 (Figure 3D). On day 14, staining intensity for nidogen-1 was markedly increased in the liver parenchyma, and clear staining was now found throughout the parenchyma of the developing liver (Figure 3E). A similar staining pattern for nidogen-2 was observed light microscopically (Figure 3G). Controls with sense probes showed no reaction for either nidogen-1 (Figure 3F) or nidogen-2 (Figure 3H). On day 16, in situ hybridization with antisense probes showed that the mass of cells producing nidogen-1 (Figure 3I) and nidogen-2 (Figure 3K) in the liver parenchyma had clearly decreased. In the anlagen of the portal spaces also, developing bile ducts as well as mesenchymal cells and endothelial cells of the portal vessels showed clear gene expression for both nidogens. Control reactions with sense probes showed no staining for either nidogen-1 (Figure 3J) or nidogen-2 (Figure 3L).
Ultrastructural Localization of Nidogen Expression in the Parenchyma of the Developing Liver
On day 12, transcripts for nidogen-1 as well as for nidogen-2 were found in several cell types such as hepatocytes, endothelial cells, and in cells of all hematopoietic lineages. Precursors of stellate cells showed no specific labeling for either nidogen-1 or nidogen-2 mRNA. Controls for nidogen-1 and nidogen-2 with sense probes revealed only sparse labeling regarded as nonspecific background. An example of nidogen-1 expression in an erythropoietic cell (Figure 4A) is shown.
On days 14 and 16, ultrastructural examination of parenchymal areas of the developing liver showed transcripts for nidogen-1 as well as for nidogen-2 in hepatocytes, endothelial cells, and myelomonocytic, erythropoietic, and thrombopoietic precursors, as well as in precursors of stellate cells. Controls for nidogen-1 and nidogen-2 with sense probes revealed only sparse labeling regarded as nonspecific background. Examples of expression for nidogen-1 on day 14 in a myelomonocytic cell (Figure 4B) and for nidogen-2 on day 14 in an erythropoietic cell and an endothelial cell (Figure 4C), as well as in a precursor of stellate cells (Figure 4D), are shown. Examples of nidogen-1 expression on day 16 in an erythropoietic cell after incubation with the antisense probe (Figure 5A) and after incubation with the corresponding sense (Figure 5B) as well as in a myelomonocytic precursor (Figure 5C) are shown. Examples of nidogen-2 expression on day 16 in a thrombopoietic cell (Figure 5D), as well as in a myelomonocytic cell on day 16 after incubation with the antisense probe (Figure 5E) and after incubation with corresponding sense probes (Figure 5F), are also depicted in the figures.
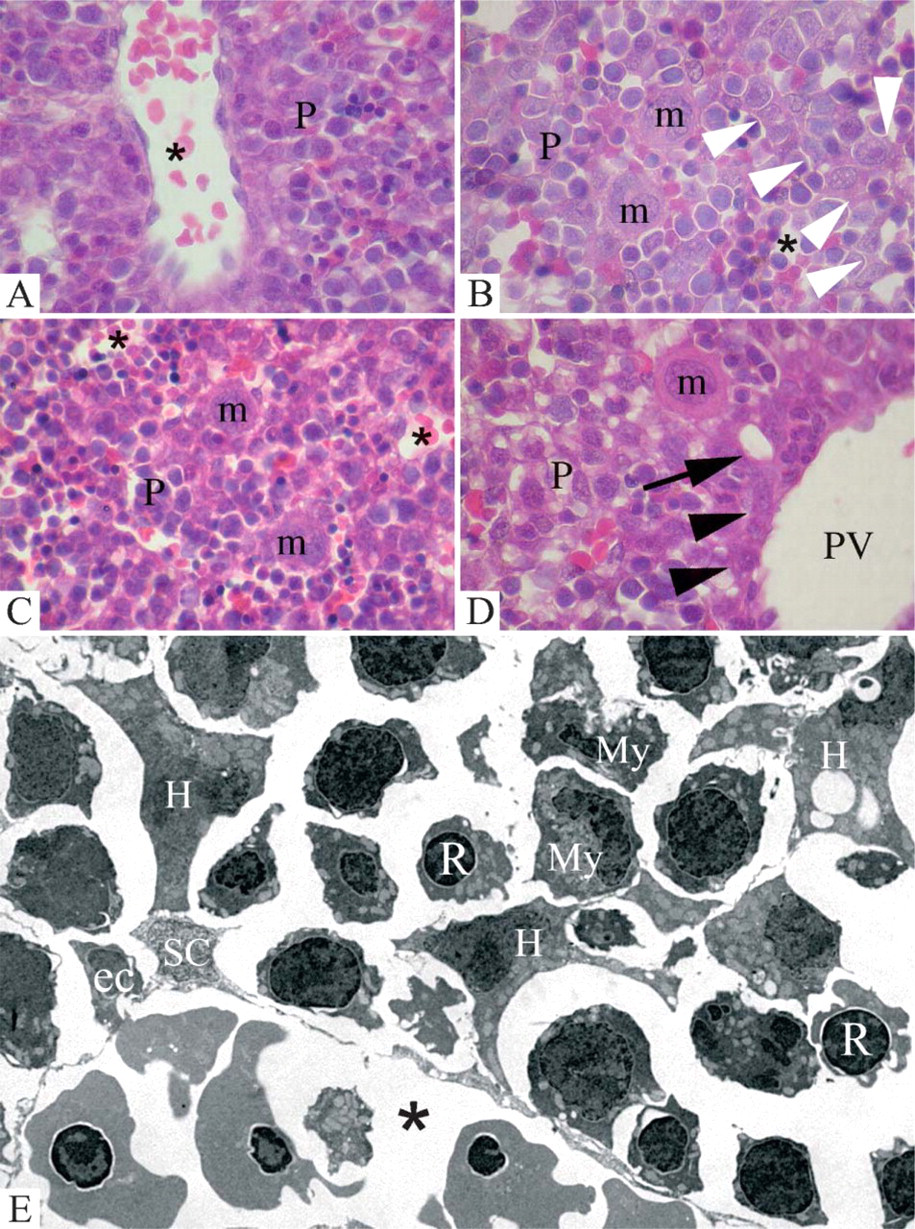
Histology of the liver on prenatal days 12,14, and 16. (
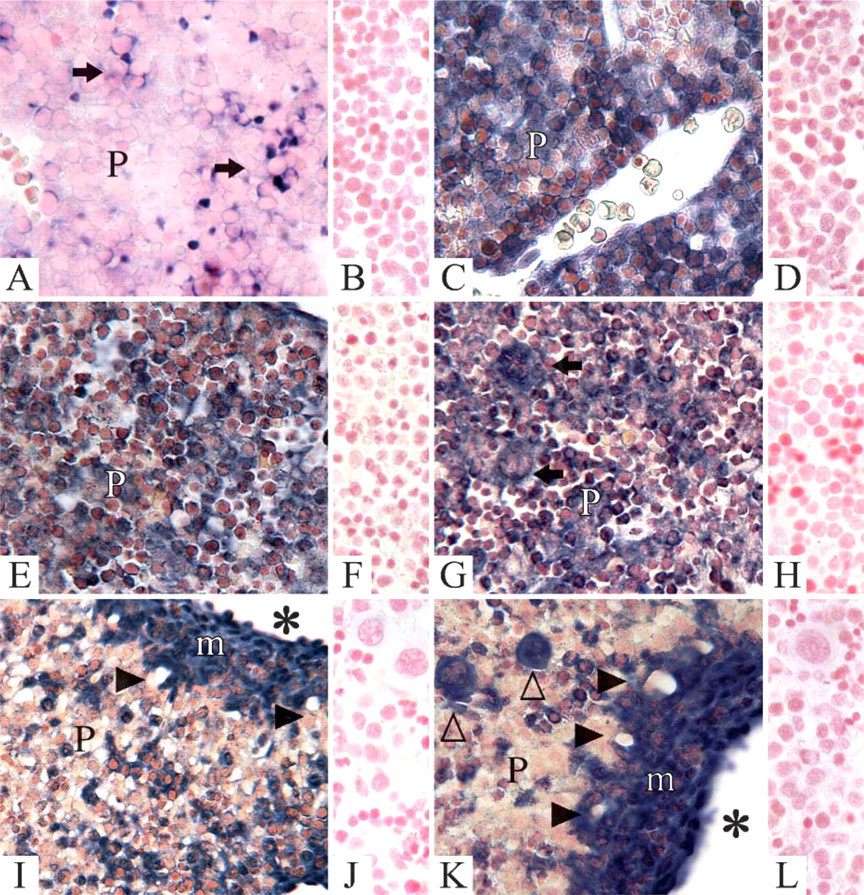
Light microscopic in situ hybridization of nidogen-1 and nidogen-2 during liver development. Antisense probes on day 12 of development showed staining for nidogen-1 (
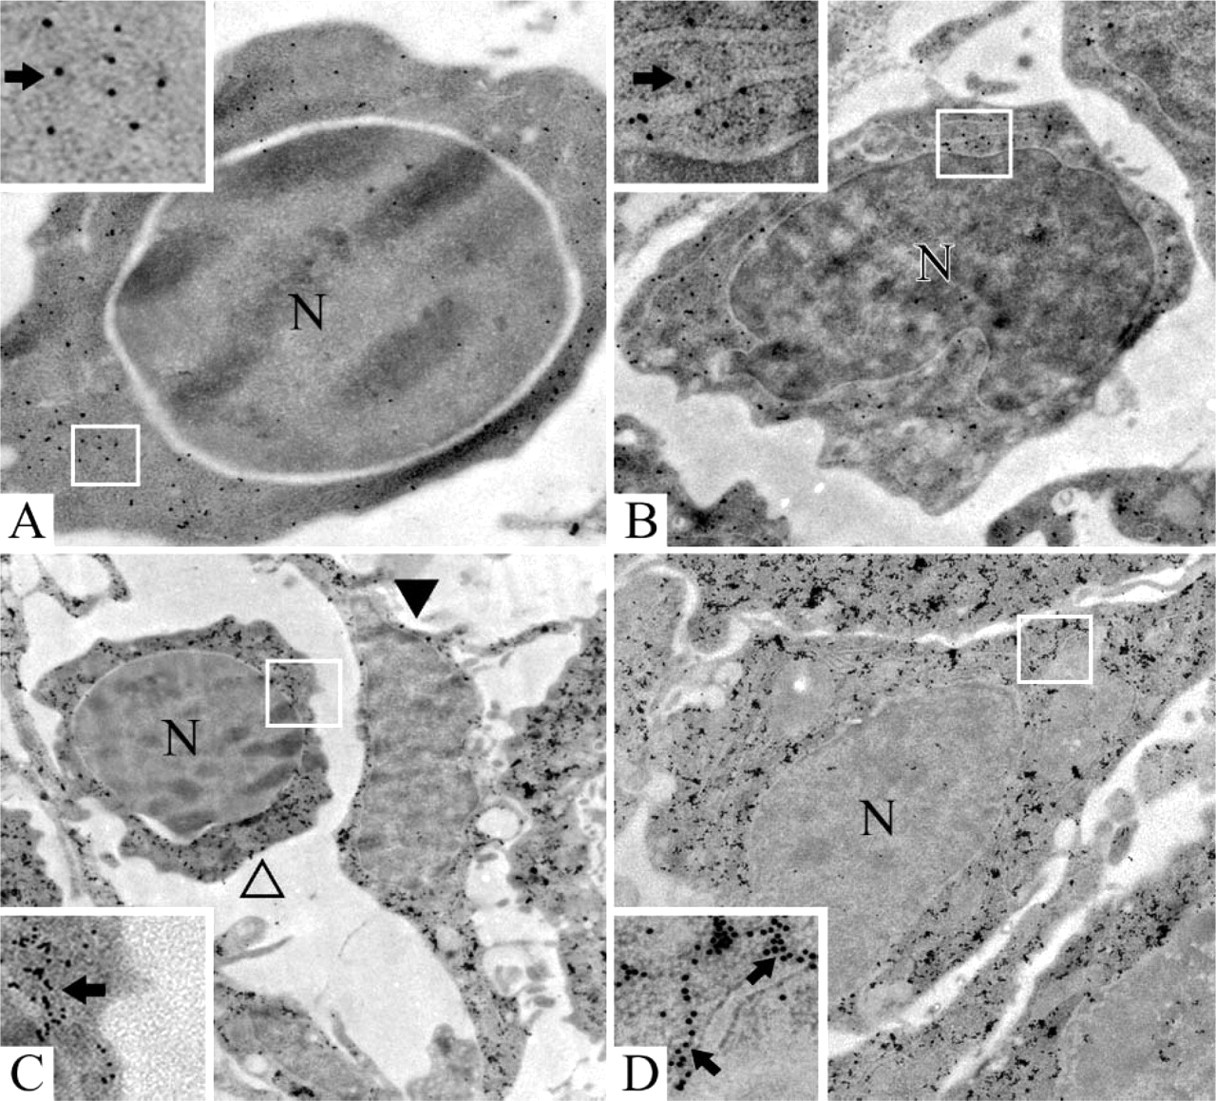
Electron microscopic in situ hybridization of nidogen-1 and nidogen-2 on prenatal days 12 and 14. Day 12, expression of nidogen-1 in an erythropoietic cell (
Immunohistochemical Detection of Nidogens
On day 12 of development, immunostaining of mouse liver sections showed only sparse nidogen-1 deposits mainly in the proximity of the microvessels (Figure 6A). In contrast, staining for nidogen-2 on day 12 was more continuous and ubiquitous (Figure 6B). On day 14, immunostaining for nidogen-1 (Figure 6C) was increased in comparison to day 12. Extracellular deposits in the parenchyma were visible, which were clearer in the regions adjacent to the microvessels. The staining pattern for nidogen-2 on day 14 (Figure 6D) was similar to that of nidogen-1. On day 16, in the parenchyma, weak extracellular staining for nidogen-1 (Figure 6E), as well as for nidogen-2 (Figure 6F), was present. In the anlagen of the portal spaces, on day 16 staining for both nidogen-1 (Figure 6G) and nidogen-2 (Figure 6H) was similarly distributed. Nidogen deposits were observed adjacent to the outer-limiting-plate hepatocytes and to the newly formed early bile ducts. The mesenchyme of the periportal matrix, as well as the lining of the portal branches, also showed positive staining. Negative controls did not show any staining for either nidogen-1 or nidogen-2 in any developmental stage investigated.
Discussion
In this study we investigated expression of nidogen-1 and nidogen-2 in liver development. We were able to show that transcripts for both proteins are present in developing liver parenchyma in all stages investigated. Also, in developing portal spaces first visible on day 16, expression for both nidogens was found in developing bile ducts, as well as in mesenchymal cells and endothelial cells. However, whereas the individual structures and cell types of the portal anlagen are also clearly recognizable light microscopically, in parenchymal areas the situation is different. Because of the strong hematopoietic activity of the developing liver already present on day 12, there are many densely packed cells in the parenchymal regions in which hepatic cells intermingle with hematopoietic precursors. Moreover, after light microscopic in situ hybridization, the cell limits do not always appear clearly delineated. However, on the basis of our light microscopic results, it is conceivable that hematopoietic precursors are involved in the production of both nidogens, as already postulated for nidogen-1 on day 12.5 (Thomas and Dziadek 1993). On the other hand, it is not always possible to properly define which cell type(s) in the parenchyma of the developing liver is (are) able to express nidogens. Therefore, to answer this question we carried out electron microscopic in situ hybridization. It was striking to observe that hepatocytes, precursors of stellate cells, endothelial cells and, most interestingly, hematopoietic cells expressed both nidogens during liver development. Nidogen-1 as well as nidogen-2 transcripts were seen both in precursors of the red lineage and of the white lineage as well as in megakaryoblasts.
Using real-time PCR, we found that between days 14 and 16, the relative expression of the two nidogens showed a quantitative decrease that paralleled the decrease of the hepatic hematopoietic activity (Sasaki and Iwatzuki 1997; Sasaki and Sonoda 2000). This would suggest that hematopoietic cells produce a considerable part of the hepatic nidogens.
By means of immunohistochemistry, we also show that both proteins are also produced and deposited in the extracellular matrix of the parenchyma and of the portal anlagen during mouse liver development.
It is conceivable that nidogens may be involved in the regulation of hepatic hematopoiesis. In fact, during embryogenesis the liver is one of the major organs of hematopoiesis (Asano et al. 1987; Timens and Kamps 1997). The different hematopoietic lineages begin to develop and differentiate from stem cells that migrate from the yolk sac. This process is highly ordered and under the regulatory control of the hematopoietic microenvironment (Moore and Metcalf 1970; Johnson and Moore 1975; Johnson and Metcalf 1978; Medlock and Haar 1983; Wolf et al. 1995; Palis and Yoder 2001). The biological role of the extracellular matrix in hematopoietic processes, in general, has been studied in bone marrow (Mayani et al. 1992; Gu et al. 2001). In contrast, no data on the role of ECM components in hepatic hematopoiesis are available. In bone marrow the hematopoietic microenvironment has been shown to act not only as a scaffold for the hematopoietic elements, but also to influence various cell biological functions such as adhesion and regulation of cell growth (Klein 1995). Several matrix components including type IV and type VI collagens, fibronectin, fibulin, laminin, and nidogen molecules have been found to be part of the hematopoietic microenvironment in the bone marrow (Klein et al. 1995; Gu et al. 1999; Siler et al. 2000; Gu et al. 2001). They are believed to play an important role in the regulation of hematopoietic processes by binding and stabilizing growth factors, by colocalizing with primitive stem cells, and by developing hematopoietic cells for specific microenvironmental niches (Clark et al. 1992; Hirsch et al. 1996). In vitro and in vivo data also support an important role of matrix proteins in the control of the hematopoietic function. For example, fibronectin, a major cell adhesive extracellular protein, has been found to affect survival and function of hematopoietic cells of several lineages (Klein 1995; Yoshikawa and Sakiyama 1996; Yokota et al. 1998). Knock-out of tenascin C in mice led to an impairment in erythropoiesis, suggesting that tenascin C may be involved as a cofactor that controls hematopoiesis in the bone marrow (Ohta et al. 1998). Furthermore, it is known that stem and progenitor cell populations from normal human bone marrow adhere to several laminin isoforms such as the laminins 8, 10, and 11, suggesting a significant role for such laminins for early hematopoiesis (Verfaillie et al. 1994; Klein 1995; Gu et al. 1999; Siler et al. 2000). Before the bone and bone marrow have developed, hematopoiesis takes place in the liver and spleen and, for a period of time, both the liver and the bone marrow concomitantly serve as hematopoietic organs (Kelemen et al. 1979; Kelemen and Janossa 1980). From these considerations, it is conceivable that extracellular matrix components may somehow take part in the control of liver hematopoiesis. We show here that nidogens are produced in the liver anlage and that hematopoietic cells belong to the sources of these glycoproteins.
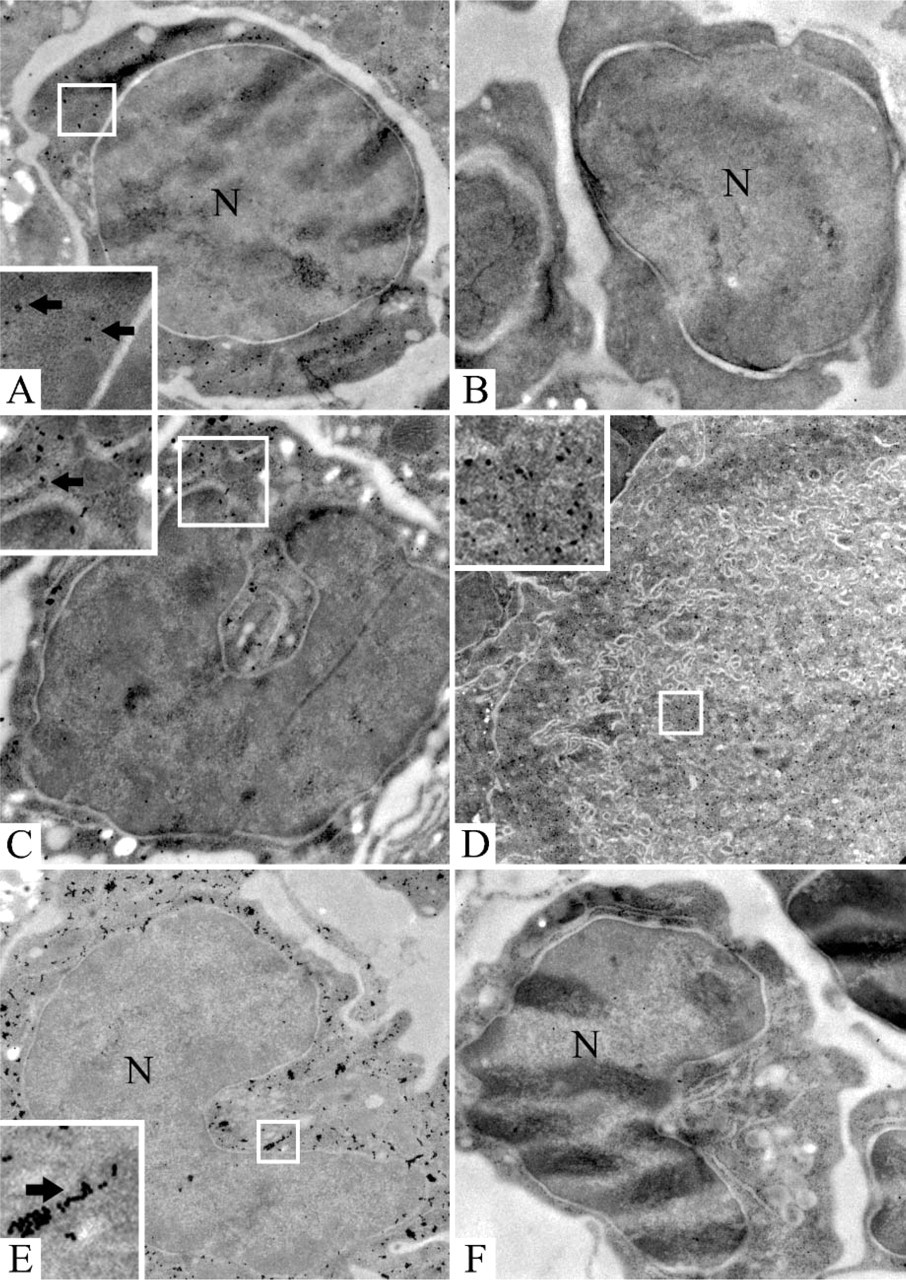
Electron microscopic in situ hybridization of nidogen-1 and nidogen-2 on prenatal day 16 (
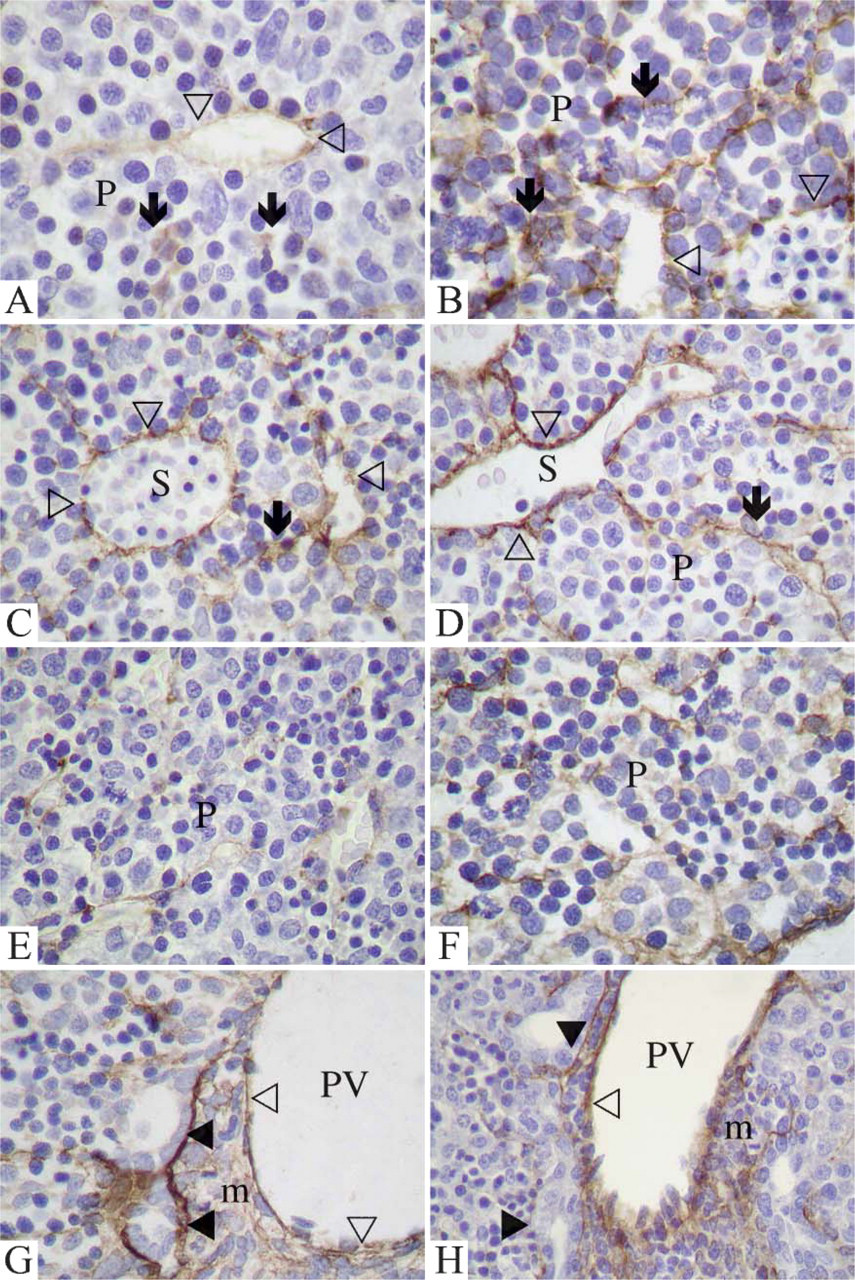
Light microscopic immunostaining for nidogen-1 and nidogen-2 during mouse liver development. On day 12 (
We also report that both hepatocytes and bile duct epithelium also express both nidogens. Nidogen expression was, for a long time, believed to be restricted to cells of mesenchymal origin (Thomas and Dziadek 1993; Ekblom et al. 1994). However, in a previous investigation we showed that in the mouse embryo on day 7 during the formation of the mesodermal sheath and thus before mesenchymal cells had differentiated, gene expression for nidogen-1 was present not only in mesodermal cells but also in cells of the ectodermal and endodermal layer (Miosge et al. 2000a). Data of the present work show that not only in early developmental stages, but also in later phases of development, cells of epithelial origin still retain the ability to express nidogen-1 and can also express nidogen-2.
Sinusoidal endothelial cells from adult liver were previously shown in vitro to produce several matrix components including nidogen molecules (Neubauer et al. 1999). On the other hand, stellate precursor cells in the adult liver have been identified as a major source of extracellular matrix components (Schwoegler et al. 1994; Li and Friedman 1999; Ramadori and Saile 2004). However, very little is known about the possible involvement of these cell types in the production of nidogens or matrix components, in general, during liver development. Morphological analysis suggested that these cells acquired a matrix-producing phenotype and may become functionally differentiated in later phases of liver development (Enzan et al. 1997). In our study, we show that transcripts for nidogen-1 and nidogen-2 are detectable in stellate cell precursors as well as in endothelial cells already on day 14. It is, therefore, conceivable that these cell types participate in nidogen production from relatively early stages.
Another possible explanation for the significance of the widespread expression of nidogens in the developing liver is that nidogen molecules could be released into the blood in the embryo and fetus, thus acting as plasma protein. This could be conceivable if one assumes that the matrix content in the parenchymal areas of the liver can be relatively limited and mainly restricted to the space of Disse, which during development is very narrow (Enzan et al. 1997). Therefore, one can assume that fetal and embryonic liver does not need the entire hepatic production of nidogens for itself, and hepatic cells may support nidogen production needed elsewhere. The fact that nidogen molecules interact with fibrinogen suggesting a role in hemostasis and wound healing (Wu and Chung 1991; Chung 1993) makes this hypothesis attractive.
Our results clearly show that both nidogens are produced, deposited in the matrix, and ubiquitously expressed in the developing liver, and that all hematopoietic cell lineages constitute a significant source of these glycoproteins. It will be of considerable interest to further examine the role of nidogens in hepatic hematopoiesis, as well as in other hematopoietic organs such as spleen and bone marrow, to gain further insight into the possible role of nidogens in the regulation of hematopoiesis and the switch from the hepatolineal phase of hematopoiesis to hematopoiesis in the bone marrow.
Footnotes
Acknowledgments
We dedicate this article to the memory of our Director and mentor Prof. Rainer Herken, who passed away unexpectedly during the period of submission of this article. We have lost a special person and feel an immense sorrow.
We also thank Berti Manshausen, Christina Zelent, Elke Heyder, Sonja Schwoch, and Rod Dungan for their excellent technical support and Cyrilla Maelicke, B.Sc., for editing the manuscript.