
Abstract
Autophagy is a regulated bulk degradation process involved in many different human pathologies. Transmission electron microscopy (TEM) is currently the only reliable method for monitoring autophagy in situ. Because TEM is labor intensive, we questioned whether useful marker proteins can be found for unambiguous detection of autophagy in tissue via routinely used colorimetric, immunohistochemical, or fluorescent techniques. Starved HepG2 hepatocytes and nutrient deprived liver tissue were used as a model for the initiation of autophagy. Our findings indicate that starvation-induced autophagy in HepG2 cells was associated neither with differential mRNA gene expression nor with changes in the expression level of known autophagy-related proteins. On the contrary, both transcription and translation were inhibited, suggesting that the identification of autophagy-specific biomarkers for tissue is highly compromised. Light chain 3 (LC3) protein, which is an attractive marker of autophagosomes, revealed a relatively low expression level in tissue and cultured cells, but could be detected via immunohistochemistry in liver from GFP-LC3 transgenic mice. The number of LC3 immunopositive dot-like structures was significantly upregulated in liver tissue from nutrient-deprived GFP-LC3 mice as compared with nonstarved control tissue. Our results suggest that LC3 immunostaining can be used as an alternative detection method for autophagy in situ, but only when this protein is overexpressed.
M
Recent reports indicate that autophagy plays a crucial role in many different pathologies (Cuervo 2004). Indeed, both activation and inactivation of autophagy could benefit cancer cells (Ogier-Denis and Codogno 2003). If cells cannot activate autophagy, protein synthesis predominates over protein degradation and tumor growth is stimulated. By contrast, autophagy could be activated in more advanced stages of cancer to guarantee survival of cells in low-vascularized tumors. Furthermore, alterations in the autophagic-lysosomal compartment have been linked to neuronal death in many neurodegenerative disorders (Nixon et al. 2001; Larsen and Sulzer 2002) as well as in transmissible neuronal pathologies (prion diseases) (Liberski et al. 2002). Activation of autophagy could also be an effective way of eliminating infectious agents that access the cytosol (Cuervo 2004). Finally, autophagic vacuoles have been reported frequently in cardiomyopathies (Tanaka et al. 2000; Kostin et al. 2003) or muscle cells exposed to different experimental settings (Martinet et al. 2004b; Mizushima et al. 2004). A recent in vivo analysis of autophagy in response to nutrient starvation using transgenic mice showed that the regulation of autophagy is not uniform, but is organ dependent (Mizushima et al. 2004). Autophagy was initiated in almost all organs, especially in muscle tissues such as the heart, but the patterns of response to starvation were significantly different among the tissues studied. Moreover, starvation-induced autophagy was not initiated in the brain, probably because the brain is not affected by food withdrawal.
Over the past decade, at least 14 autophagy (Atg) genes acting in a conjugated cascade have been identified in the yeast Saccharomyces cerevisiae (Thumm et al. 2003). More recently, mammalian homologs of some of the yeast autophagy proteins have been characterized. Beclin-1, for example, is a bcl-2-interacting protein with structural similarity to the yeast autophagy gene Atg6 (Aita et al. 1999). It is expressed ubiquitously at high levels, but is mono-allelically deleted in 40-75% of sporadic human breast cancers and ovarian cancers (Liang et al. 1999). Beclin-1 promotes autophagy in yeast and in human MCF-7 breast carcinoma cells (Liang et al. 1999). Other examples include autophagins-1 and −3 and microtubule-associated protein 1 light chain 3 (LC3), which are functional homologs of Atg4/Aut2 and Atg8/Aut7, respectively (Kabeya et al. 2000; Marino et al. 2003).
Because of a lack of good diagnostic methods, a systematic analysis describing where and when autophagy occurs in pathology has not been performed. To date, conventional electron microscopy is the standard method to monitor autophagy in tissue (Mizushima 2004). However, electron microscopy is labor-intensive and does not always allow good recognition of autophagic vacuoles from other cellular structures. In this study, we questioned whether useful marker proteins can be found for unambiguous detection of autophagy in tissue via routinely used colorimetric, immunohistochemical, or fluorescent techniques. We used hepatocytes and liver tissue as a model because hepatocytes rapidly turn on their autophagic-lysosomal degradation pathway upon starvation in an attempt to supply the organism (or medium) with amino acids (Mortimore et al. 1989). Our findings indicate that the identification of autophagy-specific biomarkers for tissue is highly compromised because of a lack of differential gene expression. LC3 can be used as a marker for autophagosome formation in situ but only when this protein is overexpressed (e.g., use of GFP-LC3 transgenic animals).
Materials and Methods
Antibodies
The following mouse monoclonal antibodies were used: anti-cathepsin D (clone 49) and anti-beclin 1 (clone 20) from BD Biosciences Transduction Laboratories (Lexington, KY), anti-ubiquitin (clone 6C1), anti-DAP kinase (clone DAPK-55), and anti-β-actin (clone AC-15) from Sigma (St Louis, MO) and anti-phospho-p70 S6 kinase (Thr389, clone 1A5) from Cell Signaling Technology (Beverly, MA). Rabbit polyclonal anti-p70 S6 kinase and anti-dinitrophenyl antibodies were purchased from Cell Signaling Technology and Molecular Probes (Eugene, OR), respectively. Anti-LC3 polyclonal antibody, raised against a synthetic peptide that corresponds with the N-terminal 14 amino acids of human and mouse LC3 followed by an additional cysteine (H2N-PSDRPFKQRRSFADCCONH2), was prepared by Eurogentec (Seraing, Belgium) in rats and affinity purified on an immobilized peptide-Sepharose column. Rabbit anti-mouse, swine anti-rabbit, and rabbit anti-rat peroxidase-conjugated secondary antibodies were purchased from DAKO (Glostrup, Denmark). For immunofluorescence microscopy, Cy3-conjugated goat anti-rat IgG (Jackson Immunoresearch Laboratories; West Grove, PA) was used.
Cell Culture
Human HepG2 hepatocytes and mouse F9 teratocarcinoma cells (American Type Culture Collection; Manassas, VA) were grown in DMEM supplemented with 100 U/ml penicillin, 100 μg/ml streptomycin, 50 μg/ml gentamicin, 20 U/ml polymyxin B, and 10% FBS. Autophagy was induced by amino acid deprivation in Earle's Balanced Salt Solution (EBSS) for different time points. After induction of autophagy, acidic compartments were labeled by incubating the cells with 5 μM N-(3-((2, 4-dinitrophenyl)amino)propyl)-N-(3-aminopropyl)-methylamine) (DAMP; Molecular Probes) in EBSS for 30 min at 37C. After incubation, cells were fixed in 4% paraformaldehyde for 10 min. Subsequently, cells were permeabilized in TBS pH 7.6 containing 0.1% Triton X-100 for 5 min and immunocytochemically stained with anti-dinitrophenyl antibody. Besides DAMP, cells were labeled with 75 nM Lyso-Tracker for 30 min at 37C followed by fluorescence microscopy.
To examine de novo protein synthesis, cells were incubated for 30 min with 10 μCi L-[35S] cysteine (Amersham Biosciences; Rainham, UK) in EBSS and lysed in Laemmli sample buffer (BioRad; Richmond, CA). Radiolabeled proteins were separated on a SDS-polyacrylamide gel and signals were visualized using a PhosphorImager (Molecular Dynamics; Sunnyvale, CA).
Bulk degradation of long-lived proteins was determined according to a method previously reported (Furuta et al. 2004). Briefly, cells were plated into 35-mm dishes and cultured in cysteine/methionine free media containing 5 μCi L-[35S]cysteine/methionine for 6 hr at 37C. Unincorporated radioisotopes and degraded amino acids released from short-lived proteins were removed by rinsing three times with PBS. Cells were then chased with the culture medium containing 10% fetal calf serum and 2 mM cold cysteine/methionine. After 12 hr of incubation, at which time short-lived proteins were being degraded, the chase medium was replaced with DMEM containing serum or EBSS. After incubation at 37C for 4 hr, the medium was harvested and 100% TCA was added to 10% final concentration. The samples were centrifuged at 12,000 $4 g for 10 min and the acid-soluble radioactivity was measured by liquid scintillation counting. Meanwhile, the cells were fixed by adding 1 ml of 10% TCA directly to the culture dishes, washed with 10% TCA, and dissolved in 1 ml of 0.2 N NaOH. Radioactivity in the samples was measured similarly. The percentage protein degradation was calculated by dividing the amount of acid-soluble radioactivity in the culture medium by the sum of acid-soluble and acid-precipitable radioactivities.
To examine genomic DNA, 106 cells were lysed in 0.5 ml hypotonic lysis buffer (10 mM Tris, 1 mM EDTA, 0.2% Triton X-100) supplemented with 250 μg proteinase K. Lysates were incubated for 1 hr at 50C, then supplemented with 5 μl volumes of DNase-free RNase A (2 mg/ml) and incubated for an additional hour at 37C. DNA samples were precipitated with isopropanol and loaded on 2% agarose gels. DNA was visualized under ultraviolet light by staining the agarose gel with ethidium bromide.
Microarray and cDNA Expression Array Analysis
Total RNA and mRNA was isolated from HepG2 cells using the StrataPrep Total RNA Microprep Kit (Stratagene; La Jolla, CA) and FastTrack 2.0 Kit (Invitrogen; San Diego, CA), respectively. The integrity of purified RNA was verified on an Agilent 2100 Bioanalyzer using the RNA 6000 Nano LabChip Kit (Agilent Technologies; Palo Alto, CA). Probe mixtures for cDNA expression array analysis were synthesized by reverse transcribing 5 μg total RNA using Superscript II reverse transcriptase (Invitrogen), cDNA synthesis primer mix (BD Biosciences ClonTech), and [α-32P] dATP. To prepare probes for microarray analysis, 1 μg mRNA was reverse transcribed using Superscript II reverse transcriptase (Invitrogen), random primer mix (N-15, BD Biosciences ClonTech), and [α-33P] dATP. Hybridization experiments were performed with the Atlas Human Stress Array (234 genes) and Atlas Human Plastic Array (11,835 genes) (both purchased from BD Biosciences Clontech). After extensive washes, the membranes were analyzed by PhosphorImaging (Molecular Dynamics). Data were analyzed using AtlasImage 2.0 software (BD Biosciences ClonTech). Normalization of the signal intensity between two arrays was based on the overall value of all the genes on the arrays (global normalization). Weak signals were filtered out by applying a background-based signal threshold of 200%. To define differential gene induction, we used a 3-fold threshold value. Array reproducibility was determined using two independent assays.
Real-time Quantitative RT-PCR Analysis of LC3
Relative abundance of LC3 mRNA was assessed using the 5’ fluorogenic nuclease assay (TaqMan) on an ABIPrism 7700 sequence detector system (Applied Biosystems; Foster City, CA). PCR primers 5'-ATGTCAACATGAGCGAGTTGGT-3’ and 5'-CTGGTTCACCAGCAGGAAGAA-3’ as well as the fluorogenic probe 5'-AAGATCATCCGGCGCCGCC-3’ were designed using Primer Express software (Applied Bio-systems). The probe was 5'-FAM (reporter) and 3'-TAMRA (quencher) labeled. Total RNA was prepared from HepG2 cells using the Absolutely RNA Microprep Kit (Stratagene). All RNA samples were treated with RNase-free DNase I (Invitrogen). Quantitative RT-PCR was performed in duplicate in 25 μl reaction volumes consisting of 1× Master Mix and 1× Multiscribe and RNase inhibitor Mix (TaqMan One Step PCR Master Mix Reagents Kit; Applied Biosystems). PCR cycling parameters were: reverse transcription at 48C for 30 min, inactivation of RT at 95C for 10 min, followed by 40 cycles consisting of incubations at 95C for 15 sec and 60C for 1 min. Relative expression of mRNA species was calculated using the comparative CT method. All data were controlled for quantity of RNA input by performing measurements on the endogenous reference gene β-actin (Taqman β-actin detection reagent; Applied Biosystems).
SDS-PAGE, Immunoblot, and Tissue Lysate Array Analysis
HepG2 or F9 cells were lysed in an appropriate volume of Laemmli sample buffer (BioRad). Cell lysates were then heat-denatured for 4 min in boiling water and loaded on a 12.5% SDS gel. After electrophoresis, proteins were either stained with Coomassie Brilliant Blue R 250 or transferred to an Immobilon-P Transfer Membrane (Millipore; Bedford, MA; pore size 0.45 μm) according to standard procedures. Membranes were blocked in TBS containing 0.05% Tween-20 (TBS-T) and 5% nonfat dry milk (BioRad) for 1 hr. After blocking, membranes were probed overnight at 4C with primary antibodies in antibody dilution buffer (TBS-T containing 1% nonfat dry milk), followed by 1 hr incubation with secondary antibody for 1 hr at room temperature. Antibody detection was accomplished with SuperSignal West Pico Chemiluminescent Substrate (Pierce; Rockford, IL) using a Lumi-Imager (Roche Diagnostics; Mannheim, Germany). In some experiments, a highly sensitive Western blot protocol (Martinet et al. 2004a) was used to detect poorly expressed LC3. A tissue lysate array analysis was performed with the DiscoverLight human normal and tumor tissue lysate array kit (Pierce) according to the manufacturer's instructions.
Animals and Tissue Processing
Pathogen-free C57BL/6 mice and heterozygous GFP-LC3 transgenic mice (strain GFP-LC3#53) (RIKEN BioResource Center; Koyadai, Japan) containing a rat LC3-eGFP fusion under control of the chicken β-actin promoter (Mizushima et al. 2004) were housed in a temperature-controlled environment with 12-hr light/dark cycles where they received food and water ad libitum. Genotyping of GFP-LC3 offspring was carried out by PCR analysis using GFP-LC3 primers (5'-TCCTGCTGGAGTTCGTGACCG-3’ and 5'-TTGCGAATTCTCAGCCGTCTTCATCTCTCTCGC-3’ [yielding a 400-bp PCR product]) and mouse LC3 internal control primers (5'-TGAGCGAGCTCATCAAGATAATCAGGT-3’ and 5'-GTTAGCATTGAGCTGCAAGCGCCGTCT-3’ [yielding a 500-bp PCR product]). For starvation studies, mice (8-10 weeks of age) were deprived of food for 24 or 48 hr in metabolic cages, but had free access to drinking water. Mice were anesthetized with diethyl ether and immediately fixed by perfusion with 4% paraformaldehyde in 0.1 M sodium phosphate buffer (pH 7.4). Liver tissue was harvested and further fixed with the same fixative for at least 4 hr, followed by treatment with 30% sucrose at 4C in PBS overnight. Tissue samples were embedded in Tissue-Tek OCT compound using liquid nitrogen and stored at −80C. The studies were approved by the Ethical Committee of the University of Antwerp.
Fluorescence Microscopy of Tissue Sections or Cultured Cells Overexpressing GFP-LC3
For examination of GFP fluorescence, liver samples were sectioned at 10 μm thickness with a cryostat, stained with Hoechst 33,342 (1:2000 dilution, 5 min; Molecular Probes) and mounted using SlowFade antifade kit (Molecular Probes). To study LC3 immunofluorescence, cryosections (8 μm thick) were incubated overnight with primary rat anti-LC3 antibody, rinsed with PBS and incubated with goat anti-rat Cy3-conjugated secondary antibody (1:500 dilution, 2 hr). Finally, sections were stained with Hoechst 33,342 and mounted.
Cultured F9 cells were fixed in ice-cold methanol for 10 min at −20C, rinsed with PBS (3 × 10 min) and treated with 0.5% Triton X-100 for 5 min. Subsequently, cells were stained with Hoechst 33,342 as described for liver cryosections (vide supra). Multichannel images were taken with an AxioPlan-2 fluorescence microscope equipped with an ApoTome (Zeiss; Oberkochen, Germany) and analyzed with AxioVision 4.3 software (Zeiss).
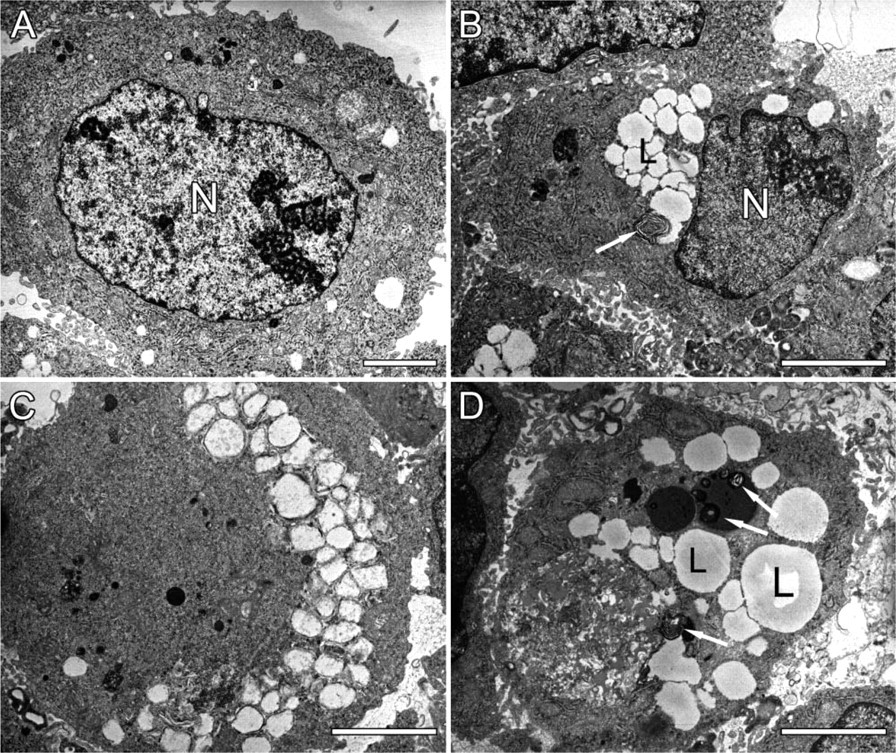
Ultrastructural features of human HepG2 cells treated with Earle's Balanced Salt Solution (EBSS) for 12 hr. (
Electron Microscopy
Samples were fixed in 0.1 M sodium cacodylate-buffered (pH 7.4) 2.5% glutaraldehyde solution for 2 hr and post-fixed in 0.1 M sodium cacodylate-buffered (pH 7.4) 1% OsO4 solution for 1 hr. After dehydration in an ethanol gradient (70% ethanol [20 min], 96% ethanol [20 min], 100% ethanol [2 × 20 min]), samples were incubated with propyleneoxid (2 × 10 min), impregnated with a mixture of propylenoid/LX-112 (1:1; Ladd Research Industries, Williston, VT) and embedded in LX-112. Ultrathin sections were stained with uranyl acetate and lead citrate. Sections were examined in a Jeol-100 CX II transmission electron microscopy (TEM) at 80 kV. Photographs were made with electron microscopy film 4489 Estar Thick Base (Kodak; Rochester, NY).
Results
Identification of Potential Biomarkers for Autophagy in Starved HepG2 Cells
Because amino acid deprivation is a powerful inducer of autophagy (Munafo and Colombo 2001), human HepG2 cells were incubated in EBSS for different time points. Transmission electron microscopic analysis of cells treated with EBSS for 12 hr revealed extensive vacuolization, formation of membranous whorls (also called myelin figures), and depletion of organelles, which are hallmarks of autophagy (Figures 1B-1D). Untreated controls showed a normal cell morphology (Figure 1A). Initiation of autophagy was associated with an accumulation of lipid droplets in the cytoplasm (fatty change of hepatocytes) (Figures 1B-1D). This event is due to a decline in protein synthesis (vide infra) that blocks the utilization of lipids for lipid-protein conjugation and is typical of hepatocytes undergoing cellular stress (Constantinides 1984). Increased levels of acidic organelles in EBSS-treated HepG2 cells were also demonstrated by incubating cells with the acidic organelle probe DAMP, followed by immunocytochemical detection of incorporated DAMP with an anti-dinitrophenyl antibody (Figures 2A and 2B), or by labeling cells with LysoTracker (Figures 2C and 2D). Oil red O staining endorsed foam cell formation (Figures 2E and 2F). SDS-PAGE of HepG2 cell lysates and Coomassie staining of electrophorized protein samples showed a prominent decline in cellular protein content 8-48 hr after amino acid deprivation (Figure 3A). This may be related to bulk degradation of long-lived proteins (3.0 ± 0.2% after incubation in DMEM for 4 hr versus 5.0 ± 0.1% after incubation in EBSS for 4 hr), but could also result from downregulation of the translational machinery because de novo protein synthesis was significantly inhibited 4 hr after EBSS treatment (Figure 3B). Moreover, p70 S6 kinase, which is involved in the regulation of protein synthesis by phosphorylating the ribosomal protein S6, was deactivated upon starvation by dephosphorylation (Figure 3C). Because autophagy is a normal physiological process that does not necessarily lead to cell death (Lockshin and Zakeri 2004), we were not able to detect substantial cell loss during the 0-48 hr starvation period. However, to ascertain that the decreased protein content represents autophagy-specific effects and not initiation of cell necrosis associated with release of protein in the culture medium, HepG2 cells were stained for 5 sec with eosin. Starved HepG2 (Figure 3E) were less intensely stained as compared with untreated controls (Figure 3D). Furthermore, agarose gel electrophoresis did not show significant changes in genomic DNA content during EBSS treatment (Figure 3A). In addition to decreased protein levels, a progressive decline in RNA content was noticed by capillary electrophoresis of total RNA (Figure 4). To further characterize starvation induced autophagy in HepG2 cells at the RNA level, transcript levels of 234 stress-related genes were analyzed 4 hr after starvation using cDNA expression arrays. Although the overall signal intensity of the different gene spots on the arrays was lower in the starvation group versus controls, none of the stress-related genes was differentially expressed after normalization (data not shown). Similar results were obtained with an oligonucleotide-based microarray containing 11,835 genes. Western blot analysis of proteins known to be involved in the autophagic process such as beclin 1 (Liang et al. 1999), ubiquitin (Schwartz et al. 1988; Kostin et al. 2003; Martinet et al. 2004b), cathepsin D (Uchiyama 2001), or DAP kinase (Inbal et al. 2002), did not indicate significant changes in expression level during EBSS treatment (data not shown).
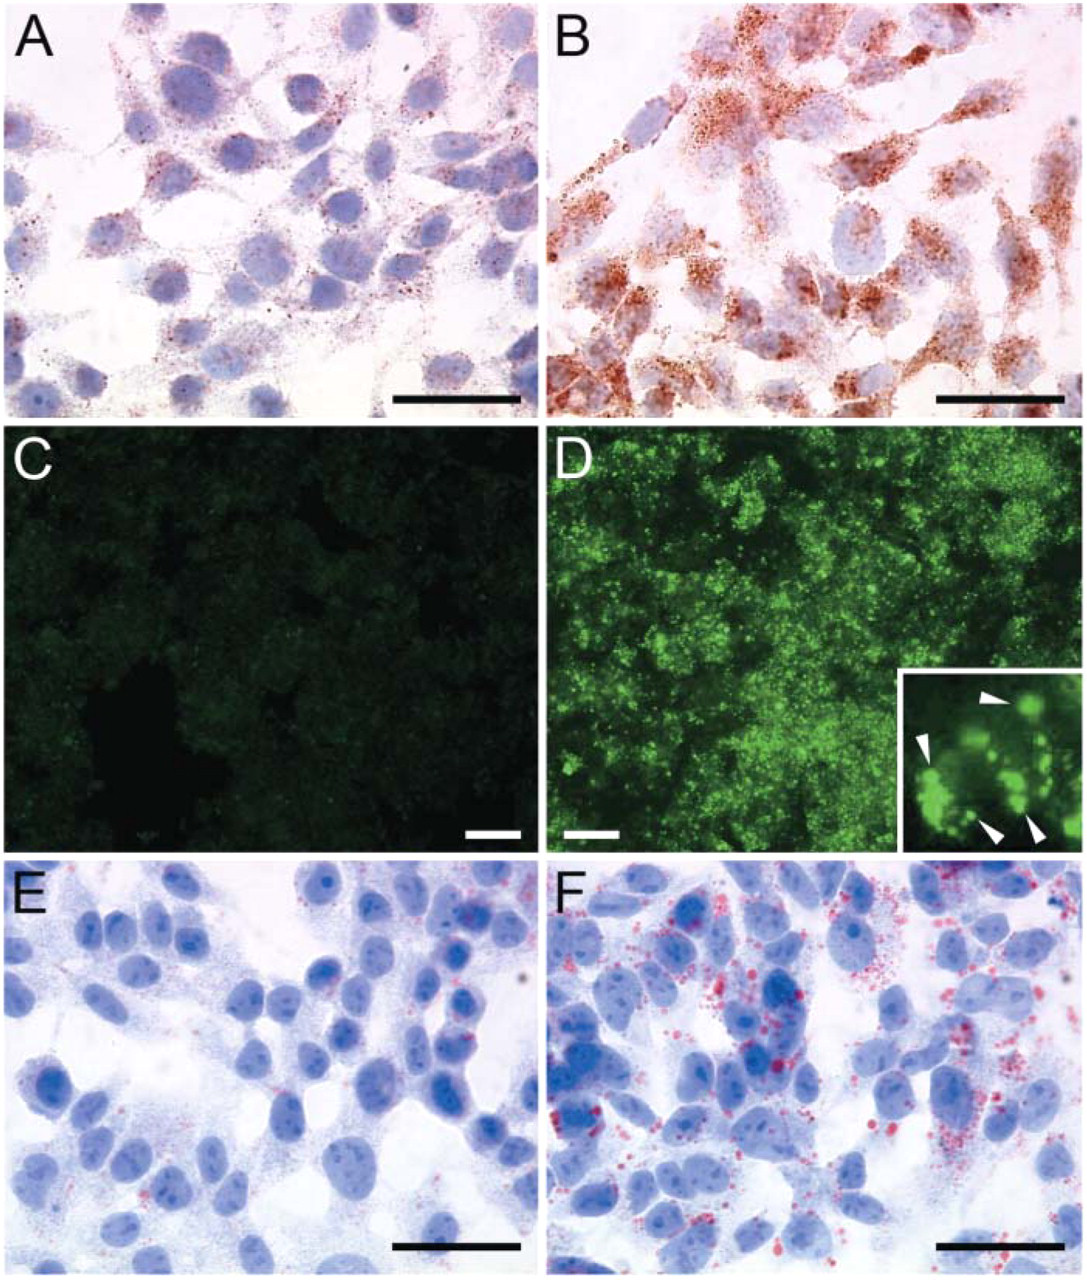
Accumulation of acidic organelles and lipid droplets in HepG2 cells after amino acid deprivation. HepG2 cells were incubated in DMEM (+10% serum) (
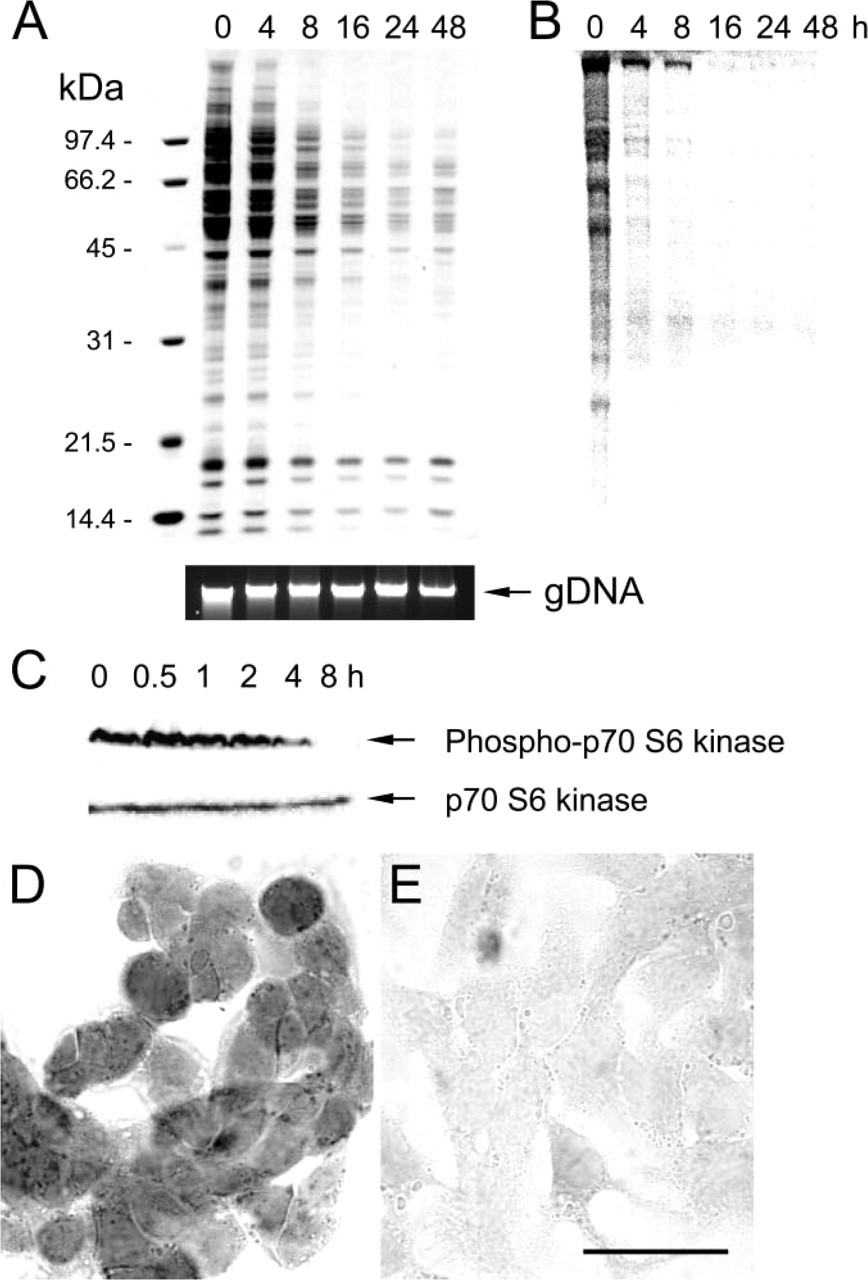
Decline in total protein content after amino acid deprivation of HepG2 cells. (
LC3 as a Potential Biomarker for Autophagy
Mammalian LC3 is an attractive biomarker for autophagy because it functions at least in part as a structural component during autophagosome formation (Kabeya et al. 2000). Moreover, the yeast Atg8/aut7 homolog is the only gene known to be highly upregulated under starvation conditions (Huang et al. 2000). Real-time RT-PCR analysis of LC3 mRNA isolated from EBSS-treated HepG2 revealed a weak upregulation (up to 3-fold) 4–16 hr after starvation. A human tissue lysate array probed with anti-LC3 antibody showed that LC3 protein expression in tissue was almost indistinguishable from background and thus difficult to detect. Moreover, conventional Western blotting of cultured cells indicated that detection of endogenous LC3 expression often required highly sensitive Western blot detection methods (Martinet et al. 2004a). Immunofluorescent staining of cells generally did not yield acceptable staining. Therefore, to evaluate LC3 as a biomarker for autophagy in cultured cells and tissue, overexpression of LC3 was recommendable. Pilot transfection experiments with HepG2 cells showed that they were not suitable for LC3 gene transfer because LC3 protein, in contrast to GFP protein (used here to evaluate transfection efficiency), was rapidly degraded after transfection. However, Western blot analysis of F9 cells stably overexpressing GFP-LC3 showed conversion of cytosolic LC3-I (18 kDa) into the autophagosome-specific isoform LC3-II (16 kDa) 2 hr after incubation in EBSS (Figure 5A). Subsequently, expression and localization of GFP-LC3 in these cells was examined by fluorescence microscopy. In contrast to cells grown in nutrient-rich medium (DMEM + 10% serum) showing diffuse GFP-LC3 expression in the cytoplasm (Figure 5B), cells incubated in EBSS for 2 hr contained many intense dot-like GFP-LC3 structures (Figure 5C). Flow cytometric analysis of GFP in starved GFP-LC3 overexpressing F9 cells did not reveal a significant upregulation of fluorescent signal versus nonstarved cells (Figure 5D). On the contrary, prolonged incubation in EBSS resulted in decreased GFP fluorescence, which is most likely due to proteolytic degradation of LC3 during the autophagic process.
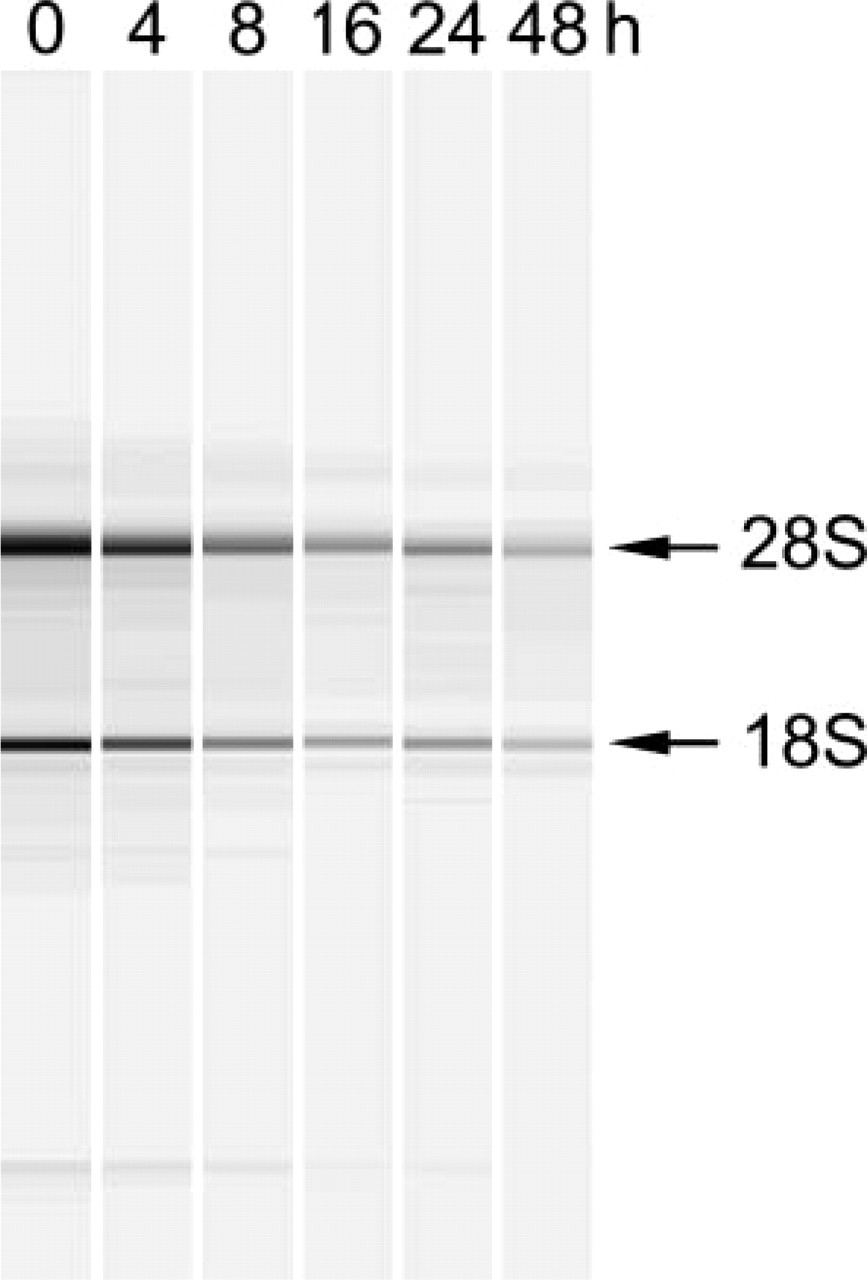
Decline in total RNA content after amino acid deprivation of HepG2 cells. Total RNA was isolated from starved HepG2 cells (0–48 hr) and analyzed by capillary electrophoresis.
To validate LC3 as a potential biomarker for autophagy in situ, C57BL/6 mice and transgenic mice systemically overexpressing GFP-LC3 underwent nutrient starvation for 24 or 48 hr. In these time spans, the animals lost approximately one-fifth and one-fourth of their body weight, respectively. One of the most striking morphological events that occurred during starvation was the “fatty change” (lipid accumulation) of the liver (Figure 6). Besides accumulation of lipid droplets, many autophagic vesicles could be found by electron microscopy in starved hepatocytes (Figure 7), but not in control liver (not shown). Liver tissue did not allow a reliable detection of GFP expression in consequence of strong background fluorescence in the green channel. In the red channel, however, used here to detect LC3 immunofluorescence, autofluorescent signals were minimal. Accordingly, a diffuse LC3 signal as well as few intense dot-like LC3 structures could be found in liver of fed mice (Figure 8A). The number of LC3 dots clearly increased after 24 hr (Figure 8B) and 48 hr starvation (Figure 8C). These LC3 dots could not be identified in hepatocytes of mice that did not overexpress GFP-LC3, even after 48 hr starvation (Figure 8D).
Discussion
Several lines of evidence indicate that amino acid deprivation of tissue or cultured cells leads to autophagy or self-cannibalism of some parts of the cell so that the energy and the building blocks they contain can make it possible for the rest of the cell to survive a little longer (Bursch 2001; Gozuacik and Kimchi 2004; Levine and Klionsky 2004; Yoshimori 2004). From this perspective, autophagic vacuolization reflects an adaptive survival mechanism to maintain the functional status of the cell under stress. However, when cellular distress persists, the capacity of the cell to compromise or sacrifice further cytoplasmic substances becomes exhausted so that autophagic cell death (also known as type II programmed cell death) may occur.
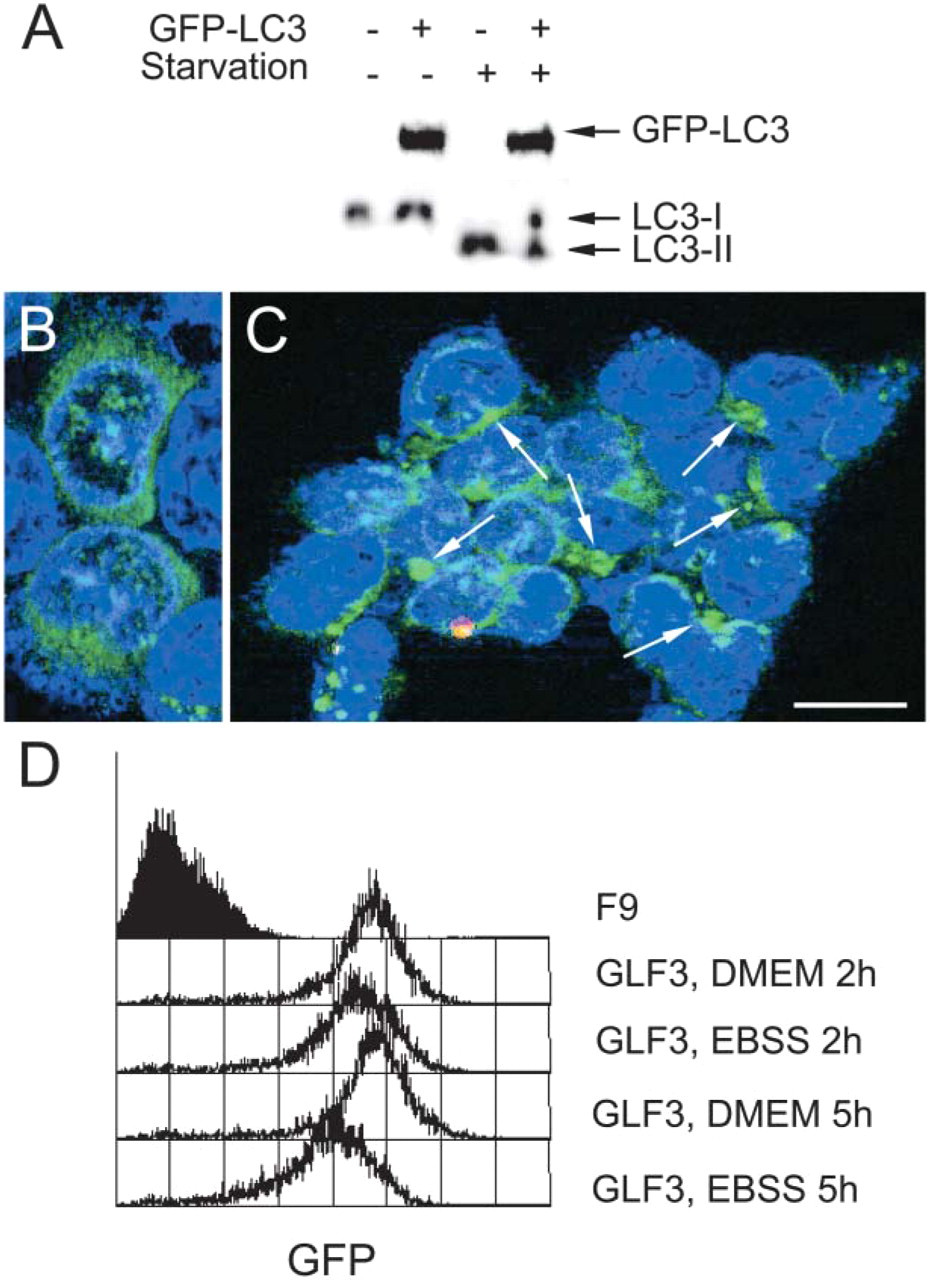
GFP-LC3 expression in mouse F9 teratocarcinoma cells before and after amino acid deprivation. (
The term “programmed” is often interpreted as if death is a consequence of the activation of a genome-encoded biochemical pathway for cell suicide. Consequently, upregulation of specific proteins during starvation, coupled with other changes in gene expression, may be a hypothetical but plausible mechanism for the induction of autophagy. If true, these differences in gene expression are useful as potential biomarkers for autophagy and may represent an attractive alternative for electron microscopy, which is currently the golden standard for detection of autophagy in situ. In this study, however, in vitro experiments with HepG2 cells demonstrated that starvation-induced autophagy is associated neither with differential mRNA gene expression nor with changes in the expression level of known autophagy-related proteins such as beclin 1 (Liang et al. 1999), ubiquitin (Schwartz et al. 1988; Kostin et al. 2003; Martinet et al. 2004b), cathepsin D (Uchiyama 2001), and DAP kinase (Inbal et al. 2002). On the contrary, our findings indicate that both transcription and translation were inhibited (reduced de novo protein synthesis, decline in total protein and RNA content, dephosphorylation of p70 S6 kinase), probably to save energy and cellular reserves. In this regard, identification of autophagy-specific biomarkers for tissue seems difficult to accomplish. Our findings are in accordance with previous studies in yeast showing that rapamycin-induced autophagy takes place in the absence of de novo protein synthesis (Abeliovich et al. 2000) and that transcription of rRNA and ribosomal protein genes is repressed upon rapamycin treatment (Zaragoza et al. 1998; Powers and Walters 1999). It should be noted, however, that absence of differential gene expression is not a general feature of non-starvation induced autophagy, because upregulation of ubiquitin, BNIP3, and several stress genes (70 kDa heat shock protein 1, heme oxygenase 1, and growth arrest and DNA damage-inducible protein 153) has recently been reported (Martinet et al. 2004b; Kanzawa et al. 2005). Besides lack of differential gene expression, another aspect that complicates in situ detection of autophagy is that most biochemical methods previously developed to monitor autophagy (e.g., measurement of bulk degradation of long-lived proteins or delivery of cytosolic material to lysosomes) require living cells. From this perspective, only morphologic methods might provide a useful alternative to TEM.
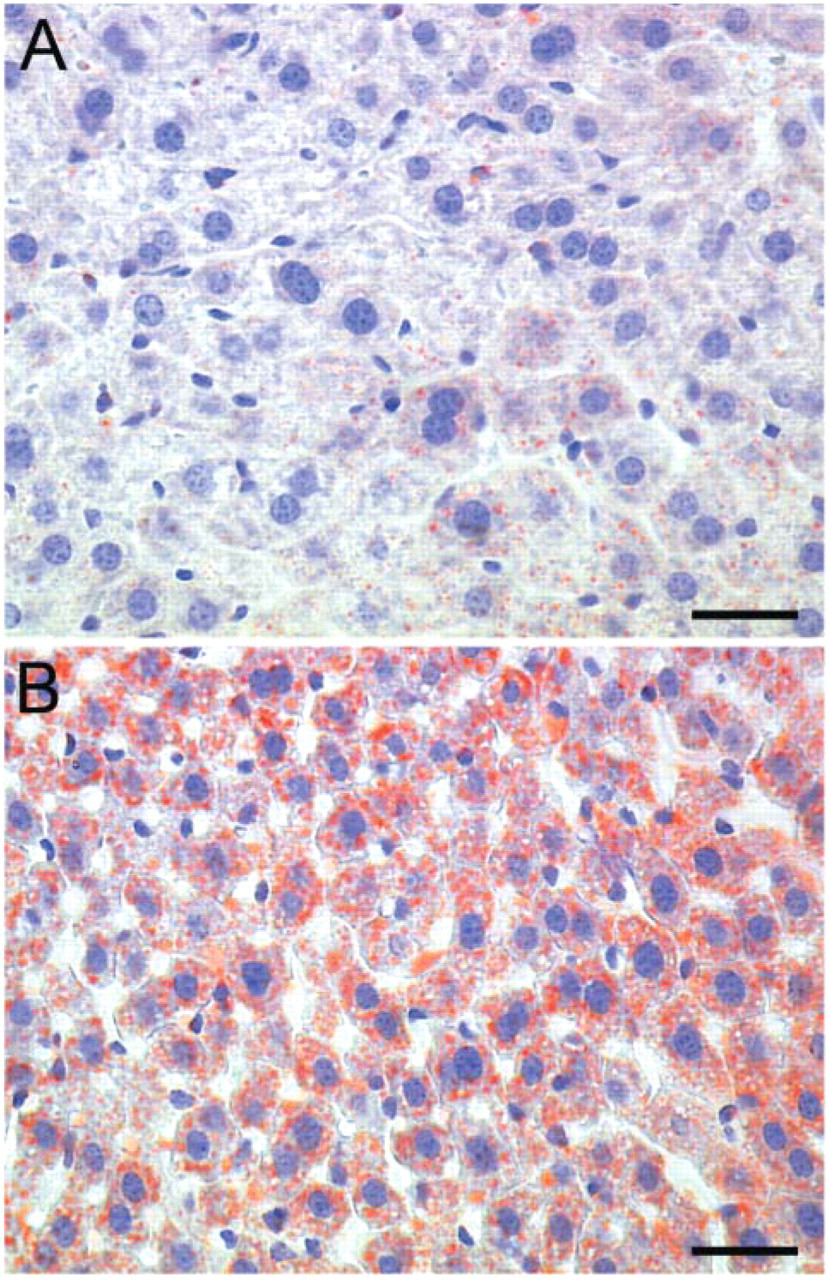
Fatty change of liver tissue as demonstrated by oil red O staining before (
Formation of autophagosomes is a unique morphological feature of autophagy (Mizushima et al. 2002). In many autophagic dying cells, the total area of autophagic vacuoles is roughly equal to, or greater, than that of the cytosol and organelles outside the vacuoles (Clarke 1990). It is therefore not surprising that in addition to conventional electron microscopy some alternative autophagy detection methods were developed that are based on autophagosome formation. First, the autofluorescent compound monodansylcadaverine (MDC) has been proposed as a tracer for autophagic vacuoles (Biederbick et al. 1995). However, MDC is not a specific marker for autophagic vacuoles even though some MDC positive structures indeed represent autolysosomes and the number of MDC dots may correlate with autophagic activity (Mizushima 2004). A significant number of MDC positive dots could be identified in an Atg5-deficient mouse embryonic stem cell line, which is defective in autophagic activity (Mizushima et al. 2001). Moreover, the in vivo fluorescence properties of MDC do not depend exclusively on accumulation in acidic compartments, but also on an effective interaction of this molecule with autophagic vacuole membrane lipids (Niemann et al. 2000). Second, acidic organelle probes such as DAMP and LysoTracker have been used to label autophagosomes (Dunn 1990; Martinet et al. 2004b). A disadvantage of these markers is that staining is only obtained when the target compartments are acidic (autophagosomes are not generally acidic) (Mizushima 2004) and that all acidic compartments (e.g., endosomes, lysosomes, and autophagic vacuoles) are labeled. It should also be noted that both MDC and acidic organelle probes cannot be used to stain autophagosomes in frozen or paraffin-embedded tissue as these compounds require active uptake inside the cell. To date, LC3, a mammalian homolog of yeast Atg8, is the only reliable marker of autophagosomes (Yoshimori 2004). Newly synthesized LC3 is immediately processed by mammalian Atg4 and is present in the cytosol as LC3-I (Hemelaar et al. 2003). When autophagy is induced, a series of ubiquitination-like reactions are catalyzed by Atg7 and Atg3, which convert LC3-I into LC3-II (Tanida et al. 2001, 2002). Recent immunoelectron microscopy studies demonstrated that LC3-II localizes on autophagic membranes, but not on other membrane structures (Kabeya et al. 2000). As shown in this study as well as in others (Kabeya et al. 2000; Gozuacik and Kimchi 2004; Martinet et al. 2004b; Mizushima 2004), immunoblotting of LC3 usually gives two bands: LC3-I (18 kDa) and LC3-II (16 kDa). The amount of LC3-II correlates well with the number of autophagosomes (Kabeya et al. 2000). One of the disadvantages of this method, as shown here, is the relatively low expression level of LC3 in tissue and many commonly used cell lines. To overcome LC3 detection problems, we used cell lines overexpressing GFP-LC3 or GFP-LC3 transgenic mice. In contrast with cells grown in nutrient-rich medium, starved cells overexpressing GFP-LC3 showed processing of LC3-I into the autophagosome-specific LC3-II. This event was associated with formation of many intense dot-like structures in the cytoplasm of starved cells, representing isolation membranes and autophagosomes. Similar dot-like structures were found in livers of GFP-LC3 transgenic mice after immunostaining tissue sections for LC3, suggesting that LC3 immunostaining may serve as an in situ detection method for initiation of autophagy. Flow cytometric analysis of GFP in starved GFP-LC3 over-expressing cells versus nonstarved cells showed that the global intracellular GFP intensity did not increase during starvation, but that intense fluorescent dots were formed because GFP-LC3 protein relocalized and clustered in the cytoplasm to autophagic membranes. It should be noted that the half-life of LC3-II is relatively short because autophagomes are transient structures. Therefore, LC3-II dots represent the autophagic activity at that moment. It does not indicate the magnitude of the flux through the autophagic pathway. Moreover, most GFP-LC3 dots represent isolation membranes and autophagosomes, but not autolysosomes. Therefore, GFP-LC3 dots do not guarantee autophagic degradation.
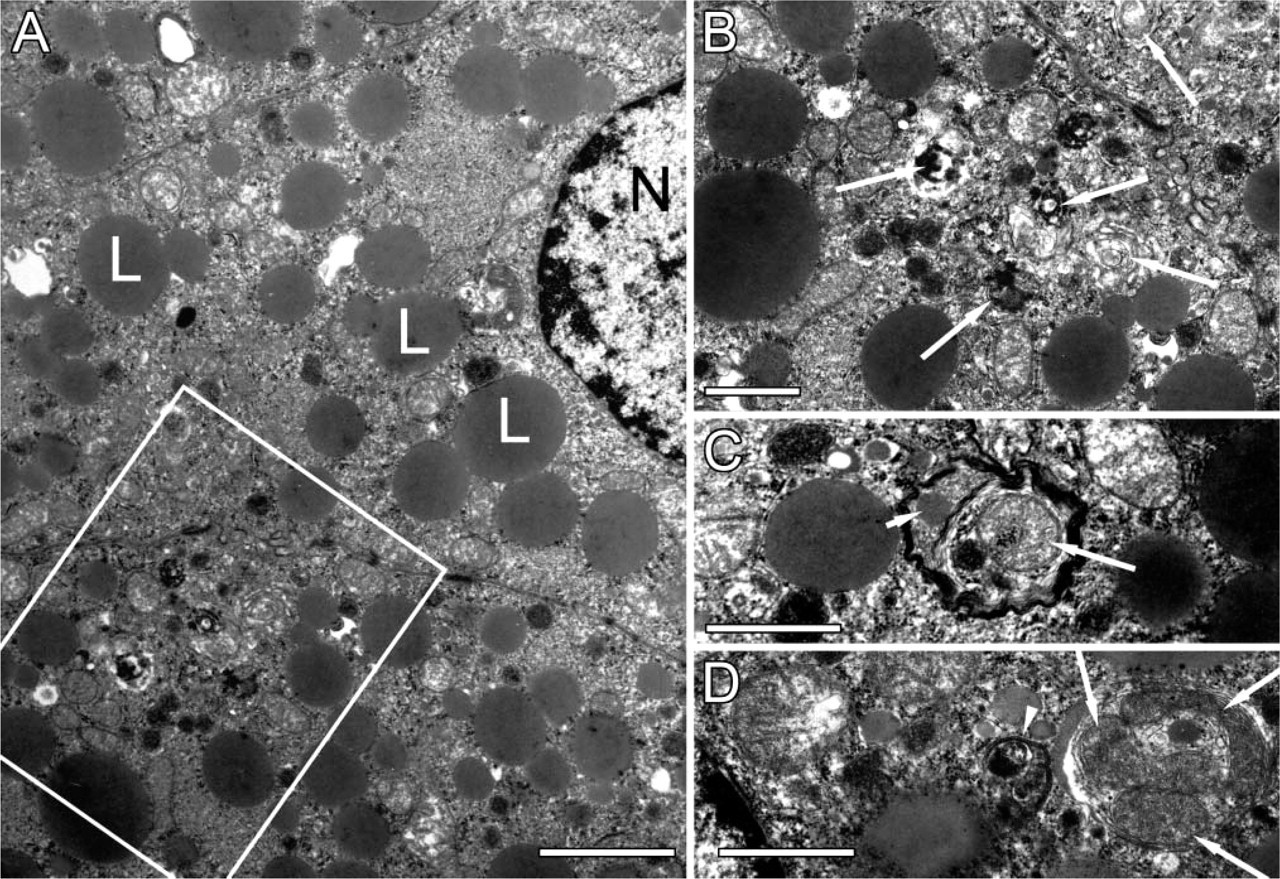
Ultrastructural characterization of liver tissue from GFP-LC3 transgenic mice after nutrient starvation for 24 hr. (
Similarly to yeast, autophagy in mammalian cells is highly dependent on phosphorylation events. Indeed, autophagy in HepG2 cells strongly correlated with dephosphorylation of p70 S6 kinase, thereby confirming previous reports. The activity of the p70 S6 kinase is regulated by the mTOR kinase, and inhibition of S6 phosphorylation caused by inactivation of mTOR (e.g., after incubation with rapamycin) induces autophagy even under nutrient-rich conditions (Blommaart et al. 1995). On the other hand, various classes of phosphatidylinositol-3-kinase (PI3K) control the autophagic pathway in distinct ways: class IA PI3K inhibits cytoplasm sequestration and degradation, whereas class III stimulates the sequestration of cytoplasm, implicating the PI3K family as key regulators of the autophagic pathway (Petiot et al. 2000). More recently, Inbal et al. (2002) demonstrated that expression of death-associated protein kinase and death-associated protein kinase-related protein kinase-1 triggered membrane blebbing and extensive autophagy. Notwithstanding the involvement of kinases in autophagy, phosphorylation events are part of many different signaling pathways and thus not highly specific for autophagy. Dephosphorylation of p70 S6 kinase may simply reflect a reduction in the metabolic status of the cell. If phosphorylation events are used to detect autophagy, they should always be combined with other more specific methods such as LC3-processing.
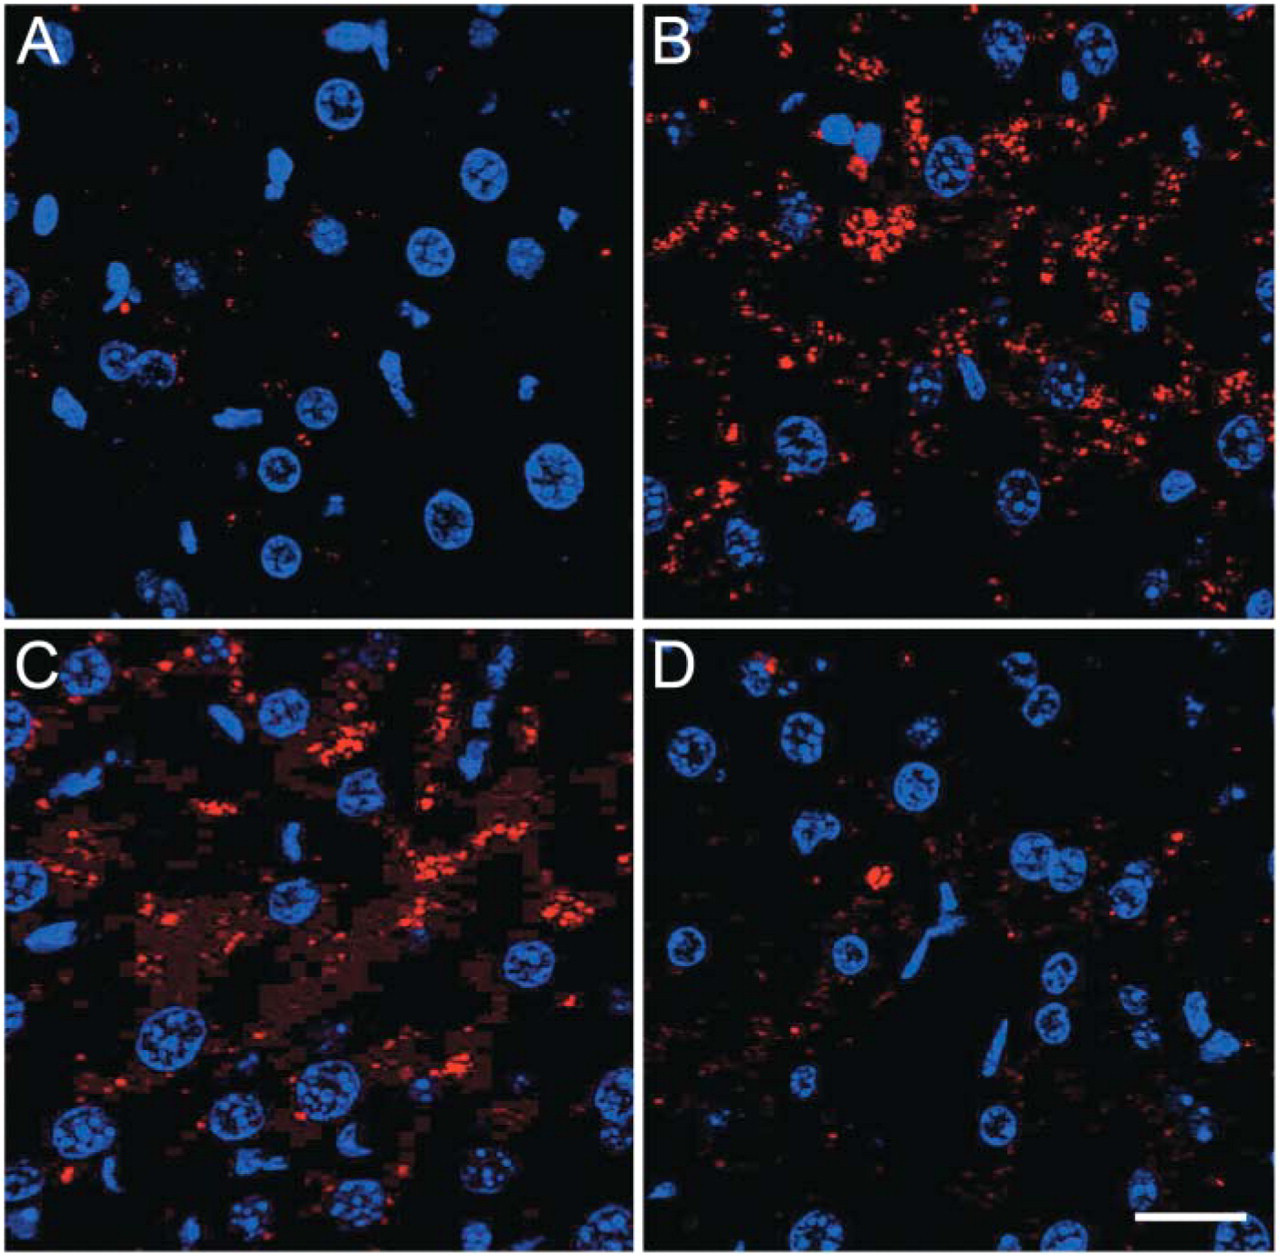
Immunofluorescent detection of LC3 in liver tissue. Few intense dot-like LC3 structures (red) could be demonstrated in liver of fed GFP-LC3 transgenic mice after incubation with anti-LC3 primary antibody and Cy3-conjugated secondary antibody (
In conclusion, the identification of autophagy-specific biomarkers for tissue is highly compromised due to lack of differential gene expression. In this light, TEM remains an indispensable technique for evaluation of autophagy in situ. LC3 can be used as a marker for autophagosome formation in situ, but only when this protein is overexpressed.
Footnotes
Acknowledgements
Research was supported by the Fund for Scientific Research (FWO)-Flanders (Belgium) (projects G.0180.01 and G.0308.04). W.M. is a postdoctoral fellow of the FWO. M.M.K. holds a fund for fundamental clinical research of the FWO.
The authors are indebted to Martine De Bie, Jeff Thielemans, André Van Daele, and Dominique de Rijck for excellent technical assistance. GFP-LC3 transgenic mice and F9 clone GLF3 overexpressing GFP-LC3 were kindly provided by Dr. Noboru Mizushima (National Institute for Basic Biology, Okazaki, Japan).