
Abstract
Germinal center dendritic cells (GCDCs) have been identified as CD11c+ CD4+ CD3− cells located in GCs with the ability of inducing marked proliferation of allogenic T cells. Using immunofluorescence techniques, we have observed that this CD11c+ CD4+ CD3− immunophenotype identified GCDCs but also a subset of extrafollicular DCs. By flow cytometry, we were able to discriminate the GCDCs (CD11chigh CD4high lin−) from the other tonsil DCs. By immunofluorescence and flow cytometry, we found that dendritic cells of germinal centers express more intracellular adhesion molecule-1 (ICAM-1) (CD54) than extrafollicular dendritic cells. Proliferation of peripheral blood mononuclear cells (PBMCs) induced by coculture with purified CD11c+ CD4+ CD3− DCs was reduced by addition of blocking anti-CD54 antibodies. In summary, distinct levels of ICAM-1 expression allow the distinction between GCDCs and extrafollicular DCs, and cellular interactions mediated by CD54 are likely to play a role in the capacity of GCDC to stimulate allogenic PBMC proliferation.
I
FDCs play crucial roles in GC formation (Tew et al. 1990; Schriever and Nadler 1992) and in the GC reaction, because they are involved in the positive selection of high-affinity centrocytes (Liu et al. 1989; Lindhout et al. 1993, 1997) and may also play a role in GC B-cell clonal expansion (Petrasch et al. 1991; Clark et al. 1992; Li et al. 2000). Lymphocyte function-associated antigen-1 (LFA-1) and very late antigen-4 expression on GC B cells are very important to establish firm contacts with FDCs through interactions with intracellular adhesion molecule-1 (ICAM-1) and vascular cell adhesion molecule-1 (VCAM-1), respectively (Koopman et al. 1991, 1994).
Three subsets of DC have been identified in tonsils: CD11c+ CD4+ CD3− IDCs and CD11c− CD4+ CD3− pDCs, both localized in the extrafollicular region (T-cell zones) and a subset of CD11c+ CD4+ CD3− DCs located within GC (GCDCs), evenly distributed in both the dark and light zone, and in close contact with T cells (Grouard et al. 1996). These three DC subsets were all negative for the lineage-specific markers (lin−): CD3, CD19, CD14, and CD16 (Grouard et al. 1996, 1997; Bjorck et al. 1997; Summers et al. 2001; Liu 2005). The pDC subset that is the predominant DC population of the tonsil has the particularity to express BDCA-2, a type II c-type lectin (Dzionek et al. 2000, 2001; Summers et al. 2001; Stent et al. 2002). The subset of GCDCs, with characteristics similar to blood CD11c+ CD4+ DC, represents 0.5-1% of total GC cells in human tonsils (Grouard et al. 1996). GCDCs express more CD11c and CD4 than IDCs (Grouard et al. 1996; Bjorck et al. 1997) and display no surface markers specific for FDCs. Isolated GCDCs are distinct from tingible body macrophages (TBMs) because they do not show either nonspecific esterase (NSE) activity or high levels of surface CD71 (Lause and Bockman 1981; Grouard et al. 1996). Unlike CD40high IDCs from the T-cell zones and CD1a+ Langerhans cells, sorted GCDCs are CD40low and CD1a−. They express low levels of major histocompatibility complex class II antigens and CTLA-4 ligands, but rapidly upregulate these and CD40 when they are incubated in vitro (O'Doherty et al. 1994; Grouard et al. 1996), allowing them to function as strong antigen-presenting cells (APC) and to induce marked proliferation of allogenic CD4+ T-cells (Grouard et al. 1996). In addition to their effect on T cells, GCDCs can also directly regulate B-cell responses (de Saint-Vis et al. 1998; Dubois et al. 1999). Using immunohistology and RNA analysis, it was shown that GCDCs are a source of DC-CK1 (CCL18) and CXCL13 production in the GCs. CCL18 preferentially attracts naïve T cells (CD45RA+), and CXCL13 is essential for homing of lymphocytes into secondary lymphoid organs and for the development of B-cell follicles (Adema et al. 1997; Lindhout et al. 2001; Vissers et al. 2001). In 2001, the immunophenotype of tonsillar DCs was reexamined by Summers and collaborators. In this study, primarily based on flow cytometry immunophenotyping, the authors identified five tonsil DC subsets based on their relative expression of the HLA-DR, CD11c, CD13, and CD123 antigens. Three distinct DC subsets, including GCDCs and two subsets of IDCs, displayed the CD11c+ CD4+ CD3− phenotype. They defined GCDCs as HLA-DRmod CD11c+ CD13− DCs, but some DCs with the same phenotype were also described in the T-cell areas (Summers et al. 2001).
In this work, we performed immunofluorescence studies to identify and locate DCs subsets within tonsils. We confirmed the presence of CD11c+ CD4+ CD3− DCs within GC as well as in extrafollicular areas. We have shown by immunofluorescence and flow cytometry studies that in contrast with DCs in extrafollicular areas, GCDCs strongly express ICAM-1, and that ICAM-1/LFA-1 interactions are involved in the capacity of DCs to induce proliferation of peripheral blood mononuclear cells (PBMCs).
Materials and Methods
Samples and Antibodies
Tonsils obtained from patients undergoing routine tonsillectomies were transported in sterile saline and processed immediately after excision. Tissue specimens for immunofluorescence were snap-frozen in an Optimal Cutting Temperature (O.C.T.) embedding compound (Sakura Tissue-Tek; Torrance, CA) and stored at −126C until required. The following Abs were applied in this study: phycoerythrin (PE)-conjugated anti-human CD11c mouse MAb (Leu-M5; Becton Dickinson, Mountain View, CA), FITC-conjugated anti-human CD4 mouse MAb (Leu-3a + 3b; Becton Dickinson), PE-conjugated anti-human CD54 mouse MAb (555511; BD Pharmingen, Becton Dickinson), FITC-conjugated anti-human CD54 mouse MAb (6.5B5; DAKO, Glostrup, Denmark), anti-human CD21 mouse MAb (2G9; Novocastra, Newcastle upon Tyne, UK), anti-human CD71 mouse MAb (M-A712; BD Pharmingen), monoclonal mouse anti-human follicular dendritic cell (CNA.42; DAKO A/S, Denmark), anti-human CD11c mouse MAb (555391; BD Pharmingen), anti-human CD3 rabbit Ab (A 0452; DAKO), Peridinin chlorophyll protein (PerCP)-conjugated anti-human CD4 mouse MAb (SK3; Becton Dickinson), FITC-conjugated anti-human CD3 mouse MAb (SK7; Becton Dickinson), FITC-conjugated anti-human CD20 mouse MAb (L27; Becton Dickinson), FITC-conjugated anti-human CD16 mouse MAb (Leu-11a; Becton Dickinson), FITC-conjugated anti-human CD14 mouse MAb (M5E2; BD Pharmingen), (PerCP)-conjugated anti-human CD19 mouse MAb (Sj25c1, Becton Dickinson), (PerCP)-conjugated anti-human CD3 mouse MAb (SK7, Becton Dickinson), (PerCP)-conjugated anti-human CD14 mouse MAb (345786, Becton Dickinson), allophycocyanin (APC)-conjugated anti-CD4 mouse MAb (555349; Becton Dickinson), and biotinylated anti-BDCA-2 (130-090-691; Miltenyi Biotc GmbH, Auburn, CA).
Immunofluorescence Staining
Five-μm cryostat consecutive sections of 11 tonsils were fixed for 10 min with cold acetone, air dried, and then hydrated in PBS. Tissues were blocked in PBS/3% BSA for 30 min at 37C. Immunological staining was performed using antibodies for 1 hr at 37C in PBS/3% BSA. Excess antibodies was removed using three 5-min washes with PBS. For indirect immunofluorescence, slides were incubated with FITC-labeled sheep anti-mouse Ig (Amersham Life Science; Piscataway, NJ; ref: N 1031) or Texas red-labeled donkey anti-rabbit Ig (Amersham Life Science; ref: N 2034) at 1:100 in PBS/BSA for 1 hr at 37C. As a control for nonspecific staining by the secondary antibody, staining omitting primary antibodies was performed. Slides were mounted in PBS/glycerol (v/v) mixed with an antiquenching agent (phenylenediamine, 1 mg/ml). Tissue sections were analyzed using a fluorescent microscope (Axiovert 25; ZEISS, Oberkochen, Germany) and digital images were obtained with a ZEISS Axiocam HRC.
Isolation and Phenotypic Analysis of DCs from Tonsils
Fresh tonsils were cut into small pieces and digested with collagenase IV (C-5138; Sigma, St Louis, MO) and DNase I (D-5025; Sigma) in RPMI-1640. The cells collected after two rounds of enzymatic digestion, were pooled, passed through a cell strainer (100-μm nylon, Becton Dickinson), and centrifuged through a Lymphoprep gradient centrifugation (d = 1.077) (AXIS-SHIELD PoC AS; Rodelokka, Norway) for 20 min at 1400 rpm. Cell suspensions were stored in liquid nitrogen (FBS/dimethylsulfoxide 10%) until use. CD3+ T cells (CD3 Microbeads; 130-050-101, Miltenyi Biotec GmbH, Auburn, CA), CD14+ monocytes/macrophages (CD14 Microbeads human; 120-000-305, Miltenyi Biotec GmbH), CD16+ natural killer cells (CD16 Microbeads human; 120-000-249, Miltenyi Biotec GmbH), and CD19+ B cells (CD19 Microbeads, 130-050-301, Miltenyi Biotec GmbH) were removed from the cell suspensions by magnetic beads (MidiMacs; LD columns, Miltenyi Biotc GmbH). The remaining cells were stained with mouse anti-CD11c-PE, anti-CD4-PerCP, anti-CD3-FITC, anti-CD20-FITC, anti-CD14-FITC, and anti-CD16-FITC. CD11c+ CD4+ CD3− CD20− CD14− CD16− DCs and CD11c− CD4+ CD3− CD20− CD14− CD16− DCs were isolated by cell sorting using FACSVantage SE (Becton Dickinson). After cell sorting, the purity of the CD11c− CD4+ CD3− CD20− CD14− CD16− DCs and the CD11c+ CD4+ CD3− CD20− CD14− CD16− DCs was >90%. To measure CD54 expression (CD54-FITC) of DC subsets, anti-CD4-PerCP was replaced by anti-CD4-APC and the lineage-specific markers were conjugated to PercP. Samples were analyzed with BD CellQuest Pro (Becton Dickinson) programs.
Two-color immunofluorescent microscopy on serial frozen sections of human tonsils. (
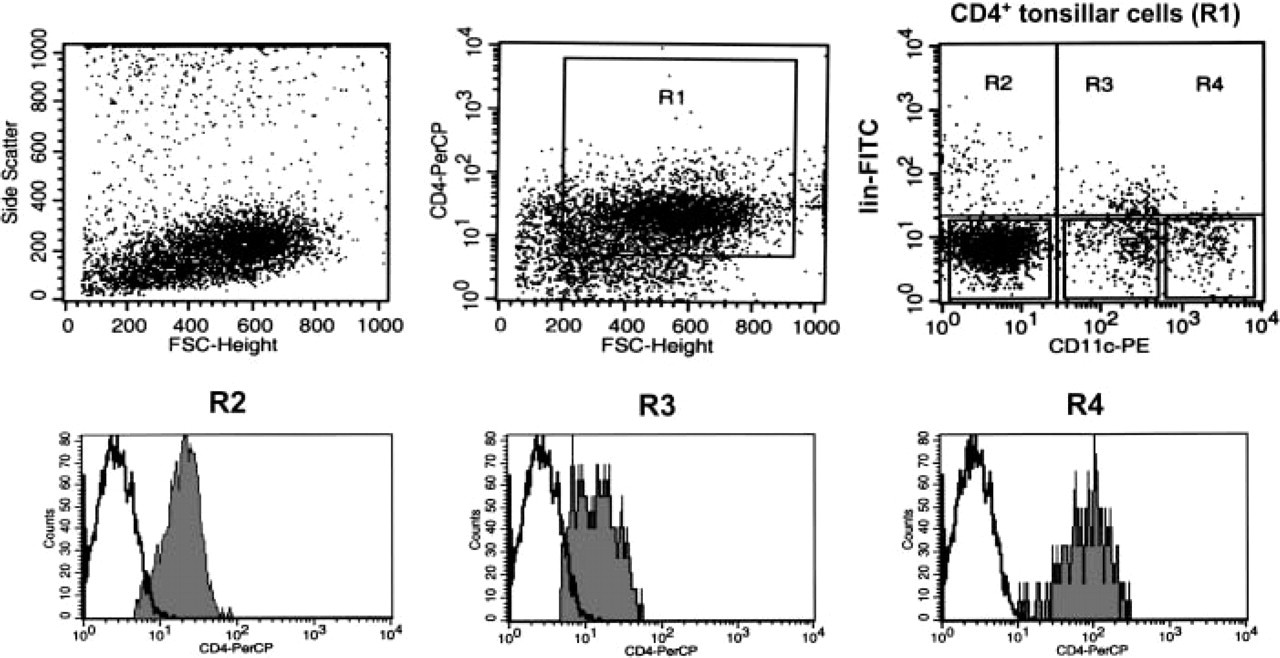
Flow cytometric analyses of tonsillar cells. Triple-color labeling of MACS-purified CD3− CD19− CD16− CD14− tonsil cells using CD3-FITC, CD20-FITC, CD16-FITC, CD11c-PE, CD4-PercP antibodies. Gating on the CD4+ cells (R1) showed three populations of CD4+ CD3− CD20− CD16− cells regarding their relative expression of the CD11c (R2, R3, R4). Gating on these three populations revealed that CD11chight dendritic cells (DCs) (R4) expressed more CD4 than CD11clow DCs (R3). Isotype-matched controls are shown in white. Data are from the most demonstrative experiment of six performed.
Coculture of PBMC and DCs
PBMCs were obtained from healthy donors after a Lymphoprep gradient centrifugation (d = 1.077). Five × 103 CD4+ CD11c+ lin− GCDCs or CD4+ CD11c− lin− DCs isolated from the same tonsils were cultured with 20 × 104 PBMCs in round-bottomed 96-well culture plates in RPMI 1640 containing 10% human AB+ serum. For blocking experiment, blocking anti-human ICAM-1 (CD54) antibody MAb was purchased from R and D Systems Europe (BBIG-I1, BBA3; Abingdon, UK) and was added on DCs 30 min before culture with PBMCs. Incubation of cells in IgG1 was used as control (isotype control). After 6 days, cells were pulsed with 0.5 μCi 3H-thymidine for 18 hr before collecting and counting in a scintillation counter. Tests were carried out in triplicate.
Statistical Analysis
The statistical significance of differences was determined using Student's t-test, and p < 0.05 was considered statistically significant.
Results
CD11c+ CD4+ CD3− Phenotype Identifies GCDCs as well as Subsets of Extrafollicular DCs
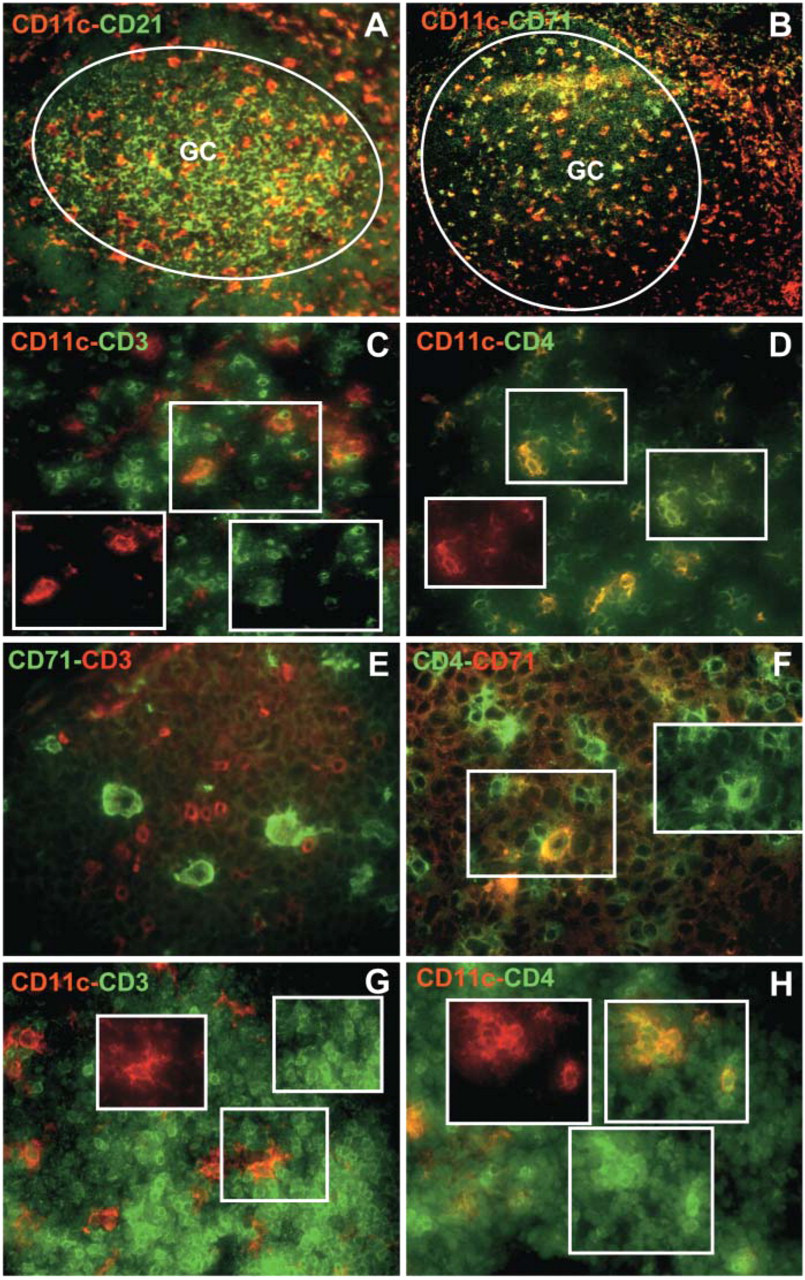
We first sought to identify GCDCs as CD11c+ CD4+ CD3− cells located within follicles. For this purpose, double immunofluorescence stainings on serial frozen sections were performed using three antibody “combinations:” anti-CD21 and CD11c, anti-CD11c and CD3, and with anti-CD11c and anti-CD4. As illustrated in Figure 1, CD11c+ cells (Figure 1A, red) are evenly distributed in the GC and are distinct from CD21+ FDC (Figure 1A, green). Within CD21+ GC areas, we found that follicular CD11c+ cells were negative for CD3 (Figure 1C, red) and positive for CD4 (Figure 1D, yellow). TBMs also express CD11c and CD4 (Grouard et al. 1996); indeed, a double immunostaining with antibodies specific for CD11c and CD71 allowed the distinction between CD11c+ CD71low GCDCs and CD11c+ CD71hi TBMs (Figure 1B) (Grouard et al. 1996; Dubois et al. 1999; Renard et al. 1999). TBMs show polarized localization, are negative for CD3 (Figure 1E, green) and express CD4 (Figure 1F, yellow).
Immunofluorescent microscopy applied on frozen sections of human tonsils. (
The distribution of CD11c+ cells was not restricted to GCs, as a fairly large number of CD11c+ cells were also observed outside the B-cell follicles (Figure 1A, red). We investigated whether these cells share other phenotypic features with CD11c+ intrafollicular cells. Figures 1G and 1H show the pattern of double immunostaining for CD11c/CD3 and CD11c/CD4 in the extrafollicular areas of a reactive tonsil. Most extrafollicular CD11c+ DCs were also CD3− (Figure 1G) and CD4+ (Figure 1H).
By flow cytometry, GCDCs have been reported to express more CD11c and CD4 than IDCs (Grouard et al. 1996; Bjorck et al. 1997), a difference that was not appreciable by immunofluorescence. Cell suspensions from five tonsils were enriched in DCs by magnetic bead depletion of lin+ cells (MACS). The remaining cells were stained with mouse anti-CD11c, anti-CD4, and anti-lineage markers and analyzed by three color flow cytometry (Figure 2). Three CD4+ lin− DC populations were identified regarding their relative expression of the CD11c (Figure 2, CD4+ tonsillar cells, R1). By immunoperoxidase on cytospins, we found that the CD11c− CD4+ lin− population (Figure 2, R2), which has been described as pDCs (Grouard et al. 1997; Dzionek et al. 2001; Liu 2005) expressed BDCA-2 (data not shown). Gating on the CD11clow DCs (Figure 2, R3) and CD11chigh DCs (Figure 2, R4) showed that CD11chigh DCs expressed more CD4 than CD11clow DCs.
Thus, CD11c+ CD4+ CD3− GCDCs, evenly distributed within GCs were distinct from CD21+ FDC and CD71+ TBMs. By immunofluorescence, these GCDCs could not be phenotypically distinguished from extrafollicular DCs because non-GC areas contained also CD11c+ CD4+ CD3− dendritic cells. However, by flow cytometry, we were able to discriminate the GCDCs (CD11chigh CD4high lin−) from the other tonsillar DCs.
GCDCs and FDCs Appear to Express More ICAM-1 Than Any Other DCs
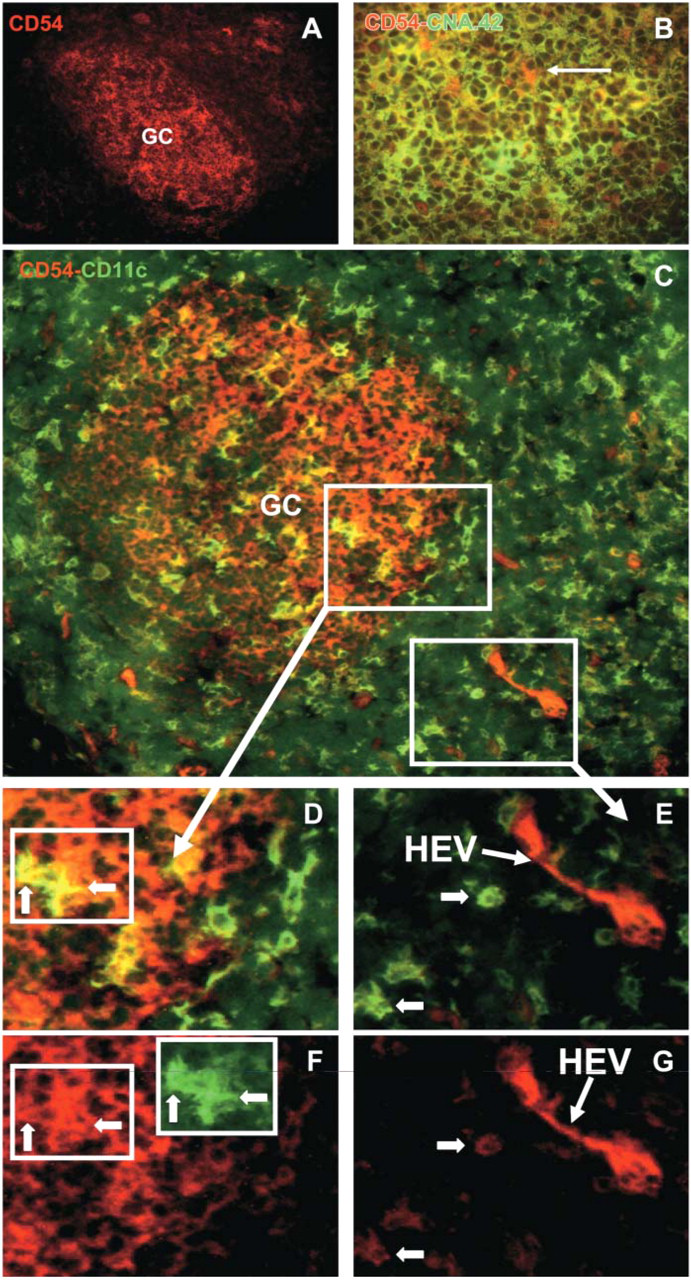
We attempted to refine the immunophenotypic criteria for identification of the subset of CD11c+ CD4+ CD3− cells restricted to the GCs. It is known that GC cells can be stained with anti-ICAM-1 antibody, the staining pattern reflecting reactivity with follicular dendritic reticulum (Dustin et al. 1986; Koopman et al. 1991). In accordance with these previous reports, we found that ICAM-1 is abundantly expressed in a reticular pattern within the germinal centers of human tonsils (Figure 3A). Immunofluorescence double staining showed that CNA.42+ cells (FDCs) expressed ICAM-1 (Figure 3B, yellow). Using antibodies specific for CD54 and CD35, which is another FDC marker, we made the same observations (data not shown). Furthermore, some ICAM-1+ CNA.42− cells (Figure 3B, arrow) were also identified. These cells displayed a dendritic morphology suggesting that some ICAM-1+ cells might be GCDCs. By immunofluorescence with FITC-anti-CD11c and PE-anti-CD54, we observed that GC contain CD11c+ CD54+ cells (Figures 3C and 3D, yellow; Figure 1F, red and green). All CD11c+ cells within GCs were CD54+, indicating that both GCDCs and TBMs express ICAM-1. This was confirmed by double labeling using anti-CD71 and anti-CD54 (data not shown). Most extrafollicular CD11c+ DCs were CD54low (Figures 3C-3F, green and Figures 3E and 3G, arrows). Only rare cells in the T-cell zone were also labeled with anti-ICAM-1; they were cells of high endothelial venules (Figures 3C, 3E, and 3G; high-endothelial venules) and cells with a dendritic morphology which were often localized close to the follicles.
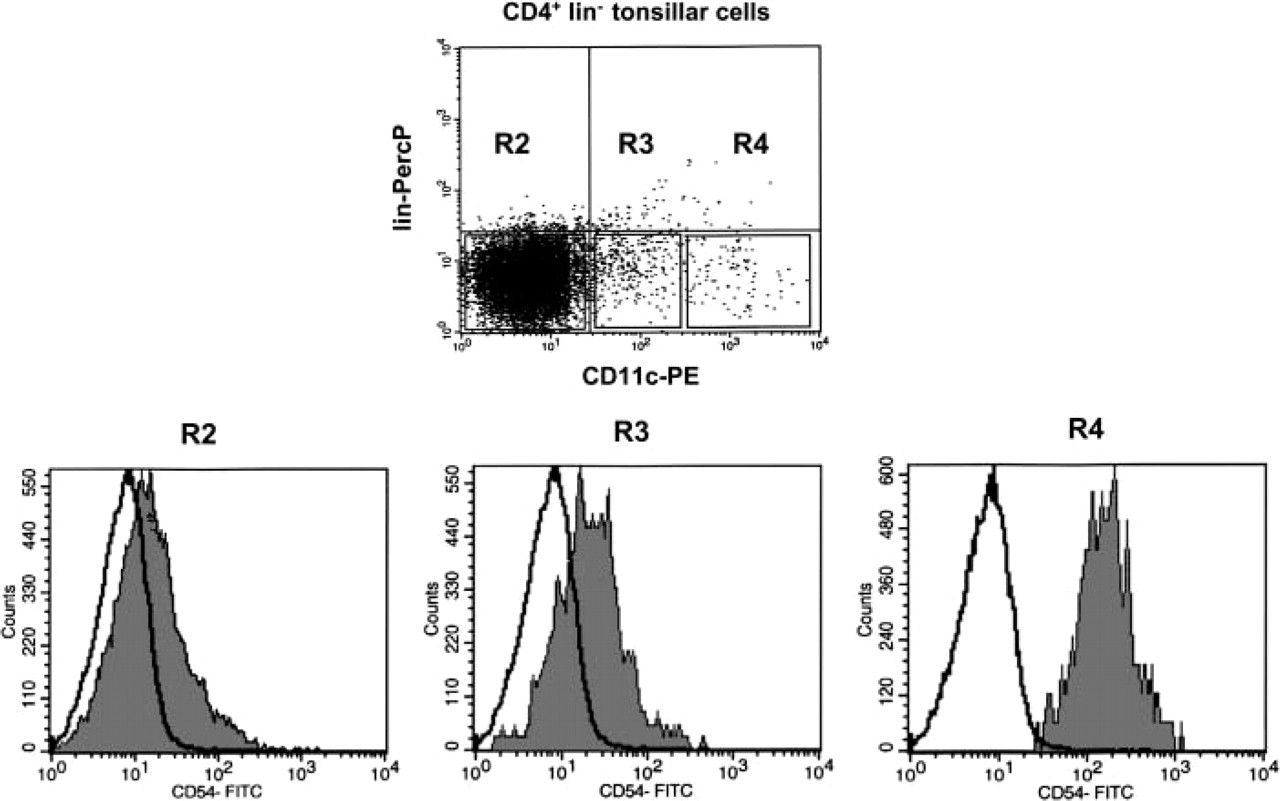
Flow cytometric analyses of tonsil cells. Quadruple-color labeling of MACS-purified CD3− CD19− CD16− CD14− tonsil cells with CD3-PerCP, CD20-PerCP, CD16- PerCP, CD11c- PE, CD4-APC, and CD54-FITC. Gating on the CD4+ cells (R1) showed the three populations of CD4+ CD3− CD20− CD16− cells regarding their relative expression of the CD11c (R2, R3, R4). Gating on these three populations revealed that CD11chight DCs (R4) expressed more CD54 than CD11clow DCs (R3) and CD11c− DCs (R2). Isotype-matched controls are shown in white. Data are from the most demonstrative experiment of five performed.
Our findings were confirmed by flow cytometry analysis. Cell suspensions from five tonsils were enriched in DCs by magnetic bead depletion of lin+ cells (MACS) and were analyzed by four-color flow cytometry using PE-labeled MAb anti-CD11c, APC-labeled MAb anti-CD4, FITC-labeled MAb anti-CD54 and PercP-labeled anti-lineage markers (Figure 4). Analysis of the CD54 expression in the three DC populations delineated according to CD11c expression revealed that CD11chigh CD4+ lin− (GCDCs, Figure 4, R4) expressed more CD54 than the other DCs (Figure 4, R2 and R3). CD11clow CD4+ lin− DCs (Figure 4, R3) expressed little CD54 whereas the expression of CD54 on the CD11c− CD4+ lin− DCs was nearly equal to that of the isotype (Figure 4, R2). CD11chigh CD4+ CD54high lin− (GCDCs, Figure 4, R4) represented 0.42-0.56% (n=5) of the total cells in human tonsils.
Taken together, these results indicate that GCDCs display a higher expression of ICAM-1 than other DCs.
PBMCs Proliferation in Presence of Blocking Anti-CD54 Antibodies
Given that CD11c+ DCs have more ability than CD11c− DCs to induce strong allogenic T-cell proliferation (Kuwana et al. 2001; Summers et al. 2001; Liu 2005), we sought to assess the possible implication of CD54 in this process. We first isolated CD11c− CD4+ CD3− cells and CD11c+ CD4+ CD3− cells to check their ability to stimulate allogenic PBMCs in vitro. In six of eight sorting experiments performed, the number of collected cells was sufficient to set up cocultures at a ratio of 5000 DCs/200,000 PBMCs. As shown in Figure 5A, CD11c+ CD4+ CD3− DC subsets stimulated a stronger (×2.4) allogeneic PBMCs response than CD11c− CD4+ CD3− cells (Student's t-test, p<0.05). Next, to analyze the possible involvement of ICAM-1/LFA-1 interactions on this allogenic PBMCs proliferation, we analyzed 3H-thymidine incorporation in the presence of blocking anti-CD54 antibodies (5 μg/ml, 10 μg/ml, and 25 μg/ml) and IgG1 (25 μg/ml) as control. Anti-ICAM-1 anti-bodies bodies induced a concentration-dependent inhibition of 3H-thymidine incorporation (Figure 5B). Furthermore, a stronger inhibition was observed when blocking antibodies were applied on CD11c+ CD4+ CD3− DC subsets that contain the CD54high DCs (GCDCs). Percentages of inhibition were 36% ± 4% and 69% ± 9% for CD11c− and CD11c+ respectively at the highest concentration of anti-CD54 tested (25 μg/ml) (Figure 5B).
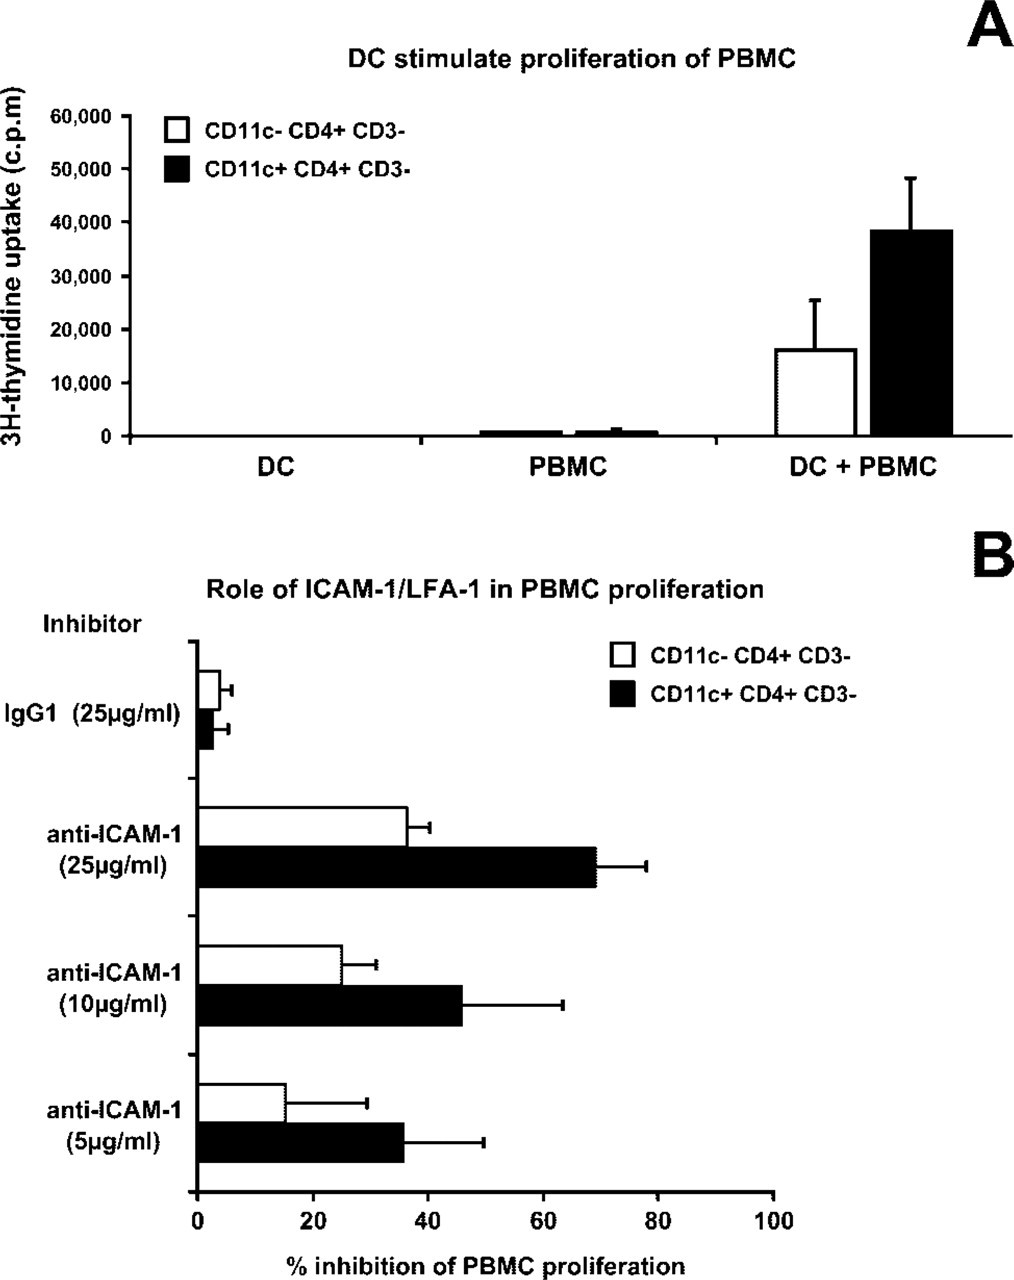
Proliferation of peripheral blood mononuclear cells (PBMCs) stimulated by dendritic cells (DCs). (
These results indicate that CD11c+ CD4+ CD3− DC subsets induce a stronger proliferation of PBMCs than CD11c− CD4+ CD3− DCs, and that interactions involving ICAM-1 are implicated in this biological process.
Discussion
A subpopulation of hematopoietic-derived DCs (GCDCs) localized within human B-cell follicles were identified as CD11c+ CD4+ CD3− cells with the ability to stimulate T cells in vitro (Grouard et al. 1996; Dubois et al. 1999). These functional studies were performed with DCs isolated by FACS sorting according to CD11c and CD4 expression. In the present work, we observed by immunofluorescence that CD11c+ CD4+ CD3− phenotype identifies DCs in the GCs and in extrafollicular areas. This finding is in accordance with data reported by Summers and collaborators, who described five tonsil DC subsets on the basis of the relative expression of HLA-DR, CD11c, CD13, and CD123. In their study, the CD11c+ CD4+ CD3− phenotype was common to three distinct DC subsets located in both the T-cell areas and GCs (Summers et al. 2001). In our search to refine the immunophenotype of GCDCs allowing their identification in situ and their distinction from extrafollicular DCs, we found that CD54/ICAM-1 expression seemed to be a specific marker for GCDCs and was not detected on extrafollicular DCs. A few studies were devoted to the in situ immunolocalization of ICAM-1 in GC (Dustin et al. 1986; Koopman et al. 1991; Ree et al. 1993). As with these authors, we found that GCs stained strongly and uniformly for ICAM-1. Double staining with anti-CD54 (for ICAM-1) and CNA.42 confirmed that FDC expressed ICAM-1. Our observations were supplemented and confirmed by flow cytometry analysis. Indeed the coordinate analysis of CD11c and CD54 expression on DCs (CD4+ CD3+) indicated that DCs characterized by strong CD11c expression formally described as GCDCs by Grouard and collaborators (Grouard et al. 1996; Bjorck et al. 1997) also had the strongest membrane density of CD54, whereas DCs with intermediate levels of CD11c expression (CD11cdim cells) corresponding to IDCs had lower levels of CD54 expression. Thus we concluded that GCDCs were characterized by a stronger expression of CD54 than other DCs, and that the lower density of CD54 on extrafollicular cells likely precludes its detection by immunofluorescence.
CD11c− DCs have a less capacity to induce T-cell proliferation than CD11c+ DCs (Kuwana et al. 2001; Summers et al. 2001; Liu 2005). We hypothesized that the expression of ICAM-1 on CD11c+ DCs might be relevant to the specificity of these biological functions. Therefore, we isolated CD11c+ CD4+ CD3− DC and CD11c− CD4+ CD3− cells and we tested their capacity to stimulate PBMCs proliferation without or with blocking anti-CD54 (ICAM-1) antibodies at various concentrations. We found that CD11c+ CD4+ CD3− DC subsets stimulated a stronger allogeneic PBMC response than CD11c− CD4+ CD3− cells. Addition of blocking anti-ICAM-1 antibodies to cocultures of PBMCs set up with CD11c+ CD4+ CD3− DC and CD11c− CD4+ CD3− DC subsets induced a concentration-dependent inhibition of the allogenic proliferation. A stronger inhibition was observed when blocking antibodies were applied on CD11c+ CD4+ CD3− DC subsets, perhaps in relation to the presence of the CD54high DCs (GCDCs) in these DC subsets. Conflicting results have been reported on the role of ICAM-1/LFA-1 in T-cell proliferation. In artificial systems of T-cell stimulation by insect cells or fibroblasts transfected with major histocompatibility complex and costimulatory molecules or by immobilized ICAM-1 and MAb to CD3, ICAM-1/LFA-1 seems to be a major costimulatory pathway (Van Seventer et al. 1990; Dubey et al. 1995; Cai et al. 1996). On the other hand, studies using blocking MAbs or ICAM-1 and LFA-1-deficient mice indicated that ICAM-1/LFA-1 interactions are dispensable in many settings (Kuijpers et al. 1990; Green et al. 1994; Christensen et al. 1996; Schmits et al. 1996). Our results suggest that proliferation of PBMCs by DCs is only partially dependent on LFA-1/ICAM-1 interactions. Other ligands of LFA-1 (ICAM-2, ICAM-3), which cannot be blocked by anti-CD54 MAbs, might be expressed on DCs and induce proliferation of PBMCs in the presence of such Abs. The overexpression of ICAM-1 in the GC may be important to stabilize the B and T cells in the GC. ICAM-1 strengthens the interactions between GC cells and all DCs of the GCs (FDCs, GCDCs), thereby allowing them to benefit from the other signals delivered by these cells, which are crucial for the germinal center reaction (van Eijk et al. 2001). It has been also demonstrated that LFA-1 on T cells facilitates functional triggering of triggering of the T cell receptor (TCR), by binding ICAM-1 on antigen-presenting cells (Bachmann et al. 1997).
In humans, monocyte-derived CD11c+ DCs polarize naive T cells predominantly toward a Th1 profile, whereas the CD11c− DC subset induces T cells to predominantly produce Th2 cytokines (Rissoan et al. 1999). Furthermore, several studies have revealed that the ICAM-1/LFA-1 interaction may promote the induction of Th1 response, which is particular evident in the absence of T cell-polarizing cytokines such as IL-4 or IL-12 (Salomon and Bluestone 1998; Luksch et al. 1999; Smits et al. 2002). Whether and how ICAM-1-positive GCDCs may influence the secretory profile of follicular T cells remains to be determined (Kim et al. 2005).
In conclusion, GCDCs constitute a particular subset of DCs localized in the germinal center. We have confirmed the presence of CD11c+ CD4+ CD3− DCs within GCs as well as in extrafollicular areas. By contrast with DCs in the latter areas, we have shown by immunofluorescence and flow cytometry studies that GCDCs strongly express ICAM-1. The strong expression of ICAM-1 by this subset of DCs may contribute to their identification. Furthermore, ICAM-1 seems to be involved in the capacity of DCs to induce proliferation of PBMCs. The precise functional role of ICAM-1/LFA-1-mediated cell-cell adhesion in the germinal center reaction remains to be determined.
Footnotes
Acknowledgements
L.d.L. is a research associate of the Belgian National Fund for scientific research (F.N.R.S.). This work was financially supported by a grant from the Belgian National Fund for scientific research (Grant F.N.R.S.—Télévie No. 7.4584.01 and Crédit aux Chercheurs), the Fondation Léon Fredericq, and the Centre Anticancéreux près l'Université de Liège.
We greatly appreciate critical reading of the manuscript by Caroline Thielen and Michel Moutschen. The authors also thank Elizabeth Franzen-Detrooz for many advices during dendritic cells isolation and coculture.