
Abstract
Since the introduction of cyano-ditolyl-tetrazolium chloride (CTC), a tetrazolium salt that gives rise to a fluorescent formazan after reduction, it has been applied to quantify activity of dehydrogenases in individual cells using flow cytometry. Confocal laser scanning microscopy (CLSM) showed that the fluorescent formazan was exclusively localized at the surface of individual cells and not at intracellular sites of enzyme activity. In the present study, the technique has been optimized to localize activity of glucose-6-phosphate dehydrogenase (G6PD) intracellularly in individual cells. Activity was demonstrated in cultured fibrosarcoma cells in different stages of the cell cycle. Cells were incubated for the detection of G6PD activity using a medium containing 6% (w/v) polyvinyl alcohol, 5 mM CTC, magnesium chloride, sodium azide, the electron carrier methoxyphenazine methosulphate, NADP, and glucose-6-phosphate. Before incubation, cells were permeabilized with 0.025% glutaraldehyde. Fluorescent formazan was localized exclusively in the cytoplasm of fibrosarcoma cells. The amount of fluorescent formazan in cells increased linearly with incubation time when measured with flow cytometry and CLSM. When combining the Hoechst staining for DNA with the CTC method for the demonstration of G6PD activity, flow cytometry showed that G6PD activity of cells in S phase and G2/M phase is 27 ± 4% and 43 ± 4% higher, respectively, than that of cells in G1 phase. CLSM revealed that cells in all phases of mitosis as well as during apoptosis contained considerably lower G6PD activity than cells in interphase. It is concluded that posttranslational regulation of G6PD is responsible for this cell cycle-dependent activity.
Keywords
A
Because CTC is commercially available (Polysciences; Warrington, PA), it has been applied, for example, to visualize respiring bacteria (Rodriguez et al. 1992; Schaule et al. 1993). In contrast to eukaryotic cells, bacteria are permeable for CTC, which allows the quantification of metabolic activity in living bacteria (Bartosch et al. 2003). Moreover, it has been demonstrated that CTC can be used to quantify activity of various dehydrogenases in individual cells using flow cytometry (Severin and Seidler 1992, 1998; Huang and Severin 1993; Huang et al. 1994). By a combined analysis of CTC-formazan and nuclear DAPI fluorescence, cellular enzyme activity was studied in relation with the cell cycle (Severin and Seidler 1992, 1998; Huang and Severin 1993). For this purpose, cells were permeabilized to allow the entry of compounds in the incubation media into cells (Huang and Severin 1993; Severin and Seidler 1998). CLSM was used to localize enzyme activities with CTC (Severin and Seidler 1998). This study clearly demonstrated that the fluorescent formazan was exclusively localized at the surface of cells, although cells had been incubated for the detection of intracellular dehydrogenase activities.
Recently, we found that human colon cancer (HT29) cells in culture express a distinct heterogeneity with respect to G6PD activity (Cascante et al., unpublished data). We hypothesized that G6PD activity in these cells was regulated in relation with cell cycle. For that purpose, we optimized the technique with CTC as introduced by Severin and Seidler (1992) to localize and quantify G6PD activity in individual cells using flow cytometry and CLSM.
Materials and Methods
Cell Line
BN175 cells were derived from a spontaneous sarcoma in Brown Norway rats (Marquet et al. 1984). It is a rapidly growing and metastasizing soft tissue sarcoma. The cells were cultured at 37C in RPMI 1640 Dutch modification medium (RMPI; Life Technologies BV, Breda, The Netherlands) supplemented with 5% fetal calf serum, 2 mM glutamine (Life Technologies), 100 IU penicillin/ml and 100 μg streptomycin/ml (Life Technologies). The duplication time of the sarcoma cells was 21.6 hr. Cells were grown until 70–90% confluency, washed with PBS and, after detachment with 0.05% (w/v) trypsin and 0.02% (w/v) EDTA in PBS and centrifugation (250 × g for 5 min at room temperature), a single-cell suspension was obtained with a viability of at least 95%. Viability was tested with trypan blue staining.
Incubation of Cells
To permeabilize cells for compounds in the incubation medium necessary to demonstrate G6PD activity, cells were treated with 0.025% glutaraldehyde as described previously (Van Noorden and Vogels 1985; Frederiks and Vreeling-Sindelárová 2001, 2002; Schellens et al. 2003). Before permeabilization, cells were incubated in 0.5 ml of a solution of 20 mM NADP+ (Boehringer; Mannheim, Germany) in 100 mM phosphate buffer, pH 7.4, for 10 min at 4C to protect the active site of G6PD against inactivation by glutaraldehyde. After centrifugation (250 g, 4C, 5 min) cells, were permeabilized by adding 5 ml of a freshly prepared solution containing 0.025% (v/v) glutaraldehyde (Merck; Darmstadt, Germany) in 100 mM phosphate buffer, pH 7.4. Permeabilization was performed for 30 min at room temperature under continuous rotation of the tubes. The procedure was stopped by washing the cells three times for 1 min with 3 ml 100 mM phosphate buffer, pH 7.4, at 4C followed by rapid centrifugation at 250 × g. The cells were suspended in 0.5 ml of the same buffer.
The enzyme histochemical procedure was based on the tetrazolium salt method as described by Van Noorden and Frederiks (1992) and Frederiks and Vreeling-Sindelárová (2001). The incubation medium for the demonstration of G6PD activity contained 6% (w/v) polyvinyl alcohol (PVA; average molecular weight 70,000–100,000; Sigma, St Louis, MO) in 100 mM phosphate buffer, pH 7.4, 10 mM glucose-6-phosphate (Boehringer), 0.8 mM NADP+ (Boehringer), 0.32 mM 1-methoxyphenazine methosulphate (Serva; Heidelberg, Germany), 5 mM MgCl2, 5 mM sodium azide and 5 mM 5-cyano-2, 3-ditolyl tetrazolium chloride (CTC; Polysciences). CTC was added after being dissolved in a heated mixture of dimethylformamide and ethanol (final dilution of each solvent in the medium was 2% v/v). The medium was freshly prepared immediately before incubation. Cell suspensions (100 μl) were added to the media (1 ml) for demonstration of G6PD activity. The incubation was carried out for 5, 10, 15, or 20 min at room temperature under continuous rotation. Control reactions were performed in the same incubation medium lacking glucose-6-phosphate and NADP+. Other control reactions were performed such as incubation with media lacking glucose-6-phosphate, media lacking NADP+, and complete media in the presence of 10 mM dehydroepiandrosterone (Sigma). The reaction was stopped by adding 5 ml 100 mM phosphate buffer, pH 7.4, at 4C. The cells were washed three times with the same buffer, spun down at 1000 × g, and finally resuspended in 1 ml buffer. To stain DNA in cells, 10 μl Hoechst 33, 342 solution (0.5 mg dissolved in 1 ml distilled water) was added to 1 ml cell suspension.
To compare the localization of CTC-formazan in cells incubated according to our procedure with the method described by others (Severin and Seidler 1998), cells were incubated with media containing 1 mM CTC instead of 5 mM and in media that lack 6% PVA.
Microscopic observations on incubated cells were performed by bringing the cells on glass slides, covering, and sealing with nail polish.
In addition to the incubations of cells in suspension, glutaraldehyde-treated cells were brought on glass slides and were incubated with incubation media on the stage of the microscope to follow the formation of final reaction product in time.
The localization of final reaction product in glutaraldehyde-treated cells because of G6PD activity was compared with the localization of CTC-formazan in untreated cells. For that purpose, glutaraldehyde-treated cells and untreated cells were brought on glass slides, dried, and incubated for the demonstration of G6PD activity. The incubation media were prepared as mentioned previously, containing 18% PVA instead of 6% PVA, which was applied previously on unfixed cells or cryostat sections (Van Noorden and Frederiks 1992). After incubation for 20 min at room temperature, cells were rinsed with phosphate buffer, pH 5.0, to remove the incubation media. Then cells were embedded in Vectashield.
Flow Cytometry
Amounts of CTC-formazan and Hoechst-DNA were determined in individual sarcoma cells using bivariate flow cytometry (FACS Vantage; Becton Dickinson, San Jose, CA). Excitation was performed at a wavelength of 488 nm and 350 nm, and fluorescence was measured with band pass filters 619–641 nm and 402–446 nm for CTC-formazan and Hoechst-DNA, respectively. Fluorescence intensities of CTC-formazan were determined in 5-10,000 cells in G1, S, and G2/M phase based on DNA content in three individual experiments.
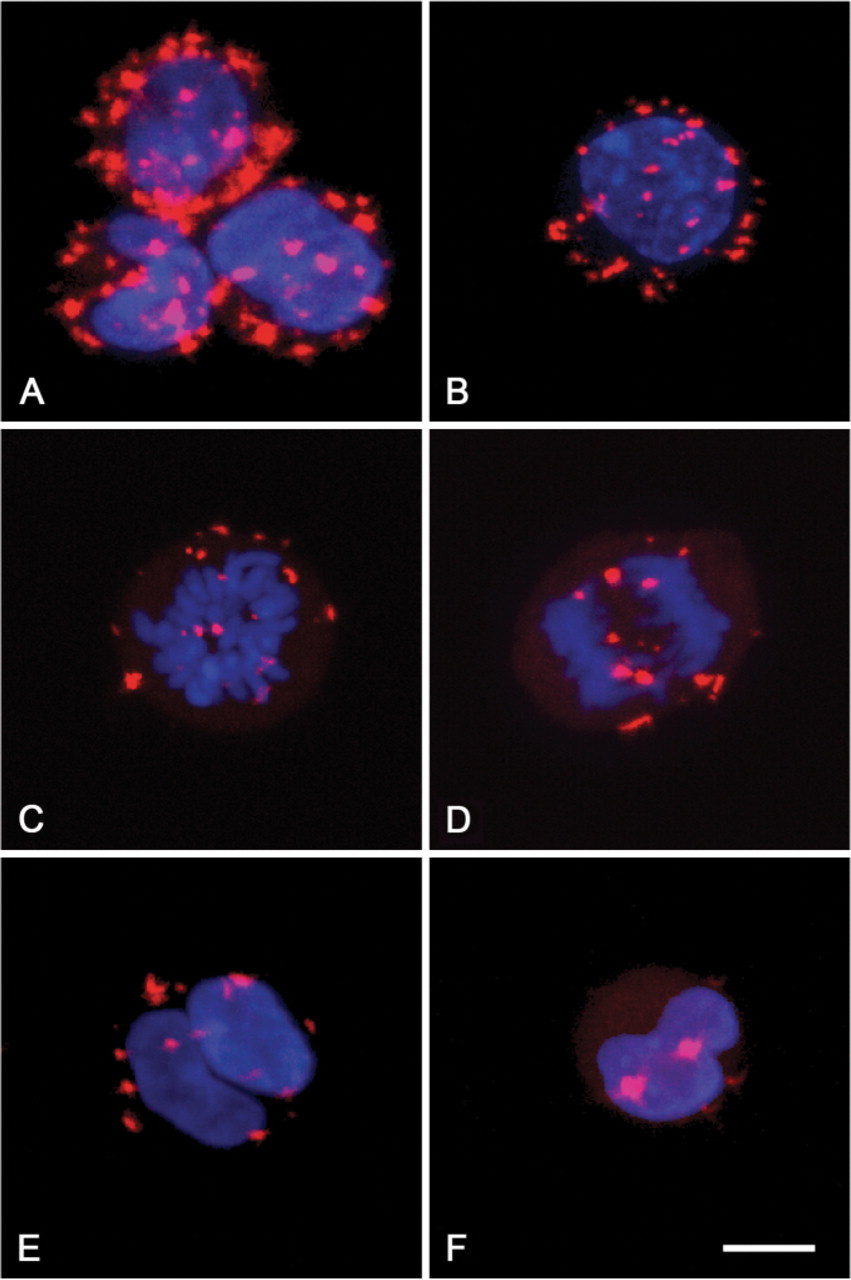
Micrographs of fluorescent final reaction product in the cytoplasm of fibrosarcoma cells in interphase (
Confocal Laser Scanning Microscopy
Confocal microscopy was performed with an SP2 confocal system (Leica; Mannheim, Germany). A 63 × NA 1.32 HCX PL Apo CS oil objective was used in combination with a zoom factor of four. Stacks through the cells were made with a step size of 0.28 μm. The setting of the pinhole was corresponding with 1 Airy disc to ensure optimal resolution in Z. The final voxel size was 0.12 × 0.12 × 0.28 μm. Images (512 × 512) were adjusted to the full (8 bit) dynamic range. Hoechst was imaged with 364 nm excitation and mirror setting for the detection at 410–460 nm, whereas the CTC-formazan was imaged using 488 nm excitation and detection at 610–690 nm.
Final images of the cells are presented as maximum intensity projections.
Results
Localization of final reaction product (formazan) in BN175 fibrosarcoma cells incubated for the demonstration of G6PD activity with 5 mM CTC as tetrazolium salt in the presence of 6% PVA is shown in Figure 1A. Crystalline fluorescent final reaction product was exclusively found in the cytoplasm of the cells. The nucleus did not show any formazan, which could be concluded from the images of individual sections obtained with CLSM. Reaction product was not present at the surface of the plasma membrane. When cells were incubated for the demonstration of G6PD activity with 1 mM CTC in the absence of PVA, reduced amounts of formazan were found only at the surface of the plasma membrane. This suggests that 5 mM CTC and 6% PVA are essential for the detection of G6PD activity intracellularly. When cells were incubated in the absence of substrate and coenzyme, in the absence of substrate and in the presence of NADP+, or in the presence of substrate and in the absence of NADP+, crystalline fluorescent final reaction product was not generated in the cytoplasm or at the surface of the plasma membrane. The amount of formazan produced after incubation for the demonstration of G6PD activity was largely reduced when the incubation was performed in the presence of dehydroepiandrosterone. The localization of final reaction product was similar in cells that were permeabilized with glutaraldehyde and cells that were made permeable by drying on glass slides.
A linear relationship between incubation time and formation of fluorescent final reaction product in cells incubated for the demonstration of G6PD activity was observed using CSLM and flow cytometry (Figure 2). Cells incubated in the absence of G6P and NADP did not show any formation of fluorescence.
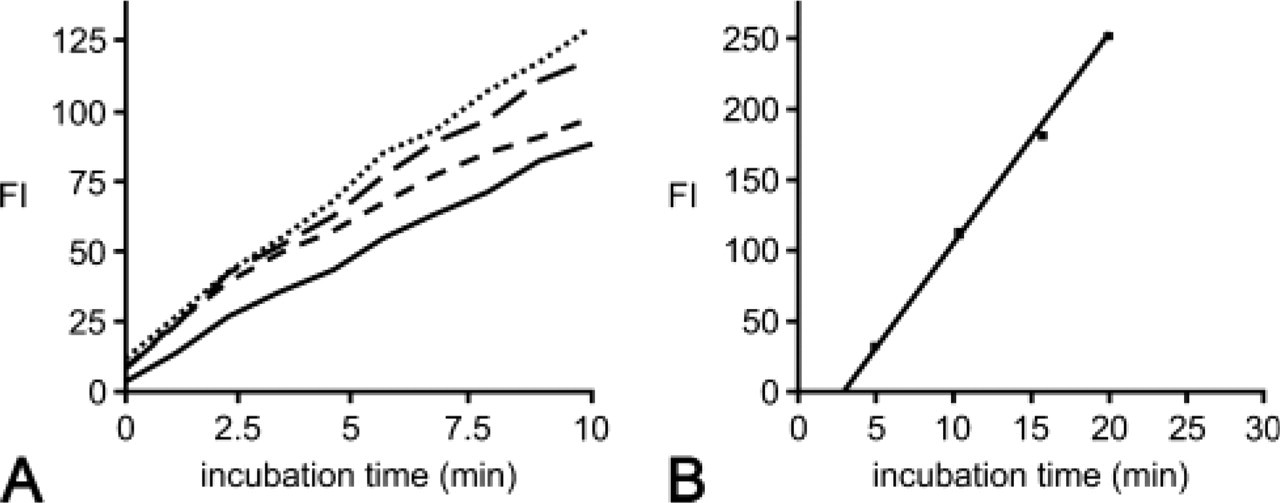
Relationships between the amount of fluorescent final reaction product (formazan) and incubation time in interphase fibrosarcoma cells incubated for the demonstration of glucose-6-phosphate dehydrogenase activity with cyano-ditolyl-tetrazolium chloride as tetrazolium salt as detected in four different individual cells using confocal laser scanning microscopy (
DNA distribution profiles of cells were determined based on staining with Hoechst. It was shown that ∼60% of the cells was in G1 phase, whereas 40% was in either S phase or in G2/M phase. When combining Hoechst staining for DNA with the CTC-formazan method, it appeared that G6PD activity in cells in S phase had a 27 ± 4% higher G6PD activity than cells in G1 phase, whereas the activity of cells in G2/M phase was 43 ± 4% higher than that of cells in G1 phase.
Cells in G2 and M phase cannot be distinguished based on their DNA content using flow cytometry. Therefore, the amount of fluorescent final reaction product in interphase cells and mitotic cells was investigated using CLSM. Figures 1B–1E show cells in prophase, metaphase, anaphase, and telophase, respectively. Final reaction product was present in small amounts in cells in these mitotic phases as compared with cells in G1 phase. Cells in apoptosis showing nuclear fragmentation also contained only small amounts of final reaction product (Figure 1F).
Discussion
The present study has shown that G6PD activity can be localized in the cytoplasm of individual cells as a fluorescent formazan when using CTC. Fluorescent formazans are suitable for precise microscopical localization with CLSM and for combined analysis with other fluorescent markers with CLSM and flow cytometry. CLSM clearly showed that fluorescent final reaction product from G6PD activity was localized intracellularly in BN175 fibrosarcoma cells (Figure 1), which is in contrast with data of Huang and Severin (1993) and Severin and Seidler (1998), who demonstrated fluorescent formazan predominantly on the cell surface after incubation for the demonstration of the activity of various dehydrogenases. The main differences between our procedure and that of Huang and Severin (1993) are that 6% polyvinyl alcohol was added to the incubation media and that 5 mM instead of 1 mM CTC was used in the incubation media, allowing a more precise intracellular localization.
In the present study, we permeabilized cells with 0.025% glutaraldehyde as was done previously for the demonstration of G6PD activity in individual human erythrocytes and rat liver parenchymal cells (Van Noorden et al. 1982, 1989; Van Noorden and Vogels 1985; Vogels et al. 1986; Jonges et al. 1989; Frederiks and Vreeling-Sindelárová 2001). We have shown that treatment with 0.025% glutaraldehyde in combination with NADP protection reduced G6PD activity in liver parenchymal cells by 25% only (Frederiks and Vreeling-Sindelárová 2001) and that it was localized at membranes of granular endoplasmic reticulum, in peroxisomes and in the cytoplasm of liver parenchymal cells (Frederiks and Vreeling-Sindelárová 2001; Schellens et al. 2003). These findings were in agreement with biochemical data and confirmed the character of G6PD as a loosely bound enzyme. Addition of 6% PVA to the incubation media as used earlier to demonstrate G6PD activity in erythrocytes and liver parenchymal cells may prevent leakage of loosely bound proteins from the cells and thus to fake localization at the surface of cells. Moreover, by increasing the concentration of the tetrazolium salt from 1 to 5 mM in the incubation media, the capturing reaction is accelerated, giving rise to precipitation of the final reaction product at the site of enzyme activity (Van Noorden and Frederiks 1992). We conclude that addition of PVA to the incubation medium and the use of 5 mM CTC in combination with permeabilization of cells enabled a precise intracellular localization of G6PD activity in individual cells in the present study.
The significance of extracellular localization of fluorescent formazan on the surface of cells as a consequence of reduction of CTC has been investigated in the past. Gorog and Kovacs (1995) suggested that generation of reactive oxygen species on the surface of platelets reduced CTC, whereas Bernas and Dobrucki (1999, 2000) indicated that in the absence of a plasma membrane-permeable electron carrier, only enzymes or reducing compounds associated with plasma membranes were involved in the reduction of CTC. Severin and Seidler (1998) interpreted the CTC-formazan produced by permeabilized cells and localized at the plasma membrane to be derived from intracellular dehydrogenase activities dependent on the specific substrate added. Conclusions were drawn on enzyme activities in single cells on the basis of quantitative analysis of individual cells with flow cytometry (Severin and Seidler 1992; Huang and Severin 1993; Huang et al. 1994). However, in the present study, it is concluded that fibrosarcoma cells did not contain reducing compounds on their plasma membranes and that intracellular enzyme activities produced fluorescent formazan intracellularly under optimized incubation conditions.
Furthermore, we have shown that the reaction rate of intracellular G6PD activity in fibrosarcoma cells as determined with flow cytometry and CLSM is linear with time. Therefore, we conclude that G6PD activity in cells in different phases of the cell cycle may be compared quantitatively.
We have found that G6PD activity increased in cells in S phase as compared with cells in G1 phase. Severin and Seidler (1998) have shown that the activity of NAD(P)H oxidoreductase was twice higher in G2/M phase than in G0/G1 or early S phase in an endothelial cell line. It was assumed that most, if not all proteins are doubled in amounts at the end of the S phase before mitosis. However, we found only a 30–40% increase in G6PD activity in G2/M phase as compared with G1 phase, which may be due to the presence of mitotic cells in this fraction. To our surprise, we found an abrupt decrease of G6PD activity in cells in mitosis. The rapid change indicates posttranslational regulation of G6PD as has been demonstrated before in other conditions (Swezey and Epel 1986; Stanton et al. 1991; Zhang et al. 2000; Jain et al. 2004). Decreased G6PD activity was not only observed in cells in mitosis, but also in cells in apoptosis. Tian et al. (1999) demonstrated that reduced G6PD activity in apoptotic cells was accompanied by the appearance of a 46-kDa fragment of G6PD, suggesting proteolytic cleavage of G6PD during apoptosis. Whether this is a common feature of cells in apoptosis and possibly also mitosis has to be established. When considering the major functions of G6PD, it can be assumed that the capacity of synthesis of nucleotides and of maintenance of the intracellular redox state is diminished during mitosis and apoptosis. More studies are needed to unravel the mechanism of inactivation and its functional significance.
In conclusion, CTC is a suitable tetrazolium salt to study dehydrogenase and oxidase activities in individual cells using flow cytometry and CLSM, provided proper procedures are performed to permeabilize cells, to minimize inactivation of enzymes and to optimize precision of localization. The use of CTC for the demonstration of enzyme activities also allows combination with other fluorescent probes such as DNA stains, markers of different organelles, and fluorescent immunolabeling of proteins and other macromolecules.
Footnotes
Acknowledgements
The authors are grateful to Prof. Dr. C.J.F. Van Noorden for fruitful discussions and critical review of the manuscript and to Ms. T.M.S. Pierik for careful preparation of the manuscript.