
Abstract
The positions of chromosomes 18 and X fluorescence in situ hybridization signals were analyzed in blastomeres generated from human in vitro fertilization 3- to 4-day-old embryos after preimplantation screening of aneuploidy of chromosomes 13, 16, 18, 21, 22, X, and Y. Fluorescent signal localization compared with a three-dimensional sphere model of random signal distribution revealed significant differences, providing evidence of peripheral localization of chromosome 18 in aneuploid (p=0.0013) and aneuploid/euploid blastomeres (p=0.0011). No differences were found in localization of chromosome 18 in euploid and in chromosome X in euploid and aneuploid blastomeres.
H
The aim of this study was to determine whether human chromosomes 18 and X, localized at the nuclear periphery in later periods of development (Cremer et al. 2001), follow a similar pattern also in blastomeres from 3- to 4-day-old human embryos generated by in vitro fertilization (IVF).
Preimplantation genetic screening (PGS) of aneuploidies of chromosomes 13, 16, 18, 21, 22, X, and Y was performed within 32 IVF cycles in 28 infertile couples. Four of the couples had two successive IVF cycles. Informed consent was obtained from all studied subjects, and the study was approved by the local ethics board for all acknowledged research projects.
All embryos from 26 IVF cycles were analyzed. Mean age of the women at the time of oocyte retrieval was 32.2 years (ranging between 25 and 40 years). Respective indications for IVF included advanced maternal age (7/26), repeated failure of IVF (8/26), repeated miscarriages (3/26), previous pregnancy with an aneuploid fetus (1/26), infertility related to immunological factors (11/26), mosaic forms of Turner syndrome (2/26), previous cytostatic therapy (3/26), and gender selection in a hemophilia A carrier (1/26). Partners' oligozoospermia was found in 12/26, while in 2/26 partners' sperm, concentration was <1 million/ml.
In total, 204 blastomeres were examined. However, only 110 blastomeres (53.9%) without multinucleation, fragmentation of nuclei, and/or damage of fluorescence in situ hybridization (FISH) signals were selected for further analyses. Blastomeres with nullisomy of chromosomes 18 and/or X were excluded from the study.
Blastomere biopsy was performed on days 3 to 4 according to their total number in analyzed embryos. Blastomeres were washed in a hypotonic solution (1% sodium citrate, 0.6% BSA), followed by air-drying fixation (methanol and acetic acid, 3:1 ratio). Two-round FISH (Magli et al. 2001) utilizing the Vysis MultiVysion PB probe panel (Abbott Laboratories; Abbott Park, IL) with fluorescent probes for chromosomes 13, 16, 18, 21, and 22 and Vysis CEP X + CEP Y Alpha (Abbott) sets were employed. Axioplan 2 MOT microscope (Carl Zeiss, Oberkochen, Germany) with single, double, and quadruple bandpass filters and X63 Plan-Apochromat objective were used. Images were captured using Axiocam MRm (Zeiss) camera and either Axiovision (Zeiss) or ISIS (Metasystems; Altlussheim, Germany) software. Images were exported as bitmap files and analyzed by ImageJ 1.32 (National Institutes of Health, available on the internet at http://rsb.info.nih.gov/ij/) software. Prevalence of detected aneuploidies is documented in Tables 1 and 2.
Summary of PGS results
The edge of the nucleus was delineated using the “Freehand tool” with respect to the 4',6'-diamidino-2-phenylindole-stained area. Successively, the selected area was converted into a black/white mask and saved onto computer disc. The coordinates of the center of the nuclear area were measured using “Centroid” function that calculates the average of the x/y coordinates of all of pixels within the selection. The localization of signal centers was measured manually using the “Crosshair Tool.” Data and their respective masks were imported into software developed by us (JD) within the Delphi 6 environment (Borland; Scotts Valley, CA). Afterwards, the distance between the fluorescence signal and the center of the nucleus was calculated, including the distance to the point where a line starting at the nuclear center and passing through the fluorescent signal crossed its edge.
The relative signal distance (RD) was calculated by the equation: RD = Rs/R, where “Rs” is distance of the signal center from the center of the nucleus and “R” is the radius of the nucleus (Figures 1A and 1B). The RD measurements yielded values between 0 and almost 1.0, because completely peripherally located signals did not achieve the value of 1.0. This is because their center is always separated from the nuclear border edge by the distance equaling the radius of the signal itself (Figure 1B). In total, we measured the localization of 386 fluorescent signals.
Summary of FISH results
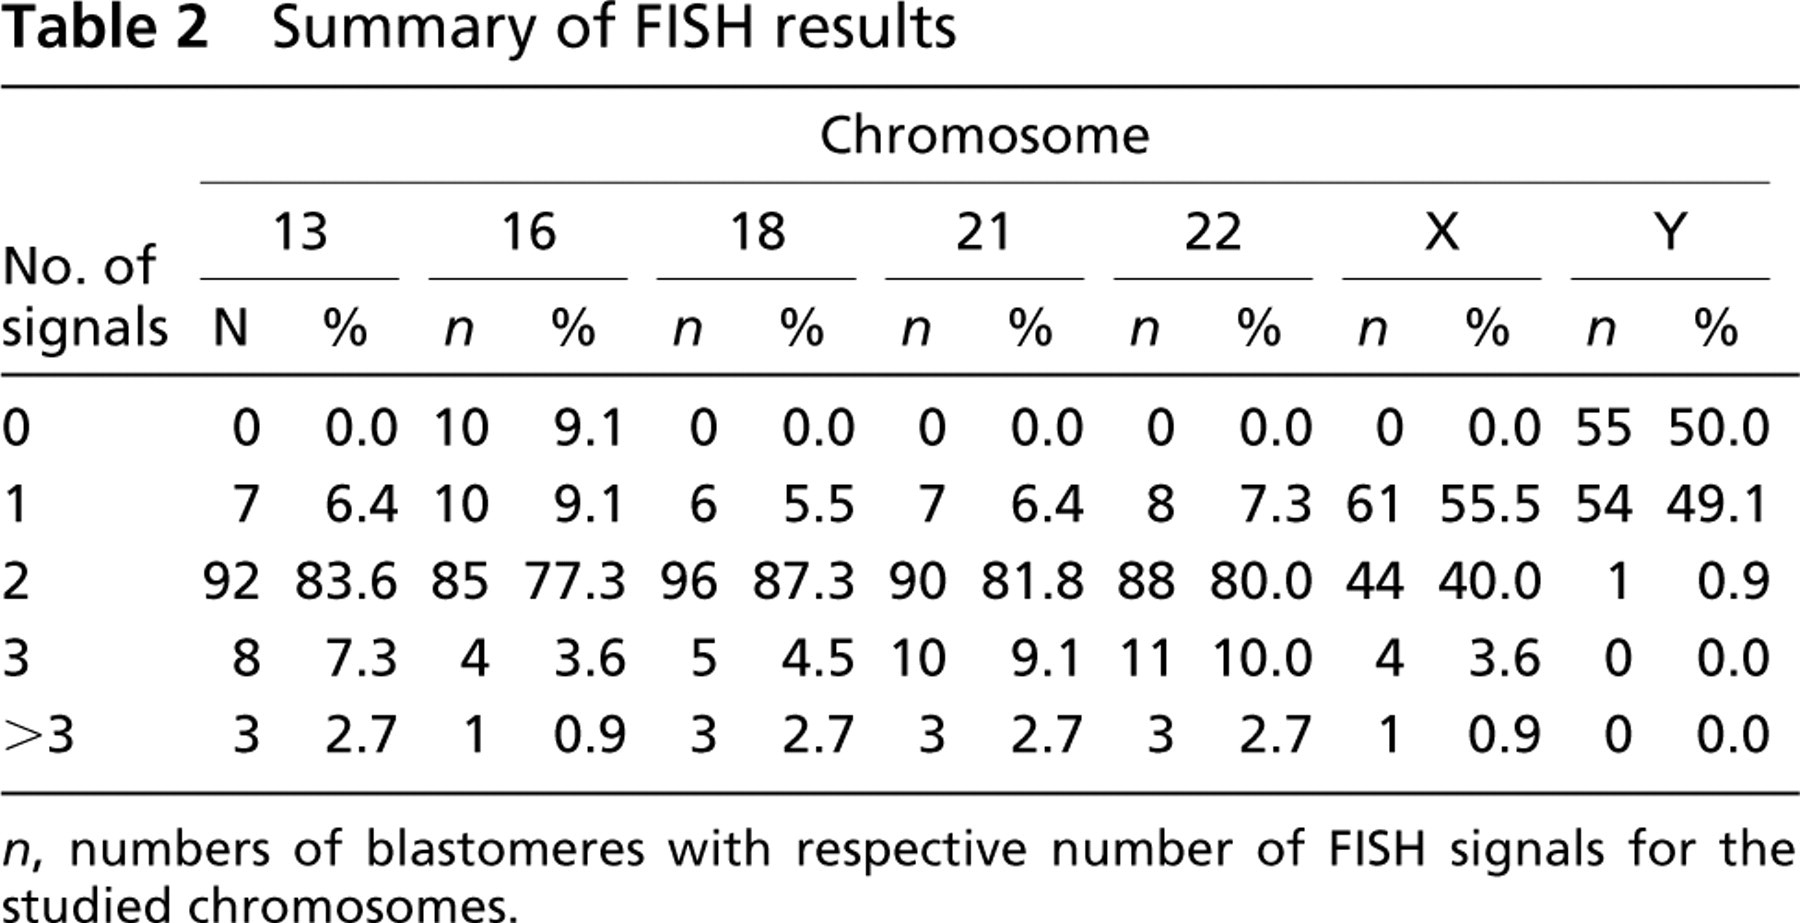
n, numbers of blastomeres with respective number of FISH signals for the studied chromosomes.
RD values were divided into nine intervals with the following upper borders (0.2, 0.3, 0.4, 0.5, 0.6, 0.7, 0.8, 0.9, and 1) corresponding to nine concentric rings superimposed on a circular nucleus. Results were stored in the Firebird SQL database (IBPhoenix; Manchester, MA) and analyzed using the Microsoft Excel spreadsheet. Evaluation of differences between the observed and expected frequencies of FISH signals within nine concentric rings was performed by chi-square goodness-of-fit test (see Table 3).
Expected frequencies for delineated rings were calculated using the three-dimensional (3D) sphere model. This model is based on the presumption that observed signals are random, thus uniformly distributed within the nucleus spherical body. The flat shape of a fixed nucleus is then a result of the two-dimensional projection of the original 3D sphere.
Relative distances (RD) of 386 measured signals of chromosomes 18 and X and of chromosome X in cells with one or two chromosomes X and in cells with different chromosomal aneuploidies (Table 3) were compared.
Statistically significant differences were found only between distributions expected from the 3D sphere model and observed distributions of RD values for chromosome 18 in all blastomeres (p=0.0011) and in aneuploid cells only (p=0.0013) (Table 3). In euploid cells, such a difference was not significant (p=0.53). These data strongly suggest peripheral localization of chromosome 18 within a sample of blastomeres, either aneuploid only and/or where euploid and aneuploid cells were studied together. This finding is in agreement with the study of McKenzie et al. (2004).
If further studies also provide evidence of the impact of chromosomal aneuploidy on early peripheral localization of chromosome 18 within the blastomere nucleus, a better understanding of the pathogenesis of early development disorders and mutual chromosome interactions in this process might be gained.
Absence of statistically significant shift to the periphery of chromosome X in both euploid and aneuploid female blastomeres did not prove peripheral localization, and thus genetic inactivation, of chromosome X in 3- to 4-day-old female embryos.
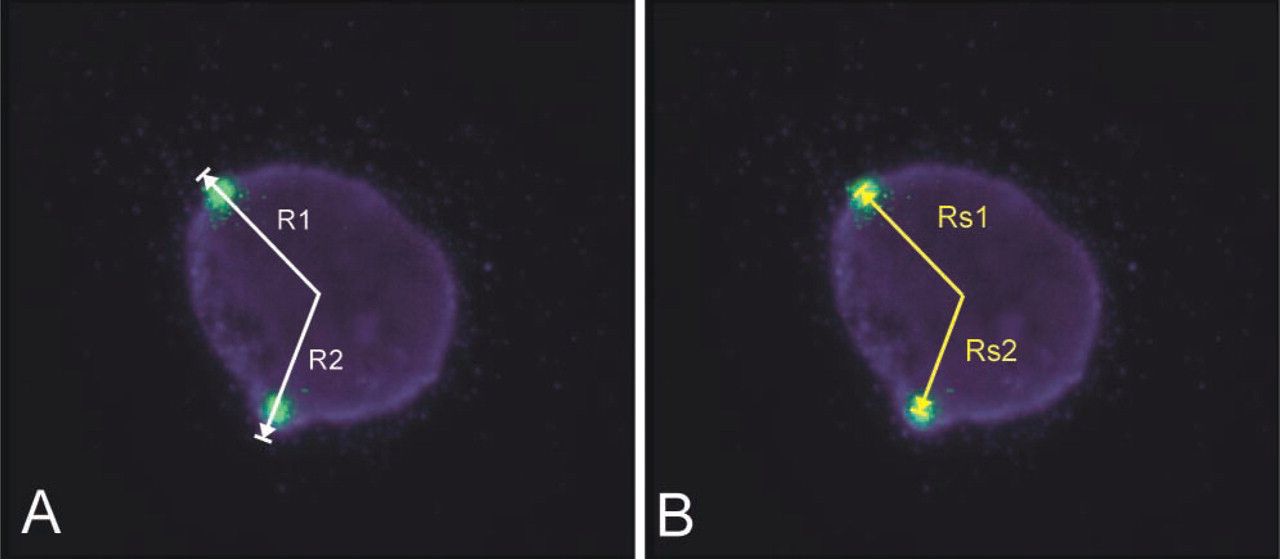
Examples of analyzed blastomere nuclei.
Our preliminary results will be confirmed by our further studies using higher numbers of blastomeres, stratified according to the respective PGS indication, parental age, and in relation to different types of autosomal and heterochromosomal aneuploidies. The most exact evaluation of chromosome topology can be obtained only by 3D FISH methods (Cremer et al. 2001) that so far are not feasible for PGS performed in human blastomeres.
Comparisons of distribution of measured relative signal distances with distribution expected in 3D sphere model
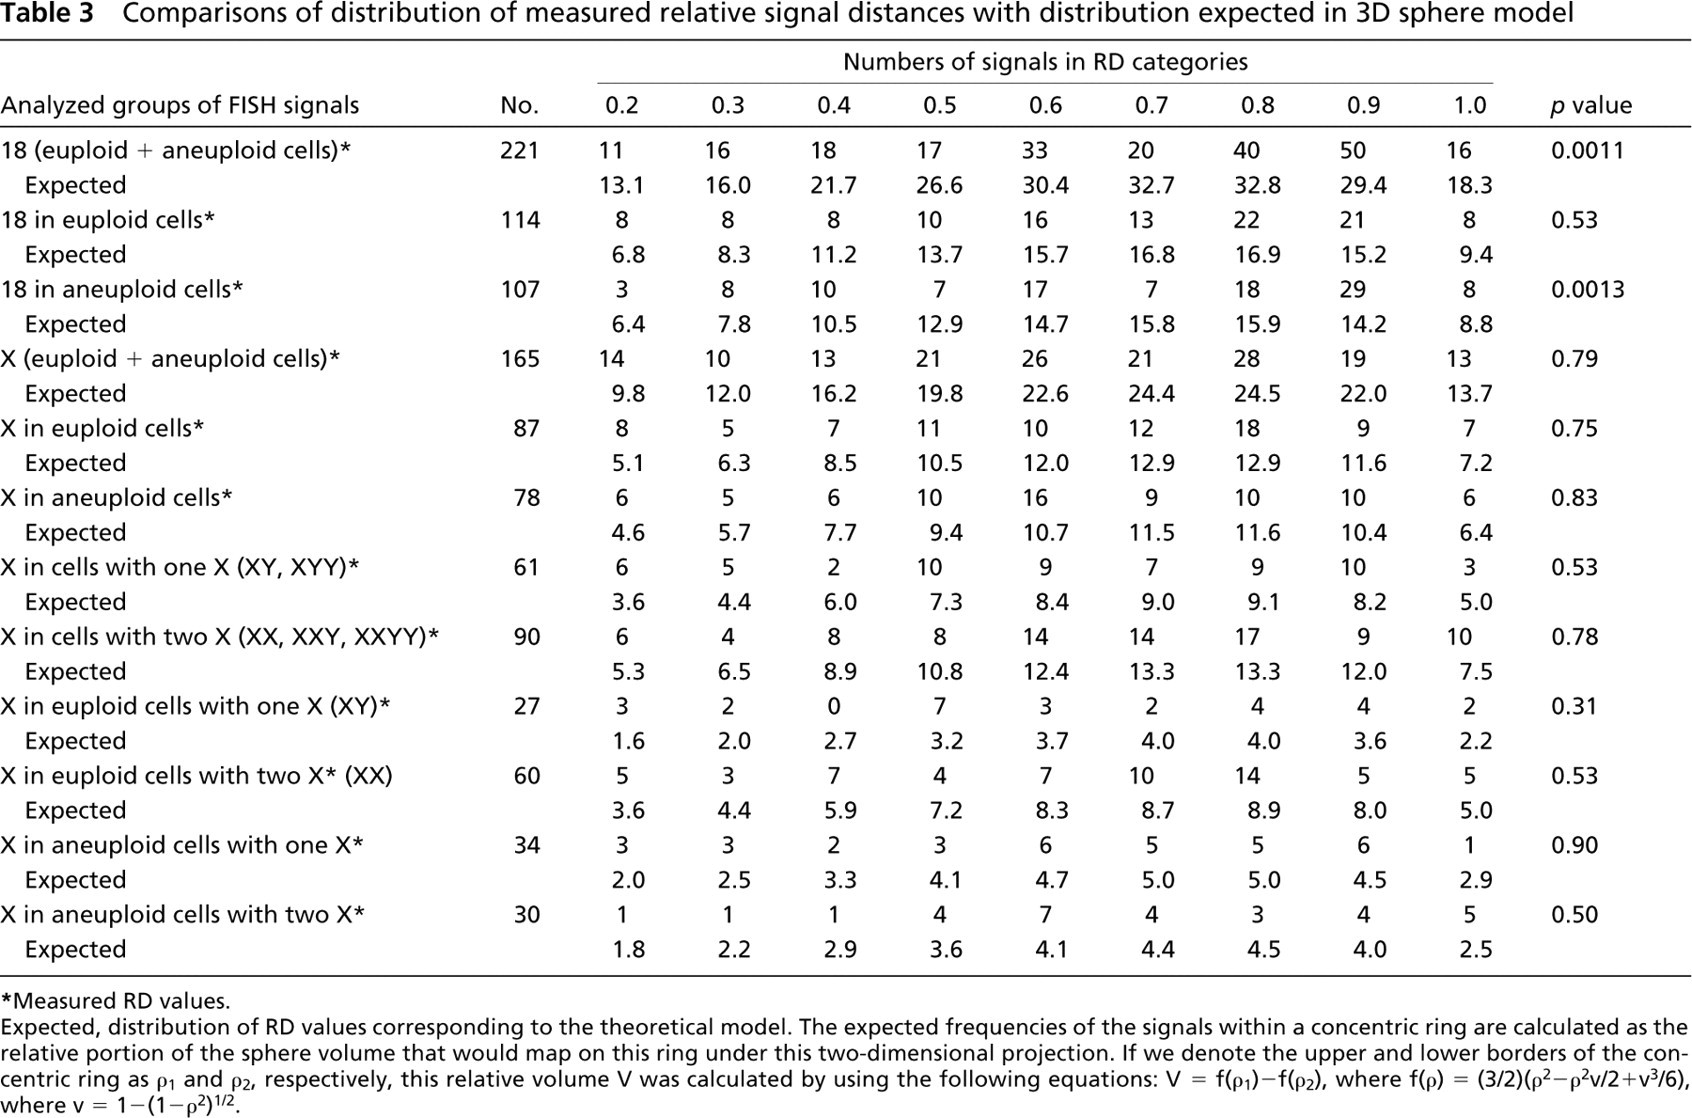
∗Measured RD values.
Expected, distribution of RD values corresponding to the theoretical model. The expected frequencies of the signals within a concentric ring are calculated as the relative portion of the sphere volume that would map on this ring under this two-dimensional projection. If we denote the upper and lower borders of the concentric ring as p1 and p2, respectively, this relative volume V was calculated by using the following equations: V = f(p1)–f(p2), where f(p) = (3/2)(p2−p2v/2+v3/6), where v = 1-(1-p2)1/2.
Obtained results stress the importance of further studies of chromosome topology to verify the possible role of aneuploidy on particular chromosome localization. Such studies will also elucidate respective gene expression, including the onset of early X chromosome inactivation in 3- to 4-day-old female IVF embryos. The likely practical outcome could be improved selection of embryos for transfer after preimplantation prenatal genetic diagnosis.
Footnotes
Acknowledgements
The work is supported by grants VZ FNM 00000064203, VZ UK 2.LF 111300003, Copernicus 2 ICA 2 CT 2000 100012 and IGA MZ CR NR/7962–3, and LN00A079.
We would like to thank Prof Milan Macek Jr DSc for critical review of this manuscript.