
Abstract
Telomerase is crucial for chromosome stability because it maintains telomere length. Little is known about telomerase in ovarian follicles, where an intense cell division is crucial to sustain estrous cycle and to drive oocyte development. The present research was performed to detect, by immunohistochemistry, the distribution of telomerase catalytic subunit (TERT) during folliculogenesis and to study the effect of TERT expression on telomeres. To this aim, telomere length has been measured on fluorescence in situ hybridization (FISH)-processed sections either in follicular or in germ cells. In primary and preantral follicles, TERT was observed in granulosa and in germ cells, with a typical nuclear location. During antral differentiation, only somatic cells close to the antrum (antral layer) and cumulus cells maintained TERT expression. The relative oocytes located TERT in the ooplasm independent from the process of meiotic maturation. FISH results indicate that a correlation exists between TERT expression and telomere size. In fact, progressively bigger telomeres were observed from preantral to antral follicles where longer structures were recorded in cells of the cumulus oophorus and of the antral layer than those of the basal one. Stable and elongated telomeres were detected in fully grown oocytes that lost the functional TERT distribution within the nucleus.
Keywords
T
Little is known about telomerase activity either during folliculogenesis or oogenesis. Studies on telomerase activity, detected with telomeric repeat amplification protocol (TRAP), have demonstrated that TERT operates in granulosa cells where it is likely to play an important role for healthy follicle life, whereas the loss of its activity may be associated with follicular atresia (Yamagata et al. 2002; Liu and Zhu 2003).
Moreover, telomerase activity was detected in germ cells. In this case, it has been hypothesized that telomerase ensures matured oocytes adequate chromosome stability to sustain the intense cell divisions during early embryogenesis in the absence of any new gene expression. Furthermore, telomerase activity is high in growing germ cells and decreases in mature fully grown oocytes (human: Wright et al. 1996; rat: Eisenhauer et al. 1997; bovine: Betts and King 1999; Xu and Yang 2000) and during embryo development when the inner cell mass starts to differentiate (Wright et al. 1996; Betts and King 1999; Xu and Yang 2000; Schaetzlein et al. 2004).
Nevertheless, because telomerase has been studied mainly with TRAP assay, no information is currently available on the expression of TERT protein within each follicle compartment. It also remains unknown as to what role TERT exerts on telomere length in follicular or germ cells.
For this reason, to evaluate the distribution of TERT protein that represents the rate-limiting determinant of telomerase activity (Cong et al. 1999; Misiti et al. 2000; Wang et al. 2000), immunohistochemical analysis was performed during pig folliculogenesis. The study was carried out throughout the growing phase of ovarian follicles considering both germinal and somatic follicular districts, because physiological development of mammalian ovarian follicles is strictly dependent on the existence of a bi-directional regulative dialogue between germinal and somatic cell compartments.
Moreover, to verify the effects that TERT expression has on telomere size, a quantitative evaluation of telomeres was carried out by using the fluorescence in situ hybridization (FISH)-processed sections technique. To this aim, individual telomeres were directly visualized on single ovarian follicles and germ cells, and their relative size was evaluated.
Materials and Methods
Tissue and Metaphase II Oocytes Collection
Fourteen pig ovaries from cyclic females were collected at a local abattoir and transported to the laboratory. To study primary and preantral follicles, a group of ovaries were trimmed of any extra tissue, cut into small ovarian cortical pieces, and immediately fixed in 4% paraformaldehyde/PBS for 12 hr at 4C. By contrast, antral follicles were isolated with the aid of a stereomicroscope in dissection medium (Dulbecco's phosphate-buffered medium with Ca2+ and Mg2+) and supplemented with 0.4% bovine serum albumin (BSA; Sigma, Dorset, UK). After measuring the diameter with a calibrated grid, antral follicles were further classified as small (<4 mm) or medium/large (4-5 mm). Healthy isolated follicles were then chosen as indicated by their translucent appearance, limpid follicular fluid, and extensive vascularization (Mattioli et al. 2001). Antral follicles were then fixed in 4% paraformaldehyde/PBS for 12 hr at 4C. Ovarian cortical pieces and single antral follicles were then dehydrated through ethanol series and embedded in paraffin wax. These collected tissues were then used either for immunohistochemistry experiments or for FISH.
To collect metaphase II oocytes, three large White X Duroc prepubertal gilts weighing 90.7 ± 5.2 kg (mean ± SD) were synchronized with a single IM injection of 1250 IU equine chorionic gonadotrophin (eCG; Folligon, Intervet, Boxmeer, Holland) to induce follicular growth. Oocyte maturation was stimulated 60 hr later by an IM administration of 750 IU human chorionic gonadotrophin (hCG; Corulon, Intervet, Boxmeer, Holland). In vivo matured oocytes (MII) were collected 44 hr after hCG injection. Oocyte collection was carried out by laparotomy on animals preanesthetized by an injection of azaperone (6 ml/gilt; Stresnil, Janssen, Beerse, Belgium) and atropine sodium salt (2 mg/gilt) and maintained under thiopental sodium (1.5 g/gilt; pentothol sodium; Gellini S.p.A., Aprilia, Italy) anesthesia. All protocols had prior approval of the Ethical Committee of the University of Teramo. The oocytes arrested at the metaphase II stage (MII oocytes) were identified for the presence of the first polar body. MII oocytes were then fixed in 4% paraformaldehyde/PBS for 1 hr at 4C and transferred to fresh PBS. Subsequently, MII oocytes were embedded in 4% agar (Bacto-agar; Difco Laboratories, Detroit, MI) in distilled water. Each oocyte was placed in a drop of buffer on a slide using a stereomicroscope, a drop of agar at a temperature of 40C was put over it, and a cube of ~2 × 2 × 2 mm containing the samples was cut out and transferred to fresh buffer (Hyttel and Madsen 1987). Following two additional washes in PBS, they were dehydrated through increasing concentrations of ethanol and were embedded in paraffin wax for immunohistochemistry experiments. Previous experiments (Barboni et al. 2002) have demonstrated that embedding in 4% agar and then re-embedding in paraffin wax has no impact on the immunohistochemical analysis. Instead, compared with the traditional techniques, it allows easier handling of oocytes during sample preparation.
Immunohistochemistry
Localization of TERT was accomplished with a polyclonal rabbit antibody anti-reverse transcriptase subunit (anti-TERT; Calbiochem, San Diego, CA). Immunohistochemistry was carried out with the avidin-biotin technique because it is more sensitive than fluorochromes (Polak and Van Noorden 1997). Thus, a three-step avidin-biotin-peroxidase complex (ABC) method, which allows the visualization of antigen expressed at very low levels (Lu and Partridge 1998), was performed on 8-μm sections placed on poly-
Immunohistochemical analysis was carried out on a total of 38 primary follicles, 26 preantral follicles, 21 small antral follicles and 18 relative germ cells, 23 medium/large antral follicles, 21 relative oocytes, and 25 MII oocytes.
At the end of the reaction, slides were inspected with an Axioskop 2 Plus microscope (Zeiss; Oberkochen, Germany) equipped with a cooled color charge-coupled device camera (CCD; Axiovision Cam, Zeiss) interfaced to a computer workstation provided with an interactive and automatic image analyzer (Axiovision, Zeiss). Qualitative analysis was carried out to study the distribution pattern of TERT immunopositivity by analyzing at least two sections per follicle randomly chosen, one at the poles and the other at the equator of each follicle. Moreover, each oocyte was studied by analyzing all sections crossing the nuclear compartment plus at least two more ooplasmic pictures.
Fluorescence In Situ Hybridization
Five-μm-thick sections, obtained from paraffin-embedded ovarian cortical pieces or isolated antral follicles, were processed for FISH. Cross-sections were deparaffinized by incubation for 10 min in xylene, washed for 10 min in 100% ethanol, and then air dried. Slides were then placed in 2x SSC at 45C for 5 min and subsequently treated with proteinase K (250 μg/ml; Sigma) in 2x SSC at 45C for 10 min. Slides were thoroughly rinsed with PBS followed by dehydration in ethanol series (70%, 95%, 100% at 2 min each) and air dried. Sections were denatured with 70% formamide (Carlo Erba; Milan, Italy) in 2x SSC, pH 7.0, at 75.5C for 5 min, followed immediately by dehydration in ice-cold ethanol (70%, 95%, 100% at 2 min each), and allowed to air dry. Because eukaryotic chromosomes contain conserved non-coding sequences of DNA repeats (TTAGGG)n and, in addition, pig telomeres were demonstrated to be identical to those of other vertebrates (Fradiani et al. 2004), a denatured all-human telomeric DNA probe was added to the slide (Qbiogene-Resnova; Rome, Italy) and glass coverslips were applied and sealed with rubber cement (Qbiogene-Resnova). After incubation overnight at 37C in a humidified chamber, slides were washed for 10 min in 50% formamide (Carlo Erba) in 2x SSC at 37C followed by washes at RT in 2x SSC. Hybridized signals were detected using a commercial kit (FITC avidin detection kit; Oncor Inc., Gaithersburg, MD) according to manufacturer's instructions. Propidium iodide (PI)/antifade 0.6 μg/ml (Qbiogene-Resnova) was used for chromatin counterstaining. All slides were analyzed using an Axioskop 2 Plus incident-light fluorescence microscope (Zeiss) equipped with a PL-Neofluorar × 100 oil immersion objective (numerical aperture 130) and a x10 ocular to provide images with a spatial resolution of 0.25 μm, a HBO 100 W mercury lamp, a FITC/PI filter (excitation: 450-490; barrier: LP 520; no. 09, Zeiss), and a PI filter (excitation: BP 546; barrier: LP 590; no. 15, Zeiss). The microscope was also provided with a cooled color CCD camera (Axiovision Cam, Zeiss) with a resolution of 1300 × 1030 pixels, configured for fluorescence microscopy and interfaced to a computer workstation provided with an interactive and automatic image analyzer (Axiovision, Zeiss).
Digital image analysis of telomere length was performed according to Miracco et al. (2002). For quantitative purposes, digital images were consecutively captured from sections immediately after hybridization with the fluoresceinated probes and counterstained with PI. Counterstain was used to scan the image, and the FITC/PI filter was set to confirm the simultaneous presence of probe signals (green) and PI (red). At the beginning of an imaging session, optimum exposure times were determined and held constant thereafter. Moreover, the oocyte nuclei (GV) were acquired by setting the luminousfield diaphragm on the whole area of the GV. This procedure was performed to exclude from the acquisition the fluorescent signals of granulosa cells. In all cases, telomeric signals were within the linear response range of the CCD camera, which was verified by using standard fluorescent microbeads (In Speck microscope image intensity calibration fluorescent microspheres; Molecular Probes, Eugene, OR) (Meeker et al. 2002). Image acquisition was performed with dedicated software (Axiovision, Zeiss). After the acquisition of the digitized image, it was stored in a 1300 × 1030 pixel file. Images were imported in the 24-bit uncompressed TIF format and then processed with the image analyzer using the dedicated computer program (KS300 computed image analysis system, Zeiss). For granulosa cells, analyses were carried out on a total of 18 preantral follicles and 23 small and 28 medium/large antral follicles, respectively. At least two sections per follicle were randomly chosen as described previously. For mural granulosa cells, analyses were performed by capturing separately the images of the cells close to the basal membrane (basal layer) from those cells near the antrum (antral layer). In addition, cumulus cells surrounding the oocyte were then considered. The single layer of granulosa cells of primary follicles was not investigated by FISH analysis because its nuclei is so flattened that a morphological comparison with the other granulosa cells is not allowed. Moreover, in regard to oocyte analysis, at least two cross-sections that included the nuclei of the oocytes were considered for each germ cell. In particular, 30 oocytes of primary follicles, 18 oocytes of preantral follicles, and 20 small and 24 medium/large antral follicle oocytes were analyzed. MII oocytes were not investigated for FISH analysis because their nuclei present a wider chromosome condensation and a precise distribution completely different from the G-phase nuclei that represent the cell-cycle phase common to the germinal cells analyzed.
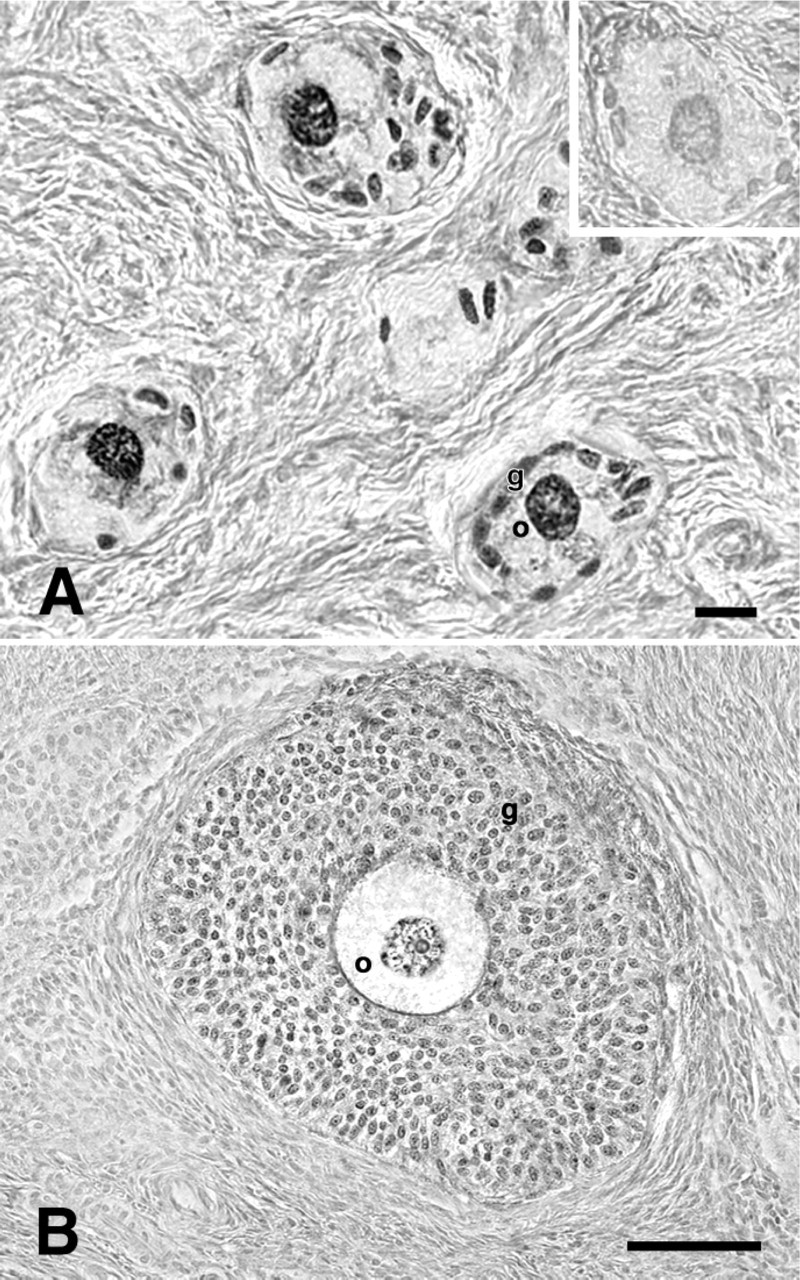
Microphotographs showing immunohistochemistry analysis for telomerase catalytic subunit (TERT) in primary and preantral follicles.
Quantification of the digitized fluorescent telomere signals was accomplished using a semi-automated algorithm written with the image analysis software package KS300 (Zeiss). The computer program generates one image showing the nuclei stained red with PI and the telomeres that are assumed to hybridize quantitatively to the FITC fluorescent probe and appear as bright green spots. After densitometric calibration of the background, the algorithm performs (a) segmentation of telomeres; (b) measurements of their areas, lengths, and mean densitometric value; and (c) counts of number of telomeres per nuclear section. Briefly, after acquisition of the image, a geometric calibration is performed. A densitometric calibration follows, which relates the image to a 0-256 gray scale. Only the objects on the same planar focus are then chosen for the analysis. Parameters to be measured are then selected and include number of telomeres, mean densitometric value, area, and feret maximum, corresponding to the value of the major diagonal connecting the two farthest points at the periphery of the object. Further background correction is then performed through Low Pass and Shadcorr filters. Segmentation of telomere spots is then improved. For each pixel, the average intensity value of neighboring pixels is subtracted from its intensity, resulting in a telomere pixel if the image of its edge is above a threshold level. Otherwise, it is considered a background or boundary pixel. Measures can be evaluated on the images of nuclei and telomeres by placing an electronic grid on them. Results are then recorded for statistical evaluation.
Microphotographs showing immunohistochemistry analysis for TERT in small and medium/large antral follicles.
Statistical Analysis
Data obtained from granulosa cell and GV telomere analysis at the different follicular stages were tested for normal distribution and then compared using ANOVA. Statistical analysis was carried out on transformed data by logarithmic function; p values <0.05 were considered significant, and p values <0.01 were considered highly significant.
Results
TERT Expression Pattern: Somatic and Germinal Compartments
TERT was expressed in pig ovarian follicles, independent from the developmental stages considered, both in somatic and germinal compartments.
In particular, primary follicles showed a punctuate pattern of TERT immunopositivity in the single layer of granulosa cells surrounding the oocyte (Figure 1A). Analogously, TERT immunolabeling was recorded in somatic cells of preantral follicles organized in two or more granulosa cell layers (Figure 1B). Small (<4 mm) antral follicles displayed a punctuate positivity either in the cumulus cells surrounding the oocyte or in the mural granulosa layer. However, as shown in Figure 2A, not all mural granulosa cells were immunopositive.
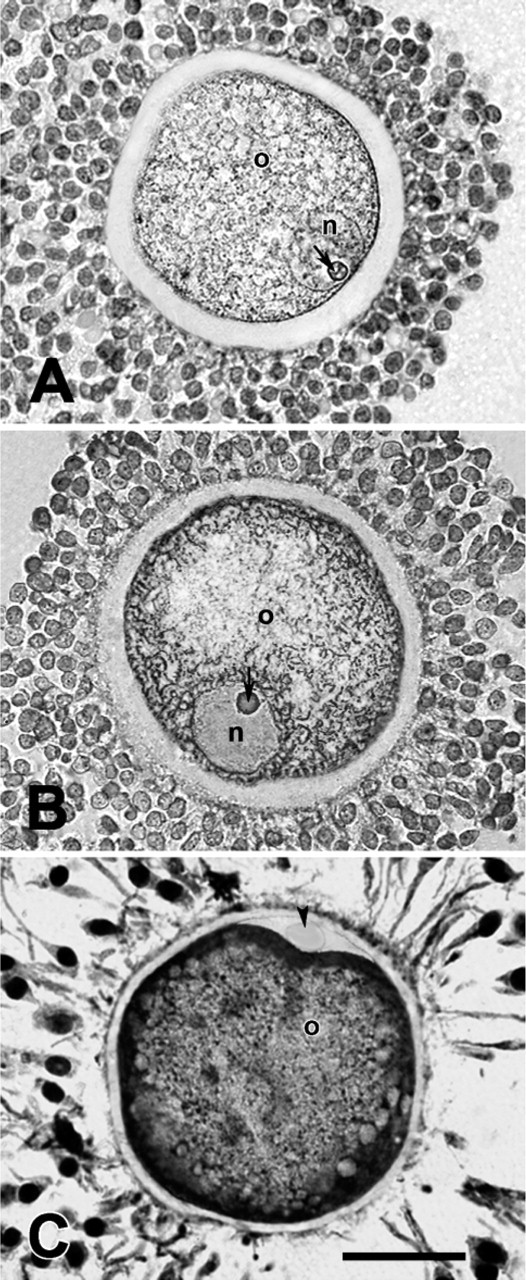
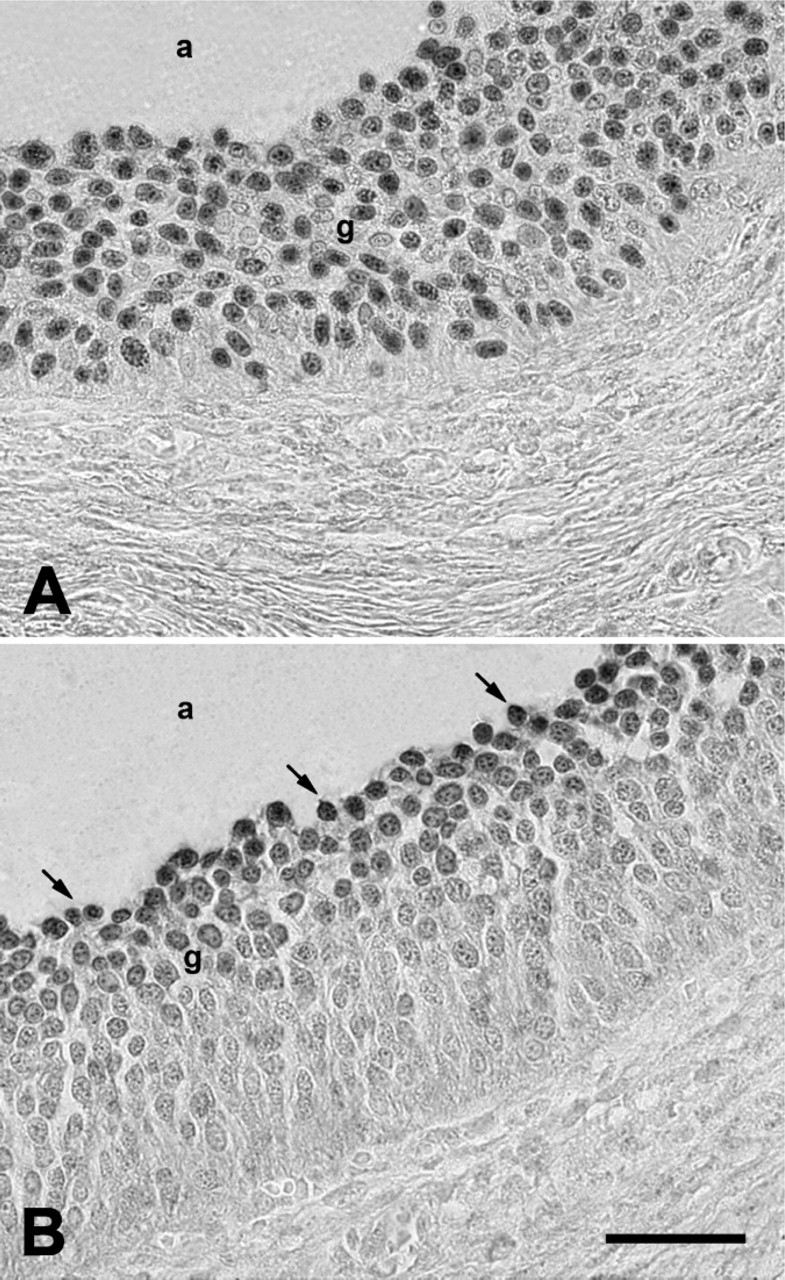
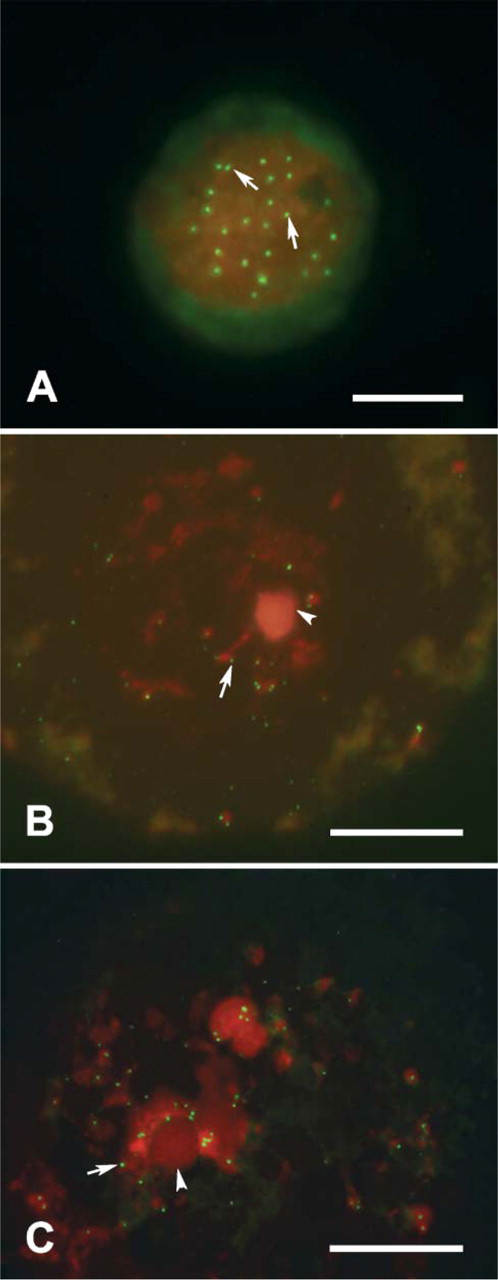
Microphotographs showing immunohistochemistry analysis for TERT carried out in cumulus oocyte complexes of small antral follicle, medium/large antral follicle, and MII oocyte. (A) An example of oocyte (o) enclosed in a small antral follicle that reveals TERT distributed in the nucleus (n), in the nucleolus (arrow), and in the cytoplasm. Most of the surrounding cumulus cells are TERT positive. (B) An example of immature GV-oocyte (o) of a medium/large antral follicle. TERT is present in the ooplasm, a part the positivity displayed from the nucleolus (arrow). The majority of cumulus cells express TERT. Nucleus (n). (C) MII oocyte (o), embedded in 4% agar and then re-embedded in paraffin wax, shows a clear subcortical cytoplasmic TERT distribution. Meanwhile, the polar body does not show any positivity (arrowhead). The expanded cumulus cells display the presence of TERT with a clear nuclear location. Bar = 50 μm.
A similar pattern of TERT expression was recorded in medium/large (4-5 mm) antral follicles where cumulus and part of the granulosa cells were positive. In addition, TERT distribution was typical in these follicles because immunolabeling involved exclusively the granulosa cells localized close to the antrum (antral layer; Figure 2B).
TERT expression has also been observed in the germinal compartment from primary to antral follicles. The oocyte of primary and preantral follicles showed a punctuate immunopositivity for TERT in the germinal vesicle (Figures 1A and 1B) associated in the oocytes of preantral follicles with an evident nucleolar immunopositivity (Figure 1B). In small (<4 mm) antral follicles, however, the oocyte showed TERT both in the nucleus and in the cytoplasm. The typical perinucleolar location was also recorded (Figure 3A). Finally, TERT protein was recorded in the ooplasm of the germ cells of medium/large (4-5 mm) antral follicles where within the nuclear compartment only perinucleolar staining remained (Figure 3B). Immunohistochemical investigation performed on mature MII oocytes confirmed the presence of TERT in the cytoplasm with a typical subcortical distribution. On the contrary, no positivity was observed within the first polar body (Figure 3C).
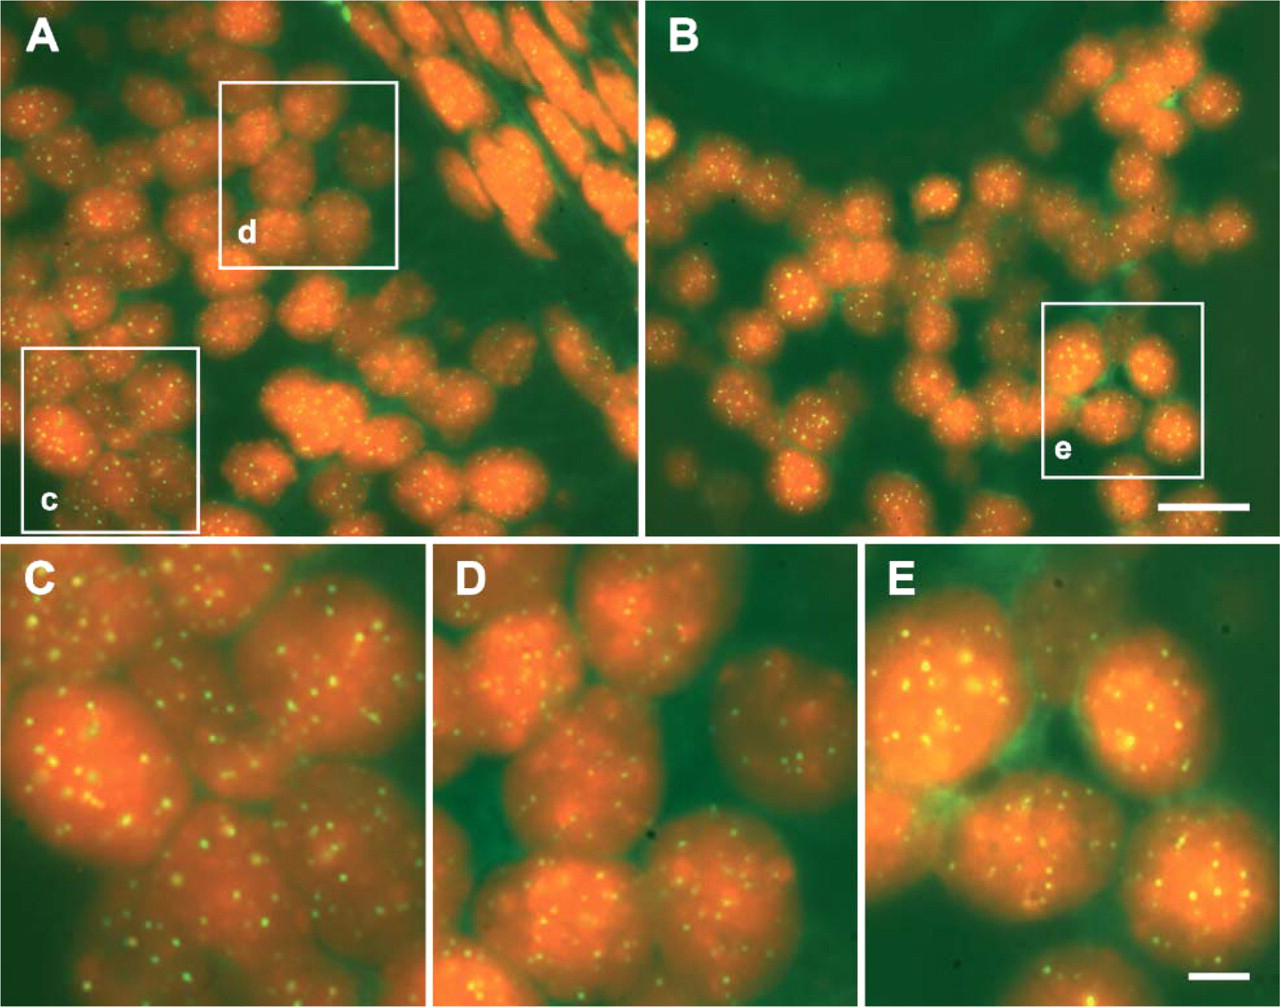
An example of digital images of somatic cell telomeres obtained from a follicle wall of medium/large antral follicles using the quantitative fluorescence in situ hybridization (Q-FISH) technique. In these sections from standard formalin-fixed, paraffin-embedded antral follicles, telomeres are visualized as bright green spots (FITC), whereas DNA is counterstained in red with propidium iodide. To obtain reproducible results, the images were all captured maintaining the same optical conditions. (A) An example of mural granulosa layer where the higher fluorescence signal emitted from the telomeres of the granulosa cells of the antral layer (c) can be qualitatively compared to those of the granulosa cells close to the basal membrane (d). (B) Cumulus cells surrounding the oocyte, observed at low magnification (e). (C) Higher magnification of (c) in (A). (D) Higher magnification of (d) in (A). (E) Higher magnification of (e) in
In Situ Analysis of Telomere Length (Quantitative FISH): Somatic and Germinal Compartments
To study the relative size of single telomeres, FISH was performed on different categories of follicles and in the relative germ cells.
As shown in Figure 4, all granulosa cells analyzed displayed telomeres distributed within the nuclei. In addition, the size of each hybridized telomere spot appears to be independent from its distance by the nuclear periphery, indicating that individual differences in telomere signal intensity within nuclei are not caused by local variations in probe access into the cell.
In somatic cells the mean number of telomeres detected per nucleus was 30.13 ± 5.2, independent from the follicular stage analyzed and from the cell layer considered (cumulus or granulosa cells).
Granulosa cells of preantral follicles showed a telomere area (TEA) of 0.085 ± 0.053, a feret maximum (TEFmax) of 0.394 ± 0.136, and a mean densitometric value (MEAND) of 121.789 ± 19.275 (Figure 5). Similar values were obtained in mural granulosa and cumulus cells of small (<4 mm) antral follicles (TEA 0.087 ± 0.051, TEFmax 0.403 ± 0.140, MEAND 122.979 ± 19.262 and TEA 0.088 ± 0.051, TEFmax 0.404 ± 0.137, MEAND 122.999 ± 19.290, respectively; Figure 5).
Different results were recorded in the somatic compartment of medium/large antral follicles where two different populations of mural granulosa cells were observed. The first category of somatic cells was the granulosa cells localized near the basal membrane (basal layer) that did not present TERT immunostaining and showed smaller telomeres than those observed in preantral and small (<4 mm) antral follicles (TEA 0.076 ± 0.069, p<0.01; TEFmax 0.367 ± 0.158, p<0.01; MEAND 116.430 ± 28.651, p<0.01; Figure 5). In a different manner, granulosa cells of the antral layer displayed FISH fluorescence values significantly higher than those recorded in the basal granulosa layer and in preantral and small antral follicles (TEA 0.097 ± 0.081, p<0.01; TEFmax of 0.413 ± 0.168, p<0.01; MEAND 127.131 ± 24.501, p<0.01; Figure 5). Cumulus oophorus cells, in terms of telomere size, were similar to the category of antral granulosa cells (TEA 0.098 ± 0.053, TEFmax 0.414 ± 0.131, MEAND 126.167 ± 29.670; Figure 5).
The telomere size has been analyzed, in parallel, in the germinal compartment. In all the oocytes analyzed, telomeres were distributed in correspondence to the chromatin counterstained with PI (Figure 6). Chromatin structure changes during folliculogenesis passing from a widespread organization in oocytes enclosed in primordial and preantral follicles to a typical condensed structure, like a horseshoe, distributed around the nucleolus in fully grown oocytes (Figure 6). Oocytes of primary follicles, which have a nucleus (GV) with a diameter of 8 μm, showed a mean telomere number per section of 25.75 ± 3.10 and the following FISH values: TEA 0.096 ± 0.059, TEFmax 0.422 ± 0.139, and MEAND 71.443 ± 21.634 (Figure 7). Instead, oocytes of preantral follicles, which possess a GV of ~15-20 μm, showed a significantly higher mean number of telomeres per section (48.16 ± 7.31; p<0.01) with FISH fluorescence intensity values significantly lower (TEA 0.066 ± 0.043, p<0.01; TEFmax 0.351 ± 0.116, p<0.01; MEAND 41.244 ± 12.762, p<0.01; Figure 7). Telomeric signals increased in germ cells of small (<4 mm) and medium/large (4-5 mm) antral follicles where a similar mean telomere number per section was recorded within their GVs of ~20 μm in diameter (47.41 ± 4.63 and 46.84 ± 3.92 in germ cells of small and medium/large antral follicles, respectively; p>0.05). In fact, both categories of oocytes with similar FISH fluorescence values showed significantly bigger telomeres than those recorded in the oocytes enclosed in preantral follicles (small antral follicles: TEA 0.097 ± 0.089, p<0.01; TEFmax 0.420 ± 0.186, p<0.01; MEAND 70.748 ± 35.235; medium/large antral follicles: TEA 0.098 ± 0.083, p<0.01; TEFmax 0.421 ± 0.182, p<0.01; MEAND 71.049 ± 32.274, p<0.01; Figure 7).
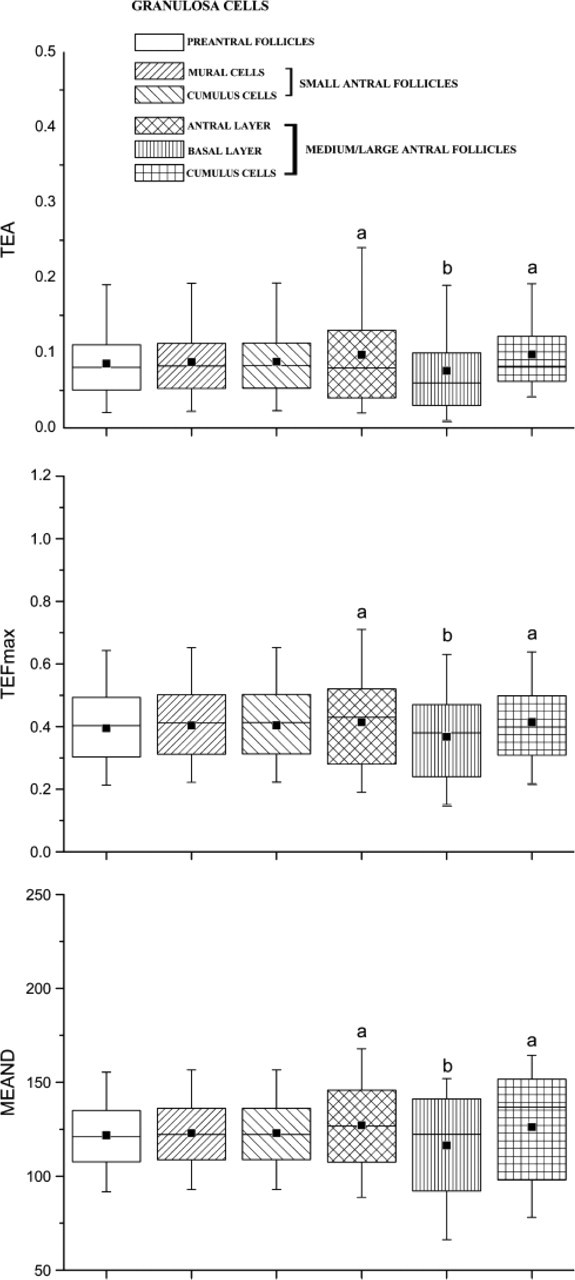
Telomere area (TEA), feret maximum (TEFmax), and mean densitometric value (MEAND) examined in the somatic compartments of preantral, small (<4 mm), and medium/large (4-5 mm) antral follicles. Mural granulosa cells of medium/large antral follicles were analyzed separately as antral layer and basal layer. The horizontal lines in the box plots express the 5th, 25th, 50th, 75th, and 95th percentile of the distribution. The box stretches from the 25th to the 75th percentile and therefore contains the middle half of the scores in the distribution. The median is shown as a line across the box, whereas the mean value is shown as a black square within the box. Data of TEA, TEFmax, and MEAND that were highly significant (p<0.01) after statistical analyses are indicated by letters a and b.
Discussion
The present research has provided evidence that TERT is expressed during pig folliculogenesis both in granulosa and germ cells. Moreover, with the aid of quantitative FISH (Q-FISH) technique, it has been demonstrated that telomere structures are actively rearranged during ovarian follicle development and oocyte growth.
Q-FISH technique has recently been developed to assess telomere size on tissue sections from standard formalin-fixed, paraffin-embedded samples (Meeker et al. 2002; Miracco et al. 2002; Tanemura et al. 2005) assuming that fluorescence intensity, measured with optical density parameters, is directly correlated with telomere length (Martens et al. 2000; Slijepcevic 2001). Apart from the quantitative information, Q-FISH adds important topographical information about telomere distribution, allowing to differentiate and to locate within each tissue district the cells with short or long telomeres. Finally, use of the Q-FISH technique makes it possible to overcome the impossibility to obtain, from a single cell such as the oocyte, sufficient amounts of DNA to adopt the traditional biochemical approaches for DNA evaluation (especially for Southern blot assay).
Examples of digital images of GV telomeres obtained from oocytes enclosed in primordial, preantral, and antral follicles by using the Q-FISH technique. In these images, telomeres are visualized as bright green spots (FITC), whereas chromatin is counterstained in red with propidium iodide. In addition, GVs were acquired by closing the luminous-field diaphragm until the entire nuclei was visible in the field of view. To obtain reproducible results, all images were captured maintaining the same optical conditions.
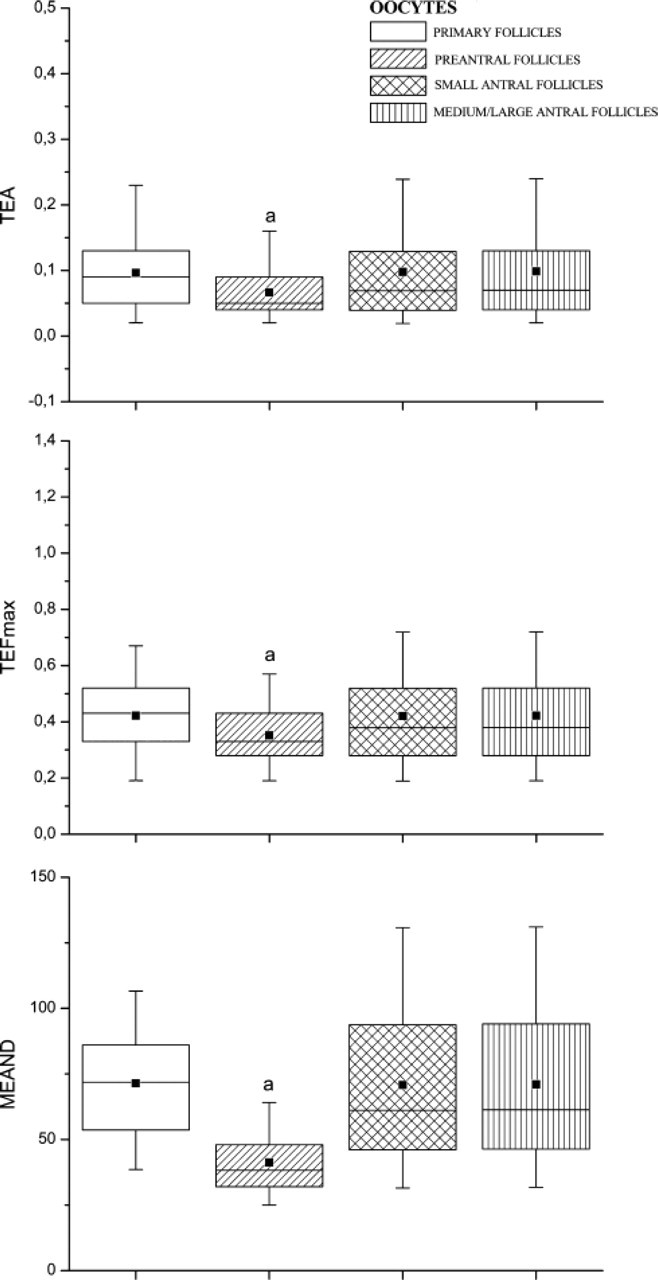
TEA, TEFmax, and MEAND examined in the GVs of primary, preantral, small, and medium/large antral follicles. Horizontal lines in the box plots express the 5th, 25th, 50th, 75th, and 95th percentile of the distribution. The box stretches from the 25th to the 75th percentile and therefore contains the middle half of the scores in the distribution. The median is shown as a line across the box, whereas the mean value is shown as a black square within the box. Data of TEA, TEFmax, and MEAND that resulted highly significant (p<0.01) after statistical analysis were indicated by the letter a.
From the results obtained in the present research, it was interesting to observe that granulosa cells displayed immunopositivity for TERT, whose expression is closely associated with telomerase activity (Cong et al. 1999; Misiti et al. 2000; Wang et al. 2000) even if the cells are considered somatic. Although all granulosa cells of primary and preantral follicles expressed TERT, a clear differentiation began when follicles started to develop the antrum. In fact, in antral follicles, only the cumulus cells and most of the antral layer granulosa cells were positive to the anti-TERT antibody. As suggested by Lavranos et al. (1999), these data seem to confirm that some granulosa cells are stem-like cells. This hypothesis was originally developed by analyzing the higher rates of cumulus cell-derived clones obtained (Wakayama et al. 1998) and interpreted as dependent on the more faithfully reprogrammable nuclei of cumulus cells, in comparison with other somatic cells used for nuclear transfer (Lavranos et al. 1999; Rideout et al. 2001).
Currently, three subtypes are recognized deriving from precursor epithelioid cells of the primordial follicle: cumulus cells that will surround the oocyte and, in the follicular wall, the cells in the basal and antral layers (Rodgers et al. 1999). On the basis of TERT expression, it is confirmed that mural cells can be distinguished in basal and antral layers. In fact, reverse transcriptase subunit was observed only in the cells localized close to the antrum. The presence of a functional differentiation within somatic follicular cells was also suggested by several authors who demonstrated a different expression of many genes, distribution of LH receptors (Amsterdam et al. 1975; Bortolussi et al. 1977), and location of steroidogenic enzymes (Zoller and Weisz 1978; Zlotkin et al. 1986; Tabarowski and Szoltys 1987) and housekeeping enzymes as well (Zoller and Weisz 1979; Zoller and Enelow 1983). It has been proposed, in this context, that cells localized in the basal zone of the mural layer are better differentiated than the antrally situated cells (Amsterdam and Rotmensch 1987).
Data from TERT immunohistochemistry associated with the results obtained with Q-FISH seem to add new information. In fact, whereas Q-FISH performed on the somatic compartment has shown a progressive elongation of the telomeres from preantral follicles to the antral follicles, in medium/large antral follicles only cumulus cells and antral granulosa layer possess elongated telomeres, as a consequence of a prompt telomerase activity indirectly demonstrated by TERT positivity. On the basis of TERT expression and of telomere size, the antral layer acquired a chromosomal stability considered to be typical only of immortalized cell populations (Blackburn 1991).
Basal granulosa cells, even if derived from common granulosa cell precursors, had significantly shorter telomeric structures because they underwent a constant number of cell divisions in the absence of TERT and therefore of telomerase activity. For this reason, basal granulosa cells may be considered real somatic cells because in this category of granulosa cells a correlation exists between telomere sequence loss and cell proliferation (Martens et al. 2000).
In parallel, in mammalian oocytes also, telomerase catalytic subunit distribution pattern changes during folliculogenesis. In particular, from primordial to preantral follicles, TERT is revealed at a nuclear level, whereas in fully grown germ cells of small antral follicles TERT started to be exported into the ooplasm. TERT cytoplasmic translocation was progressively completed in the oocytes of medium/large antral follicles where the nucleus maintained only nucleolus positivity. This last immunopositivity is not surprising because in different mammalian cells there is evidence for the presence of telomeric components within the nucleoli (Mitchell et al. 1999; Narayanan et al. 1999). In particular, nucleoli and Cajal bodies are considered specific sites for modification of telomerase RNA and telomerase ribonucleoprotein biogenesis (Lukowiak et al. 2001). Data obtained with immunohistochemistry are in agreement with previous TRAP experiments (Wright et al. 1996; Eisenhauer et al. 1997; Betts and King 1999; Xu and Yang 2000) that demonstrated that TERT activity is present during the growth phase but decreases during oocyte maturation. In addition, the physiological role of telomerase in synthesis of telomeric repeat occurs in the cell nucleus (Liu et al. 2001). In the present research we confirmed that a nuclear location of the enzyme in the oocyte can be associated with an active role of TERT in telomere rearrangement. In fact, Q-FISH analysis revealed that the nuclear TERT presence in germ cells of preantral and small antral follicles determined a telomere elongation (expressed as mean area, feret maximum, and mean densitometric value). Telomeric rearrangement in growing oocytes must be added to the modifications in large-scale chromatin structure and to the biochemical mechanisms that coordinate global gene transcription. This is consistent with the knowledge that reprogramming and remethylation in female germ cells take place after birth, during growth of oocytes (Reik et al. 2001). Telomere elongation recorded during the transition from preantral to antral follicle may be interpreted as a process performed from female germ cells to bring long telomeres to the zygote that after fertilization might serve as a zero-time length mark for subsequent cell divisions. In parallel, it has been demonstrated that mature male germ cells also possess analogously long telomeres if compared with those of somatic cells (human: de Lange et al. 1990; pig: Kozik et al. 1998), thus contributing at the singamy with an adequate genomic property.
In fully grown oocytes where the active chromatin remodeling is concluded, TERT expression stops in the nucleus and starts to be localized in the ooplasm. A cytosolic distribution is presumably non-functional (Liu et al. 2001) and, in fact, fully grown oocytes maintain their telomere length unchanged. The same telomere length values (expressed as mean area, feret maximum, and mean densitometric value) were recorded in the oocytes enclosed in small and medium/large antral follicles.
Furthermore, the location of TERT in the ooplasm, particularly evident in MII oocytes, could represent a maternal stock of quiescent telomerase proteins that will be activated after fertilization, possibly through calcium oscillations (Xu and Yang 2000). It is known that embryo development is dependent on maternal mRNAs and proteins that are accumulated during oocyte growth and maturation, until the transcriptional activation of embryonic genome occurs (at the four-cell stage in porcine embryos) (Jarrell et al. 1991; Bonk et al. 2002). Functional telomeres play an important role in germ cells undergoing fertilization because dysfunction of meiotic telomeres can contribute to aberrant fertilization as well as lead to abnormal cleavage of embryos. It has been demonstrated that fertilized eggs from late generations of telomerase-null mice exhibited a high incidence of apoptosis, as evidenced by both cytofragmentation and nuclear DNA fragmentation (Liu et al. 2002). More recently, Keefe et al. (2005) demonstrated that telomere length predicts cytoplasmic fragmentation in embryos from women undergoing IVF for treatment of infertility. An apparently incongruous result is the Q-FISH values recorded in the oocytes of primary follicles. Unexpectedly, telomeres belonging to these oocytes had telomere length values falling within the range of telomeres of antral follicle oocytes. Nevertheless, to correctly interpret this result it must be considered that the mean telomere number in the oocyte nuclei of primary follicles was nearly half of the telomeres present in the GV of preantral or antral follicles. Thus, in the nuclei of the germ cells of primary follicles, telomeres are so closely apposed to its neighboring telomeres that the single telomere signal recorded is in reality the combination of two or more telomeres. On the basis of this data, it must be assumed that FISH fluorescence values can be efficiently compared only in cells that display a similar mean number of telomeres, as is the case of the other categories of germ cells and somatic cells.
Finally, because the chromosome numbers in swine are 2n = 38, it must be considered that the parameter “telomere number” recorded on tissue sections is not the total number of telomeres but includes only the telomeres present in sectioned nuclei (5 μm).
Inconclusion, our results suggest that telomere length changes during folliculogenesis in somatic and germ cells. In particular, granulosa cells progressively elongate their telomeres as a consequence of the enzymatic activity of TERT that is conserved during whole folliculogenesis, a part of the somatic cells localized close to the basal membrane. Even if the functional significance of these results is still not clear, the present research has defined, for the first time, that two different subtypes of granulosa cells exist within the mural layer.
Moreover, the process of telomere rearrangement involves also the germinal compartment where significantly longer and stable telomeres characterize the fully grown oocytes where TERT exits from the nucleus. Because telomere length is already determined at the moment of fertilization, a detailed understanding of this telomere elongation program could be important for studying oocyte quality, thus providing a useful outcome predictor after IVF treatment.