
Abstract
Parathyroid hormone-related peptide (hPTHrP) is expressed in human tissues and regulates cellular proliferation, differentiation, and apoptosis by an autocrine/paracrine loop. In rodent thymus, both parathormone and parathyroid hormone-related peptide (PTHrP) are expressed by thymic epithelial cells (TECs). The present study demonstrated by RT-PCR and immunohistochemistry that hPTHrP and parathyroid hormone-related peptide receptor type 1 (PTHR1) were expressed in human thymus at both RNA and protein levels. hPTHrP was expressed mainly in the thymic medulla by epithelial (cytokeratin-positive), mature dendritic (CD40+/86+) and plasmacytoid interleukin (IL)-3Rα+ cells. This protein was also present in some cells forming Hassall's bodies and a few subcapsular and cortical TECs. PTHR1 was expressed by scattered subcapsular and cortical TECs and by rare TECs in the medulla. Thymocytes did not express either hPTHrP or PTHR1. Primary cultures of human TECs revealed the presence of both hPTHrP and PTHR1 mRNAs, confirming the capacity of TECs to synthesize both peptides. Moreover, synthetic (1–39) hPTHrP peptide administered on cultured TECs induced the expression of IL-6 mRNA, suggesting that hPTHrP can regulate thymic functions by inducing in TECs the expression of IL-6, which is involved in the development and maturation of thymocytes.
P
The thymus has a pivotal role in the development of cellular immunity, regulating proliferation, maturation, and selection of T cells. In particular, the key events in intrathymic T cell differentiation are driven by the influence of the thymic microenvironment network, comprising distinct cell types, such as thymic epithelial cells (TECs), macrophages, and dendritic cells (DCs), as well as extracellular matrix elements (Boyd et al. 1993). Furthermore, the TEC component is heterogeneous in terms of morphology and phenotype. The TEC subsets could have specific functions in thymocyte differentiation, and bidirectional TEC–thymocyte interactions represent an important biological circuitry (Ritter and Boyd 1993). Many data have shown that thymus physiology is regulated by both endogenous and exogenous neuroendocrine factors (Dardenne and Savino 1994).
In rodent thymus, both PTH (Gunther et al. 2000) and PTHrP (Funk et al. 1999) are expressed by the TEC component, whereas in the human thymus, only the presence of hPTHrP has been documented (Kramer et al. 1991). At present, still unclear are which thymic cell components produce hPTHrP, as well as the possible role of hPTHrP and PTHR1 in human thymus physiology.
Among the various substances produced by TECs, interleukin (IL)-6 seems to be implicated in the development and ageing of human thymus; moreover, in vitro observations indicate that IL-6 regulates proliferation and differentiation of TECs and thymocytes and that it prevents thymocyte apoptosis (Screpanti et al. 1992; Savino et al. 1998). As in other cell types, hPTHrP regulates IL-6 production in an IL-1-dependent manner (Casey et al. 1993). It can be hypothesized that this peptide modulates IL-6 production also in TECs.
This study investigated the expression and cellular localization of hPTHrP and PTHR1 in human thymus; moreover, we evaluated the capacity of hPTHrP to regulate the expression of IL-6 in cultured TECs.
Materials and Methods
Subjects and Thymic Samples
Thymic lobes were obtained from five patients, 5 months to 3 years old, undergoing open chest surgery for congenital heart disease, after informed consent. Thymocyte suspension was obtained from thymus tissue mechanically disaggregated using a scalpel and needle followed by syringing through a 22-gauge needle. All steps were performed in sterile PBS containing 0.1% bovine albumin and in melting ice to limit apoptotic death of thymocytes. The viability, as assessed by dye-exclusion test, was >90%. Primary TEC cultures were prepared as previously reported (Denning et al. 1987; Rocca et al. 2002). Briefly, thymic tissue fragments were cut with a scalpel into small pieces and digested at 37C with 1 mg/ml collagenase A and 50 mg/ml DNase I in RPMI 1640 (Roche; Mannheim, Germany) for 45 min. After digestion, the tissue was collected by gravity sedimentation. The tissue fragments collected from the first digestion were subjected to a second round of digestion with collagenase A and DNase I for 30 min. The cell suspension obtained after the second digestion was washed in RPMI 1640 medium. After 5 min of gravity sedimentation, the cell pellet was washed with PBS and cultured in PC1 serum-free medium (Cambrex Bioscience; Milano, Italy) on petri dishes coated with collagen type I (Roche). The serum-free medium was changed every 3 days. After 1 week of culture, the first cluster of adherent TECs could be observed and expanded in almost confluent monolayers. TEC cultures were utilized within 8–10 passages.
Immunohistochemistry
Thymus specimens were fixed with phosphate-buffered formalin, pH 7.2, for 4 to 18 hr. The sections were collected on 3-aminopropyltriethoxy-silane (Sigma Chemicals; Milan, Italy) or on naturally charged slides (Dako; Milano, Italy), allowed to dry overnight at 37C to ensure optimal adhesion, dewaxed, rehydrated, and treated with 0.3% H2O2 in methanol for 10 min to block endogenous peroxidase. For antigen retrieval, the sections were microwave treated in 0.01 M citrate buffer at pH 6.0 for 10 min and allowed to cool for 20 min. The sections were incubated at room temperature with normal goat serum for 15 min and then for 1 hr with the following monoclonal antibodies: anti-human hPTHrP (dilution 1:50, clone 212–10.7; Oncogene, San Diego, CA); anti-PTHR1 (dilution 1:20, clone 3D1.1; Santa Cruz Biotechnology, Santa Cruz, CA). Indirect immunostaining was achieved using the ABC-peroxidase technique. Endogenous biotin was saturated using a biotin blocking kit (Vector Laboratories; Burlingame, CA). The peroxidase was developed using the DAB substrate kit (Vector Laboratories). For immunohistochemical double staining with hPTHrP and anti-cytokeratins (monoclonal antibody anti-PAN cytokeratins, dilution 1:100, C-2562; Sigma) or anti-CD40 (mouse anti-human monoclonal antibody, dilution 1:50, clone 11E9; Novocastra, Newcastle, UK), the EnVision Doublestain System-K1395 was used (Dako). As chromogenic substrates for alkaline phosphatase, both BCTP-NBT and Fast Red systems (Dako) were used. As chromogenic substrates for peroxidase, both DAB and AEC systems (Dako) were used. Sections were lightly counterstained with hematoxylin. For immunofluorescent double stainings with hPTHrP or PTHR1, anti-IL3-Rα (CD123) (monoclonal antibody; dilution 1:50, clone 7G3; BD Biosciences, San Diego, CA) or anti-CD86 (monoclonal antibody; dilution 1:50, clone BU63; Ylem, Avezzano, Italy) was used. Immunoreactions were detected using goat anti-mouse TRITC and goat anti-rabbit FITC. Slides were observed and digitalized using a fluorescence Zeiss Axioscope (Zeiss; Jena, Germany) equipped with an intensified CCD camera system, series 200, Macintosh configuration (Photometrics, Tucson, AZ). Negative controls were performed using rabbit or mouse irrelevant matched immunoglobulins or omitting primary antibodies. As positive controls for hPTHrP and PTHR1, sections of parathyroid adenoma and mammary carcinoma were used, respectively. For quantification of the relative number of the immunolabeled cell subpopulations in four randomly chosen thymic medullary fields (40X power field), at least 200 immunolabeled cells were counted. The percentages of double-labeled hPTHrP/cytokeratin or hPTHrP/CD40 relative to single-labeled cytokeratin or CD40 cells were calculated.
Flow Cytometry Analysis
Two-color flow cytometry analysis was performed on freshly isolated thymocytes by a FACScan flow cytometer (Becton Dickinson Biosciences; San Jose, CA) according to standard techniques, as previously described (Rocca et al. 2002), using anti-PTHR1 (Santa Cruz Biotechnology) and phycoerythrin (PE)-conjugated anti-CD7 (Becton Dickinson) monoclonal antibodies. For dual-color staining, cells were first incubated with anti-PTHR1 (Santa Cruz Biotechnology) for 20 min, washed, and then reacted with a saturating concentration of FITC-conjugated anti-mouse IgG (goat anti-mouse IgG [H + L], Caltag; Burlingame, CA) for an additional 20 min. Excess reagent was washed off, and cells were resuspended in mouse serum to saturate possible free binding sites of anti-mouse IgG reagent. PE-CD7 was then added, and incubation continued for an additional 20 min. Finally, cells were washed and used for flow cytometry measurements. Optimal MAb and anti-mouse IgG concentrations were determined by prior titration, and cross talk between fluorochromes was accounted for by electronic compensation established using single-stained preparations. Cells were analyzed immediately after staining using forward and side scatter signals to establish the lymphocyte gate and exclude unwanted events (i.e., unviable cells, debris, and cell clumps) from cell evaluation. Fluorescence signals were collected in log mode. A minimum of 10,000 cells of interest were acquired for each sample, and data were analyzed using Lysis II (Becton Dickinson) and WinMDI software.
hPTHrP Stimulation
Subconfluent cultured TECs in PC1 serum-free medium were stimulated with 0.1 μM synthetic (1–39) hPTHrP (Bachem; Torrance, CA) for 90 min (Conway et al. 2001).
RT-PCR
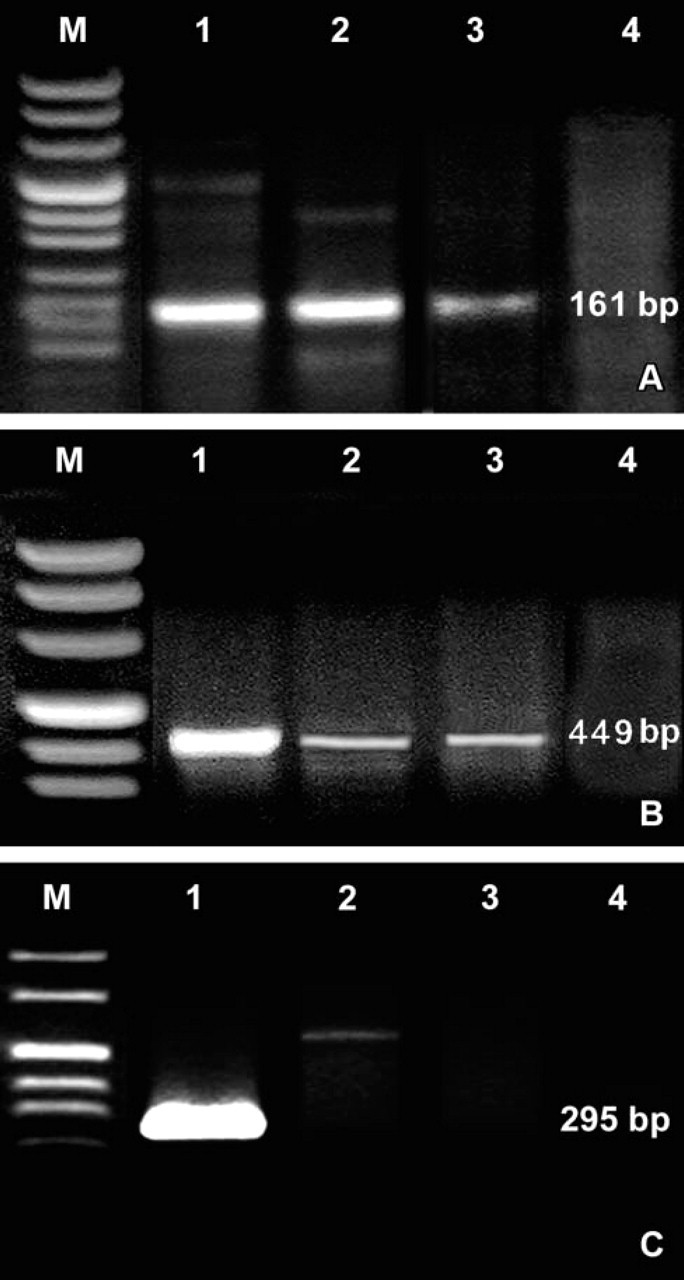
Total RNA was extracted from tissue samples and cell pellets using Micro-to-Midy Total RNA Purification System (Invitrogen Life Technologies; Paisley, UK) according to the manufacturer's protocols. The RNA was eluted in diethylpyrocarbonate (DEPC)-treated water (0.01% DEPC) and stored at −80C. Nucleic acid concentration was measured by spectrophotometer (Beckman Coulter DU800; Beckman Coulter, Fullerton, CA). As positive controls for hPTHrP and glial cell missing gene 2 (GCM-2), total RNA obtained from parathyroid adenoma was used. As positive controls for PTHR1, total RNA from breast carcinoma MCF-7 cells (HTB-22; The American Type Culture Collection) was used. RT-PCR assay was performed using the two-step method. For the first-step RT reaction, Superscript III RNase H− Reverse Transcripts (Invitrogen Life Technologies) were used, starting from 1 μg of total RNA. The manufacturer's recommendations for cDNA synthesis with random examers were followed. The second-step PCR reactions were based on a three-temperature cycle for hPTHrP and a two-temperature cycle for PTHR1, GCM2, and IL-6, respectively. Amplification conditions were: 95C for 9 min, followed by 36 cycles of denaturation at 95C for 15 sec, annealing at 58C for 15 sec, elongation at 72C for 30 sec, with a final extension of 5 min at 72C for hPTHrP. For PTHR1, PCR conditions were: 95C for 9 min followed by 36 cycles of denaturation at 95C for 30 sec, annealing/extension at 60C for 1 min, and a final extension at 60C for 10 min. The primers used for hPTHrP and for PTHR1 amplification were previously reported (Southby et al. 1995). For GCM-2 amplification, the primers used were previously reported (Kanemura et al. 1999). The primers used for hPTHrP amplify the part (exons 5 and 6) of cDNA common to all splicing variants. PCR reaction conditions were 10 pmol of each primer, 200 μM of each dNTP, 2.5 U of Taq polymerase (AmpliTaq Gold DNA Polymerase; Applied Biosystems, Foster City, CA), 2.5 mM MgCl2, and 1 × PCR buffer I (Applied Biosystems). A negative control (cDNA replaced with H2O) was also utilized to detect any contamination. PCR product specificities were assessed by automated DNA sequencing using the ABI Prism 310 Genetic Analyzer (Applied Biosystems). The amplification products measured 161 bp for hPTHrP and 449 bp for PTHR1. The GCM-2 amplification product measured 295 bp. For IL-6 PCR assay, Human IL-6 and 18S Genes Dual-PCR Kit (Maxim Biotech; San Francisco, CA) was employed following the manufacturer's recommendations. The amplicon sizes were 358 bp for IL-6 and 489 bp for 18S. All amplification products were examined by electrophoresis on 1.7% agarose gel stained with ethidium bromide, using the Ready-Load 100 bp DNA Ladder (Invitrogen Life Technologies) as marker. For IL-6, semi-quantitative evaluation was based on optical density analysis of PCR products according to National Institutes of Health image software (National Institutes of Health; Bethesda, MD).
RT-PCR analyses of the expression of parathyroid hormone-related peptide (hPTHrP) (
Results
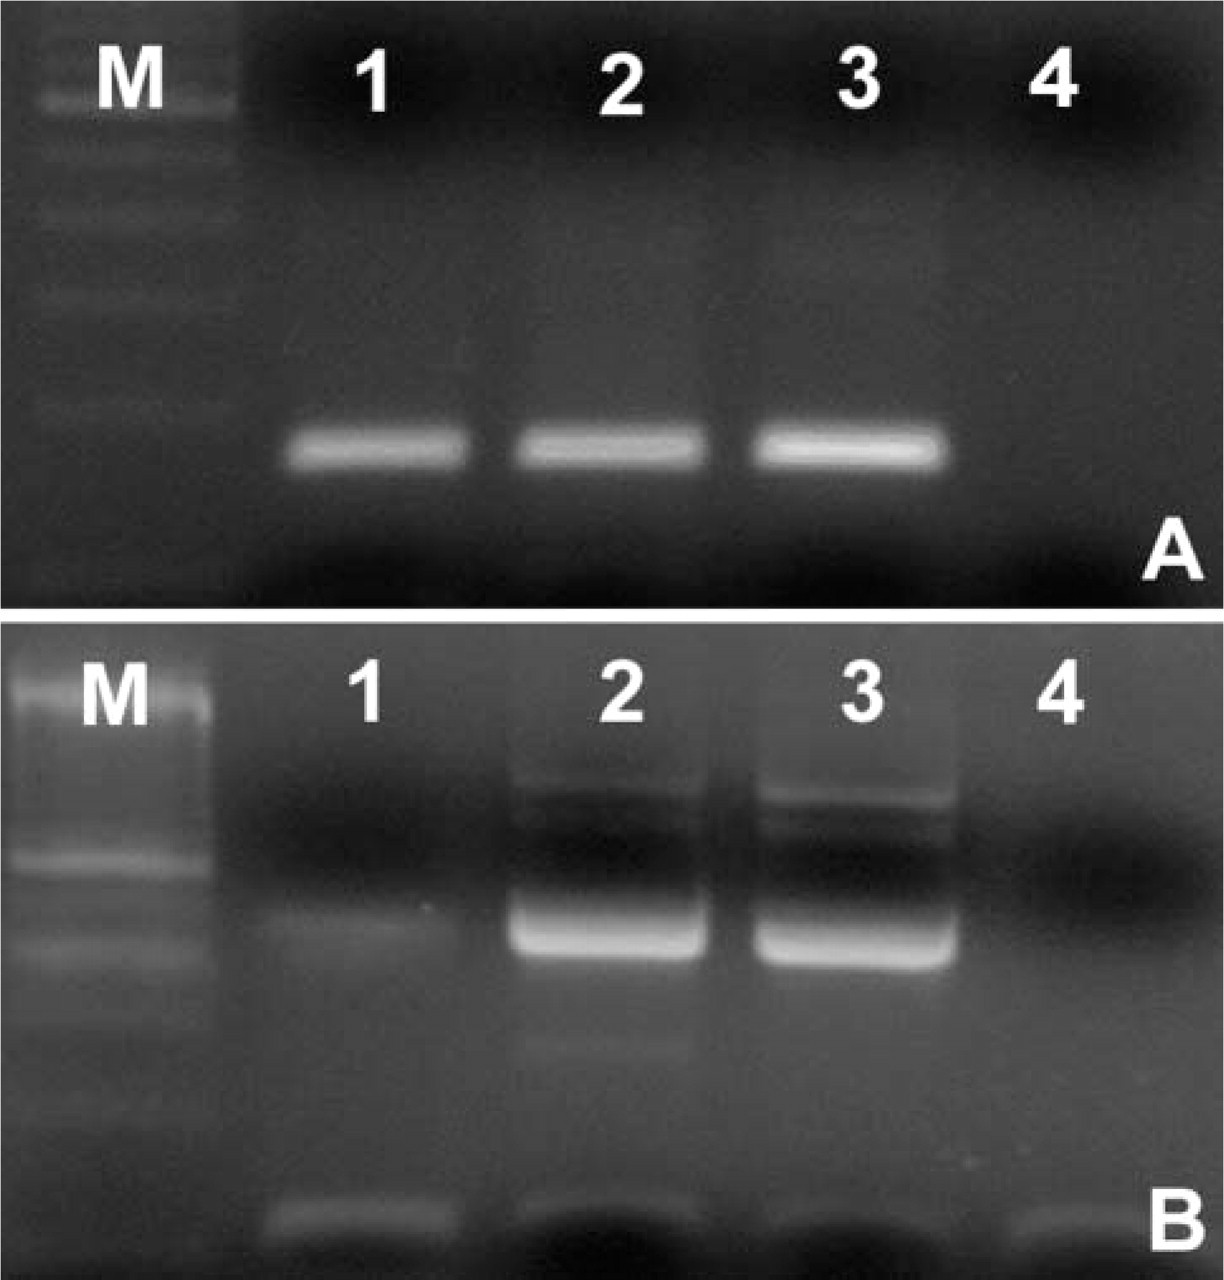
RT-PCR analyses on total cDNA extracted from different thymic samples using hPTHrP-and PTHR1-specific primers revealed the presence of amplification products of expected size for hPTHrP and PTHR1 (Figures 1A and 1B). To exclude that hPTHrP could be produced by ectopic intrathymic parathyroid tissue, we also analyzed thymus samples for the presence of GCM-2 mRNA, which is expressed exclusively by parathyroid (Maret et al. 2004). No expression of GCM-2 (Figure 1C) was found, confirming the origin of hPTHrP from thymic tissue. We then analyzed the expression pattern and localization of both molecules within the human thymus by immunohistochemistry (IHC).
hPTHrP appeared mainly present in the vast majority of non-lymphoid cells in the medullary compartment, being the immunoreaction product detected in the cell cytoplasm (Figure 2A); some peripheral epithelial-like cells in the Hassall's bodies appeared also immunostained (Figure 2A, inset). Moreover, weak but specific hPTHrP immunoreactivity was also noted in a few subcapsular and cortical epithelial-like cells (Figure 2B).
PTHR1 was expressed by scattered subcapsular and cortical cells (Figure 2C) with epithelial morphology and by rare non-lymphoid cells in the medulla (Figure 2D).
The double-staining immunohistochemical analysis revealed that hPTHrP was expressed by ∼70% of cytokeratin-positive cells (Figure 2E). In the medulla, ∼40% of CD40-positive cells were also positive for hPTHrP (Figure 2F). Because CD40 can be expressed by both TECs and DCs (Vandenabeele et al. 2001), we investigated by double immunofluorescence staining whether the CD40/hPTHrP-positive cells comprised CD86-positive DCs and IL3-Rα thymic plasmocytoid cells. CD86 and IL3-Rα are markers of mature thymic DCs and thymic plasmocytoid cells (Bendriss-Vermare et al. 2001; Vandenabeele et al. 2001), respectively. hPTHrP immunoreactivity was present in ∼35% of CD86-positive cells (Figures 2G and 2H) and in ∼80% of IL-3Rα-positive cells (Figures 2K and 2L).
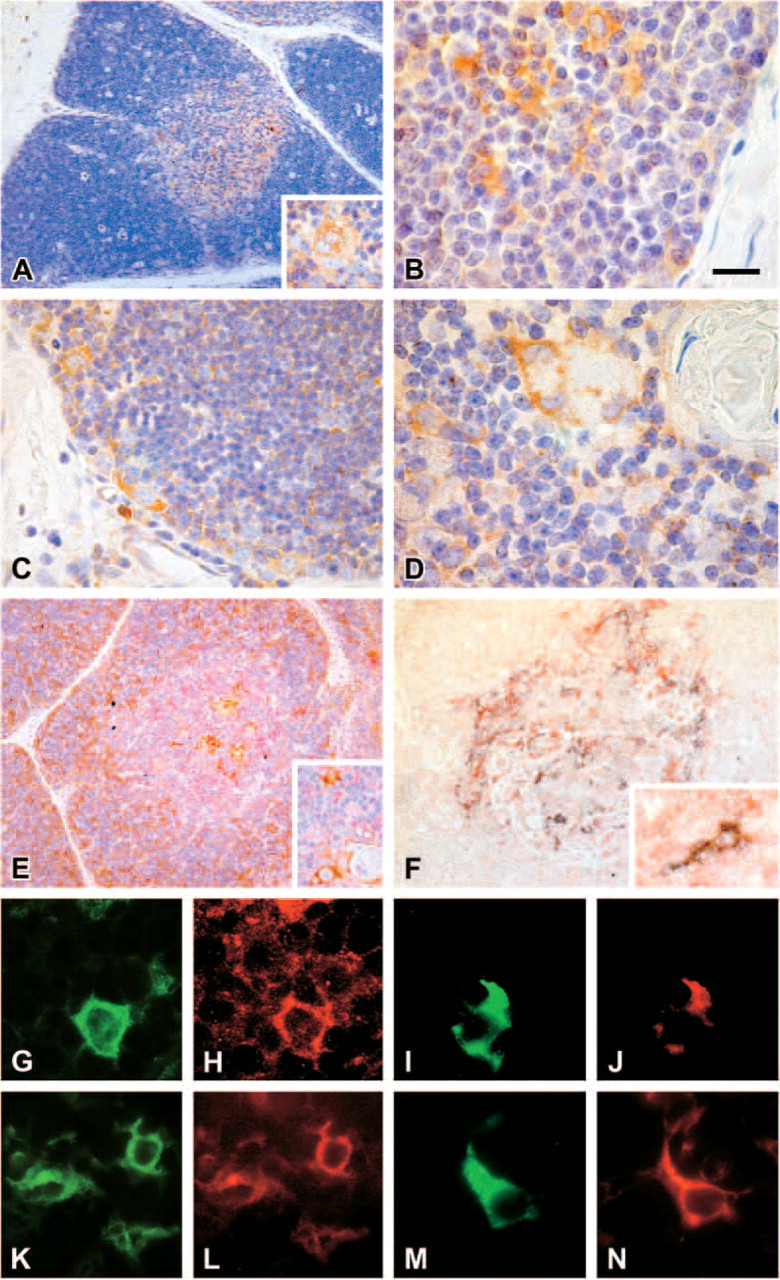
Immunohistochemical analysis of hPTHrP- and PTHR1-expressing cells in human thymus. Medullary (
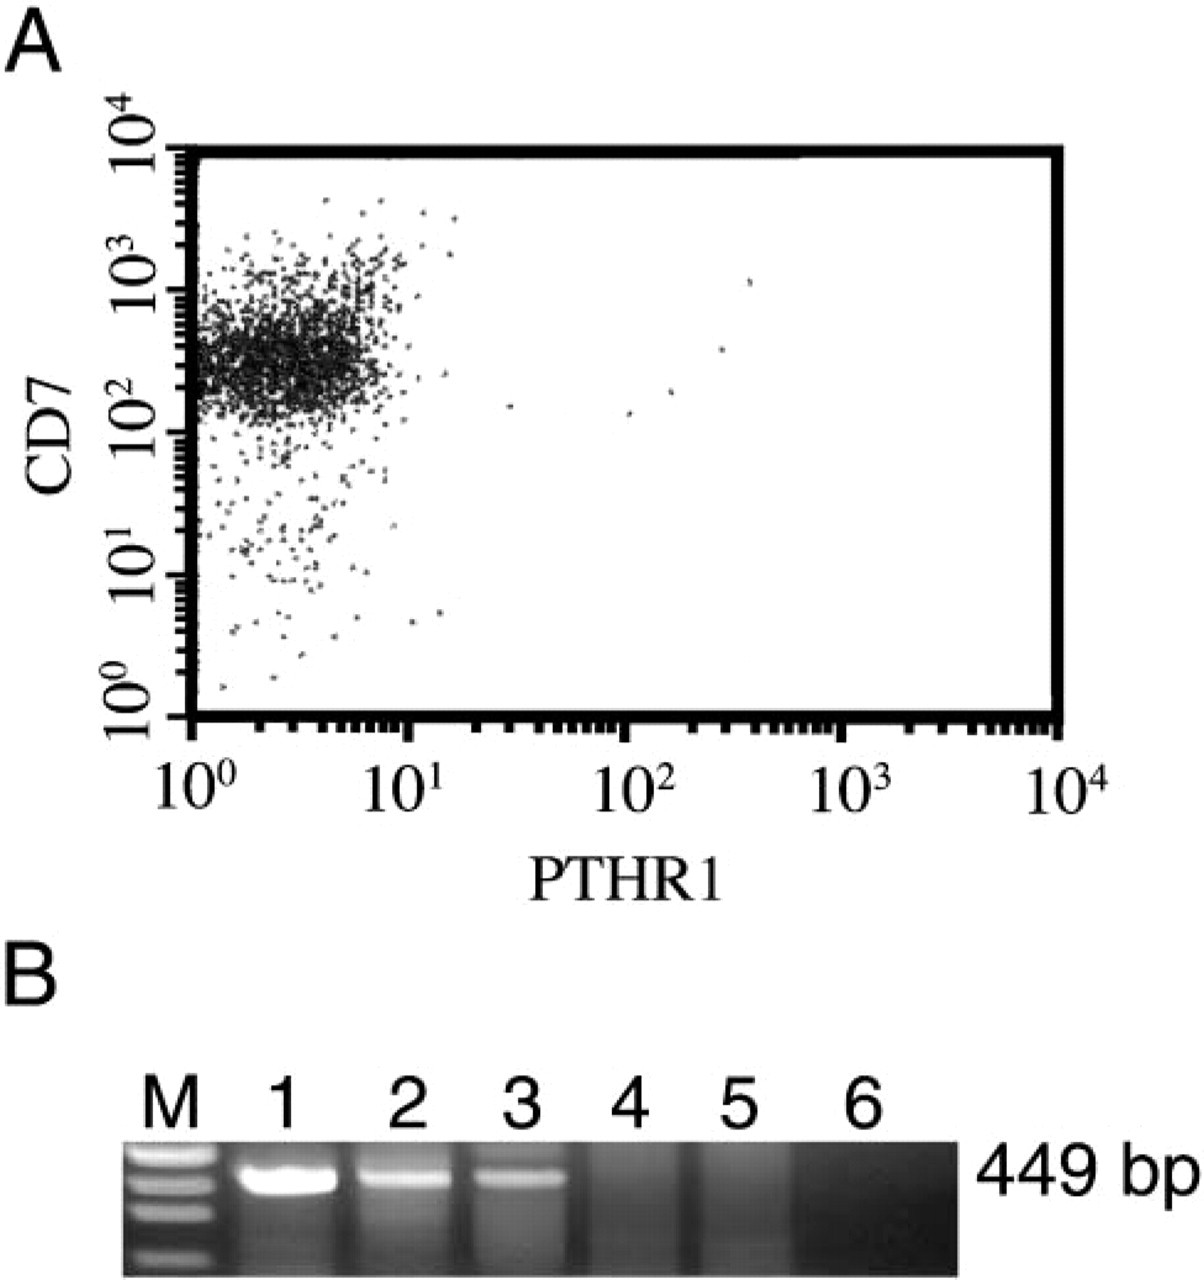
Two-color flow cytometric analysis of the expression of PTHR1 (x-axis) and CD7 (y-axis) on isolated thymocyte preparations. (
Both CD86+ (Figures 2I and 2J) and IL3-Rα+ cells (Figures 2M and 2N) also expressed PTHR1.
Thymocytes did not express either hPTHrP or PTHR1, as assessed by IHC in thymic sections. Furthermore, both cytofluorometry and RT-PCR analyses on isolated thymocytes revealed that these cells did not express PTHR1 at either protein or mRNA levels (Figures 3A and 3B).
Primary cultures of TECs were investigated for the expression of hPTHrP and PTHR1. Immunocytochemical analysis revealed that cultured TECs, as expected, were positive for cytokeratins (Figure 4A). They were also immunostained by hPTHrP and PTHR1 antibodies. hPTHrP was expressed at variable intensity in the cell cytoplasm of almost all TECs (Figure 4B), whereas PTHR1 was also localized in cell nuclei of TECs (Figure 4C). RT-PCR showed that hPTHrP and PTHR1 were expressed by TECs also at mRNA level (Figures 5A and 5B).
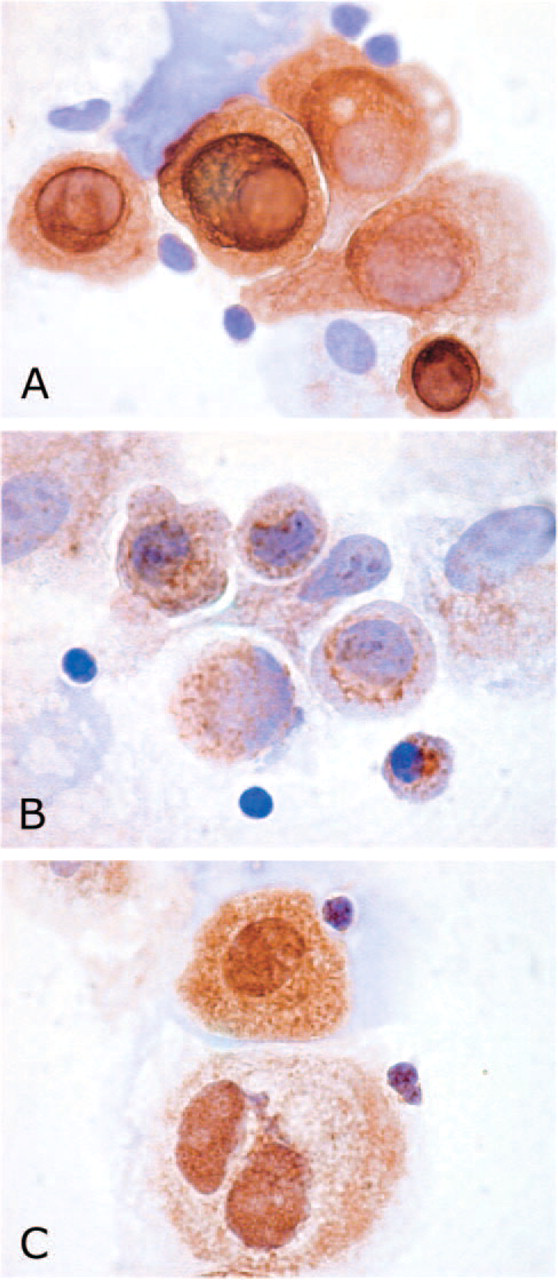
Immunocytochemical analyses of hPTHrP and PTHR1 in primary cultures of thymic epithelial cells (TECs). Epithelial cells appeared immunostained with anti-cytokeratin antibody (
RT-PCR analysis of hPTHrP and PTHR1 expression in primary TEC culture. Amplification products of hPTHrP (
It has been reported in other cell types that hPTHrP stimulates the production of IL-6 (Lowik et al. 1989; Casey et al. 1993). To test the hypothesis that hPTHrP induces IL-6 expression also in TECs, we assayed by semiquantitative RT-PCR the levels of IL-6 when PTHR1-positive TEC cells were stimulated in culture with 0.1 μM of (1–39) hPTHrP synthetic peptide. After 90-min stimulation, a strong signal corresponding to the expected IL-6 amplification product was observed (Figure 6).
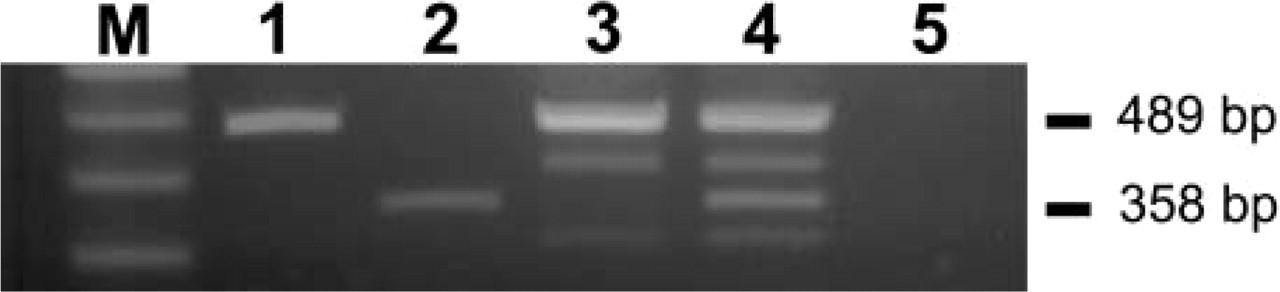
IL-6 mRNA assay by semiquantitative RT-PCR on cultured TECs stimulated with 0.1 μM (1–39) synthetic hPTHrP. After 90-min stimulation, a strong signal was observed corresponding to the expected IL-6 amplification product (Lane 4) in comparison to the unstimulated cells that did not show IL-6 amplification product (Lane 3). Lane 1, 18S positive control; Lane 2, IL-6 positive control; Lane 5, negative control (H2O); M, markers.
Discussion
The present study demonstrates that hPTHrP and PTHR1 are expressed in human thymus at both RNA and protein levels. Furthermore, our data suggest that hPTHrP can regulate thymic functions by inducing IL-6 expression in TECs.
Unlike rodent thymus (Funk et al. 1999; Gunther et al. 2000), human thymus expresses hPTHrP, but not PTH. This could be the result of the difference in embryological development in humans and rodents of the thymus and parathyroids. Rodents such as mice and rats possess only one pair of parathyroids, as opposed to most other mammals, including humans, which develop two pairs (Cordier and Haumont 1980).
In human thymus, hPTHrP is mainly expressed by medullary TECs, characterized by large cytoplasm and short, blunt processes, which constitute the major medullary TEC population, defined as type 6 (Van De Wijngaert et al. 1984) In addition, hPTHrP expression was found in some epithelial cells forming Hassall's bodies. These observations agree with the preliminary results from Kramer (Kramer et al. 1991) showing hPTHrP expression in the non-lymphoid cell component of the medullary thymic area. Moreover, weak but specific hPTHrP immunoreactivity was also noted in a few subcapsular and cortical epithelial-like cells
Unlike hPTHrP, PTHR1 is expressed by TECs lining the basement membrane of the thymic capsule as well as septa and cortical perivascular spaces. In the medullary area, only rare and discrete epithelial cells expressed PTHR1. In agreement with the observation of Watson (Watson et al. 2000), PTHR1 immunoreactivity appeared to be localized also in the nuclear cell compartment.
Thymocytes did not express either hPTHrP or PTHR1, as assessed by cytofluorometry and RT-PCR analyses on isolated thymocyte preparations.
Although hPTHrP in vitro modulates peripheral lymphocyte proliferation (Adachi et al. 1990; Klinger et al.1990; Whitfield et al. 1994), our data, showing the absence of PTHR1 in thymocytes, suggest that hPTHrP is not directly involved in the control of thymocyte proliferation. The presence of both hPTHrP and PTHR1 in medullary TECs suggests that hPTHrP can modulate thymocyte maturation through an autocrine-paracrine control of cell functions. In fact, the observation that PTHrP induces IL-6 mRNA expression in cultured TECs supports such a possibility. hPTHrP can stimulate IL-6 production in an IL-1-dependent manner in other cell types (Ferguson et al. 1995). Because intrathymic production of IL-1 and IL-6 by some type 6 TECs leads to thymocyte and TEC maturation (Le et al. 1990; Carding et al. 1991; Meilin et al. 1995), hPTHrP could play an indirect role in PTHR1-negative thymocytes through the production of IL-6, which can regulate maturation and development of thymocytes. Moreover, its anti-apoptotic activity may skew toward positive selection of thymocytes that are shaping their T cell receptor repertoire (Screpanti et al. 1992; Savino et al. 1998; Sempowski et al. 2000).
The thymic expression of hPTHrP and PTHR1 is not limited to TECs, because DC (CD40+/86+) and thymic plasmocytoid cells (CD40+/IL-3Rα+) (Vandenabeele et al. 2001) also express these proteins. DCs are antigen-presenting cells that form a network throughout most tissues and organs. Thymic DCs provide for the induction of negative selection of potential autoreactive T-cell clones (Hartgers et al. 2000). Although human splenic DCs were found to express hPTHrP (Kramer et al. 1991), to our knowledge, there are no studies on hPTHrP expression in mature thymic DCs, despite the known central role played by these cells in the negative selection of thymocytes. hPTHrP could play a regulatory role in DC maturation and functions. Thymic plasmocytoid cells, representing the most abundant population of thymic DCs, which acquire all the properties of mature DCs following culture with IL-3 and CD40L (Bendriss-Vermare et al. 2001; Vandenabeele et al. 2001), expressed hPTHrP and PTHR1. Other pleiotropic hormones, such as prolactin (Carreno et al. 2004) or glucocorticoids (Sacedon et al. 1999), whose receptors are expressed in thymic DCs, regulate DC cell maturation and functions such as allostimulatory capacity.
In conclusion, our results demonstrate the expression of hPTHrP and PTHR1 in human thymus, providing more information on the cellular localization and possible functions of these molecules in the thymic microenvironment. The ability of hPTHrP to induce expression of IL-6 in TECs and the expression of this molecule in DCs suggest a precise role of this peptide in thymocyte maturation and development.
Footnotes
Acknowledgements
This work was supported in part by Grant D.1.–2003 from the Università Cattolica del S. Cuore within its program of promotion and diffusion of scientific research.
This work is in memory of Nicola Maggiano.