
Abstract
In a previous publication, we showed that a clinical trial of DL-α-difluoromethyl ornithine (DFMO), in combination with PCV (procarbazine, CCNU, vincristine) increased survival of patients with anaplastic gliomas (WHO III) but not glioblastoma multiforme (WHO IV). We believe that treatment outcome (survival) is inversely related to tumor ornithine decarboxylase (ODC) levels. To prove this, we needed to develop an assay to quantify ODC levels in formalin-fixed tumor tissues, which would enable a retrospective study of tumor biopsy specimens from the landmark clinical trial. We developed an assay using a specific polyclonal antibody coupled to an Alexa fluorescent dye. Transgenic MHC-ODC mice with differing levels of ODC in heart muscle were used to establish the relationship between mean gray-scale intensity and enzymatic ODC activity. We found a direct relationship between mean gray-scale intensity of the ODC antibody coupled to Alexa 647 dye and enzymatic activity. Preliminary analysis of a human glioma tissue array shows that tumor-specific variations in levels of ODC can be semiquantitated. We show that mean gray-scale intensity of astrocytoma:glioblastoma is 1:6 and of anaplastic astrocytoma:glioblastoma is 1:4. We also compared the intensity of antibody to Ki67 coupled with phyco-erythrin simultaneously in cells but failed to see a relationship that crossed histologies. We conclude that we can measure levels of ODC in formalin-fixed tumor tissue using an antibody to ODC coupled to Alexa 647 dye, and this will enable us to conduct a future study to correlate survival of patients with gliomas of different histologies treated with DFMO to tumor ODC levels.
Keywords
O
In the mid-1970s, DL-α-difluoromethyl ornithine (DFMO, eflornithine), an irreversible inhibitor of ODC, was synthesized and was found to inhibit the proliferation of cultured cells (Mamont et al. 1978). Over the years, DFMO has been studied both as a single agent and in combination with other chemotherapeutic agents against a large spectrum of animal and human cancers. Activity has been shown in clinical trials against malignant gliomas (Levin et al. 1987, 1992, 2000, 2003), breast carcinoma (O'Shaughnessy et al. 1999), lung cancer, and as a prevention strategy for prostate and bladder cancers (Kadmon 1992; Carbone et al. 1998; Montironi et al. 1999; Walczak et al. 2001; Kamat and Lamm 2002).
As a result of our experience with DFMO in the treatment of malignant gliomas, we believe that the observed efficacy of DFMO is related in part to tumor ODC levels, because patients having tumors with relatively low levels of ODC appear to respond best to DFMO and DFMO-nitrosourea combinations. This conclusion is based on published observations showing that: (
Materials and Methods
ODC Antibody
To investigate ODC binding to normal brain cells and tumors, we used a previously developed polyclonal antibody to ODC (Ab-ODC) (Shantz and Pegg 1998). Although this antibody has not been studied previously with human ODC, one of us (LMS, personal communication, 2004) performed a sequence alignment of the mouse and human ODC proteins and found that they had a 94% homology and were 92% identical. This similarity makes it very unlikely that there would be a difference in cross-reactivity between the antibody and the mouse and human proteins. Moreover, the antibody is polyclonal and is not designed to react with a single epitope, thus increasing the likelihood that it will react equally well with human and mouse proteins.
The antibody was purified on an amino-link column (Pierce Chemical; Rockford, IL) to which purified 6× His-ODC had been crosslinked. BSA and azide were removed, and Ab-ODC was conjugated with Alexa 647 dye (Molecular Probes; Eugene, OR) according to the manufacturer's directions. After conjugation, binding was determined to be 11.9 mol dye/mole protein.
Generation of a Standard Curve Using Heart Muscle from Transgenic Mice
For these experiments, we used transgenic mice with cardiac-specific overexpression of ODC driven by an α-myosin heavy-chain promoter (MHC-ODC mice) (Shantz et al. 2001). α-MHC promoter activity increases in ventricular muscle after birth until reaching amaximum expression at ~3 weeks of age. Expression is maintained at a relatively constant level throughout adult life. Adult MHC-ODC mice have >1000-fold overexpression of ODC in the heart compared with control littermates (Shantz et al. 2001). Hearts were obtained from mice between the ages of 2 days and 4 weeks. After sacrifice of mice, one half of each heart was washed in PBS and placed immediately in 10% neutral buffered formalin overnight, and then embedded in paraffin the next day. The other half of the heart sample was frozen at −20C until being assayed for ODC activity.
Biochemical Analyses
When hearts were assayed for ODC activity, the sample was resuspended in ODC assay buffer (50 mM Tris-HCl, pH 7.5, 2.5 mM DTT, 0.1 mM EDTA, protease inhibitor cocktail) (Calbiochem; San Diego, CA), subjected to three 15-sec pulses using a polytron on ice, and centrifuged for 30 min at 30,000 × g and 4C. ODC was assayed at 37C by measuring the release of 14CO2 from L-[1-14C]-ornithine using saturating concentrations (800 μM) of ornithine as substrate and 40 μM pyridoxal 5-phosphate co-factor.
Immunohistochemical Staining Protocol for ODC and Ki67
Two tissue arrays were created in the Department of Pathology at the University of Texas M.D. Anderson Cancer Center. The first array was composed of 25 heart samples extracted from both non-transgenic and transgenic mice with cardiac ODC overexpression that had been sacrificed between day 2 and week 4 after birth (five at 2 days, seven at 1 week, seven at 2 weeks, three at 4 weeks, and three non-transgenic controls). The second array consisted of 50 validated human brain tumors, five normal brain tissues (negative control), and six transgenic mouse hearts (positive control). Both arrays were constructed with 0.6-mm diameter cores. Serial array sections were cut at a nominal thickness of 4 μm (Wang et al. 2002).
The technique for antibody staining was developed for brightfield IHC and was modified for Ab-ODC-Alexa 647, and the monoclonal antibody to Ki67 was conjugated with phycoerythrin (MAb Ki67-PE; BD-Pharmingen #556027, San Diego, CA). Slide sections of heart and tumor were deparaffinized in xylene and dehydrated with decreasing concentrations of ethanol. Slides were placed in 1× Target Retrieval Solution (DakoCytomation #S169984; Copenhagen, Denmark) and steamed for 30 min for antigen unmasking. After cooling, samples were permeabilized with 0.2% Triton X-100 and then rinsed with pyrogen-free distilled water and Ca2+- and Mg2+-free PBS. Samples were blocked with protein-blocking solution, serum-free (DakoCytomation #X090930) to quench nonspecific binding. Samples were then incubated with 20-μl stock concentrations (0.8 μg/μl Ab-ODC and 0.006 μg/μl for MAb Ki67) of Ab-ODC-Alexa 647 and/or MAb Ki67-PE in a humidity chamber at 4C for 48 hr. Slides were rinsed three times in PBS and mounted with Vectashield Mounting Medium (Vector Labs #H-1000; Burlingame, CA).
Fluorescent Microscopy
Images were acquired an Olympus BX-61 fluorescence microscope containing a mercury arc discharge for fluorometric excitation. The microscope has a trinocular observation head coupled to a Hamamatsu ORCA digital charged-coupled device camera system. The microscope, camera, and data analysis are operational using a Dell Optiplex GX260 PC and ImagePro 4.5 software developed by Media Cybernetics (Carlsbad, CA). Our approach was to measure optical density using 12-bit gray-scale images obtained at ×40 magnified fields from either 100 msec for heart or 1000 msec tumor exposure through the Cy5 window (Chroma Technology; Rockingham, VT) for Ab-ODC-Alexa 647 and 1000 msec exposure through the TRITC window (Chroma Technology) for MAb Ki67-PE. Lag time between subsequent exposures was 2–3 min.
Image Analysis
Twelve-bit gray-scale images were used for all measurements. A pixilated bitmap analysis set to measure every fiftieth pixel was performed in triplicate on each of the 21 transgenic heart samples, yielding ~1700 pixilated intensity values/heart sample. This approach was used when values from triplicate fields within individual samples were compared to the observed biochemical activity level of the sample itself. For each of the 26 analyzed tumors, a manual tagging approach was applied in triplicate microscopic views by which 20–35 nuclei and cytoplasm per ×40 magnified field were selected and measured (a total of 60–105 nuclei for each tumor). Each tag point was set to measure the average intensity of an area of three pixels (0.5 μm). Mean gray-scale intensity values were transferred to Microsoft Excel and statistically evaluated using SPSS for Windows (version 11.5) and/or Prism 4 software (GraphPad; San Diego, CA).
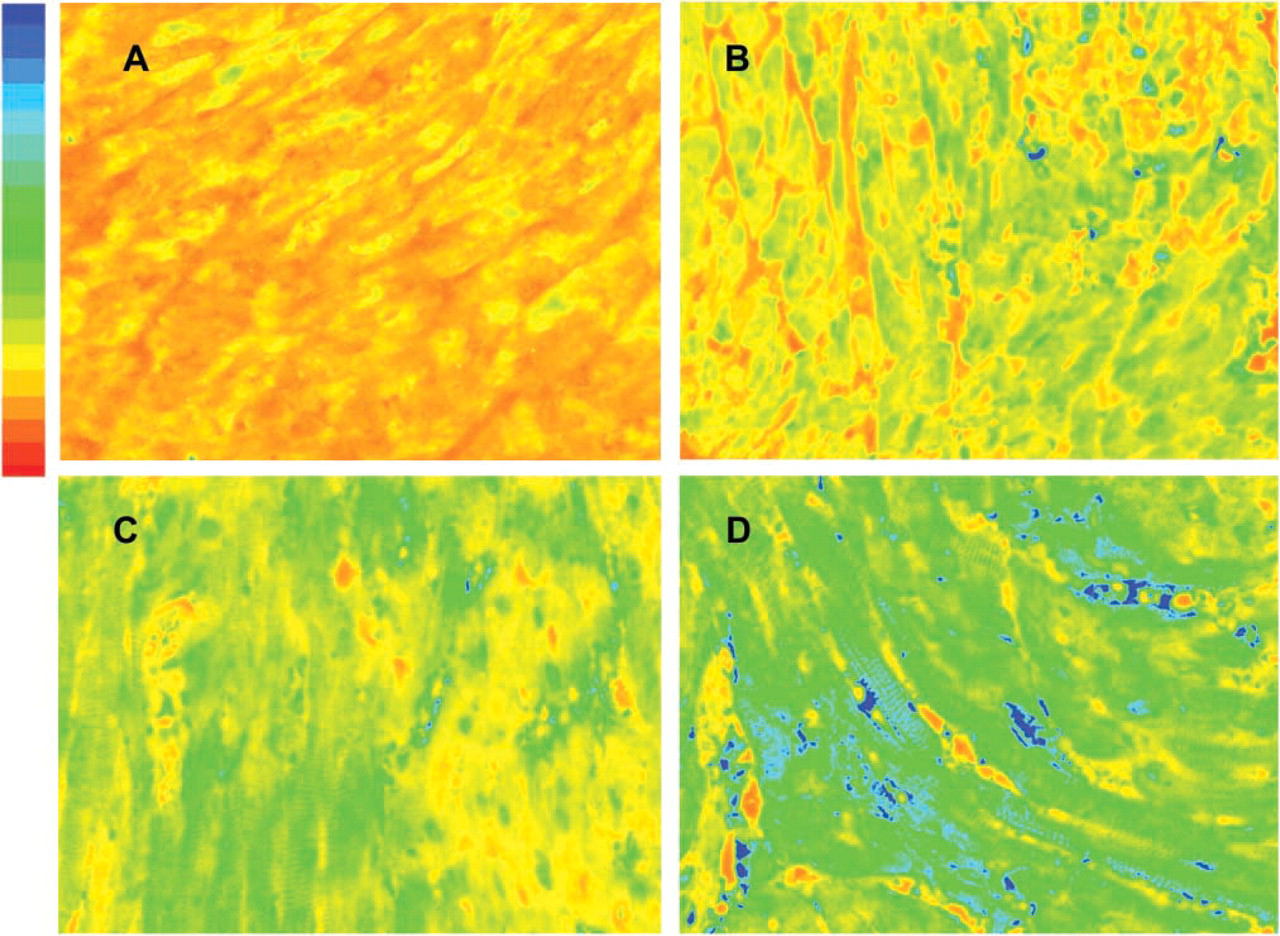
Photomicrographs taken of formalin-fixed transgenic mouse hearts sacrificed at 2, 7, 14, and 28 days of life. The tissues are part of the array stained with ODC-Ab-Alexa 647 for 48 hr. The 12-bit gray-scale images are pseudo-colored using a red-to-blue format to depict fluorescent intensity levels after 100-msec excitation by a mercury vapor light source; red represents low and blue high optical intensity. ODC activity in units of nmol/30min/μg protein for
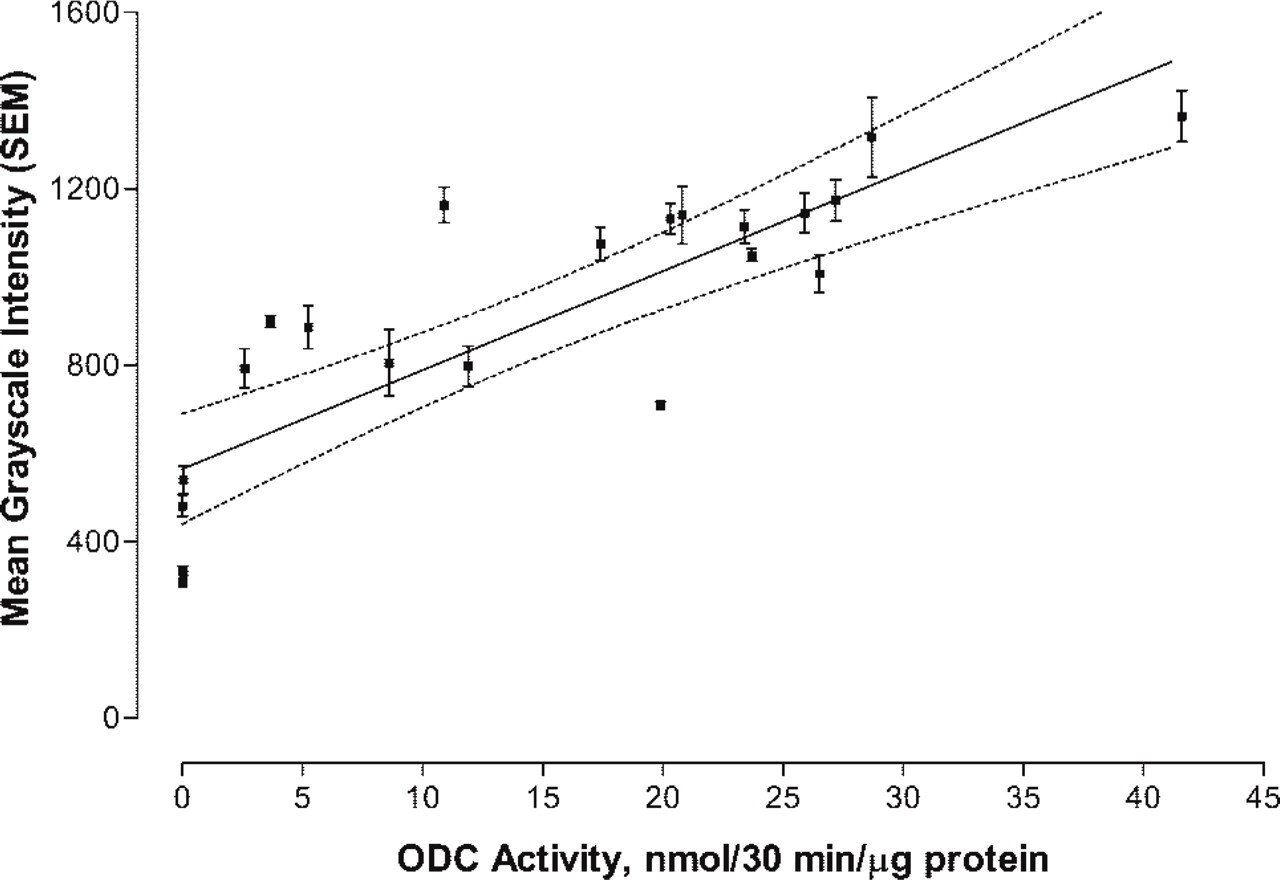
Linear least-squares plot of transgenic heart activity (nmol/30 min/μg protein) versus ODC-Ab-Alexa 647 intensity. The plot represents 22 heart samples. The integrated and bit-mapped intensity for each of three ×40 magnified fields/heart sample (1700 total measurements/heart) were used to compute a mean ± SEM. Dashed line represents the 95% confidence interval for the regression line that was fitted to the equation Y = 564.8 (±59.8) + 22.4 (±3.2) × ODC activity, with R 2 = 0.71.
Results
Heart Muscle Overexpressing ODC
Using the 21 transgenic heart samples collected from MHC-ODC mice, we measured ODC activity and compared this value to mean gray-scale intensity of images obtained from 100-msec exposure through the Cy5 window. Exposure for 100 msec was chosen because the measurement of mean gray-scale intensity for heart versus length of exposure from 10 msec to 2000 msec demonstrated that saturation (4095 intensity units) occurred by 500 msec and that 100 msec was on the linear portion of the intensity curve. Figure 1 is a representative photomicrograph of four heart samples stained with Ab-ODC-Alexa 647 for 48 hr. The gray-scale images were pseudo-colored using a red (low) to blue (high) format to depict fluorescent intensity levels.
Figure 2 shows the linear plot of the mean gray-scale (± SD) intensity for 22 transgenic hearts versus the actual ODC activity (nmol/30 min/μg protein). A linear least-squares analysis of the data was fitted to the equation

Rearranging the equation, ODC activity (nmol/30 min/μg protein) = (Ab-ODC-Alexa 647 gray-scale intensity − 564.8)/22.4. The biochemical measure of ODC represents an average value of the heart tissue sampled. Because the distribution of ODC is heterogeneous due to incomplete expression of α-MHC promoter activity in ventricular muscle after birth until adulthood is reached, the large variance in gray-scale intensity observed in individual hearts was expected.
Digitalized images (×40 magnification) of (
Tumor ODC Levels
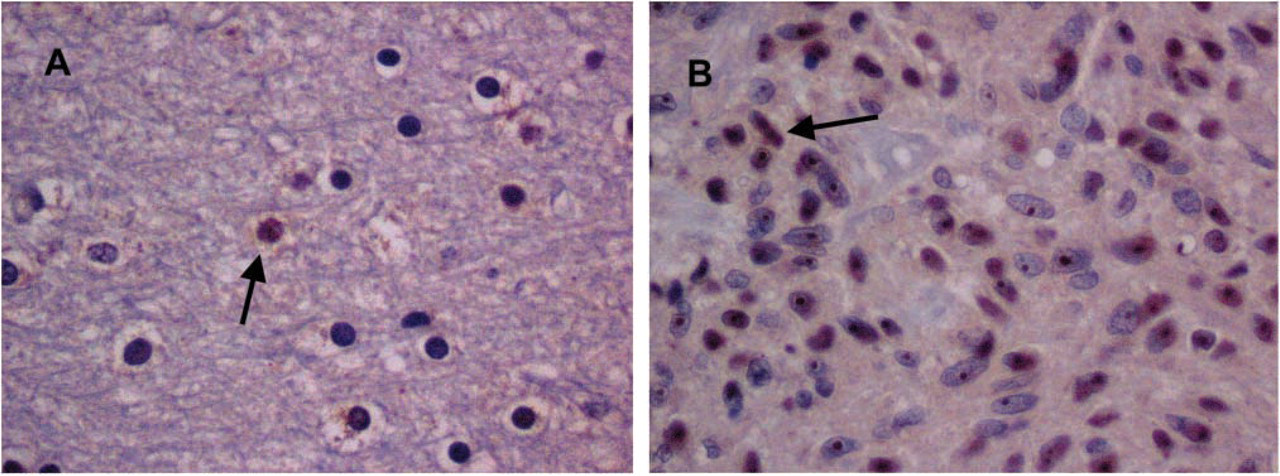
Initially, we used Ab-ODC with a secondary Ab-peroxidase, and hematoxylin stain in normal brain and GBM tumors to determine patterns of Ab-ODC distribution. A greater level of peroxidase positivity was seen in the nuclei of tumor cells than in normal cells, with occasional staining of the cytosol (Figure 3). Cellular (nucleolus, nucleus, cytosol) uptake was obvious and higher in GBM (Figure 3B, photomicrograph) compared with astrocytoma and with normal brain (Figure 3A, photomicrograph), in which it was the lowest. On the basis of these observations, we concluded that the technique and the antibody selected for identification of cellular ODC were satisfactory.
These data are consistent with published studies using polyclonal antibodies to investigate the cellular distribution of ODC (Pomidor et al. 1995; Kagoura et al. 2000; Rohn et al. 2001; Shantz et al. 2001) and protein levels (Pomidor et al. 1995; Wright et al. 1995). It has been shown that ODC distributes in the cytosol but can translocate to the cell membrane (Heiskala et al. 1999; Rohn et al. 2001). In addition, distribution within the nucleus has been observed in the brain (Kilpelainen et al. 2000), as has distribution in non-dividing neurons (Kilpelainen et al. 2000).
On the basis of our results from peroxidase color granules, we concluded that it would be more precise to quantitate ODC protein in formalin-fixed tissue if we used a fluorochrome-coupled antibody assay. We also concluded that focusing on nuclear Ab-ODC-Alexa 647 fluorescence would probably yield more accurate results than would focusing on cytosol fluorescence.
Figure 4 is a photomicrograph taken from formalin-fixed human gliomas on the tissue microarray. The tissues were stained with Ab-ODC-Alexa 647 for 48 hr, and the images were obtained after 1000-msec excitation by a mercury vapor light source. Exposure for 1000 msec was chosen because the measurement of mean gray-scale intensity for tumor tissues versus length of exposure from 500 msec to 4500 msec demonstrated that saturation (4095 intensity units) occurred by 3000 msec and that 1000 msec was on the linear portion of the intensity curve. Background measurements for each histology were made using an array section without antibody. Values ranging between 400 and 500 were measured and subtracted from all gray-scale images, and images were then pseudo-colored using a red (low) to blue (high) format to depict fluorescence intensity levels. Of interest is the observation that within the astrocytic series of gliomas, from low-grade astrocytoma (LGA) to anaplastic astrocytoma (AA) to GBM, there is an obvious and graded increase in fluorescence intensity. The anaplastic oligodendroglioma (AO) tumor is higher in fluorescence intensity than the AA, and this is felt to be consistent with the higher mitotic rate seen in AO compared with AA (Onda et al. 1994; Wacker et al. 1994; Kleihues et al. 2002). This may also be true for the very slight increase in ODC for oligodendroglioma (OLIG) compared with AA, or it might reflect that there were too few tumors for accurate statistical analysis.
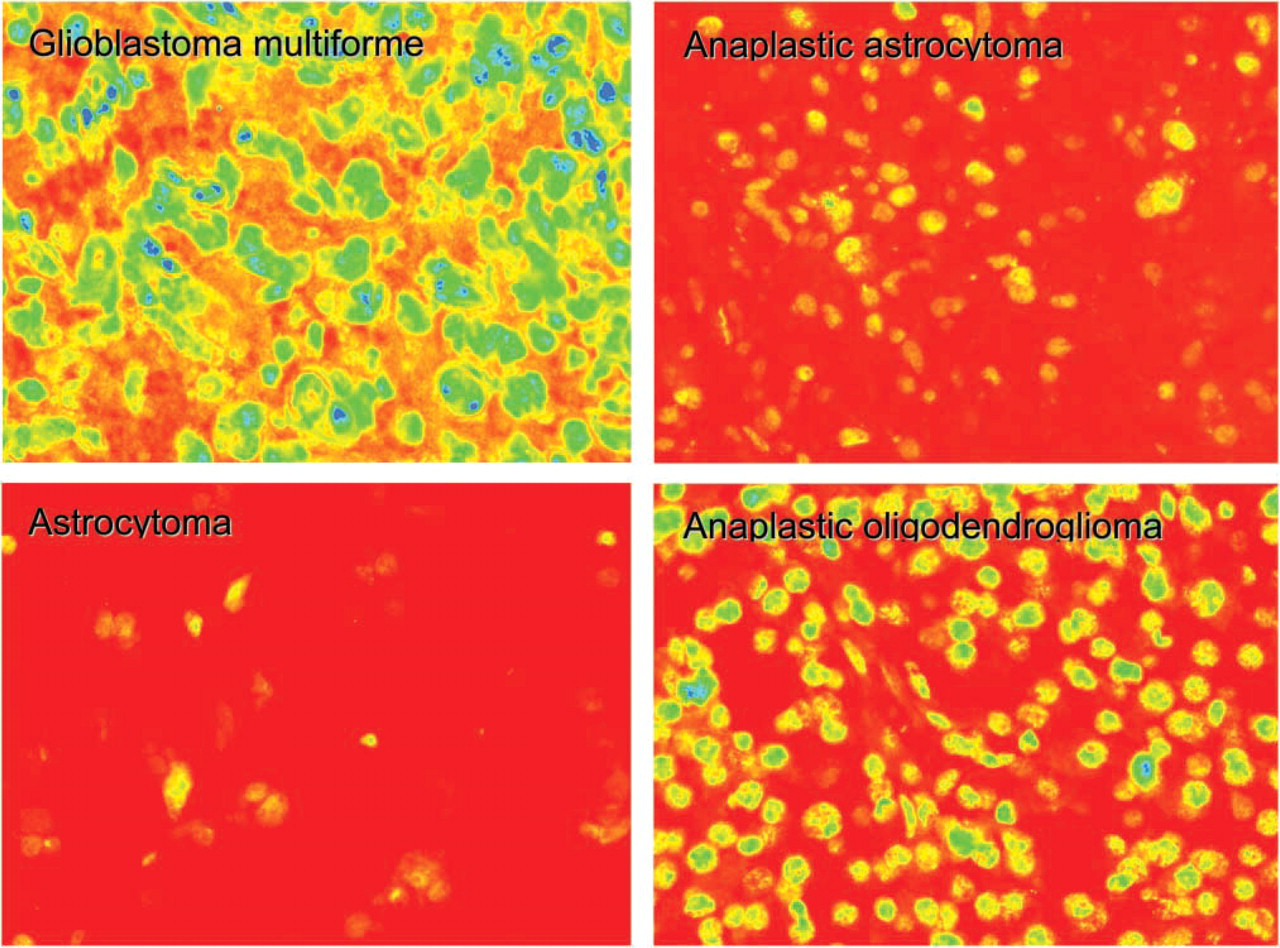
Photomicrographs of formalin-fixed graded human gliomas. The tissues are part of the array stained with ODC-Ab-Alexa 647 for 48 hr. The 12-bit grayscale images are pseudo-colored using a red-to-blue format to depict fluorescent intensity levels after 1000 msec excitation by a mercury vapor light source; red represents low and blue high optical intensity.
Figure 5 shows a scatterplot of mean gray-scale intensity with error bars of ±1 SD. Only 26 of the tumors were analyzed, because they were the only samples with documented patient follow-up. When the pseudo-colored images in Figure 4 were evaluated, there appeared to be a clear distinction between LGA and AA compared with GBM and AO. Based on relative intensity units, the difference between LGA and GBM is on the order of 1:3.6 and compares favorably to ODC activity data, for which the ratio is 1:3.4 (Table 1). For the AA-to-GBM comparison, the activity ratio is 1:1.9, whereas it is 1:4.5 for the intensity data. Because the AO-to-GBM intensity ratio is 1:1.7 (no comparable ODC activity for AO is available), it is conceivable that the Ernestus AA dataset (Ernestus et al. 2001) includes patients with AO, accounting for its low ODC activity ratio.
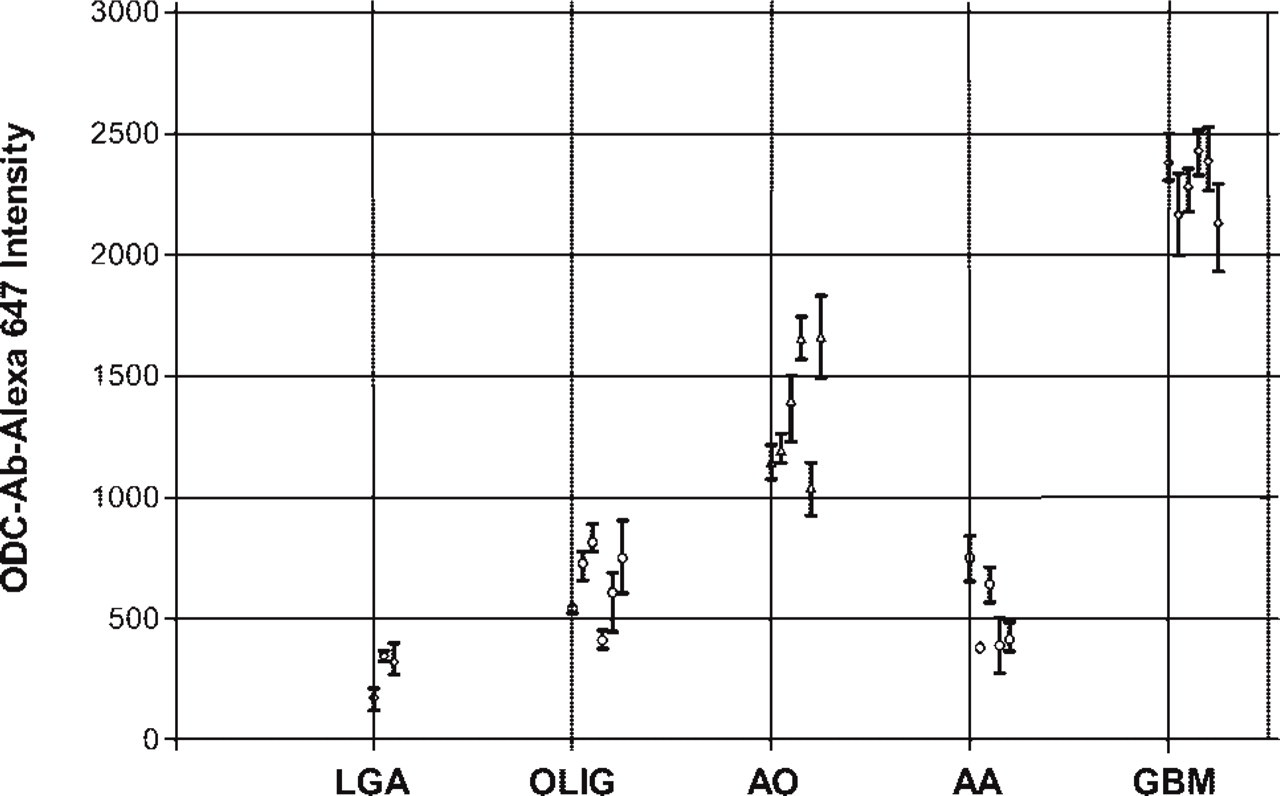
ODC-Ab-Alexa 647 intensity for glioblastoma (GBM), anaplastic astrocytoma (AA), anaplastic oligodendroglioma (AO), oligodendroglioma (OLIG), and astocytoma (LGA). Each point represents the mean ± SD.
Tumor Ki67 Levels
The same tumor array was studied with an Ab-Ki67-PE, using the same tagging technique as for Ab-ODC-Alexa 647 except that the TRITC cube was used. Because the antibody that recognizes the Ki67 protein increases during cell division but is present during other times in the cell cycle, we felt that comparing levels of Ab-Ki67-PE with levels of Ab-ODC-Alexa 647 might show a correlation. To measure mean gray-scale values for a 3 × 3 pixel area in the nucleus, we found that we had to use undiluted antibody.
Figure 6 represents a plot of paired Ab-ODC-Alexa 647 and Ab-Ki67-PE intensity values for 12 tumors. The numbers are relative values, but because they were from one array on one slide, value correlation can be legitimately made. What is striking is the clustering of values within a given histology and the lack of a defined relationship between the ODC and Ki67 antibody binding across tumor histologies. Using the Pearson correlation analysis, we found that for the 12 tumors, the two antibodies were correlated with a p<0.001 (two-tailed) in nine cases, p<0.03 in two cases and p = 0.21 in one case. We could not establish a linear fit with a high R 2.
Discussion
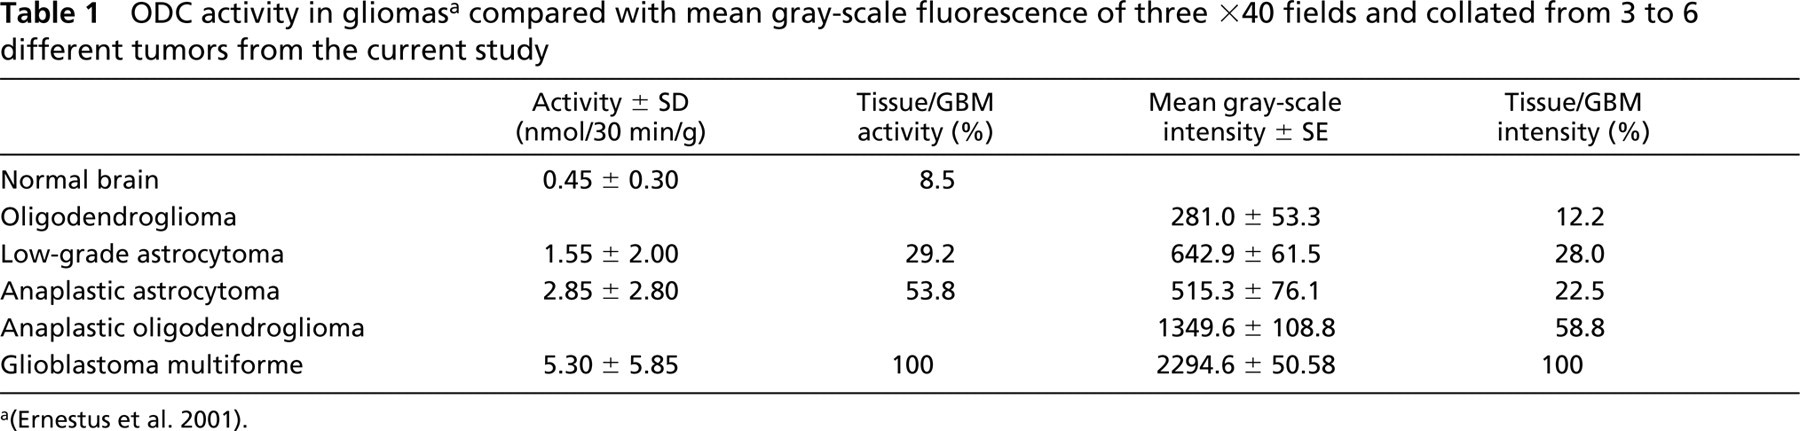
This study was initiated to develop a formalin-fixed tissue-based assay for ODC to better delineate the basis for patient response to DFMO. In this report, we show, using transgenic MHC-ODC mice with differing heart ODC levels, that Ab-ODC-Alexa 647 mean gray-scale fluorescent intensity increases in a linear fashion in heart muscle proportional to ODC enzymatic activity. To an extent, this result was expected because ODC enzymatic activity closely correlates with ODC protein expression (Pegg et al. 1994). Using similar conditions, we then studied a training set of human glioma tumors prepared by the Department of Pathology at the University of Texas M.D. Anderson Cancer Center. We found that ODC mean gray-scale fluorescent intensity decreased from a high for GBM to a low for LGA in the following manner: GBM>AO>OLIG≥AA>LGA. Ernestus and colleagues (2001) correlated enzymatic activity of ODC with glioma grade and found that activity was highest in GBM>AA>LGA>peritumor “normal” brain tissue. Both datasets are collated in Table 1. It can be appreciated that Ab-ODC-Alexa 647 is more robust and has a smaller coefficient of variation (range 4–44%) compared with the ODC activity data of Ernestus and colleagues (67% to 129%).
ODC activity in gliomasa compared with mean gray-scale fluorescence of three ×40 fields and collated from 3 to 6 different tumors from the current study
Of additional interest is that although Ab-ODC-Alexa 647 intensity correlates reasonably well with Ab-Ki67-PE intensity within a given tumor histology in the array, there does not appear to be a strong relationship between the two antibodies across histologies (Figure 6). Clearly, further research will be needed to clarify the lack of a consistent relationship between the nuclear labeling (intensity) with Ab-Ki67 and the nuclear labeling (intensity) with Ab-ODC.
In summary, we believe that the fluorescent intensity assay of Ab-ODC-Alexa 647 can be applied to formalin-fixed tumor with reproducible results. On the basis of results from this current study, we are planning to use this assay to measure ODC in tissues from patients previously treated with DFMO in our randomized study of DFMO-PCV (Levin et al. 2003), to determine if progression-free survival will be inversely correlated with ODC level. In that study, we will analyze astrocyte lineage and oligodendroglial lineage tumors separately.
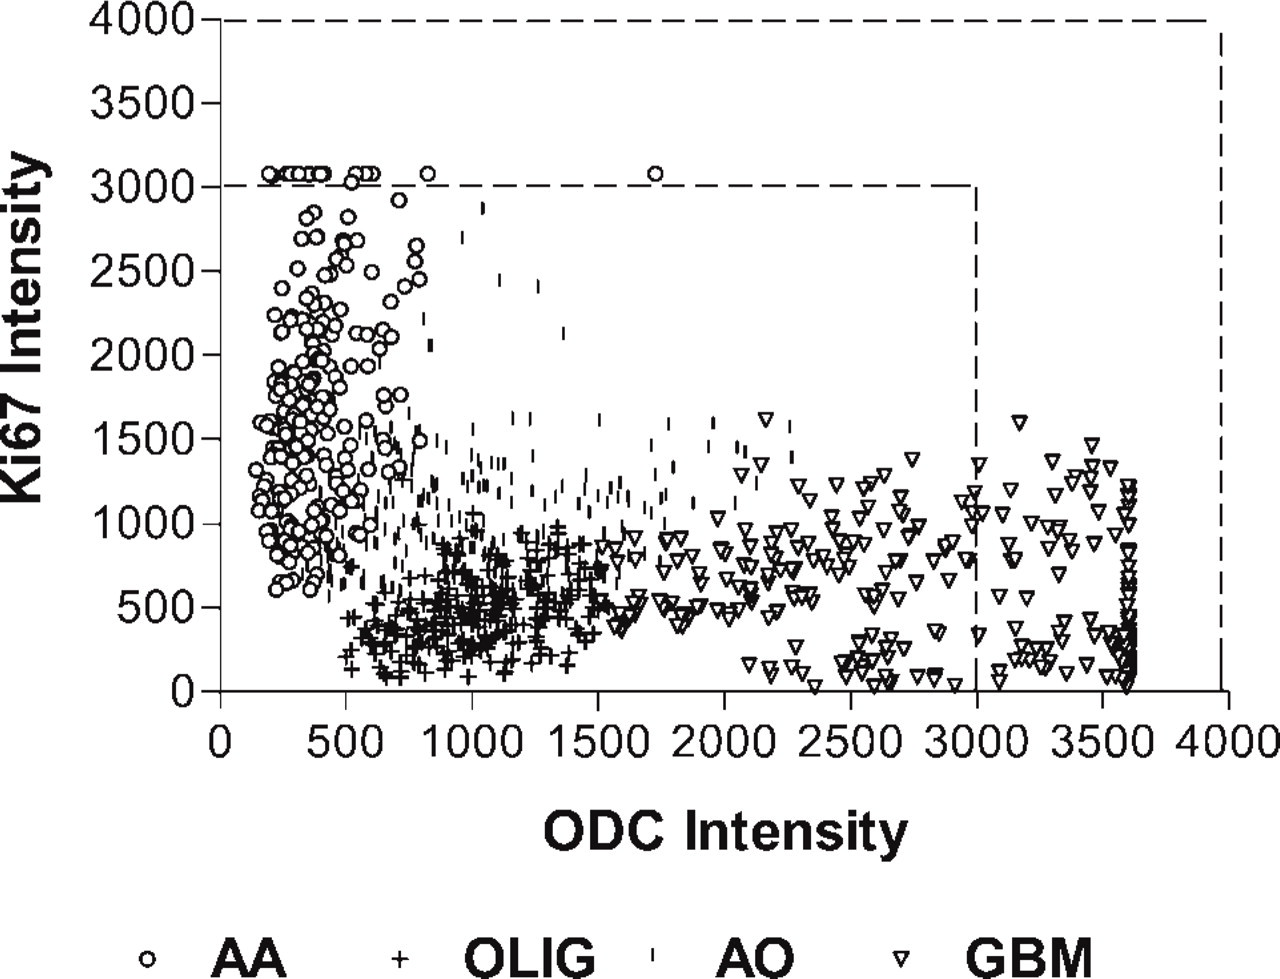
Scatterplot of ODC-Ab-Alexa 647 intensity versus Ab-Ki67-PE intensity for three, anaplastic astrocytoma (AA), oligodendroglioma (OLIG), anaplastic oligodendroglioma (AO), and glioblastoma (GBM) tumors from the tissue array. Because there were no statistical intergroup differences within a histology, the results from the tumors were pooled and plotted as a single histologic group. The dotted lines bracket intensities that represent fluorescent saturation.
Footnotes
Acknowledgements
Supported in part by American Heart Association grant AHA 0040140N (LMS), NIH Grant CA-82768 (LMS), NIH Grant CA-18138 (AEP), by a gift from the Curtis and Doris K. Hankamer Foundation (VAL), and by a gift from the Deborah Crook Memorial Fund (VAL).
The authors thank Joann Aaron for help in editing this manuscript and Greg Fuller, M.D., Ph.D., Department of Pathology at UTMD Anderson Cancer Center, for providing tumor tissue arrays for this study.