
Abstract
Ascorbate and menadione (Apatone) in a ratio of 100:1 kills tumor cells by autoschizis. In this study, vitamin-induced changes in nucleolar structure were evaluated as markers of autoschizis. Human bladder carcinoma (T24) cells were overlain with vitamins or with culture medium. Supernatants were removed at 1-hr intervals from 1 to 4 hr, and the cells were washed with PBS and prepared for assay. Apatone produced marked alterations in nucleolar structure including redistribution of nucleolar components, formation of ring-shaped nucleoli, condensation and increase of the proportion of perinucleolar chromatin, and the enlargement of nucleolar fibrillar centers. Immunogold labeling of the nucleolar rRNA revealed a granular localization in treated and sham-treated cells, and immunogold labeling of the rDNA revealed a shift from the fibrillar centers to the condensed perinucleolar chromatin. Fibrillarin staining shifted from the fibrillar centers and adjacent regions to a more homogeneous staining of the entire nucleolus and was consistent with the percentage of autoschizic cells detected by flow cytometry. Because autoschizis entails sequential reactivation of DNase I and DNase II, and because the fibrillarin redistribution following DNase I and Apatone treatment is identical, it appears that the nucleolar and fibrillarin changes are markers of autoschizis.
A
The nucleolus is a well-defined, structural/functional unit of the interphase nucleus, whose morphology has been employed diagnostically to assess the status of the cell as well as to distinguish between malignant, benign, and normal cells (Bernhard 1966, 1971; Bortul et al. 2001). In addition, nucleolar ultrastructural changes that occur during apoptosis, such as nucleolar segregation and translocation of nucleolar proteins, are distinct from the changes observed during necrosis and may serve as an additional set of markers to differentiate between the two forms of cell death (Earnshaw 1995; Zweyer et al. 1995, 1997; Biggiogera et al. 1999; Martelli et al. 2000).
When ascorbate [vitamin C (VC)] and menadione [vitamin K3 (VK3)] are combined, they exhibit synergistic antitumor activity and preferentially kill tumor cells by a novel type of cell death, termed autoschizis. Although it has characteristics of both apoptosis and necrosis, autoschizis exhibits a unique set of morphological and biomolecular alterations that distinguish it from these two types of cell death (Gilloteaux et al. 1995, 1998a, b, 1999a, b, 2001a–c, 2003a, b, 2004, 2005,2006,2010; Jamison et al. 1996, 1997, 2001, 2002, 2004, 2005; Venugopal et al. 1996a, b; Ervin et al. 1998; Verrax et al. 2003, 2004; von Gruenigen et al. 2003). Specifically, the self-excision of organelle-free pieces of cytoplasm, and the associated nuclear changes, result in the diminution of cell size, the disappearance of chromatin from the nucleolus and nucleoplasm, and subsequent nucleolar compaction and fragmentation during karyorrhexis and karyolysis. During these events, DNA is degraded in a random fashion similar to what occurs during necrosis. In the current study, vitamin-induced changes in nucleolar structure have been evaluated in an effort to elucidate molecular markers of autoschizic tumor cell death that are distinct from those observed during apoptosis or necrosis.
Materials and Methods
Cell Culture
A human bladder carcinoma (T24) cell line was purchased from the American Type Culture Collection (Rockville, MD) and cultured in MEM (Gibco; Grand Island, NY) supplemented with 10% FBS (Gibco) and 50 μg/ml gentamicin sulfate (Sigma; St. Louis, MO). All incubations were performed at 37C and 5% CO2 unless other conditions are stated.
Test Solutions
VC and VK3 were purchased from Sigma and were prepared by dissolving the desired concentrations in MEM. For the cytotoxicity assay, vitamins were dissolved to create 8000 μM VC, 500 μM VK3, and 8000 μM VC/80 μM VK3 test solutions. For the remainder of the experiments, the cell monolayers were overlain with 2 ml of vitamin at the high dose (4064 μM VC, 40.64 μM VK3, or 4064 μM VC/40.64 μM VK3) or at the low dose (1016 μM VC, 10.16 μM VK3, or 1016 μM VC/10.16 μM VK3). Sham-treated cells served as the control. The vitamins were removed from the tumor cells at 1-hr intervals from 1 to 4 hr; the cells were washed twice with 3 ml of PBS and employed for flow cytometry, immunogold labeling, or nucleolar protein analysis. All vitamin solutions and all experiments were performed in a darkened laminar flow hood.
Cytotoxicity Assay
The cytotoxicity assay was performed using the microtetrazolium (MTT) assay [3-(4,5-dimethylthiazol-2-yl)-2,5-diphenyl-diphenyltetrazolium bromide] as described previously (Venugopal et al. 1996a). Corning 96-well titer plates were seeded with tumor cells (5 × 10³ per well) and incubated for 24 hr. Vitamin test solutions were serially diluted with media in twelve 2-fold dilutions. Each dilution was added to seven wells of the titer plates and coincubated with the tumor cells for 5 days. After vitamin treatment and the incubation period, cytotoxicity was evaluated using the MTT assay. Following linear regression, the line of best fit was determined and the 50% cytotoxic dose (CD50) was calculated. The fractional inhibitory concentration (FIC) index was employed to evaluate synergism.
Flow Cytometry
Determination of cell DNA content and ploidy was performed according to our previously published procedure (Jamison et al. 1996). Briefly, titer dishes were seeded with 1.0 × 10⁶ T24 cells suspended in MEM [10% fetal calf serum (FCS)]. Following 24 hr of incubation, the MEM was removed and the cells were washed twice with 3 ml of PBS. The cells in each titer dish were then overlaid with 2 ml of MEM containing the vitamins. Human foreskin fibroblast cells served as diploid internal standard cells in flow cytometric studies. After a 1-hr incubation period with vitamins, the cultures were washed free of vitamins and overlaid fresh MEM. Following a 24-hr incubation period, the cells were harvested from the titer dishes and suspended in 0.1% NP-40 in a Tris-citrate solubilization buffer that contained propidium iodide (5 mg/ml) and 0.1% RNase A. Following a 30-min incubation, DNA ploidy and cell cycle analysis was performed on anOrtho Cytoron flow cytometer (Ortho Diagnostic Systems; Raritan, NJ). The data from 2 × 10⁴ cells were collected (when possible), stored, and analyzed using ModFit cell cycle analysis (Verity Software House; Topsham, ME).
Preparation for Transmission Electron Microscopy
Titer dishes were seeded with 1.0 × 10⁶ tumor cells suspended in MEM (10% FCS). After 24 hr, the MEM was removed and the cells were washed once with 3 ml PBS. The cell monolayers were overlain with 2 ml of vitamin at the high dose or at the low dose. Floating cells were collected by centrifugation at 1000 rpm for 10 min and washed with PBS; adherent cells were harvested by soaking them free from the monolayer with No-Zyme (JRH Bioscience; Lenexa, KS) and were collected by centrifugation. The cells were pooled and fixed by immersion in 1.6% glutaraldehyde-buffered (0.13 M sucrosephosphate, pH 7.35) solution. After 1-hr fixation at room temperature, the cells were pelleted at 1000 rpm and washed in the same buffer. Subsequently, the cells were dehydrated through graded ethanol solutions and then embedded in epoxy resin. Ultra-thin sections of the various blocks were either collected in platinum rings (diameter = 4 mm) formed by a platinum wire (diameter = 0.1 mm) (SA Johnson Matthey; Brussels, Belgium) and stored on distilled water until used or mounted on colloidal-coated nickel grids (Thiry et al. 1997; Jamison et al. 1998).
Terminal Deoxynucleotidyl-transferase (TdT)–Immunogold Method
In situ TdT was performed using the method of Thiry et al. 1997. Ultra-thin sections of Epon-embedded cells were floated for 60 min on a saturated solution of sodium metaperiodate at room temperature. Sections were floated for 10 min at 37C on the surface of the following medium: 20 μM 5-bromo-2-deoxyuridine (BUdR) triphosphate (Sigma), 100 mM sodium cacodylate (pH 6.5), 10 mM β-mercaptoethanol, 2 mM CoCl2, 50 μg/ml BSA, and 125 U/ml calf thymus TdT (Boehringer; Mannheim, Germany). The sections were incubated for another 10 min at 37C in the same medium supplemented with 4 μM each of dCTP, dGTP, and dATP (Gibco BRL; Gaithersburg, MD). After two rinses on double-distilled water, the sections were incubated for 30 min in PBSB (0.14 M NaCl, 6 mM Na2 HPO4, 4 mM KH2 PO4, 1% BSA, pH 7.2) containing normal goat serum (NGS) diluted 1:30 and then rinsed with PBSB. Subsequently, the sections were incubated for 4 hr at room temperature with a 1:50 dilution of a monoclonal anti-BUdR antibody (Becton Dickinson; Mountain View, CA). After being washed with PBSB, the sections were incubated at room temperature for 1 hr with a 1:40 dilution (in PBSB, pH 8.2) of goat anti-mouse IgG coupled to colloidal gold (average diameter = 10 nm; Janssen Life Sciences, Olen, Belgium). After being washed with PBSB, the sections were rinsed with deionized water. Ultra-thin sections of all labeled samples were mounted on nickel grids and stained with uranyl acetate and lead citrate before examination in a Jeol CX 100 electron microscope (Tokyo, Japan) at 60 kV. Six sets of controls were performed (Thiry 1992a). First, TdT or labeled nucleotides were omitted from the TdT medium. Second, BUdR triphosphate was replaced by BUdR monophosphate. Third, sections were preincubated at 37C for 2 hr with 1 mg/ml DNase I (Sigma; type DN-Ep) in PBS (pH 6.8) containing 7 mM MgCl2. Fourth, sections were preincubated at 37C for 2 hr with 1 mg/ml of pyrimidine-specific RNase (RNase A; Boehringer) in 10 mM Tris-HCl (pH 7.4) containing 15 mM NaCl. In the fifth control, the primary antibody was omitted. Finally, the grids were incubated with antibody-free gold particles. All treatments prevented labeling, except RNase treatment.
Immunocytochemical Technique for RNA
A mouse monclonal anti-RNA autoantibody (D444) with an IgG3,K isotype was used in this study (Thiry 1992b). For labeling, ultrathin sections of Lowicryl-embedded cells were incubated for 25 min in PBSB (pH 7.2) containing normal rabbit serum (NRS) and NGS diluted 1:30 and then for 3 hr at room temperature in RNA-specific antibodies diluted 1:10 in PBSB NRS and NGS, each diluted 1:50. After five rinses in PBSB, the sections were incubated for 30 min with goat anti-mouse IgG3 (heavy-chain specific; Sigma) diluted 1:100 in PBSB containing NRS and NGS, each diluted 1:50. After four rinses in PBSB (pH 7.2) and one rinse in PBSB (pH 8.2), the sections were transferred to an incubation medium containing rabbit anti-goat IgG coupled to colloidal gold 5 nm in diameter (Janssen Life Sciences) diluted 1:50 in PBSB (pH 8.2). Incubation was for 60 min at room temperature. Samples were then rinsed with PBSB followed by distilled water. This labeling was systematically applied to both faces of the ultrathin sections.
Several kinds of control experiments were carried out. When the primary or secondary antibody or both were omitted, the ultrathin sections were devoid of label. When the grids were incubated with antibody-free particles, no labeling occurred. Finally, no label was detected when Lowicryl sections were preincubated at 56C for 120 min with 1 mg/ml RNase A (Boehringer) in 10 mM Tris-HCl (pH 7.4) containing 15 mM NaCl.
Detection of the Translocation of Nucleolar Proteins
T24 cells (105 cells/well) were plated on polylysine–coated coverslips in six-well titer dishes and allowed to undergo three to four cell divisions. Following a 3-hr exposure to the test agents, the cells were washed, fixed in 2% paraformaldehyde in PBS (8.45 mM Na2 HPO4, 1.6 mM NaH2 PO4, 146 mM NaCl) for 15 min at room temperature and then washed three times in PBS with gentle shaking for 5 min per wash. The slides were then fixed in acetone at −20C for 3 min, rinsed briefly four times in PBS, and rinsed once with distilled water before being blown dry with cool air. Antibodies against nucleolar proteins including RH-II/Gu (Valdez et al. 1996), nucleophosmin/B23 (Ochs et al. 1983), p120 (Freeman et al. 1988), and fibrillarin (Reimer et al. 1987) have been described previously. Dilutions of 1:16–1:1000 in PBS were normally used for indirect immunofluorescence. The cells were immunostained with antibodies to nucleolar proteins using the method of Chan (1992). Normal mouse IgG or PBS alone was added instead of first antibody in the control slides. The slides were incubated overnight in a moist chamber at 10C. The slides were washed four times, for 15 min per wash, in PBS and then blown dry with cool air. The second antibodies were FITC-conjugated goat anti-mouse IgG and were diluted 1:20 in PBS and applied to the slides. The slides were incubated in a moist chamber for 1 hr at room temperature and then washed four times with PBS, blown dry, and mounted in 50% glycerol in PBS (pH 9). The immunofluorescence images were examined with a Zeiss Axiovert 100 fluorescence microscope (Carl Zeiss MicroImaging; Thornwood, NY). Fluorescent images were captured by a CCD camera equipped with a frame store and an LG-3 frame grabber. Images were analyzed by National Institutes of Health Image software (Chan et al. 1996).
Results
Vitamin treatment of the T24 cells resulted in CD50 values of 1492 ± 141 μM for VC alone and 13.1 ± 0.01 μM for VK3 alone. When the cells were exposed to Apatone, the CD50 values of VC and VK3 decreased to 212 ± 7.6 μM and 2.13 ± 0.06 μM, respectively (Figure 1). These results represent a 5-fold decrease in the CD50 of VC and a 6-fold decrease for VK3. The FIC index was used to evaluate the synergism of the vitamins. An FIC <1.0 indicated that the combination was synergistic, whereas an FIC >1.0 indicated the combination was antagonistic. An FIC of 1.0 indicated that the combination was indifferent. The FIC for the T24 cells was 0.158 and indicated a synergistic interaction between the vitamins. The results of another study demonstrate that human foreskin fibroblasts were 4-to 6-fold less sensitive to the cytotoxic action of the vitamins than were the tumor cells (Zhang et al. 2001).
Because the endpoints in the MTT assay can be a function of a number of factors, including: anti-metabolic activity, cell death, and cell cycle blockage, flow cytometry was employed to determine whether vitamin treatment affects the cell cycle of T24 cells. Detached cells in the supernatant were pooled with adherent cells and then analyzed by flow cytometry.
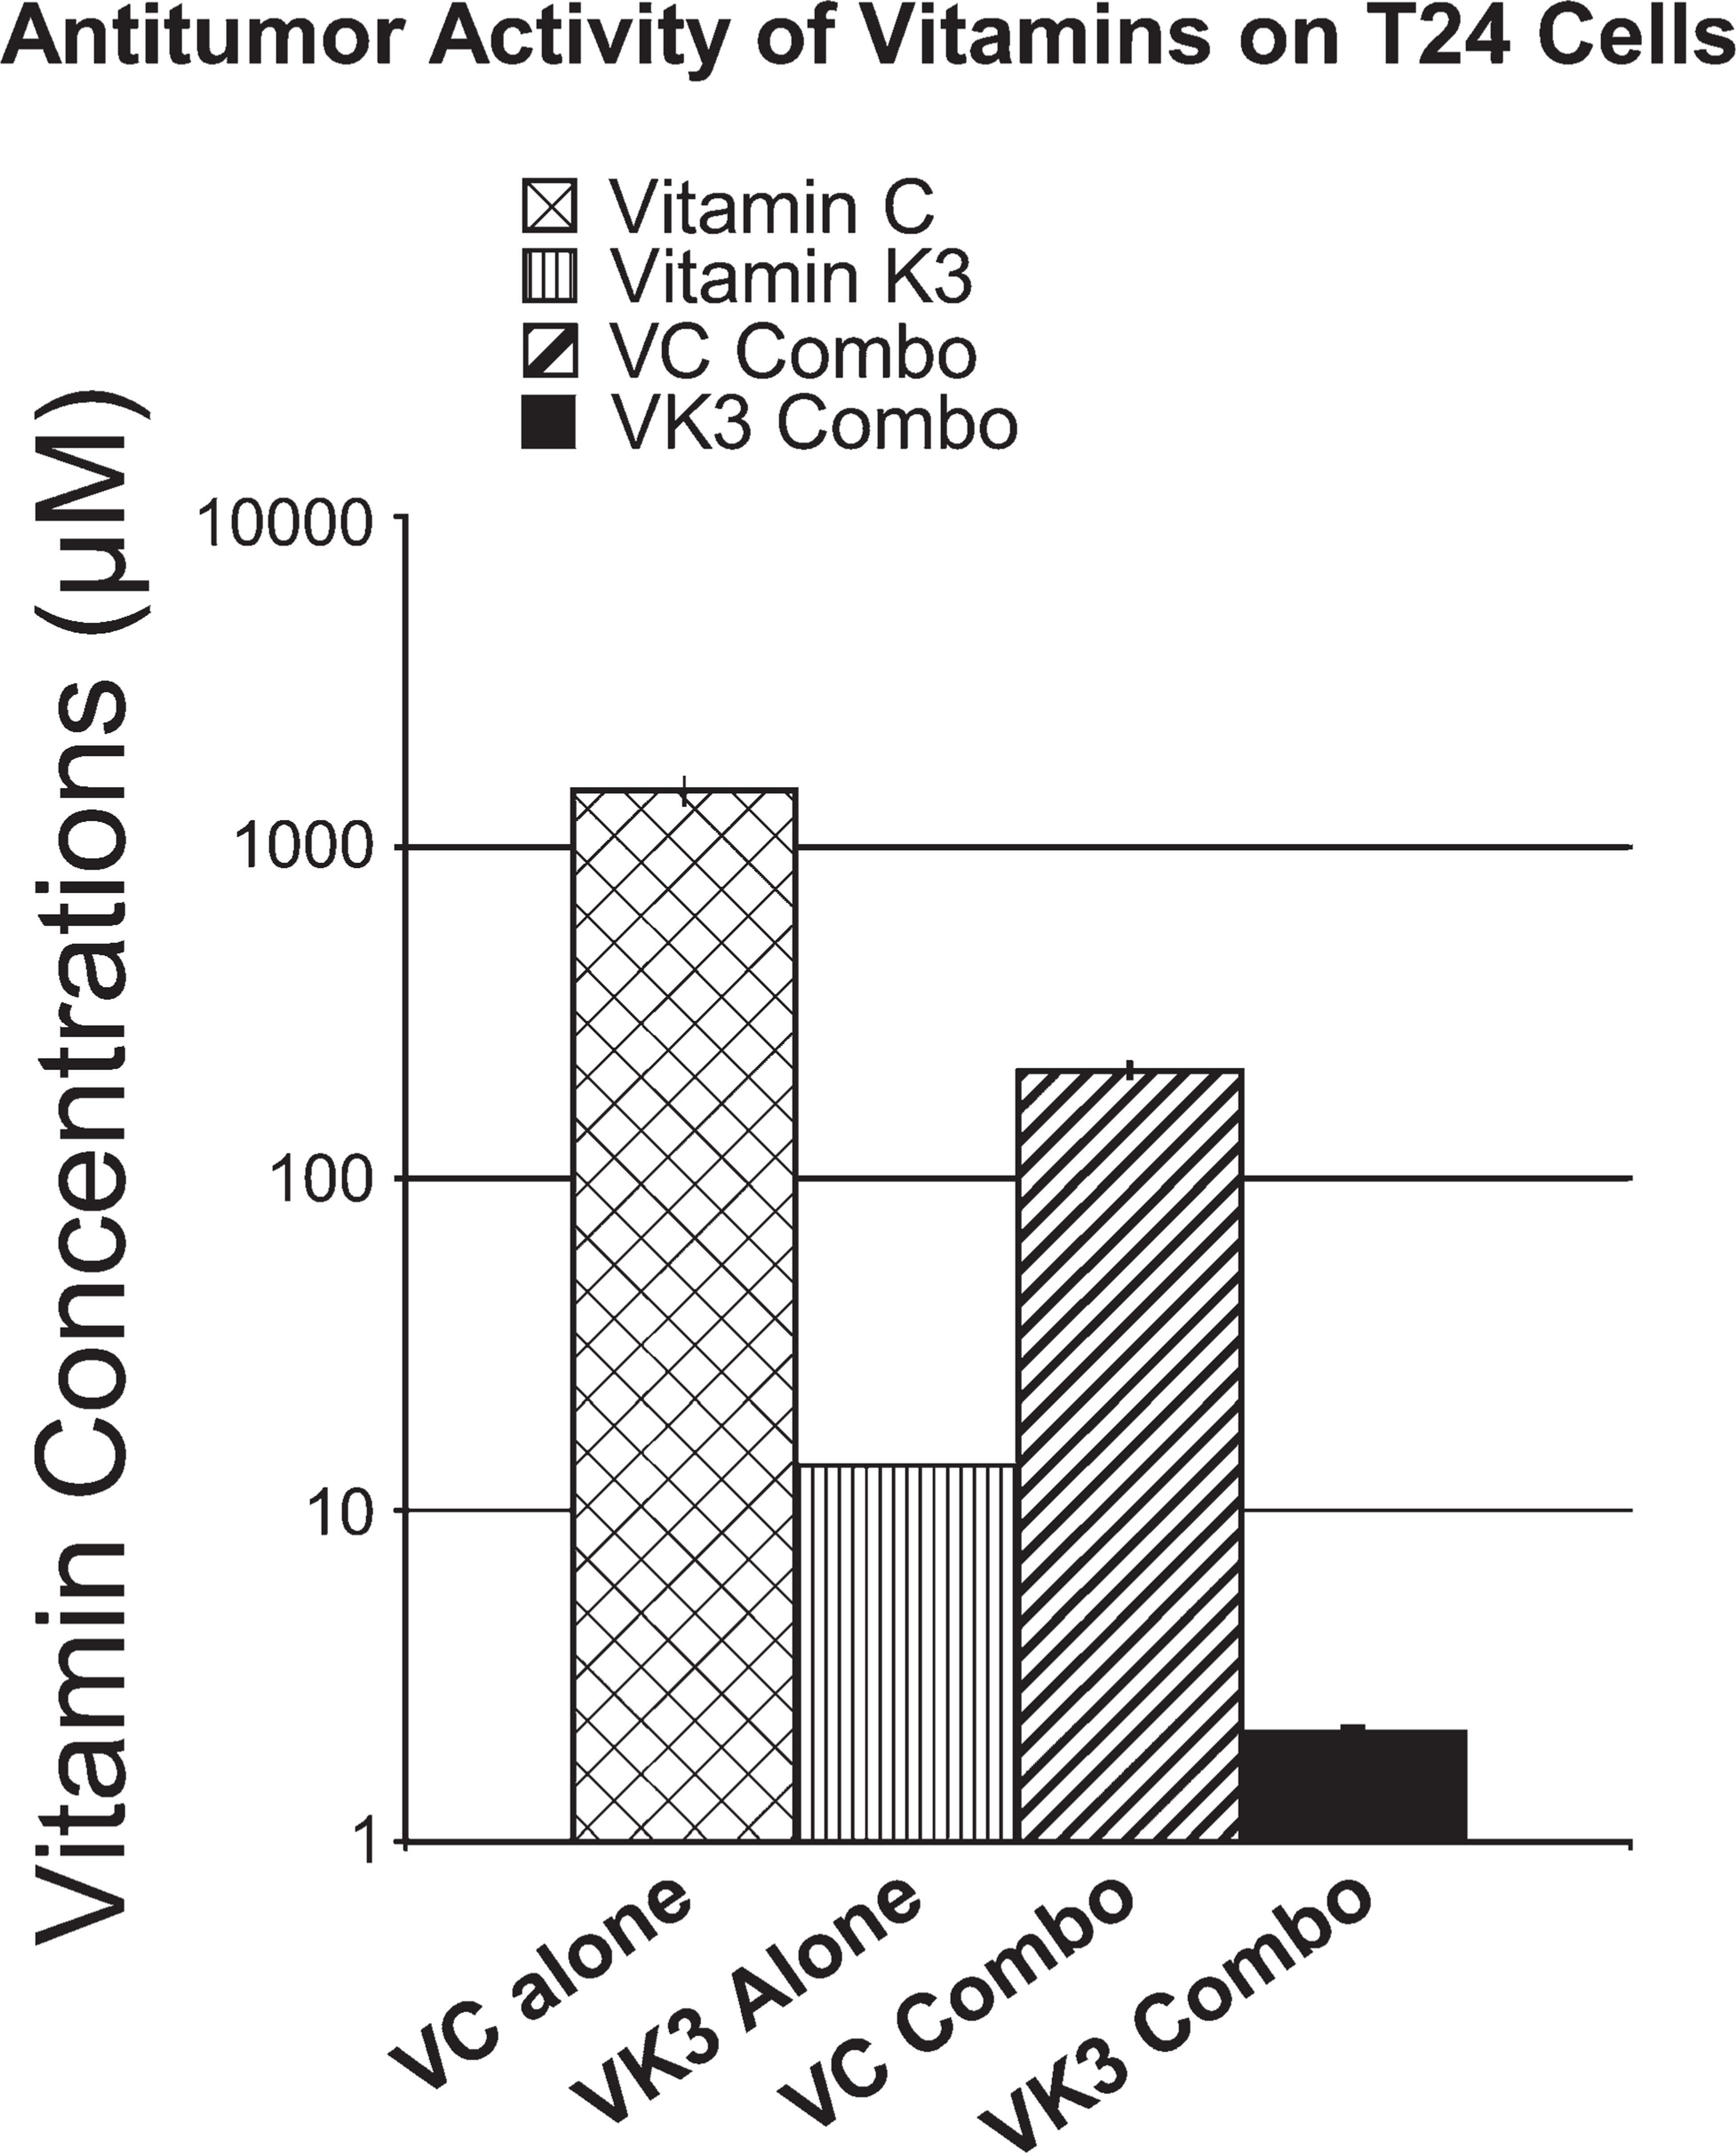
Antitumor activity was measured by a microtetrazolium assay following a 5-day exposure to vitamin C (VC), vitamin K3 (VK3), or a vitamin combination with a VC:VK3 ratio of 100:1. Values are the mean ± standard error of the mean of three experiments, with six readings per experiment. Fractional inhibitory concentration index = CD50 A comb/CD50 A alone + CD50 B comb/CD50 B alone, where CD50 A alone and CD50 B alone are 50% cytopathic doses of each vitamin alone; CD50 A comb and CD50 B comb are the 50% cytotoxic doses of the vitamins administered together.
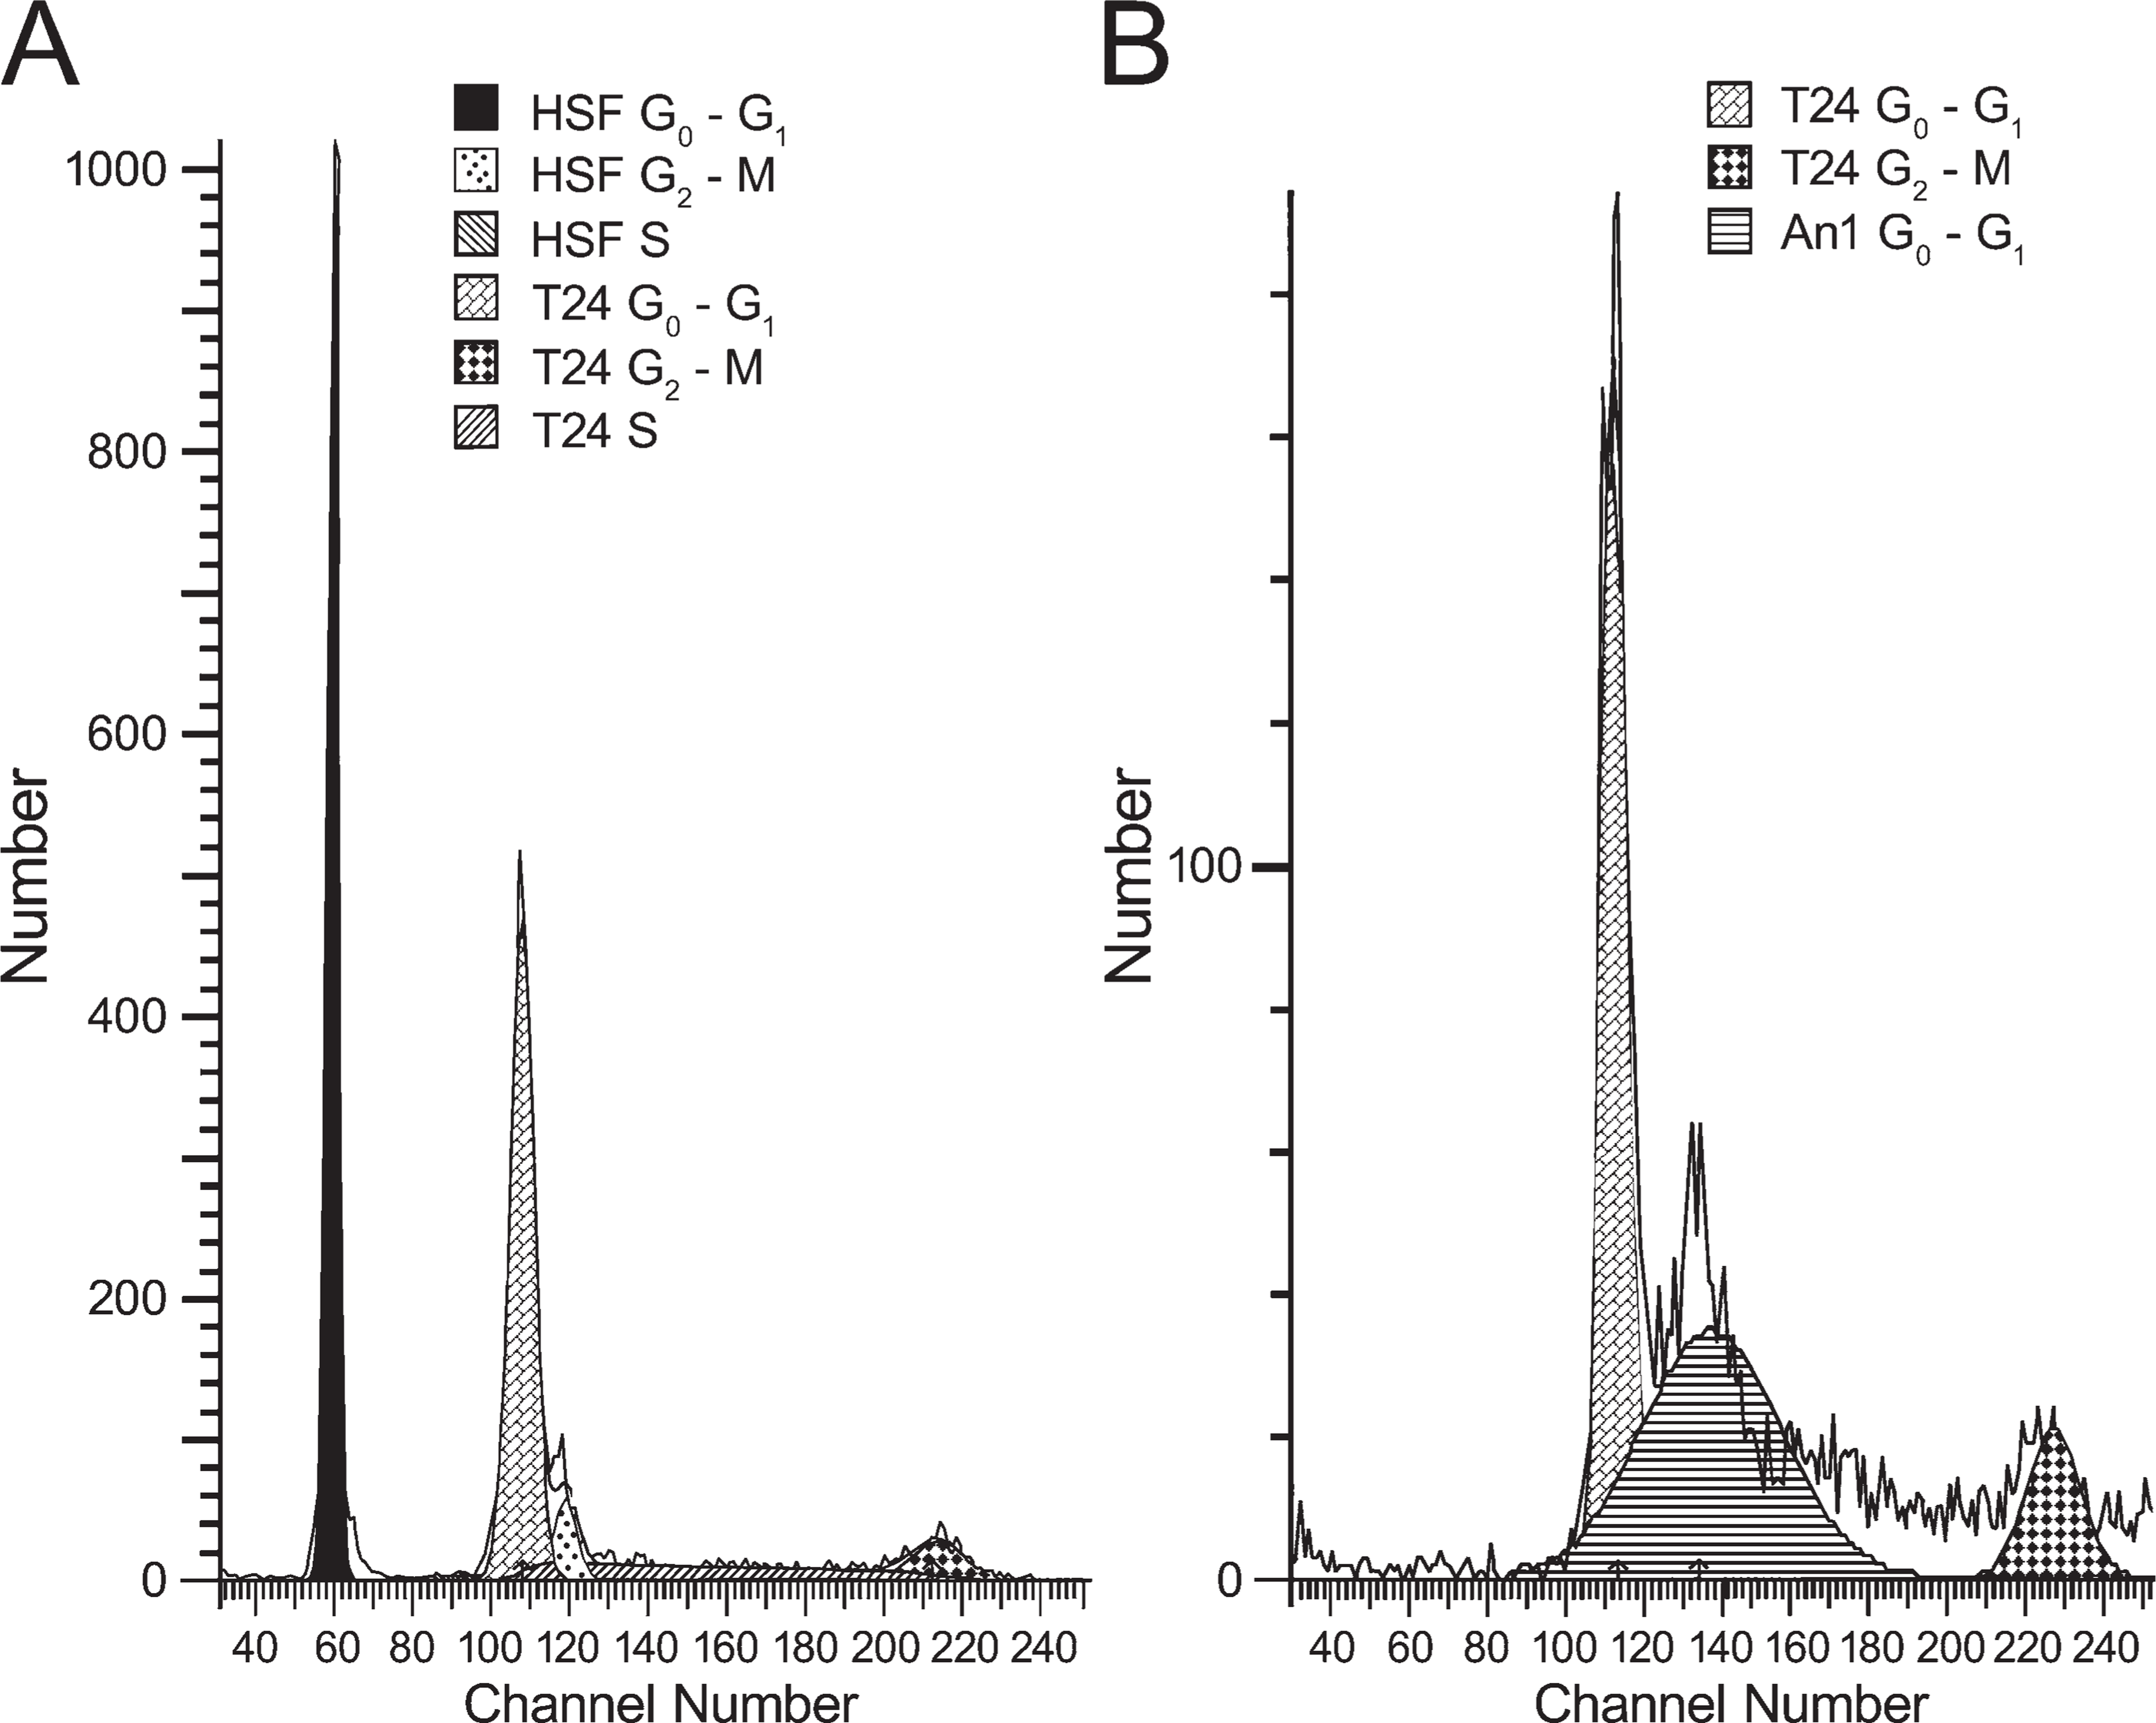
Human foreskin fibroblasts were mixed with T24 cells in an effort to determine the channel number of the true diploid G0/G1 peak (Figure 2). The true diploid peak (G0/G1 for the fibroblasts) is located in channel 59, whereas its corresponding G2/M peak is located in channel 118. Conversely, the T24 cells exhibit a G0/G1 peak in channel 108 and a G2/M peak in channel 214. These observations are in agreement with karyology studies that describe T24 cells as hypo-to-hypertetraploid. In the case of sham treatment, 72% of the cells were in G0/G1, 18% were in S phase, and 10% were in G2/M.
Forward scatter of Apatone-treated cells (data not shown) revealed the presence of two populations of cells. The first population (primarily the adherent cells) had the same dimensions as the sham-treated T24 cells, whereas the second population of cells (primarily the detached cells) was smaller in size than the sham-treated T24 cells. The two populations also differed with respect to their DNA content, with the detached cell population having less DNA than the adherent population. In the case of Apatone treatment (Figure 2), 47% of the cells counted were adherent, aneuploid, and of the same size as control cells (Table 1). However, following Apatone treatment, 100% of the cells in the aneuploid population were blocked in late G1 to early S phase. The remaining 53% of the cells counted were detached and of a smaller size than control cells (10–15 mm). Seventy nine percent of these cells were in G0/G1, whereas 21% were in G2/M (Table 1). The lack of cells in S phase suggests that either the cells were arrested in late G1 phase or the cells were arrested in both G1 and G2/M and that the cells in G1 were arrested in G1 whereas those that had passed the G1 checkpoint progressed through the S phase and became arrested in G2/M. When the cell cycle distributions of both populations were calculated using weighted averages, 89% of the cells were in G0/G1 [(79 × 0.53) + (47 × 1.00)] and 11% were in G2/M (Table 1).
T24 cells were sham treated
Cell cycle distribution of the T24 cells
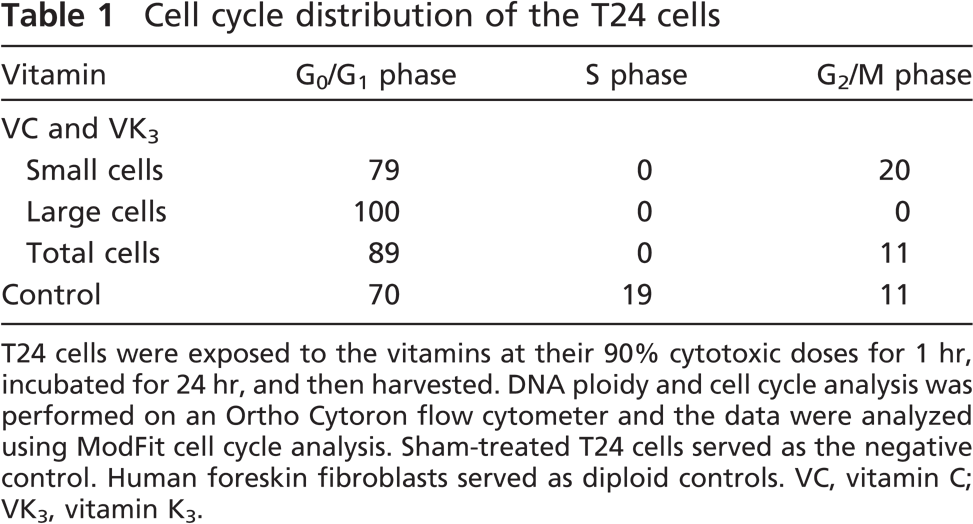
T24 cells were exposed to the vitamins at their 90% cytotoxic doses for 1 hr, incubated for 24 hr, and then harvested. DNA ploidy and cell cycle analysis was performed on an Ortho Cytoron flow cytometer and the data were analyzed using ModFit cell cycle analysis. Sham-treated T24 cells served as the negative control. Human foreskin fibroblasts served as diploid controls. VC, vitamin C; VK3, vitamin K3.
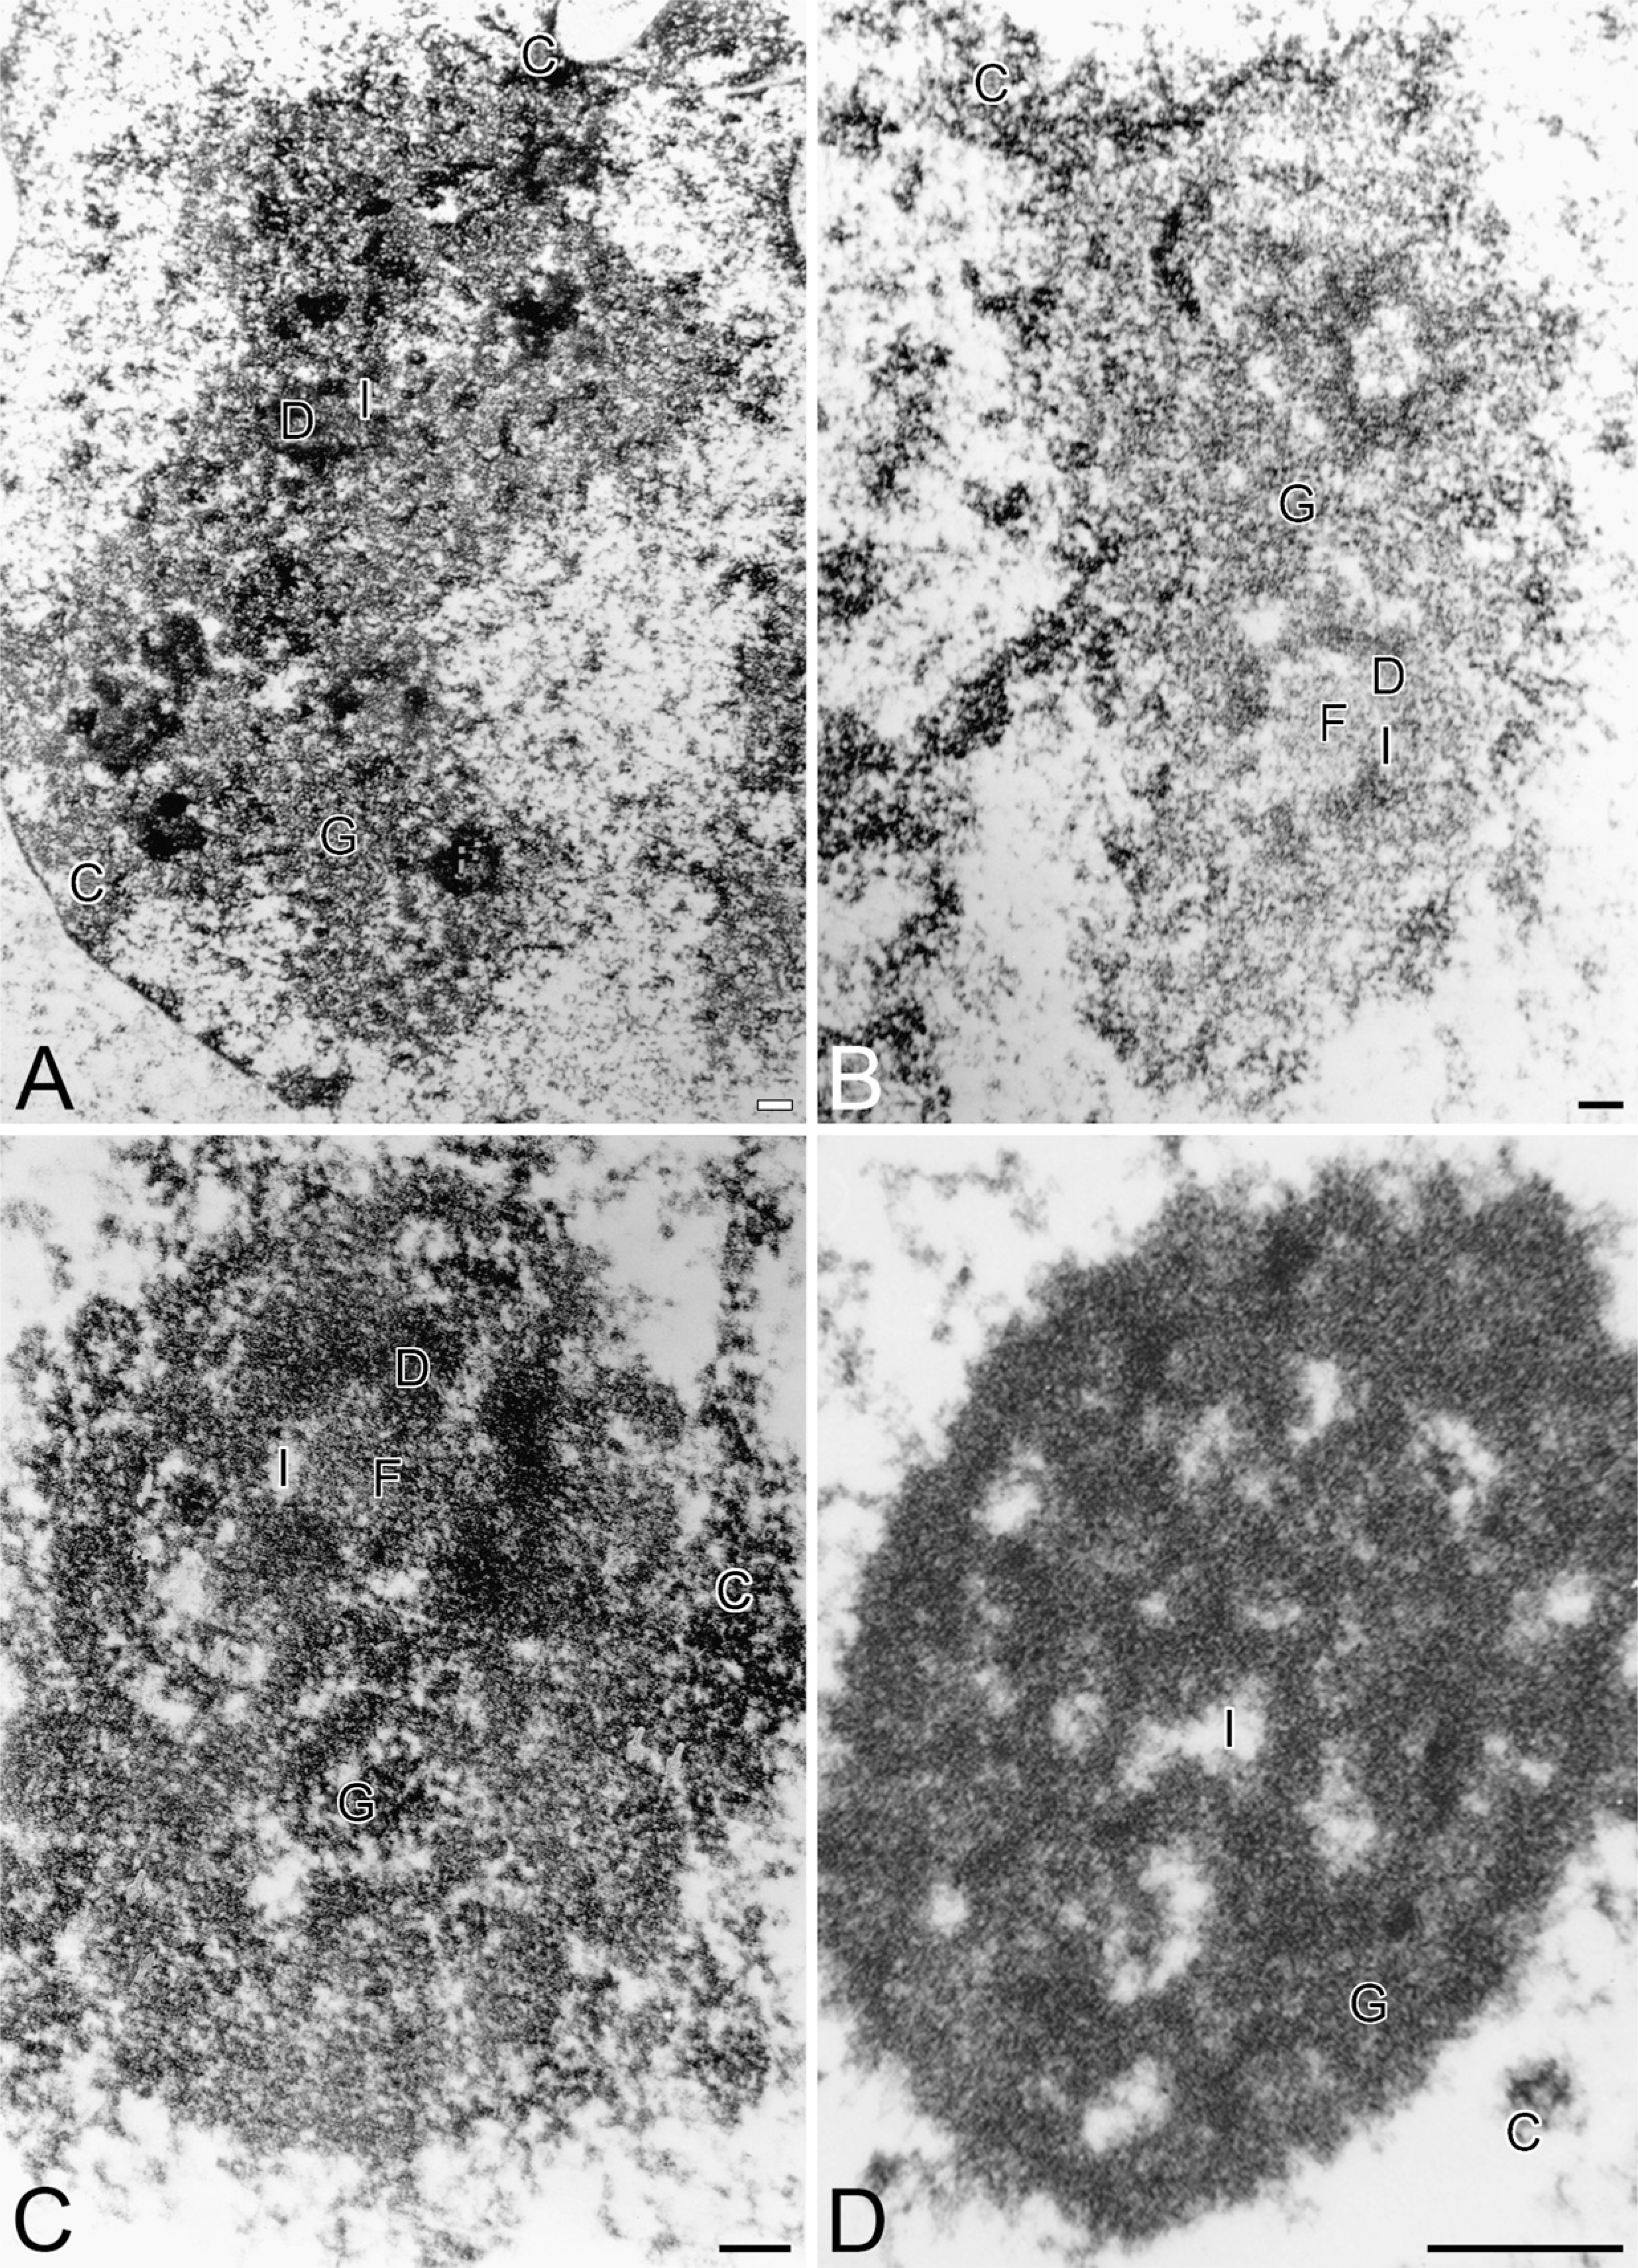
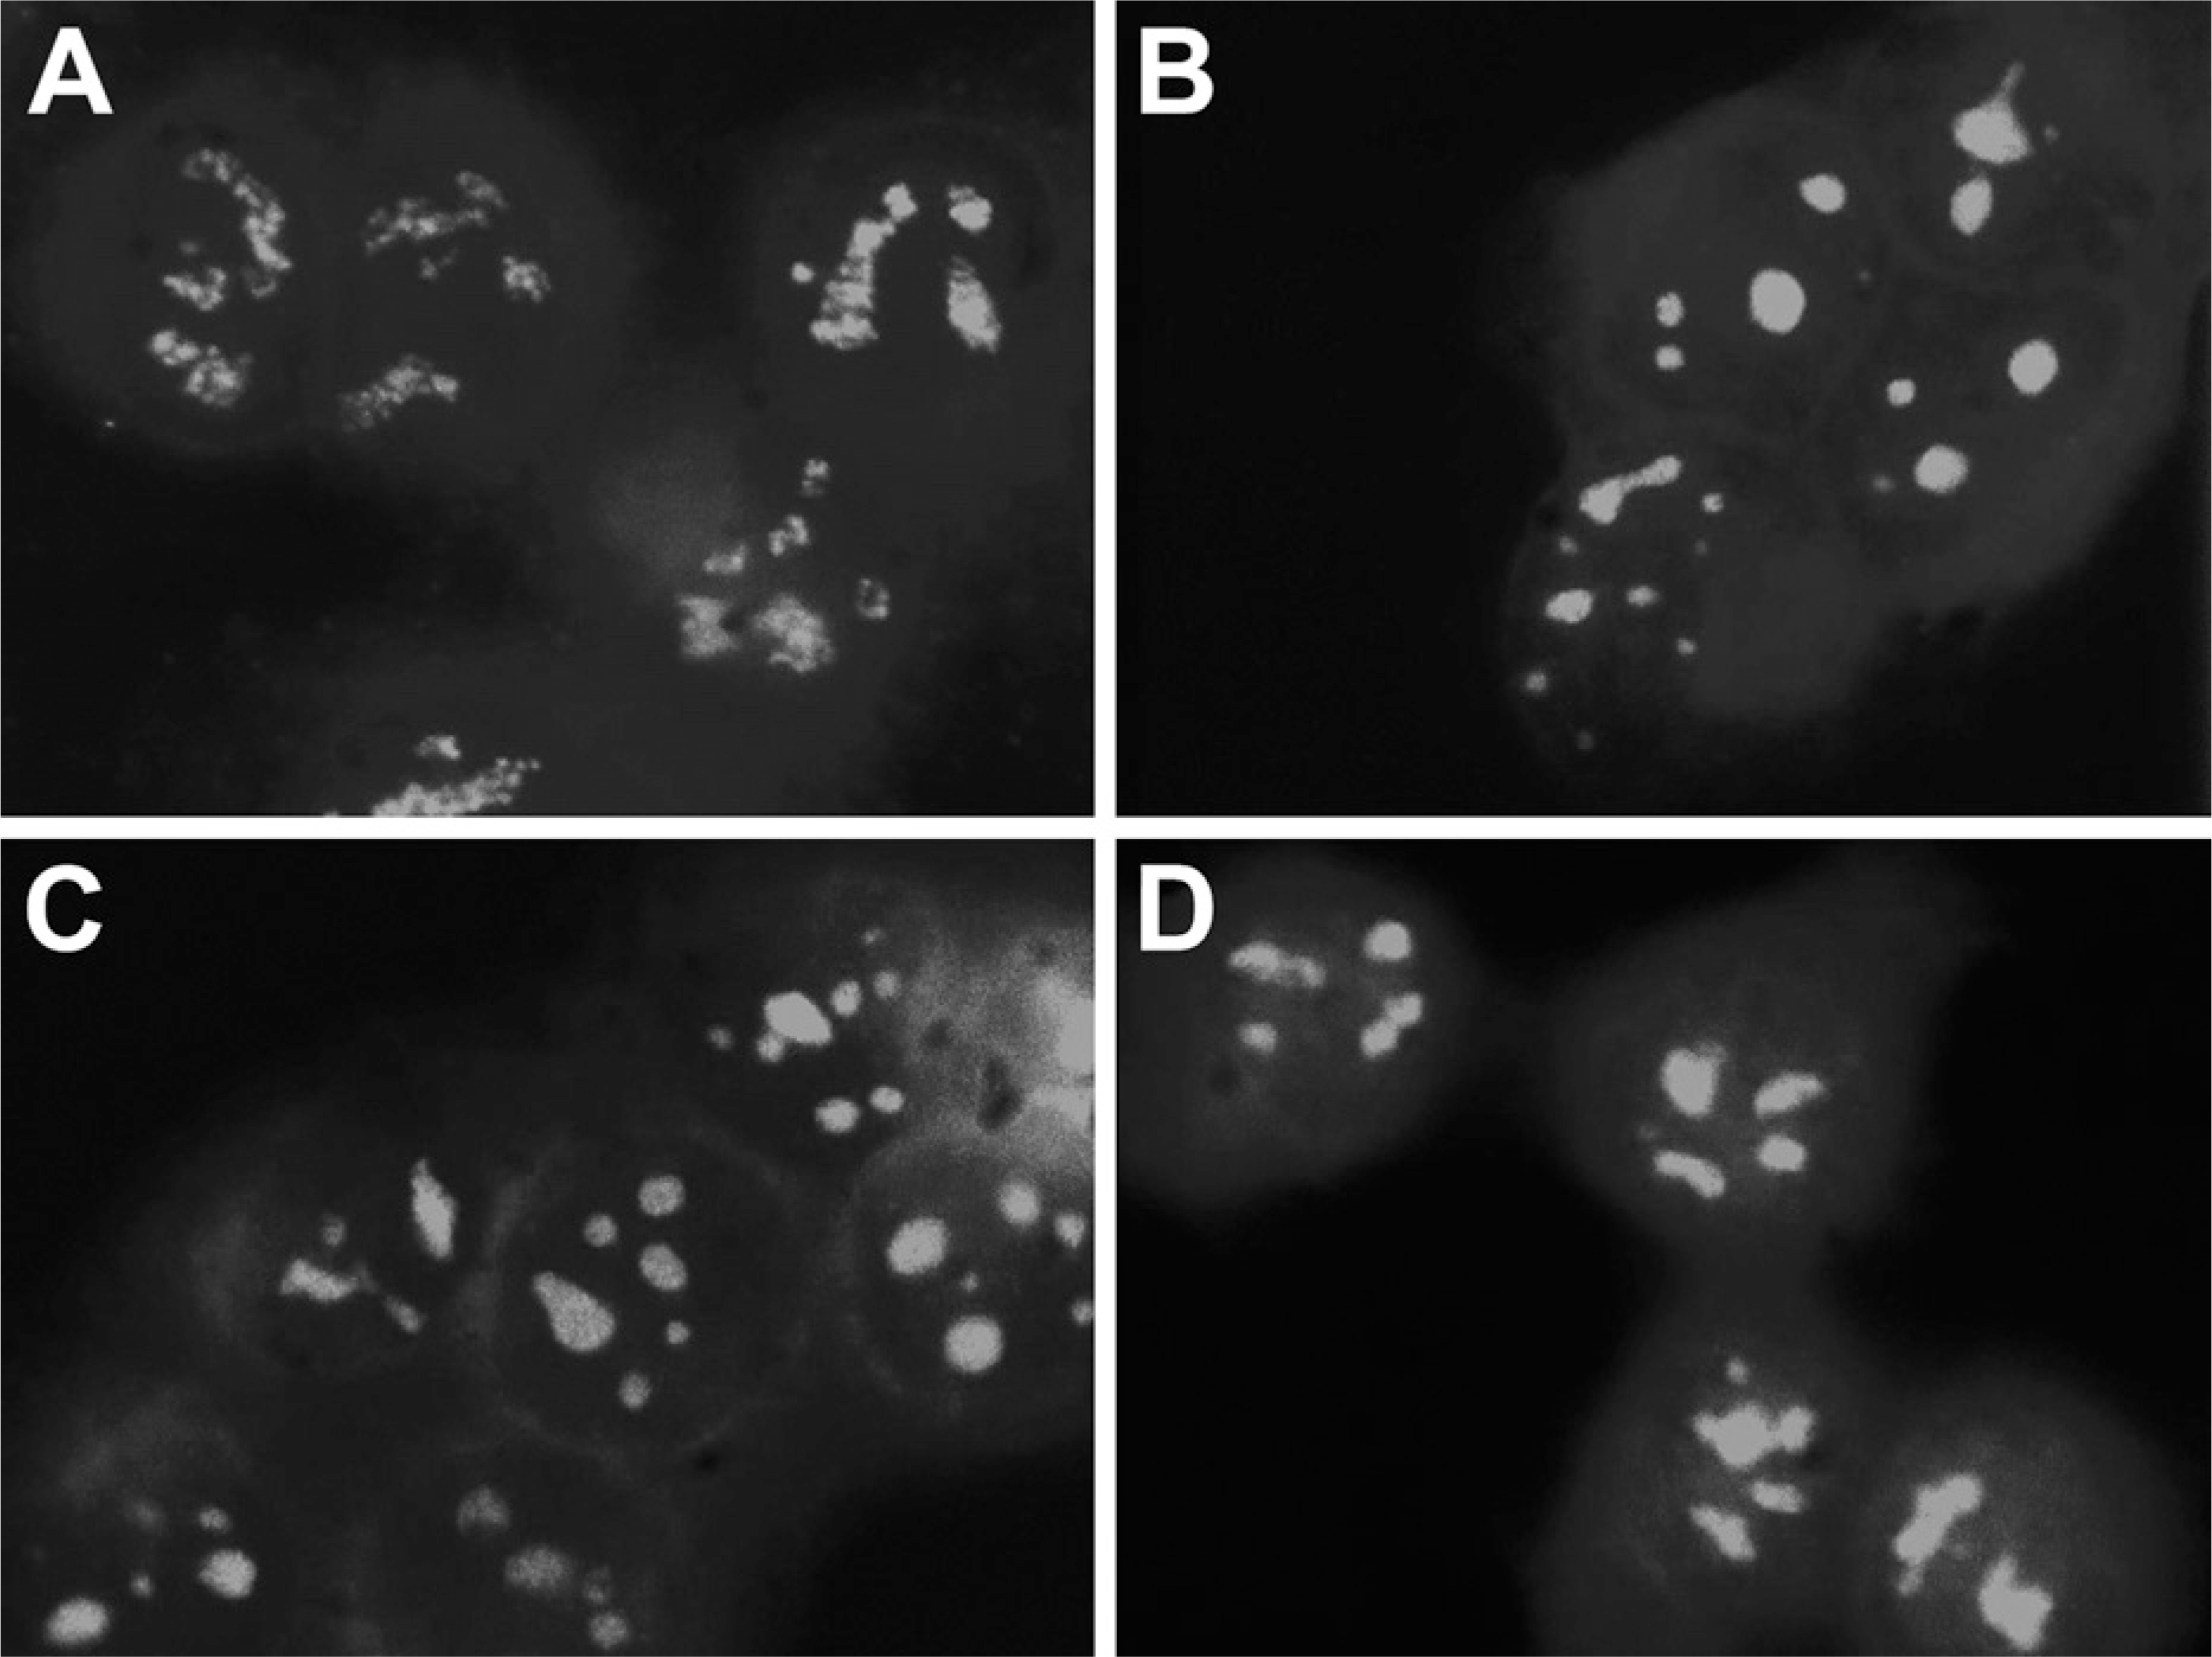
Because nucleolar morphology has been employed successfully to assess the status of the cell, to distinguish between malignant, benign, and normal cells, and to differentiate between apoptosis and necrosis, nucleolar ultrastructure was examined following vitamin treatment (Figure 3). The nucleoli of control cells (Figure 3A) were reticulated. The perinucleolar chroma-tin was limited to a small, less-distinct layer along the inner nuclear membrane and as a discontinuous shell around the nucleolar body. The nucleoli possessed numerous fibrillar centers and characteristic fibrillar and granular RNA-containing components. The nucleoli are usually located near the nuclear envelope, which is often infolded at the site. Such nucleoli are known to express a high biosynthetic activity and are present in proliferating cells. In cells treated either with VC or VK3, nucleoli did not differ substantially from those in control cells.
However, following Apatone treatment (Figure 3D), the nucleoli exhibited one of two patterns of changes in their ultrastructural appearance. The first set of nucle-oli exhibited marked ultrastructural changes. These nucleoli were small, compact, and almost ring-shaped, and their nucleolar interstices were not apparent at the light microscopy level. These nucleoli were composed of enlarged fibrillar centers with clusters of the intra-nucleolar chromatin, and their nucleolar-associated chromatin was more condensed. In comparison with nucleoli of control cells, the perinucleolar chromatin formed a distinct shell around the nucleolar body. In addition, the perinucleolar chromatin consisted of large chromatin clumps, which could be almost the same size as the nucleolar body. In addition, the fibrillar and granular RNA-containing components were segregated. Such nucleoli are known to be present in cells with decreased or inhibited RNA transcription.
The second group of Apatone-treated nucleoli was less altered. Although these nucleoli were reticulated, they were more compact than the nucleoli of control cells or cells treated either with VC (Figure 3B) or VK3 (Figure 3C) alone. Both the nucleolar fibrillar centers and nucleolar interstices were reduced in number, but enlarged in size. However, the redistribution of the main nucleolar components was not observed, and both fibrillar as well as granular components were clearly seen. The discontinuous perinucleolar chroma-tin possessed large clumps of chromatin, which were not seen in control cells or cells treated with VC or K3. Such nucleoli are known to be present in nucleolar RNA transcribing and proliferating cells.
The TdT method, in conjunction with immunogold labeling, has been used to visualize the DNA of ultra-thin sections of equivalent fields of view (Figure 4) of T24 cells (1-hr and 4-hr treatments). After random sectioning, sham-treated T24 cells exhibit many of the characteristics of tumor cells. For example, they possess complex, indented nuclei with large nucleoli. These nucleoli contain large nucleolonemal masses with reticulated, dense fibrillar components that usually occupy a large area of the nucleoplasm. In addition, the nucleolar mass is often closely associated with the inner nuclear envelope near one or more of its nuclear indentations. The dense fibrillar component of the nucleolus is contrasted and appears as thick strands or coarse, anastomosing loops. A few large fibrillar centers are visible and are surrounded by the dense fibrillar component. When the fibrillar centers are visible, as in Figure 4A, they can reach diameters of 1.5 mm. In addition, some of the fibrillar centers near the periphery of the nucleolus are labeled by the DNA antibody. Small interstices are also apparent, while the granular component forms narrow islands intertwined between the thick, thread-like networks of the dense fibrillar component.
The perinucleolar chromatin is loosely associated with the nucleolonema and appears as electron-dense patches dispersed throughout the nucleoplasm and as patches of heterochromatin located along the inner nuclear membrane. This component is also specifically labeled by the immunogold-labeled DNA antibody. The other components of the nucleolus, including the dense fibrillar component and the granular component are visible as aggregates of 12-to-15–nm particles and are not labeled. No DNA label was found in the cytoplasm.
As a result of VC treatment (Figure 4C), the nucleolus appears as an elongated compact mass whose components are segregated. The majority of perinucleolar chromatin lies outside the nucleonema. One dense fibrillar region can be detected within the large granular component, which is not labeled by the DNA immuno-gold antibody. A dense fibrillar component surrounds the fine fibrillar areas and can be detected inside the compact aggregates of the granular component. Typically, a small amount of label is associated with the fibrillar center region. The majority of DNA immunogold label covers the electron-dense intranucleolar chromatin as well as the perinucleolar chromatin.
Following VK3 treatment, the nucleolus (Figure 4B) appears as compact mass whose components are segregated. The perinucleolar chromatin lies outside the nucleolonema and does not exhibit interstices. The majority of DNA immunogold label covers the electron-dense intranucleolar chromatin as well as the perinucleolar chromatin. The dense fibrillar component that surrounds the fine fibrillar areas can be detected inside the compact aggregates of the granular component. Typically, a small amount of label is associated with the fibrillar center region. One dense fibrillar region can be detected within the large granular component and is not labeled by the DNA immunogold antibody.
Ultrastructural topography of the nucleoli of autoschizic bladder carcinoma cells that have been treated for 4 hr with PBS
Following a 1-hr Apatone treatment (Figure 4D), the nucleoli appear as round, centrally located, nuclear masses that have lost contact with the nuclear envelope. These nucleoli are almost completely composed of the granular component and are not labeled by the immunogold. The granular component is surrounded by perinucleolar chromatin aggregates. The nucleoli also contain a few variably sized interstices. A small amount of immunogold label can be detected in the most peripheral of these interstices. Some of these interstices possess a small amount of delicate, electron-dense chromatin that is intertwined with the nucleolonema and extends beyond the outermost limit of the perinucleolar chromatin. A minute amount of unlabeled, dense fibrillar material can be detected at the edge of the large nucleolonema. No fine fibrillar component is evident.
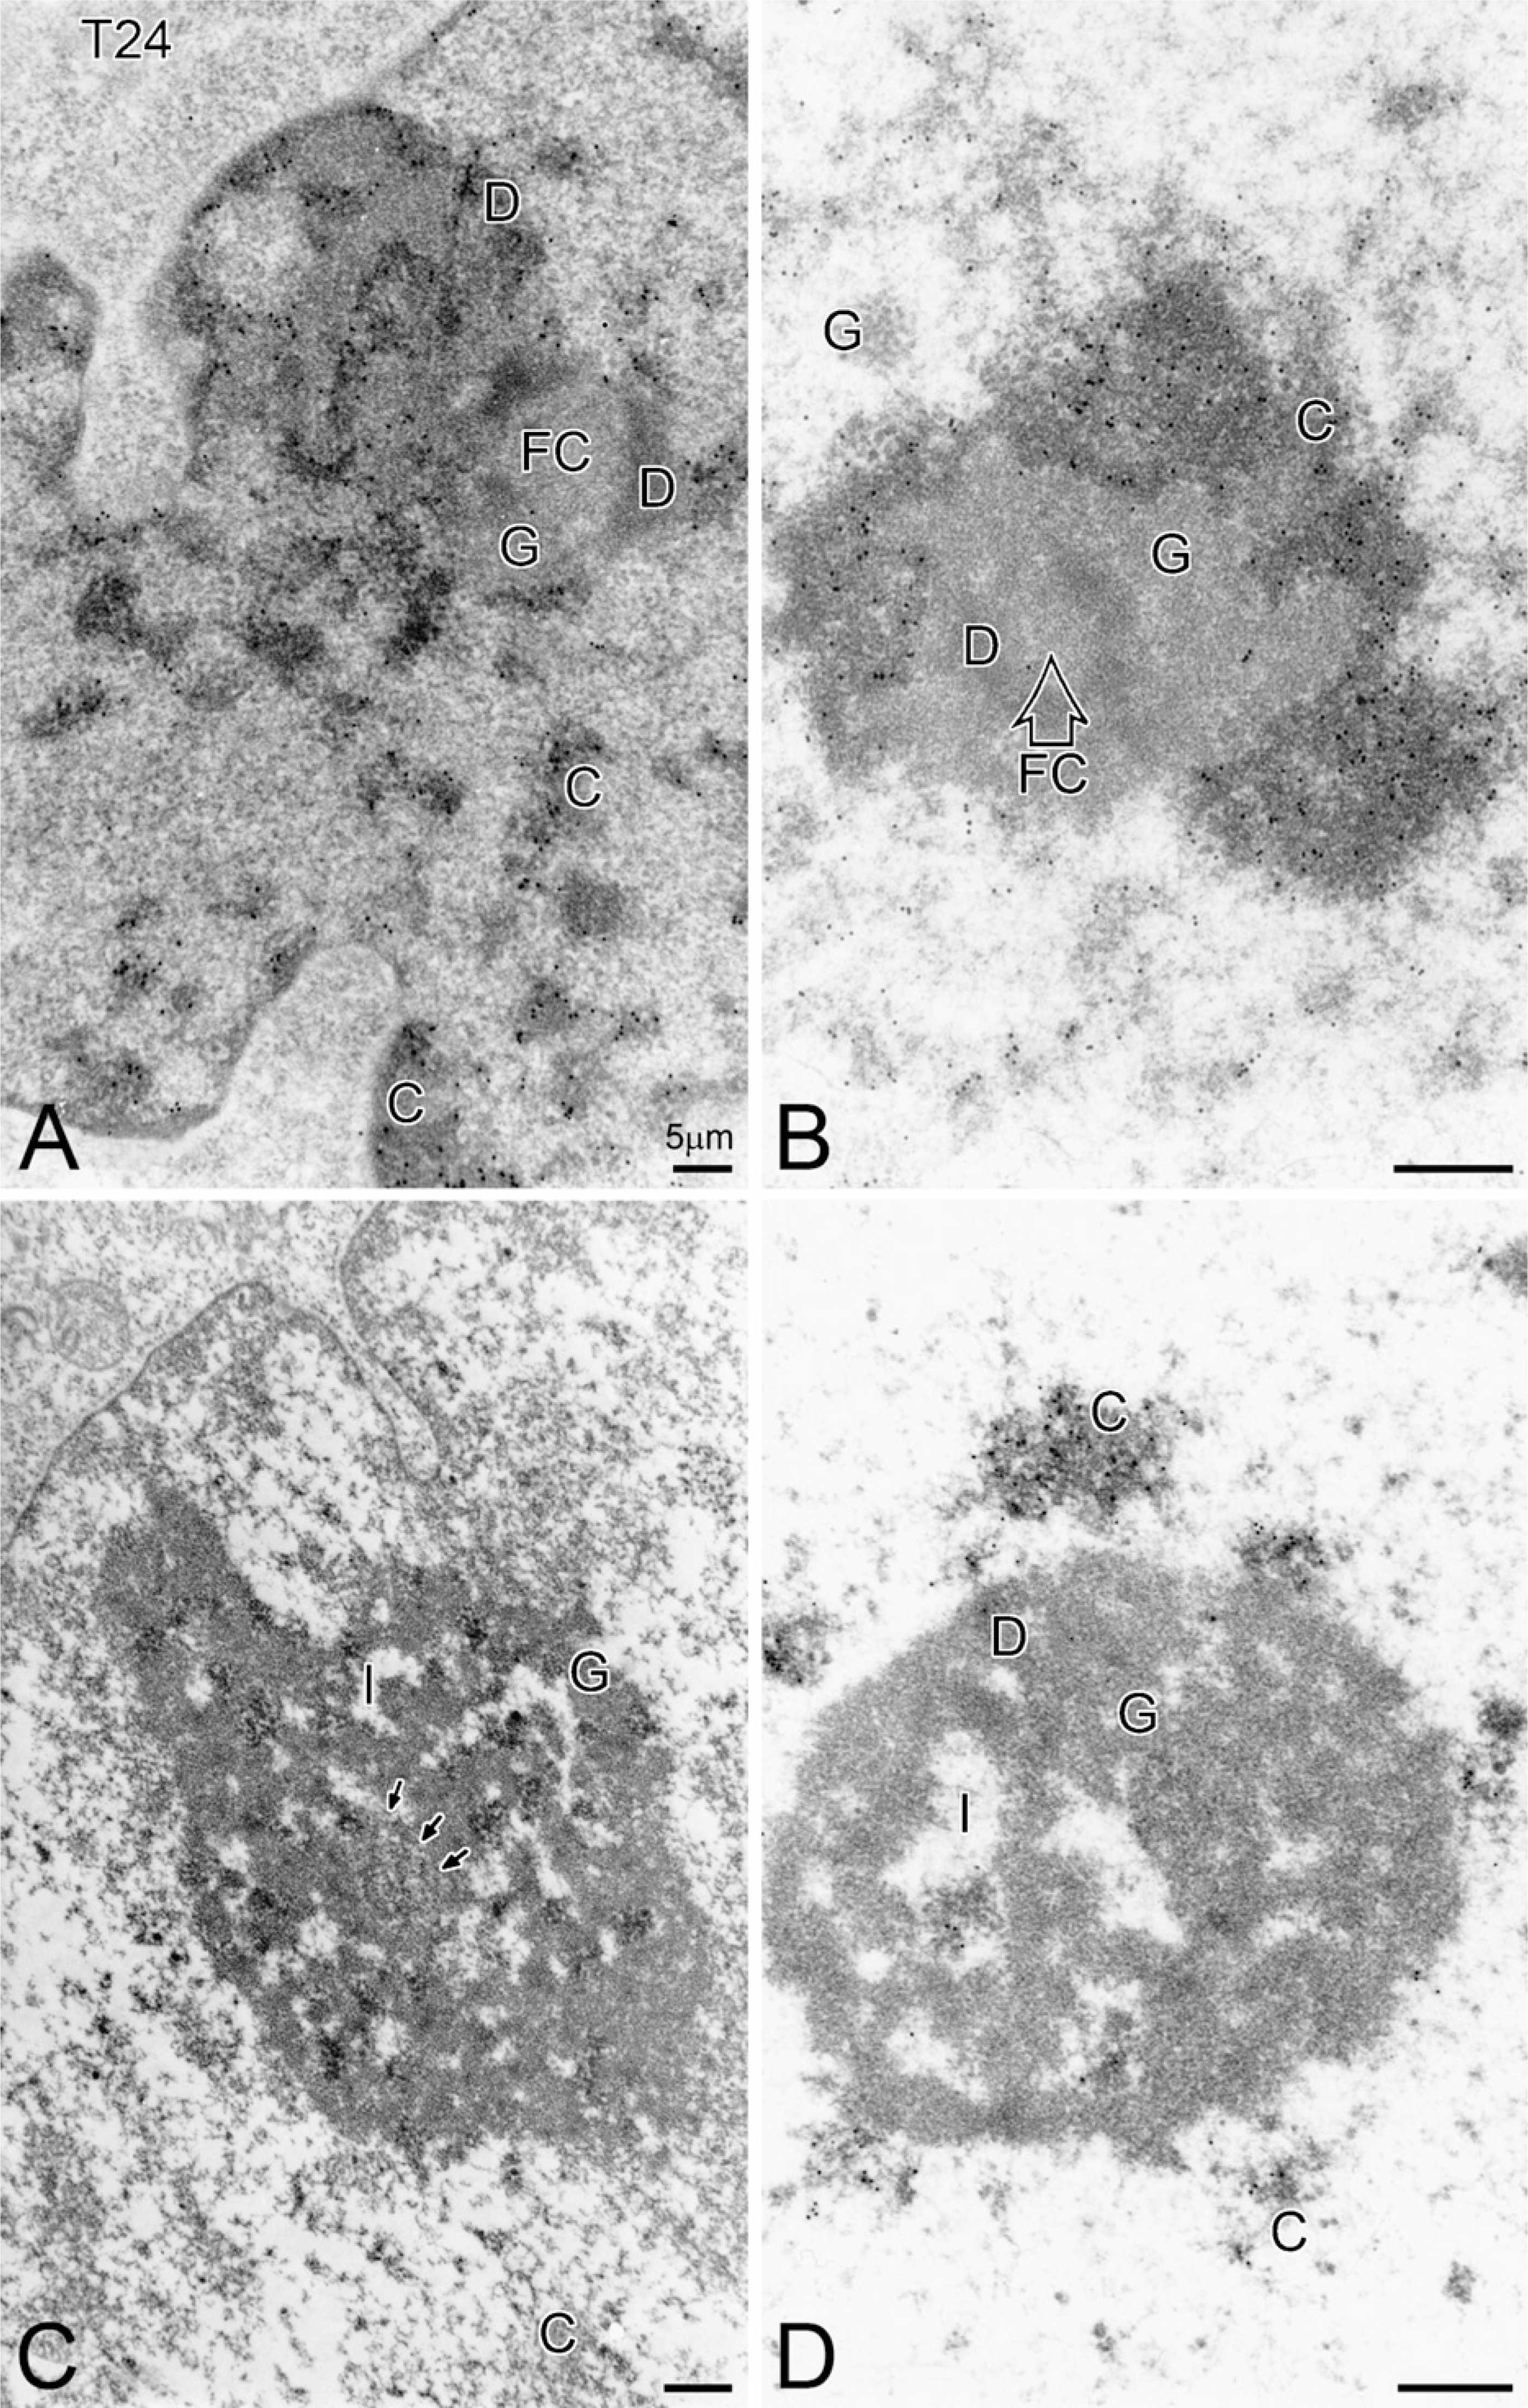
Distribution of DNA immunogold (diameter = 10 nm) within the nucleoli of T24 bladder carcinoma cells treated for 4 hr with PBS (sham), menadione, ascorbate, or Apatone.
A series of photomicrographs made after a 4-hr VC: VK3 treatment (Figures 5A–5D) suggest a progressive segregation of the nucleolar components where the electron densely contrasted chromatin (DNA labeled) associates and interacts with the other nucleolar components along with chromatin associated with the inner nuclear membrane (see Figures 5B and 5C), The nucleolonema somewhat remains as a main mass of granular component, unlabeled by DNA antibody, first with small interstices and finally forming a compact aggregate. The dense component is discrete and was detected only in the area shown in Figure 5B. From a series of chromatin fingers interacting and penetrating the nucleolus (Figures 5A and 5B), the granular component becomes more and more compacted, whereas the chromatin component appears partially to totally extruded and exits the granular component (Figure 5D).
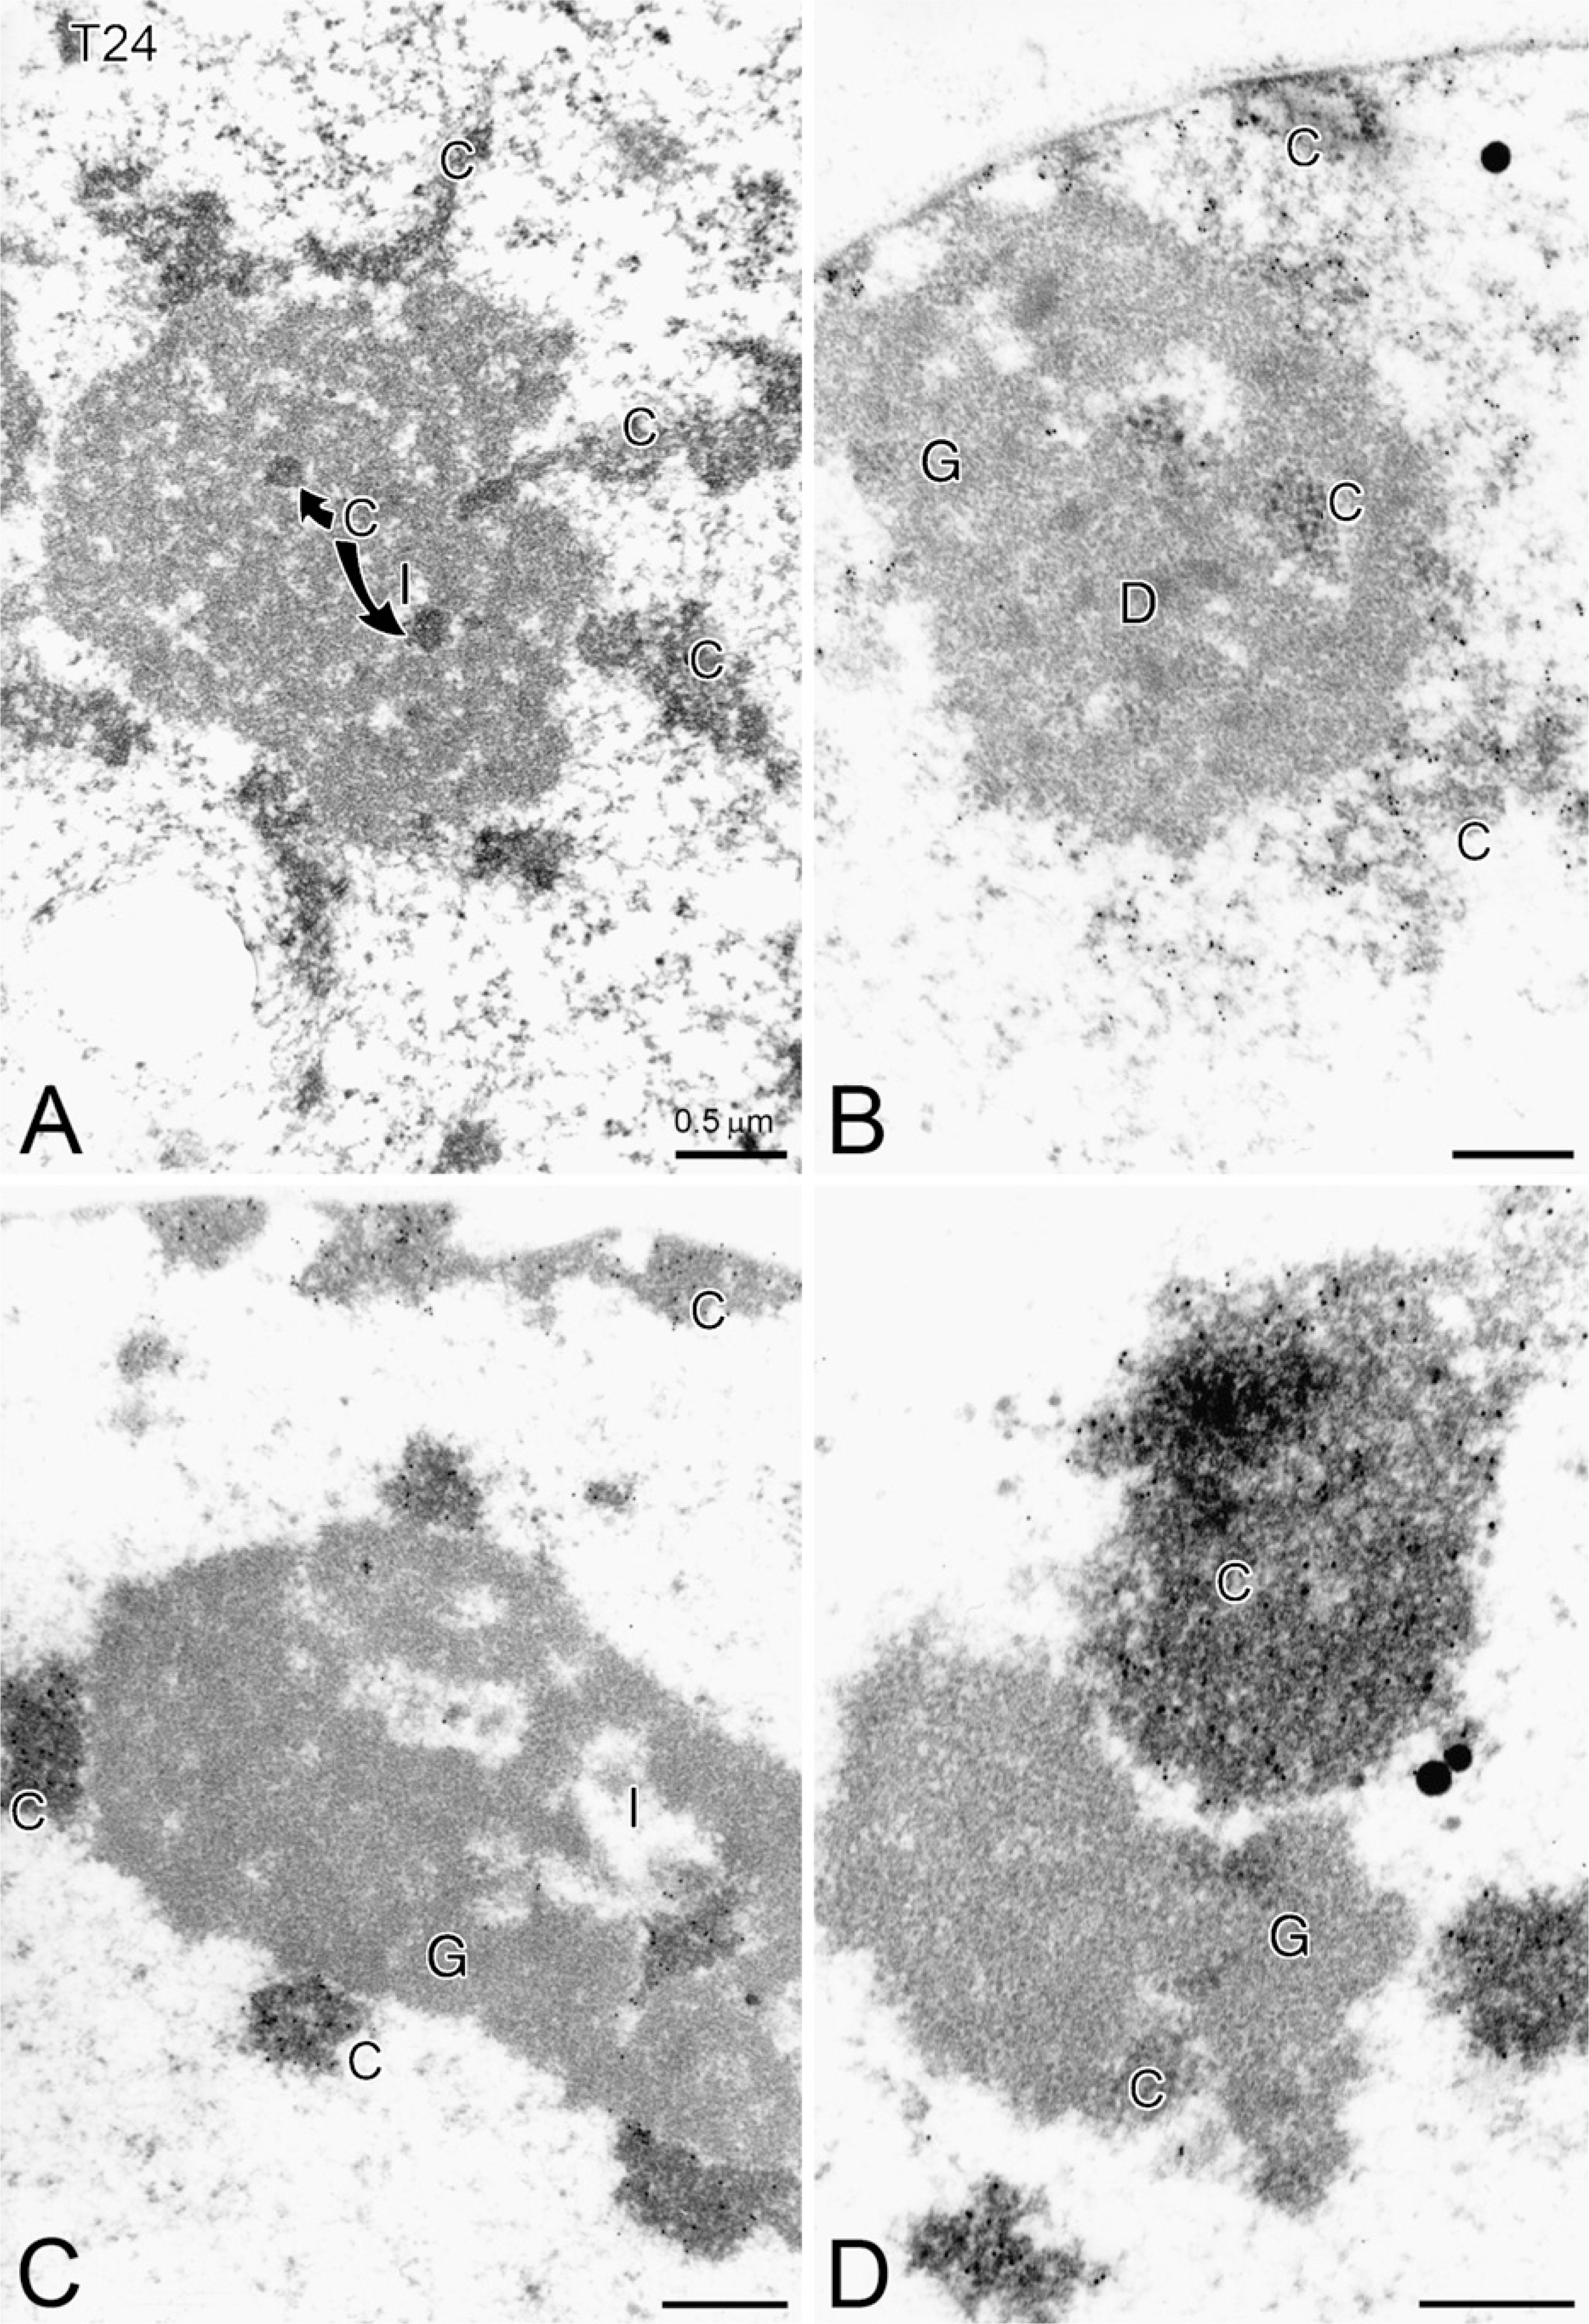
A series of photomicrographs made after 1-, 2-, 3-, or 4-hr Apatone treatment. This figure illustrates the progressive segregation of the nucleolar components, where the electron densely contrasted chromatin (C) (DNA labeled) associates and interacts with the other nucleolar components, along with chromatin associated with the inner nuclear membrane
T24 RNA Labels
Immunolabeling with gold-labeled, anti-RNA antibodies has been used to visualize the RNA of ultrathin sections. Owing to the high specificity of the antibody for G,C-polyribonucleotide sequences, an intense labeling can be detected over the nucleoli and over the cytoplasmic ribosomal-rich regions. Sham-treated cells display an overall RNA labeling throughout the field of observation, with label located on the nucleolonema and diffusely throughout the surrounding nucleoplasm. Figure 6A shows dense immunogold labeling of the thick fibrillar component, which appears as a thick reticulated network. The granular component of this nucleolus is also highly labeled. The dense fibrillar component appears as discrete packets outside the nucleolonema and is unlabeled. The fine fibrillar regions constitute relatively small masses within the interwoven components of this reticulated nucleolus and are difficult to pinpoint.
Following VC treatment (Figure 6B), the nucleolonema possesses a typical reticular, dense component. Although RNA label can be detected as aggregates throughout the network, clusters of label with diameters ranging from 20 to 60 nm are commonly found in the dense component. The granular component is also labeled throughout. Chromatin throughout the remaining nucleoplasm is unlabeled. Large amounts of label are also found in the cytoplasm and over the RER.
VK3-induced changes in nucleolonemal organization are reflected by changes in the distribution of the immunogold label (Figure 6C). The labeling of the granular component appears in clusters both within the dense component and outside the dense component. The granular component is also somewhat condensed, compared with that observed in the sham-treated cell nucleoli. Clustered labeling is also seen throughout the dense component, which suggests a heterogeneous redistribution of the RNA. Fine immunogold labeling (diameter = 5 nm) is observed in the uncontrasted nucleoplasm and in the cytoplasm. The fine fibrillar areas are difficult to define in this micrograph.
Following Apatone treatment, the nucleolus is spherical and is composed primarily of the granular component, although some interstices are also visible (Figure 6D). Almost the entire nucleolonema is labeled with the immunogold in small aggregates with diameters of 30 to 50 nm. Although a small loop of unlabeled dense component is visible within that nucleolonema, most of the nucleolus is ribonucleoproteins. It is probably owing to the angle of sectioning that the dense component is found within the nucleolonema network. A small amount of label is located in the nucleoplasm and may represent either processed RNA or background labeling.
Indirect Immunofluorescence of Nucleolar Proteins
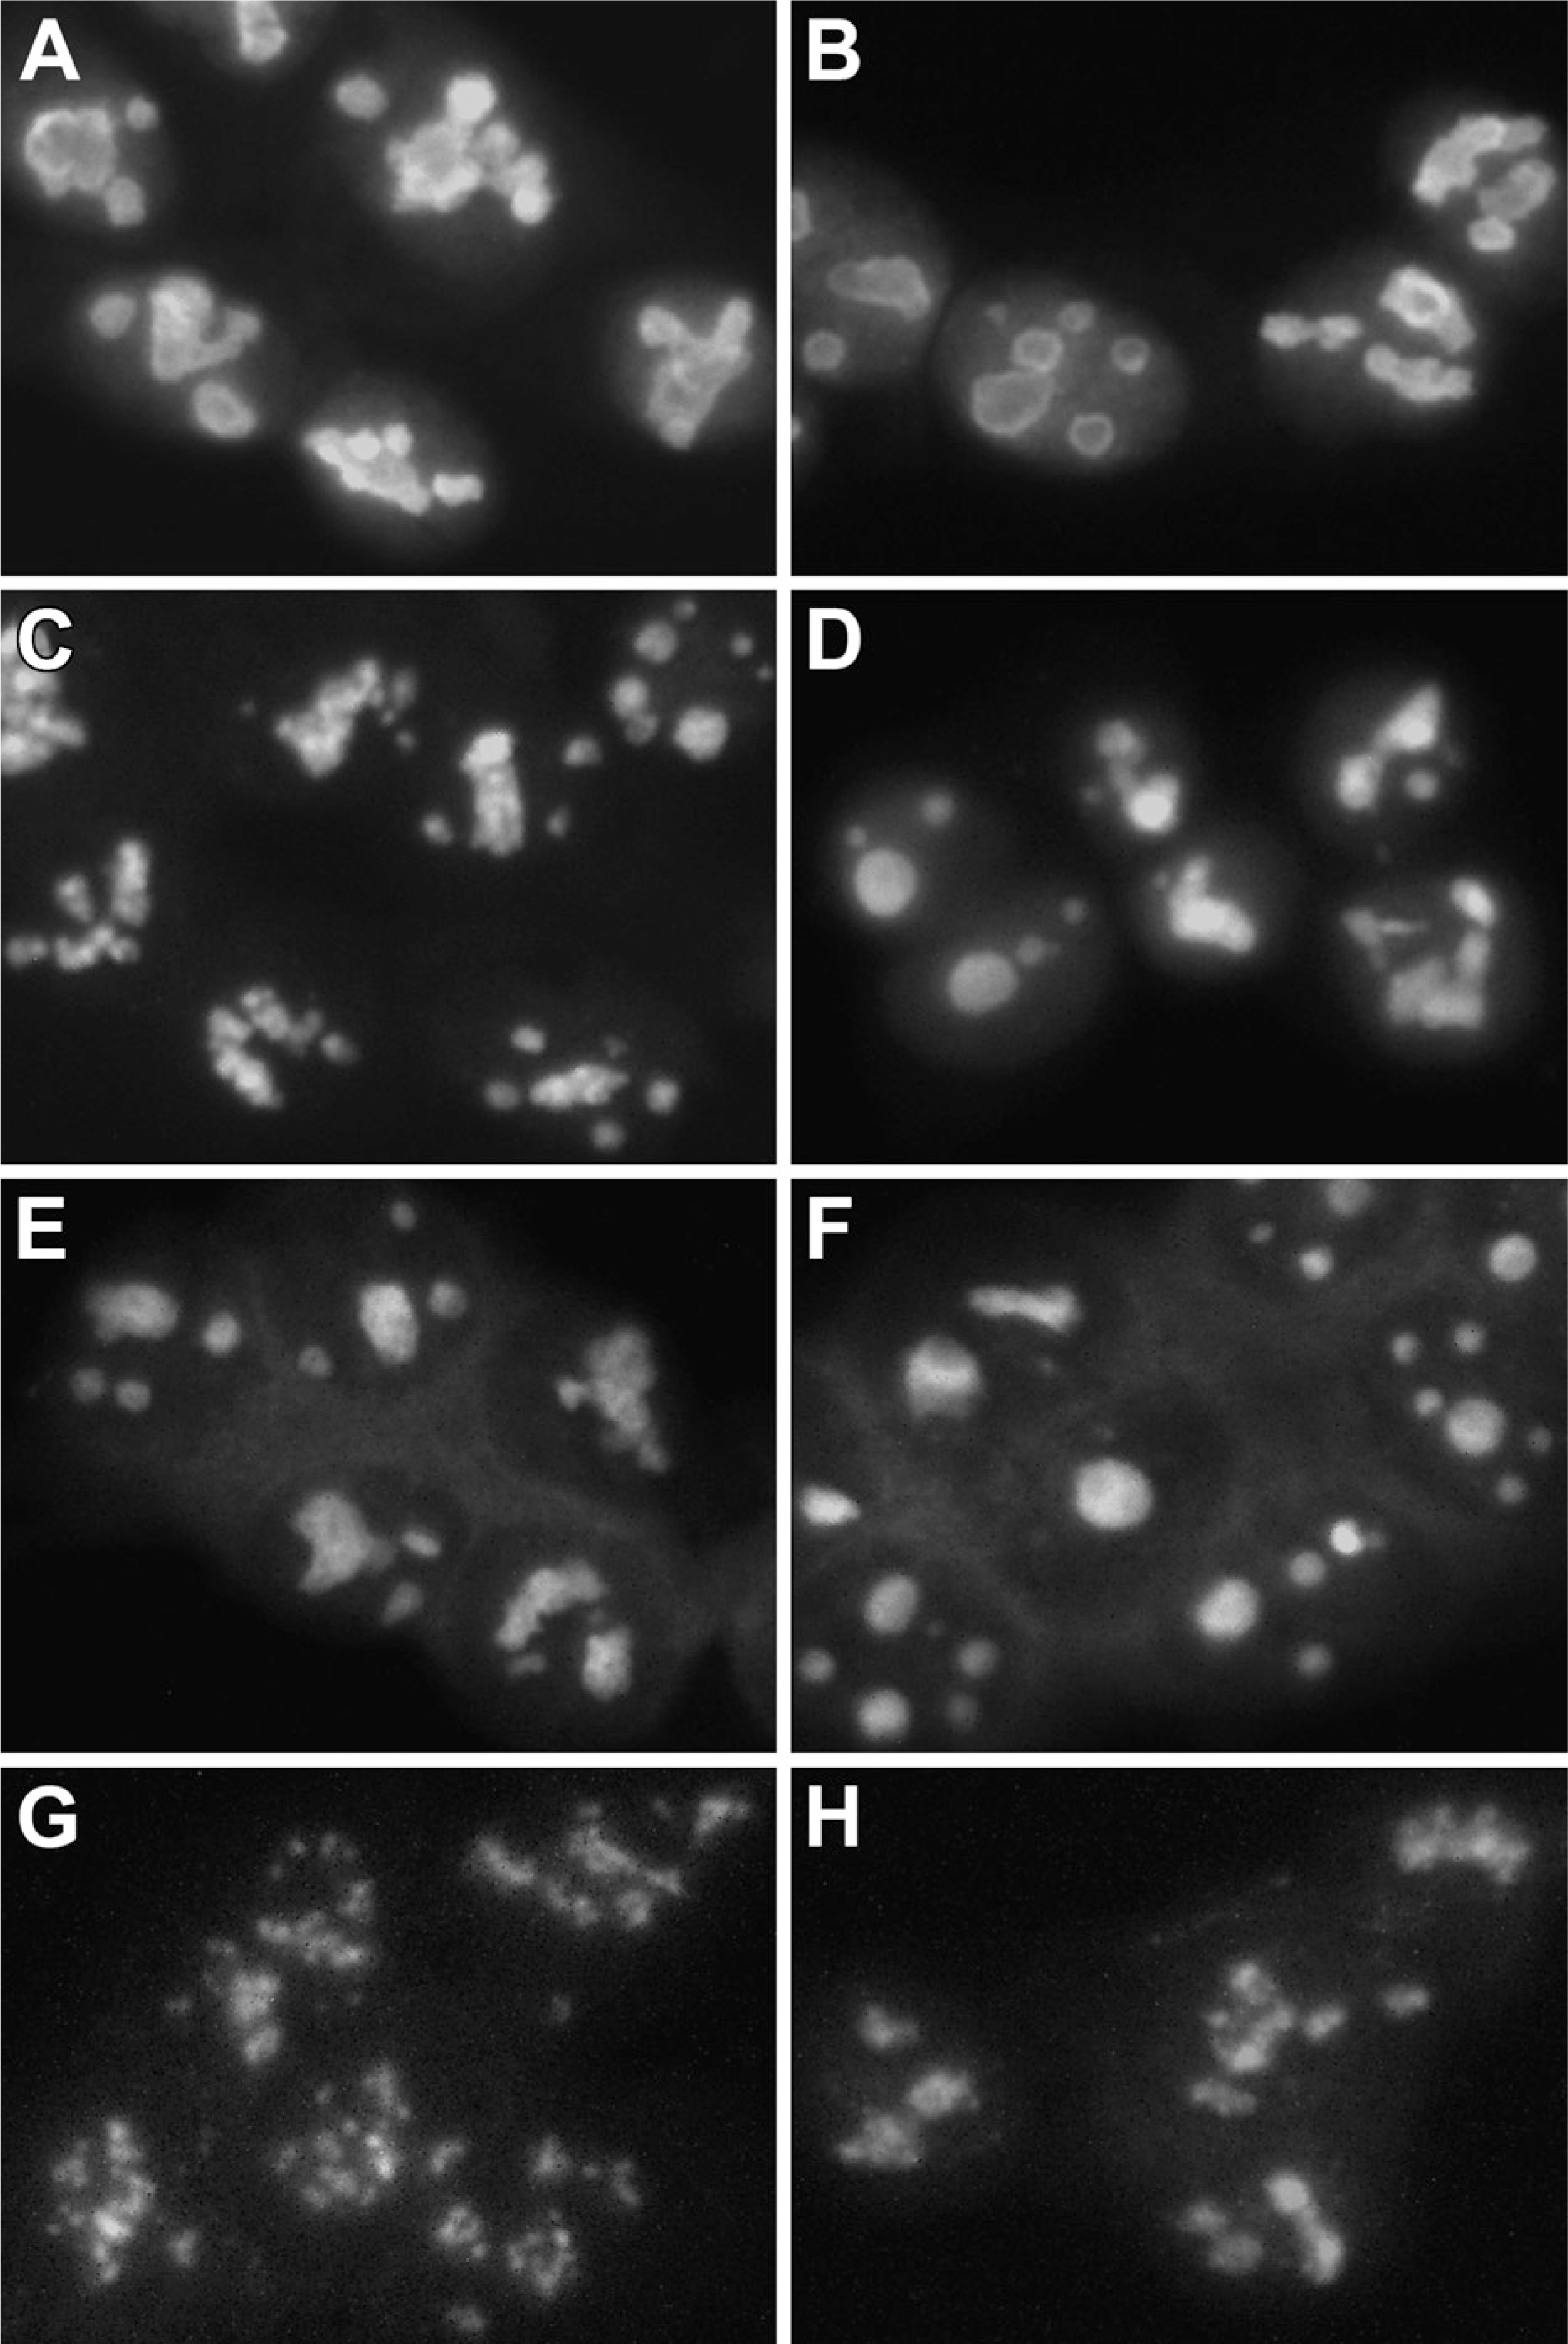
T24 cells were grown on polylysine-coated coverslips and overlain with the vitamin combination or sham treated as described previously. Vitamins were removed at 1-hr intervals from 1 to 4 hr, the cells were washed with PBS, and nucleolar proteins (RH-II/Gu, B23, p120, and fibrillarin) were labeled by indirect immuno-fluorescence. No difference was observed in the staining patterns of the B23 (Figures 7A and 7B), RH-II/Gu (Figures 7C and 7D), or p120 (Figures 7E and 7F) nucleolar proteins in the sham-treated cells or in the cells exposed to the vitamin combination. However, exposure to the vitamin combination altered the fibrillarin staining pattern from one that matched with the fibrillar centers and adjacent regions to a more homogeneous staining of the entire nucleolus (Figures 7G and 7H).
In a second set of experiments, T24 cells were sham treated (Figure 8A) or exposed to VC alone (Figure 8B), VK3 alone (Figure 8C), or to Apatone (Figure 8D). Vitamins were removed at 1-hr intervals from 1 to 4 hr, the cells were washed with PBS, and fibrillarin was labeled by indirect immunofluorescence. Treatment with Apatone resulted in the altered fibrillarin pattern described above, whereas treatment with the individual vitamins resulted in only a very slight alteration in the fibrillarin staining pattern.
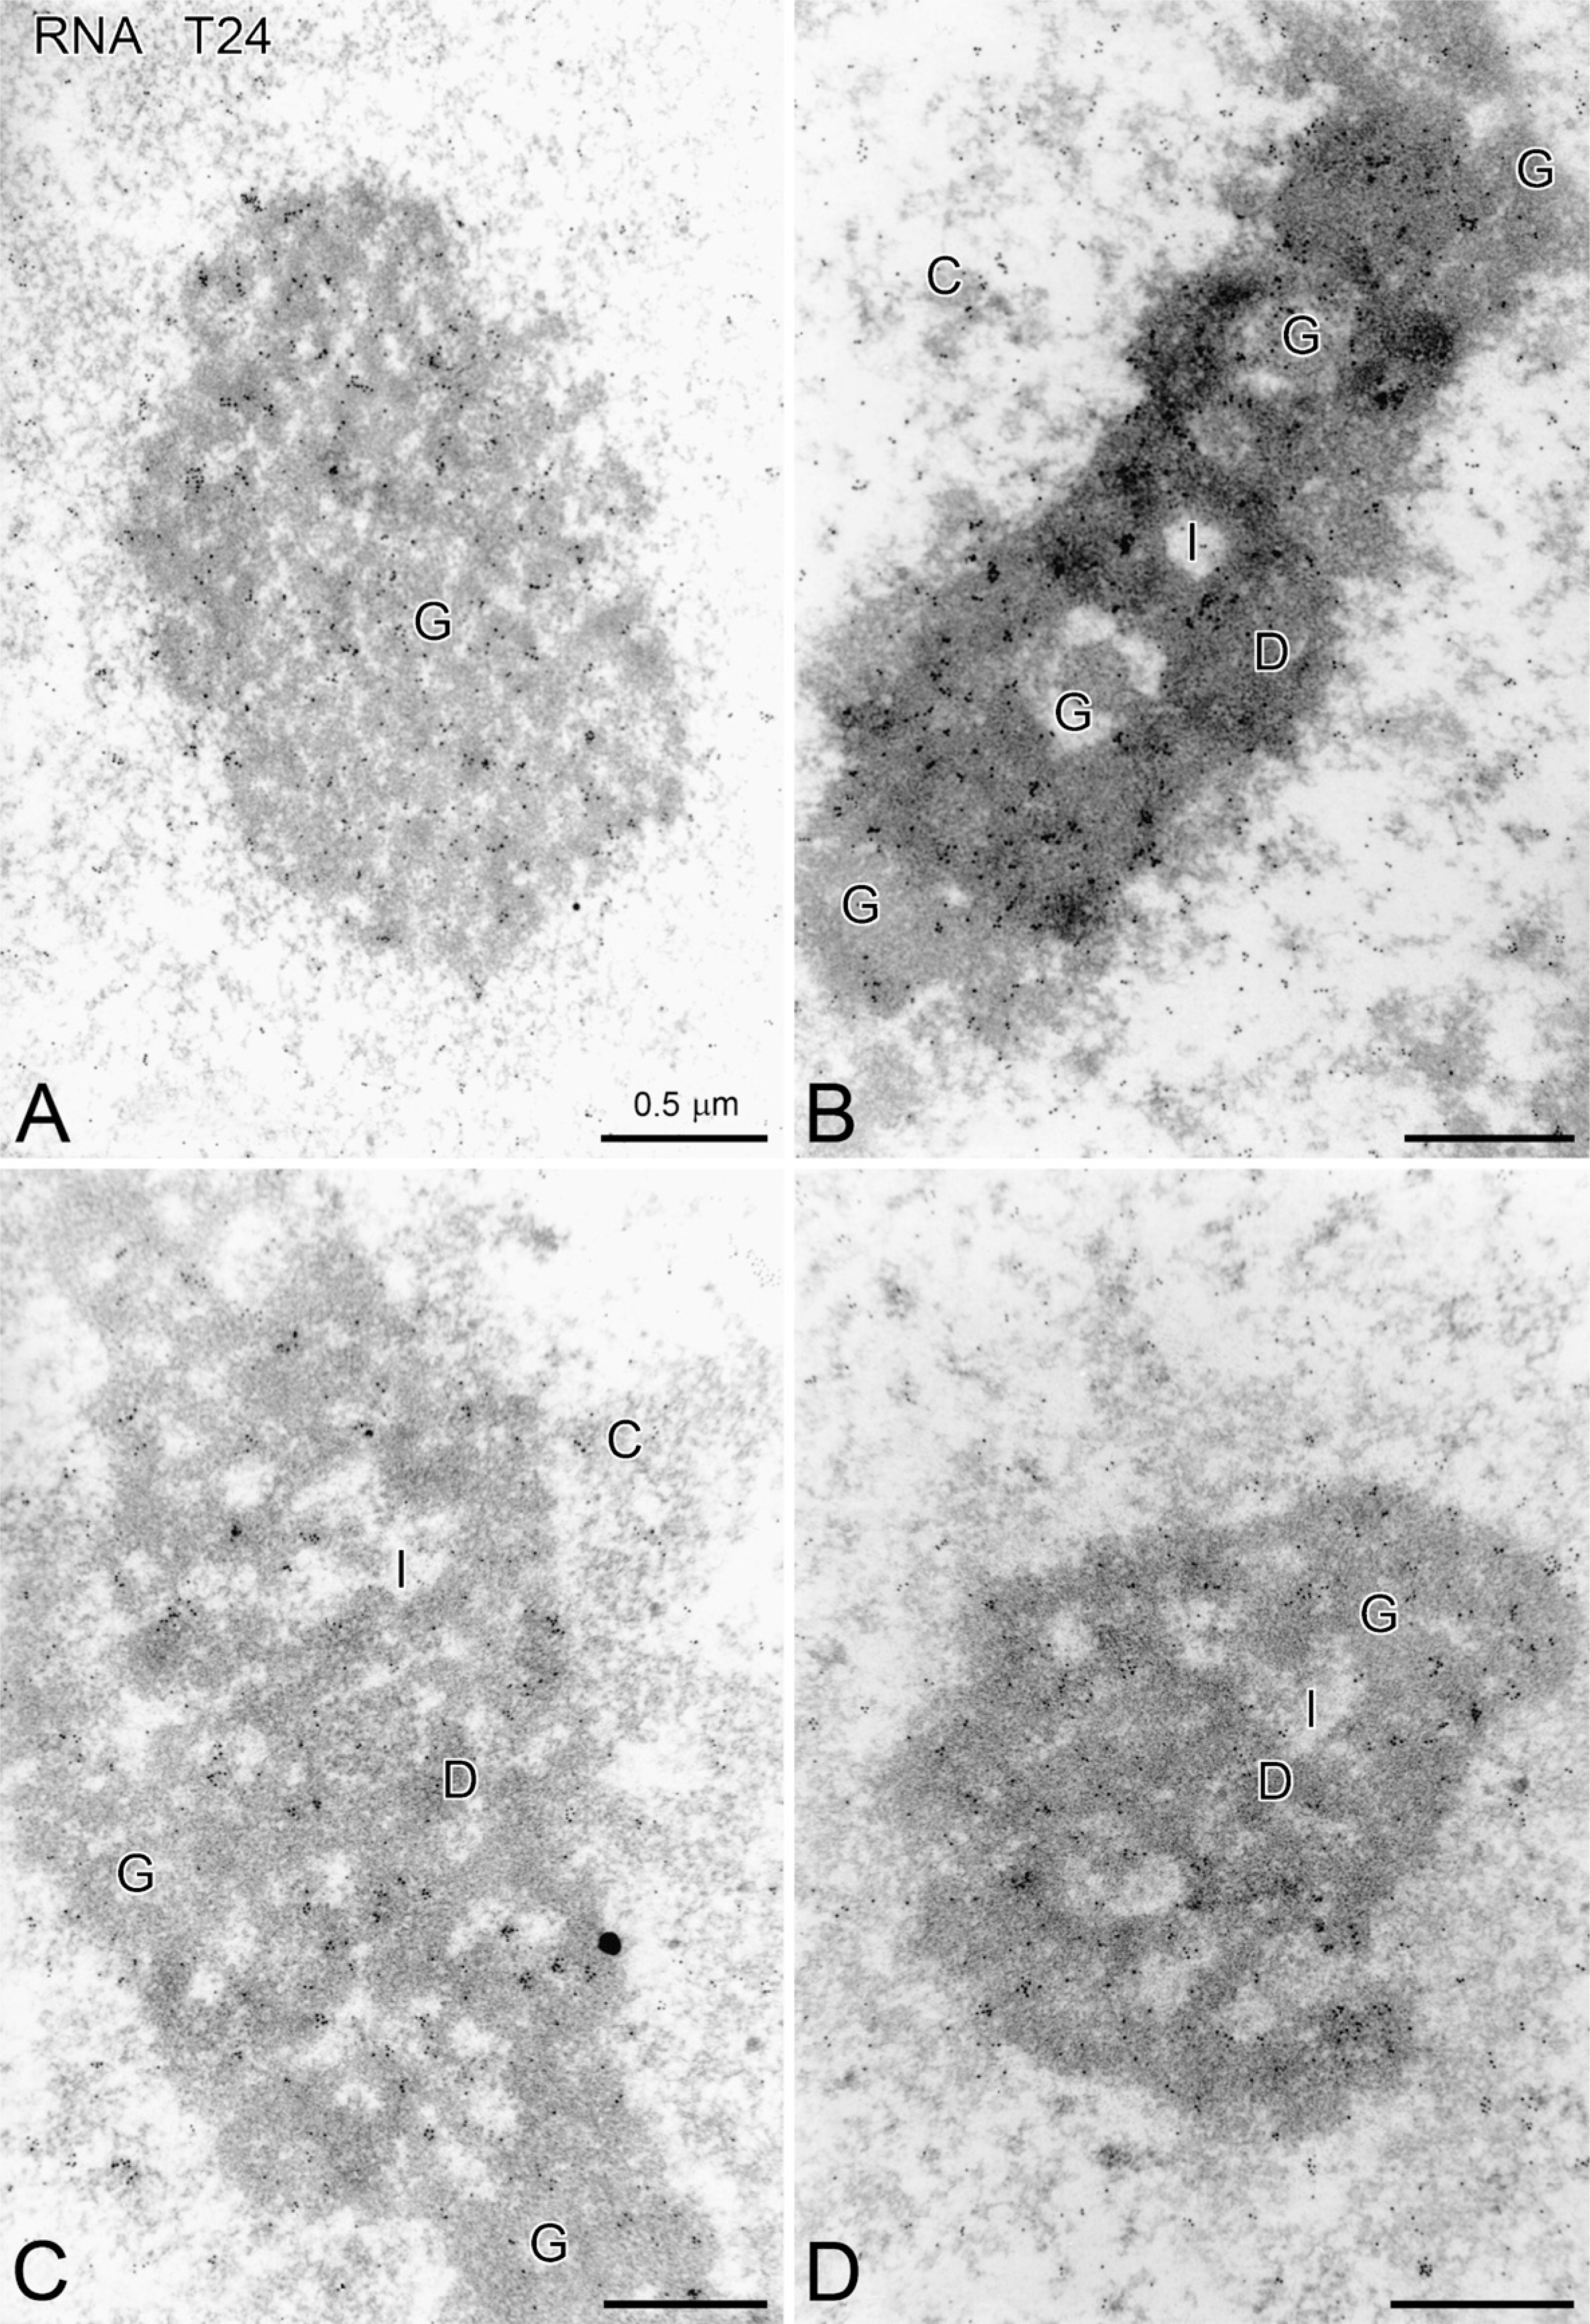
Distribution of RNA immunogold (diameter = 5 nm) within the nucleoli of T24 bladder carcinoma cells treated for 4 hr with PBS (sham), menadione, ascorbate, or Apatone.
Fibrillarin is known to be associated with both rRNA and rDNA. Treatment of cells with RNase A partially released fibrillarin from the dense fibrillar and fibrillar centers of the nucleoli, whereas DNase I treatment completely released the fibrillarin (Ochs et al. 1985). Because Apatone treatment has been shown to lead to the serial reactivation of DNase I and DNase II in a human prostate cancer cell line (Taper et al. 2001), a third set of experiments was designed to evaluate the role of DNase I in fibrillarin translocation. T24 bladder carcinoma cells were sham treated with PBS (Figures 9A and 9B) or PBS containing 1000 U/ml of DNase I for 1 hr. Subsequently, the nuclei were either stained with 4',6-diamidino-2-phenylindole (Figures 9A and 9C) or for fibrillarin by indirect immunofluorescent labeling (Figures 9B and 9D). As was the case for Apatone treatement, DNase I treatment altered the fibrillarin staining pattern from one that matched with the fibril-lar centers and adjacent regions to a more-homogeneous staining of the entire nucleolus.
T24 bladder carcinoma cells were treated for 4 hr with PBS
Discussion
When T24 human bladder carcinoma cells were exposed to VC, VK3, or Apatone, the CD50 value for the Apatone-treated cells was 5-to 6-fold lower than the CD50 values for the individual vitamin treatments (Figure 1). Flow cytometric analysis of T24 cells following a 1-hr Apatone exposure (Figure 2; Table 1) revealed two populations of cells. The first population (89%) was growth arrested in late G1 or at the G1/S transition while the second population of cells (11%) was undergoing autoschizis. Because nucleoli have been shown to be exquisitely sensitive to changes in cell status and have been used to determine types of cell death, changes in nucleolar ultrastructure were monitored following vitamin treatment. In cells treated with either VC or VK3, nucleoli did not differ substantially from those in control cells (Figure 3). However, following exposure to Apatone, two populations of cells were observed with respect to these nucleolar changes. The predominant population (87%) exhibited a lesser degree of nucleolar perturbation than the smaller population (13%) (Jamison et al. 2004). These results suggested that the predominant nucleolar population was growth arrested, while the smaller population was undergoing autoschizis. The nucleoli of cells undergoing autoschizis were small, compact, and almost ring-shaped, and their nucleolar interstices disappeared (Figure 4). Such nucleoli were composed of enlarged fibrillar centers with clusters of the intranucleolar chromatin, which formed a distinct shell around the nucleolar body. The perinucleolar chromatin consisted of large chromatin clumps that were occasionally almost the same size as the nucleolar body. DNA labeling of Apatone-treated T24 cells was predominantly on the perinucleolar chromatin (Figure 5) and a small amount of label was detected in the peripheral area of the fibrillar center, whereas RNA immunolabeling was found at the boundary between the granular and fibrillar components in both control and vitamin-treated cells (Figure 6). These results suggested that vitamin treatment affects rDNA, but not rRNA.
T24 bladder carcinoma cells were treated for 4 hr with PBS
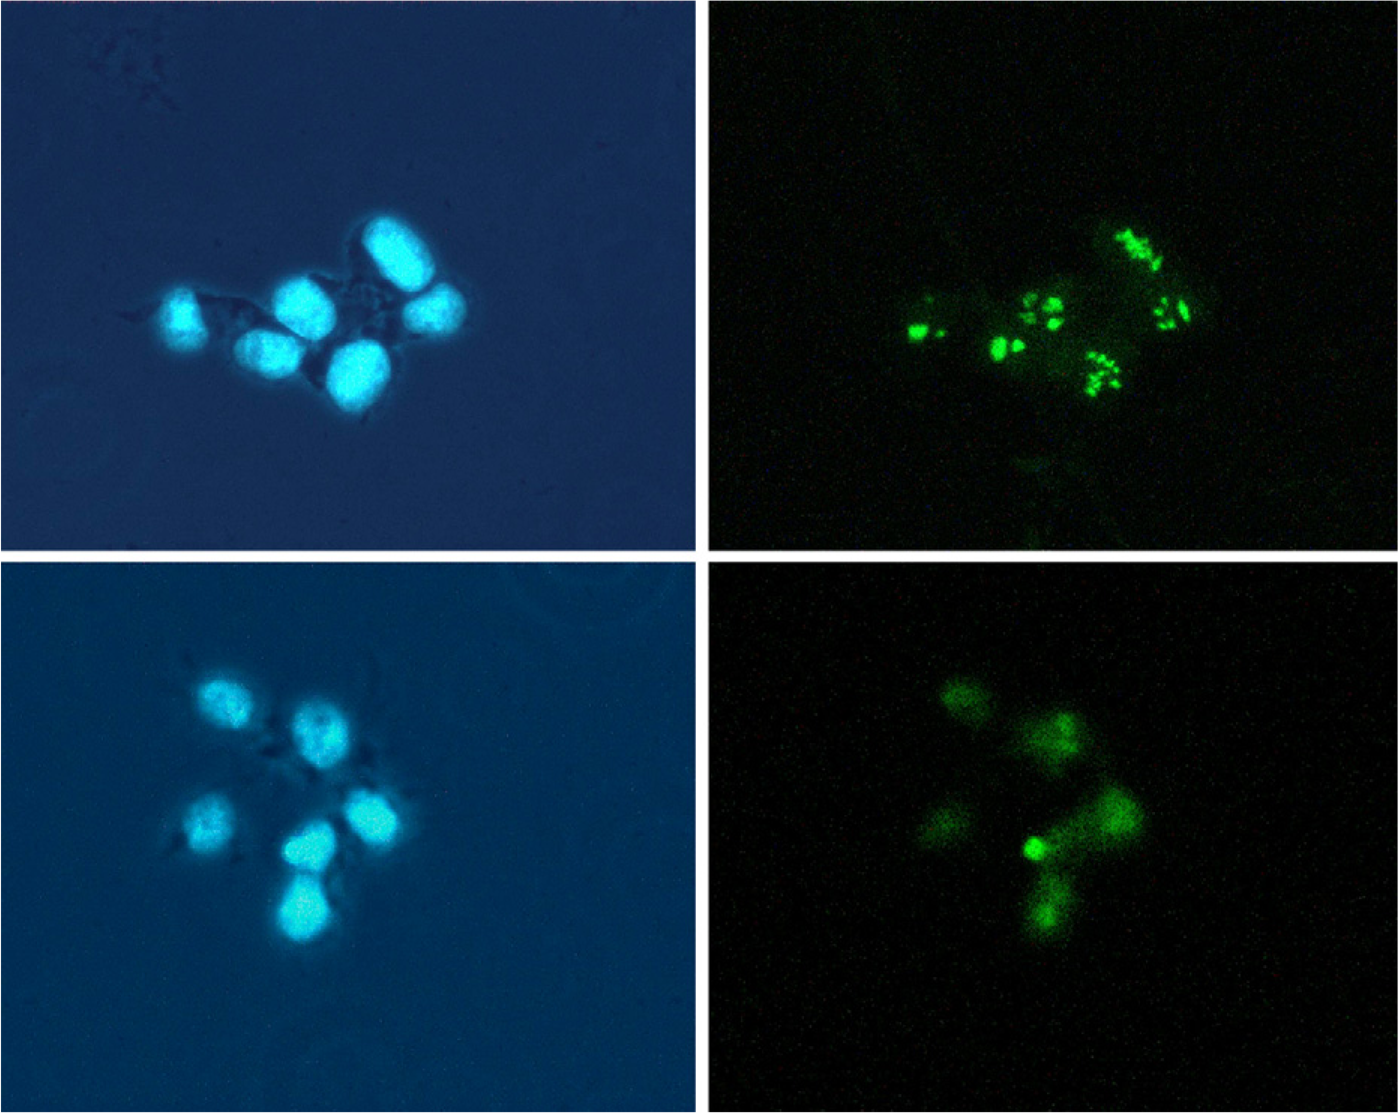
T24 bladder carcinoma cells were treated with PBS (top panels) or PBS containing 1000 U/ml of DNase I (bottompanels). The nuclei were stained with 4',6-diamidino-2-phenylindole (left panels), or the localization of fibrillarin was determined by indirect immunofluorescent labeling (right panels). DNase I treatment produced a relocalization of fibrillarin that closely resembled that induced by Apatone treatment.
The results of a number of studies demonstrated that treatment of tumor cells with many cytotoxic and apoptosis-inducing agents not only induced a number of ultrastructural changes, but also led to the trans-location of a number of nucleolar proteins (B23 and RH-II/Gu) from the nucleoli to the nucleoplasm (Yung et al. 1985, 1990; Chan 1992). However, a number of other nucleolar proteins, including p120 and fibrillarin, did not translocate as a result of these treatments (Yung et al. 1990). In the current study, Apatone treatment did not result in the translocation of any nucleolar protein to the nucleoplasm. However, there was a redistribution of fibrillarin from the nucleolar fibrillar centers and adjacent regions to the whole nucleolar body (Figure 7), and this redistribution was more pronounced with Apatone than with either vitamin alone (Figure 8). Because fibrillarin is associated with rDNA as well as rRNA and is completely released by DNase I treatment (Ochs et al. 1985), and because Apatone is known to reactivate DNase I (Taper et al. 2001), the role of DNase I in the release of fibrillarin was determined by treating the T24 cells with DNase I. The fact that DNase I treatment produced a relocalization of fibrillarin that closely resembled that induced by Apatone suggested that DNase I activation was involved in the process (Figure 9).
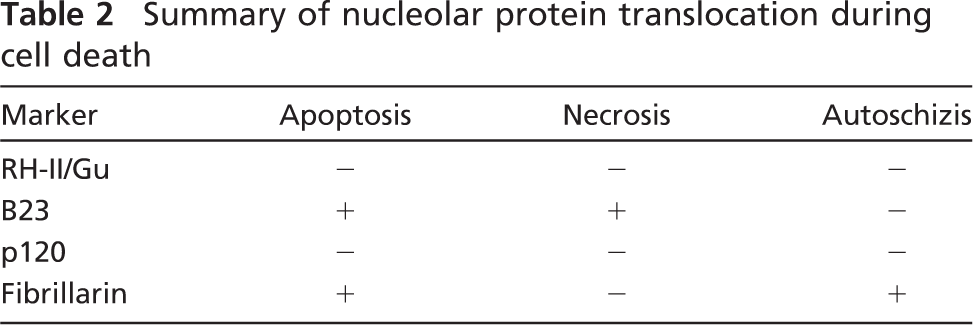
Although the morphological characteristics of apoptosis and necrosis appear distinct, the overlap of the cell death pathways can complicate the determination of the type of cell death occurring during a particular treatment regimen (Shah et al. 1996; Dynlacht et al. 1999). The results of recent studies suggested that different sets of nucleolar proteins translocated from the nucleolus to the nucleoplasm during necrosis and apoptosis, and this differential translocation may serve as an additional set of markers for differentiating between the two forms of cell death (Earnshaw 1995; Zweyer et al. 1995, 1997; Biggiogera et al. 1999; Martelli et al. 2000; Bortul et al. 2001). For example, in the case of ethanol-induced necrosis of HL-60 cells, immunofluorescence staining with antibodies directed against some nuclear proteins showed that the distribution of lamin B1, NuMA, topoisomerase IIa, SC-35, and B23/nucleophosmin changed, whereas C23/nucleolin, UBF, fibrillarin, and RNA polymerase I did not change (Bortul et al. 2001). Likewise, during camptothecin-induced apoptosis of HL-60 cells, there was a redistribution in the spatial distribution of C23/nucleolin, B23/nucleophosmin, and fibrillarin (Martelli et al. 2000). In the current study, when the distribution of a subset of these nucleolar proteins (RH-II/Gu, nucleophosmin/B23, p120, and fibrillarin) was determined before and after Apatone-induced autoschizis of T24 bladder cancer cells, only fibrillarin showed an alteration in the staining pattern from one that matched with the fibrillar centers and adjacent regions to a more homogeneous staining of the entire nucleolus. The changes in RH-II/Gu, nucleophosmin/B23, p120, and fibrillarin distribution during apoptosis, necrosis, and autoschizis are summarized in Table 2. The mechanism(s) responsible for the translocation of nucleolar proteins has/have not been elucidated and may be due to a number of factors, including inhibition of the transcription, processing, and release of rRNA, alterations in the ATP and GTP concentrations in the nucleoli, and changes in the nucleolar substructure that eliminate the binding sites for nucleolar proteins (Busch and Smetana 1970; Chan et al. 1988; Finch et al. 1993, 1995; Wu et al. 1995).
The nucleolus is composed of four major ultrastruc-tural components: (a) a fibrillar component where rRNA genes are transcribed; (b) a granular component composed of preribosomes and ribosomes at different stages of maturation; (c) a fibrillar center(s) or inter-phase nucleolar organizer region; and (d) nucleolar matrix and intranucleolar non-ribosomal chromatin (Schwarzacher and Wachtler 1993; Thiry 1995). Exposure of cells to anti-metabolites or cytotoxic drugs often results in segregation of the cell nucleolus into its components (Farber and Roberts 1971; Simard et al. 1974). During nucleolar segregation, the nucleolus initially forms a compact sphere with a peripherally located, condensed fibrillar portion and a prominent granular portion. Subsequently, segregation of the nucleolar components occurs due to the inhibition of rDNA transcription (Simard et al. 1974; Fakan and Puvion 1980), as well as delayed processing and release of the preribosomes and nascent ribosomes (Fakan and Puvion 1980; Hadjiolov 1985), that result in distinct granular, fibrillar, and amorphous portions (Simard and Bernhard 1966). In the current study, the T24 cells undergoing Apatone-induced autoschizis exhibited segregated nucleoli (Figure 3) and an altered immunogold labeling pattern for the rDNA (Figure 4), but not for the rRNA (Figure 5). These results suggest that Apatone treatment affected rDNA, but not rRNA, and are consistent with results of previous studies that demonstrated that exposure to Apatone resulted in an 86% decrease in the rate of DNA synthesis (Jamison et al. 2004). Furthermore, the prominent granular portions of nucleoli in Apatone-treated T24 cells (Figure 3) suggested that there was a delay in the processing and release of the preribosomes and nascent ribosomes.
Summary of nucleolar protein translocation during cell death
Another possible mechanism responsible for the translocation of nucleolar proteins is changes in the nucleolar substructure that eliminate the binding sites for nucleolar proteins. Fibrillarin is known to be associated with both rRNA and rDNA in the nucleolus. Digestion of cells with RNase A partially releases fibrillarin from the dense fibrillar and fibrillar centers of the nucleolus, whereas DNase I completely releases the fibrillarin (Ochs et al. 1985). In addition, treatment of T24 cells with DNase I resulted in fibrillarin staining patterns resembling that obtained following Apatone treatment. Because Apatone treatment is known to lead to the sequential reactivation of DNase I and DNase II, the altered fibrillarin distribution may be related to at least partial digestion of the rDNA and the subsequent loss of fibrillarin binding sites (Taper 2008). Finally, translocation of nucleolar proteins is sensitive to the ATP and GTP concentration in the nucleolus. For example, GTP has been shown to be required for the localization of nucleophosmin/B23 to the nucleolus (Finch et al. 1993, 1995), whereas ATP has been shown to be required for its translocation from the nucleoli to the nucleoplasm (Wu et al. 1995). The results of a recent study (Verrax et al. 2006) demonstrated that in K562 cells, Apatone treatment resulted in a decrease in cellular ATP levels during the first 4 hr of treatment. These diminished levels of ATP may be responsible for the translocation of the fibrillarin from the nucleolar fibrillar centers and adjacent regions to the whole nucleolar body instead of to the nucleoplasm, as is observed during apoptosis, when ATP levels are high. Although the precise mechanisms responsible for the ultrastructural changes in the T24 cell perikarya, nucleoli, and nucleolar proteins have not been completely elucidated in this study, it appears that these ultrastructural changes may find a use as markers of autoschizic cell death.
In previous studies, electron microscopy has been employed to characterize a new form of cell death in tumor cells, termed autoschizis. In the current study with human bladder carcinoma cells, immunohistochemical techniques have shown nucleolar changes that were not entirely consistent with those observed during necrosis or apoptosis. Although VC and VK3 induced minor nucleolar alterations, treatment with the VC:VK3 combination (Apatone) produced marked alterations in nucleolar structure. In contrast to apoptosis and necrosis, fibrillarin translocated from the fibrillar centers and adjacent regions to a more homogeneous staining of the entire nucleolus, consistent with the percentage of autoschizic cells detected by flow cytometry.
Footnotes
Acknowledgements
This study was supported by funds from The Summa Health System Foundation.
This study is dedicated to the memory of our friend and colleague, H.S. Taper, MD, PhD, recently deceased in Leuven, Belgium.