
Abstract
The amount of amyloid detectable in islets varies, and is not always correlated with degree of β-cell loss. It has been hypothesized that islet amyloid polypeptide (IAPP) aggregation causes β-cell dysfunction. In this study, we investigated the relationship between IAPP expression and glucose homeostasis in pancreatectomized patients. Human pancreatic head tissues were collected from 46 pancreatic tumor patients. We divided the diabetic cases into two groups, patients with higher IAPP–expressing islets (DM-H) and patients with lower IAPP–expressing islets (DM-L), and compared both groups to patients with normal glucose tolerance (NGT). Interestingly, oral glucose tolerance test analyses showed that DM-L patients had significantly higher glucose levels and lower C-peptide levels than DM-H patients. Furthermore, the DM-H group showed a relative β-cell volume similar to that of the NGT group, as well as a significantly higher relative β-cell volume than the DM-L group. The DM-L group was significantly higher than the DM-H group, not only in the rates of replication and apoptosis, but also in the nuclear C/EBP homologous protein and the ratio of oligomer to IAPP. Thus, IAPP expression may not be an indicator of cell death induction. IAPP, including oligomer, may be an important determinant in the fate of islet β-cells. This manuscript contains online supplemental material at http://www.jhc.org. Please visit this article online to view these materials.
T
The extent of islet amyloid deposition in T2DM is highly variable, both in the number of islets affected (prevalence) (<1% to 80%) and in the amount of amyloid per islet (severity) (Maloy et al. 1981). There is no relationship between the duration of diabetes and the degree of islet amyloidosis in humans (Sempoux et al. 2001; Clark and Nilsson 2004). In addition, islet amyloid deposition is not a characteristic feature of diabetes, because it is also found in non-diabetic individuals. No correlations have been noted between the amount of amyloid and reductions in insulin gene expression (Sempoux et al. 2001). A recent study also reported that the number of IAPP-expressing cells was significantly lower in diabetic patients than in non-diabetic patients (Iki and Pour 2007). These findings indicate that cellular deposition of IAPP may not be the precipitating factor for islet dysfunction and diabetes in humans. Moreover, whether IAPP actually increases in the diabetic human pancreas is still unclear.
Morphological analyses of living human islets have been rare, with the exception of autopsy studies. The relationships between IAPP and the degree of hyperglycemia, insulin resistance, and β-cell dysfunction are difficult to establish in humans, because there is no quantifiable clinical feature related to IAPP deposits and pancreatic biopsies are ethically unacceptable (Clark and Nilsson 2004).
We assessed the amounts of IAPP in living human pancreatic tissues from pancreatectomized patients. We found IAPP in non-diabetic pancreata, whereas diabetic pancreata showed variable IAPP expression. We divided diabetic patients into a high-IAPP group (DM-H) and a low-IAPP group (DM-L), according to the extent of IAPP immunoreactivity. We then investigated the relationship between islet pathology and glucose homeostasis in living human islets from pancreatectomized patients.
Materials and Methods
Subjects and Samples
We collected 96 human pancreatic head tissues from patients who had undergone partial or total pancreatectomy for various reasons (Table 1). All pancreatic sections were composed of the intact portions of the pancreatic heads, and pathological lesions were excluded. All tissues were obtained by a single experienced pathologist. Exclusion criteria were type 1 diabetes or potential secondary causes of T2DM, exposure to chronic glucocorticoid treatment, and evidence of autolysis or pancreatitis. In total, we studied 46 cases. The mean age of the patients was 58.4 years (range 32–72 years), and the mean body mass index (BMI) was 23.4 ± 3.0 (16.5–31.7). We obtained approval for this study from the Ethical Committee of Sungkyunkwan University.
Biochemical Tests
Before surgery, a standard 75 g oral glucose tolerance test (OGTT) was performed. After an overnight fast and collection of fasting blood samples, subjects ingested an oral glucose solution (75 g) within 5 min. Blood samples of glucose, insulin, and C-peptide were obtained before the test and at 30, 60, 90, and 120 min thereafter. Twenty-four patients had diabetes, 11 had impaired glucose tolerance (IGT), and 11 had normal glucose tolerance (NGT), according to World Health Organization criteria (Alberti and Zimmet 1998). The next day, we performed a glucagon stimulation test (GST). The C-peptide level was measured at baseline and at 6 min after administration of 1 mg of glucagon.
Several models have been applied for estimating insulin sensitivity and secretion based on plasma glucose and insulin concentrations recorded during the OGTT. For the measurement of first-phase insulin secretion, the insulinogenic index was calculated as follows: insulinogenic index = Δinsulin30/Δglucose30 (Phillips et al. 1994). For the measurement of basal insulin secretion, homeostasis model assessment for β-cell function (HOMA-B) was calculated as follows: HOMA-B = fasting insulin (mU/l) × 20/[fasting glucose (mg/dl)/18-3.5]. We used a homeostasis model for the assessment of insulin resistance (HOMA-IR). HOMA-IR was calculated as follows: HOMA-IR = fasting insulin (mU/l) × fasting glucose (mg/dl)/405 (Matthews et al. 1985). The quantitative insulin sensitivity check index (QUICKI) was used as the index of insulin sensitivity (Katz et al. 2000): QUICKI = 1/[log (I0) + log (G0)], where I0 is fasting insulin (μU/ml) and G0 is fasting glucose (mg/dl).
Clinical characteristics of patients
p<0.05 vs DM-H.
p<0.05 vs NGT and IGT.
BMI, body mass index; NGT, normal glucose tolerance; IGT, impaired glucose tolerance; DM-H, diabetes with high islet amyloid polypeptide (IAPP) immunoreactivity; DM-L, diabetes with low IAPP immunoreactivity; AoV, ampulla of Vater; IPMN, intraductal papillary mucinous neoplasm; GIST, gastrointestinal stromal tumor; CBD, common bile duct. Data are presented as means ± SD.
Immunohistochemistry
Pancreatic tissues were fixed in formaldehyde and embedded in paraffin. Paraffin sections (4-μm-thick) were stained through deparaffinization and rehydration. Antigen retrieval was performed using 0.01 M citrate buffer, pH 6.0, at 100C for 15 min. Sections were incubated in 3% H2O2 in methanol for 30 min to quench endogenous peroxidase activity. Primary antibodies were used as follows: (1) insulin (guinea pig anti-insulin antibody, 1:250; DAKO, Glostrup, Denmark) and IAPP (rabbit anti-IAPP antibody, 1:200; Abcam, Cambridge, MA); (2) insulin and glucagon (rabbit anti-glucagon, 1:500; DAKO); (3) insulin and Ki-67 (mouse anti–Ki-67 antibody, 1:150; DAKO); (4) insulin and terminal deoxynucleotidyl transferase biotin-dUTP nick-end labeling (TUNEL) (ApopTag Plus Peroxidase in situ apoptosis Detection Kit; Chemicon, PA); (5) insulin and rabbit anti-C/EBP homologous protein (anti-CHOP) antibody, 1:150; Santa Cruz Biotechnology, Santa Cruz, CA). Specific CHOP antibody was confirmed using the INS-1 cell and hIAPP-transgenic mouse (Figure S1). Each substrate solution was incubated with secondary antibodies labeled with per-oxidase and alkaline phosphatase (Real Envision Detection System; DAKO).
Morphometric Analysis
IAPP Expression. IAPP-positive areas were identified in 20 islets on four slides chosen at random from each sample. Each of these islets was evaluated to obtain the IAPP area within the islets that was positive for IAPP antibody. For each case, we identified the IAPP-positive area within the insulin-positive islets using an Olympus BX50 inverted microscope (Olympus America; Center Valley, CA) and analyzed it using Image-Pro Plus software (Media Cybernetics; Silver Spring, MD).
Islet Size. To determine the islet size in the hematoxylin and eosin–stained slides, 20 islets composed of more than 20 cells each were estimated (Butler et al. 2003a). We randomly chose a field at x400 objective magnification and examined the islets in that field and those in the immediately adjacent fields until 20 islets had been evaluated. More than three slides were evaluated from each case. Slides were examined using an Olympus BX50 inverted microscope (Olympus America) and Image-Pro Plus software (Media Cybernetics).
Fractional β-cell Area. The insulin-positive areas in 20 islets of four slides from each sample were measured at x400 magnification. Each of these islets was evaluated to obtain the total islet cross-sectional area and β-cell area within the islets positive for insulin. For each case, we determined the mean percentage area positive for insulin within the islets.
Relative β-cell Volume. Because data for pancreas weight were not available, it was not possible to calculate the β-cell mass. Therefore, the ratio of β-cell area to exocrine area (by convention called the relative β-cell volume) was estimated from the fraction of the cross-sectional area (Butler et al. 2003a). Slides immunostained for insulin were analyzed using the Image-Pro Plus system (Media Cybernetics). Each slide was scanned using x40 objective magnification. The relative volume of the β-cells was determined using images from 10 randomly selected fields. The image analysis program is designed to quantify the total tissue area within this region, followed by the insulin-positive area, to generate the ratio of insulin staining to total pancreas area.
Proliferation and Apoptosis. The frequency of β-cell proliferation was calculated by averaging the number of Ki-67–positive β-cells in 50–200 islets from each group. An average of 75 islets were examined in each case. The frequency of β-cell proliferation and β-cell apoptosis was expressed as events per islet. The frequency of β-cell apoptosis was similarly computed by the examination of TUNEL-positive β-cells in the same islets. TUNEL staining, which was occasionally present in debris, was carefully excluded, and only discernible cells with TUNEL-positive nuclei were included.
Nuclear CHOP Expression. The proportion of β-cells with nuclear CHOP was determined by the examination of more than 30 islets from each group. Nuclear CHOP–positive β-cells were expressed as events per islet.
Immunofluorescent Microscopy
Double immunofluorescent staining for oligomers (rabbit anti-amyloid oligomer antibody 1:1000; Chemicon, Pittsburgh, PA) and insulin (guinea pig anti-insulin antibody 1:250; DAKO) was performed on 4-μm-thick paraffin sections of the pancreatic islets. The tissue slides were blocked with 10% normal goat serum for 30 min before treatment with primary antibodies for 2 hr at room temperature. Immunofluorescence was detected with the appropriate secondary antibodies (Alexa Fluor 488 goat anti-rabbit and Alexa Fluor 568 goat anti-rabbit 1:500; Invitrogen, Carlsbad, CA) and the slides were mounted with VECTASHIELD mounting medium with DAPI (Vector; Burlingame, CA). The stained slide images were taken with a Nikon eclipse 80i fluorescence microscope and analyzed using Image-Pro Plus software (Media Cybernetics).
Statistical Analysis
Comparisons among the four groups were performed using one-way ANOVA with least significant difference (LSD) multiple comparisons. If ANOVA was not appropriate, the Kruskal-Wallis test with LSD using ranks was used to detect differences in median values among the groups. The effect of sex was analyzed using Fisher's exact test. Correlation analysis was performed using Pearson's correlation coefficient. Graph data are presented as means ± SEM. p values less than 0.05 were considered statistically significant.
Results
Clinical Characteristics of the Four Groups
We divided the diabetic cases into two groups according to the extent of IAPP immunoreactivity, patients with higher IAPP–expressing islets (DM-H) and patients with lower IAPP–expressing islets (DM-L), and compared them to patients with NGT (Figures 1 and 2). Table 1 shows the characteristics of the subjects examined in this study. The proportion of male patients in the DM-L group was significantly higher than that in the DM-H group (p = 0.021). There were no significant differences among the four groups with respect to age, height, weight, or BMI. The mean HbA1c values in the NGT, IGT, DM-H, and DM-L groups were 4.9%, 5.5%, 6.5%, and 7.0%, respectively. The DM-H group showed significantly higher HbA1c values than the IGT (p = 0.047) and NGT (p <0.001) groups. The DM-L group also showed significantly higher HbA1c values than the IGT (p = 0.006) and NGT (p <0.001) groups. There was no statistically significant difference in the duration of diabetes between the DM-H and DM-L groups. Diagnoses leading to pancreatic surgery included cancer of the ampulla of Vater in fifteen subjects, pancreatic cancer in eleven, intraductal papillary mucinous neoplasm in eight, common bile duct cancer in six, endocrine carcinoma in two, mucinous cystadenoma in one, serous cystadenoma in one, duodenal gastrointestinal stromal tumor in one, and primitive neuroectodermal tumor in one.
OGTT and GST
Plasma concentrations of glucose, insulin, and C-peptide before and after ingestion of oral glucose are shown in Figure 3. The DM-L group showed significantly higher glucose levels at 90 min than the DM-H group (305.8 ± 60.2 mg/dl vs 261.8 ± 40.1 mg/dl, respectively, p = 0.026). Insulin levels at 30 min (p = 0.009), 60 min (p = 0.013), and 120 min (p = 0.036) were higher in the IGT group than in the DM-L group. The DM-H group showed a trend toward higher insulin levels compared with the DM-L group, although the difference was not statistically significant (Figure 3B). C-peptide levels showed a similar pattern: the values at 90 min (4.5 ± 1.6 nM vs 2.9 ± 1.2 nM, respectively, p = 0.024) and 120 min (4.4 ± 1.9 nM vs 2.8 ± 1.3 nM, respectively, p = 0.033) were significantly higher in the DM-H group than in the DM-L group (Figure 3C). Over the course of the entire OGTT, glucose levels were higher and insulin secretion was lower in the DM-L group than in the DM-H group. The GST elicited a more modest increase in the C-peptide response in the DM-L group compared with the NGT (p = 0.025) and IGT (p = 0.003) groups, and the DM-H group showed a more modest increase compared with the IGT group (p = 0.029), although the difference between the DM-H and DM-L groups was not statistically significant (p = 0.319) (Figure 3D).
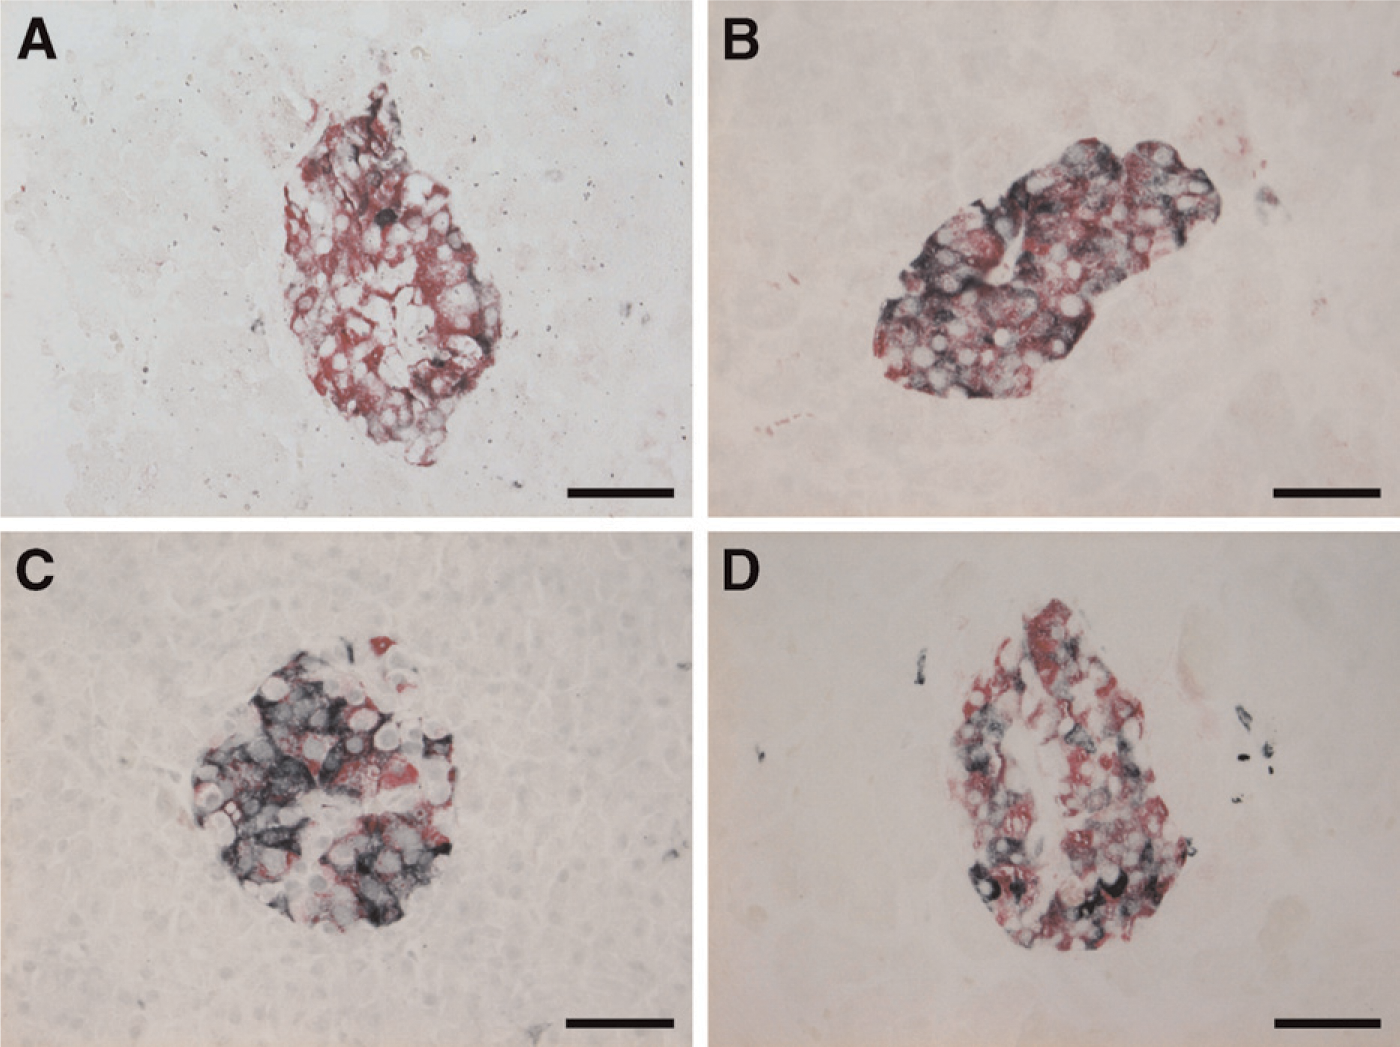
Demonstration of islet amyloid polypeptide– (IAPP; black) and insulin- (red) expressing cells in the islets by immunohistochemistry. Diabetic cases showed two kinds of IAPP immunoreactivity.
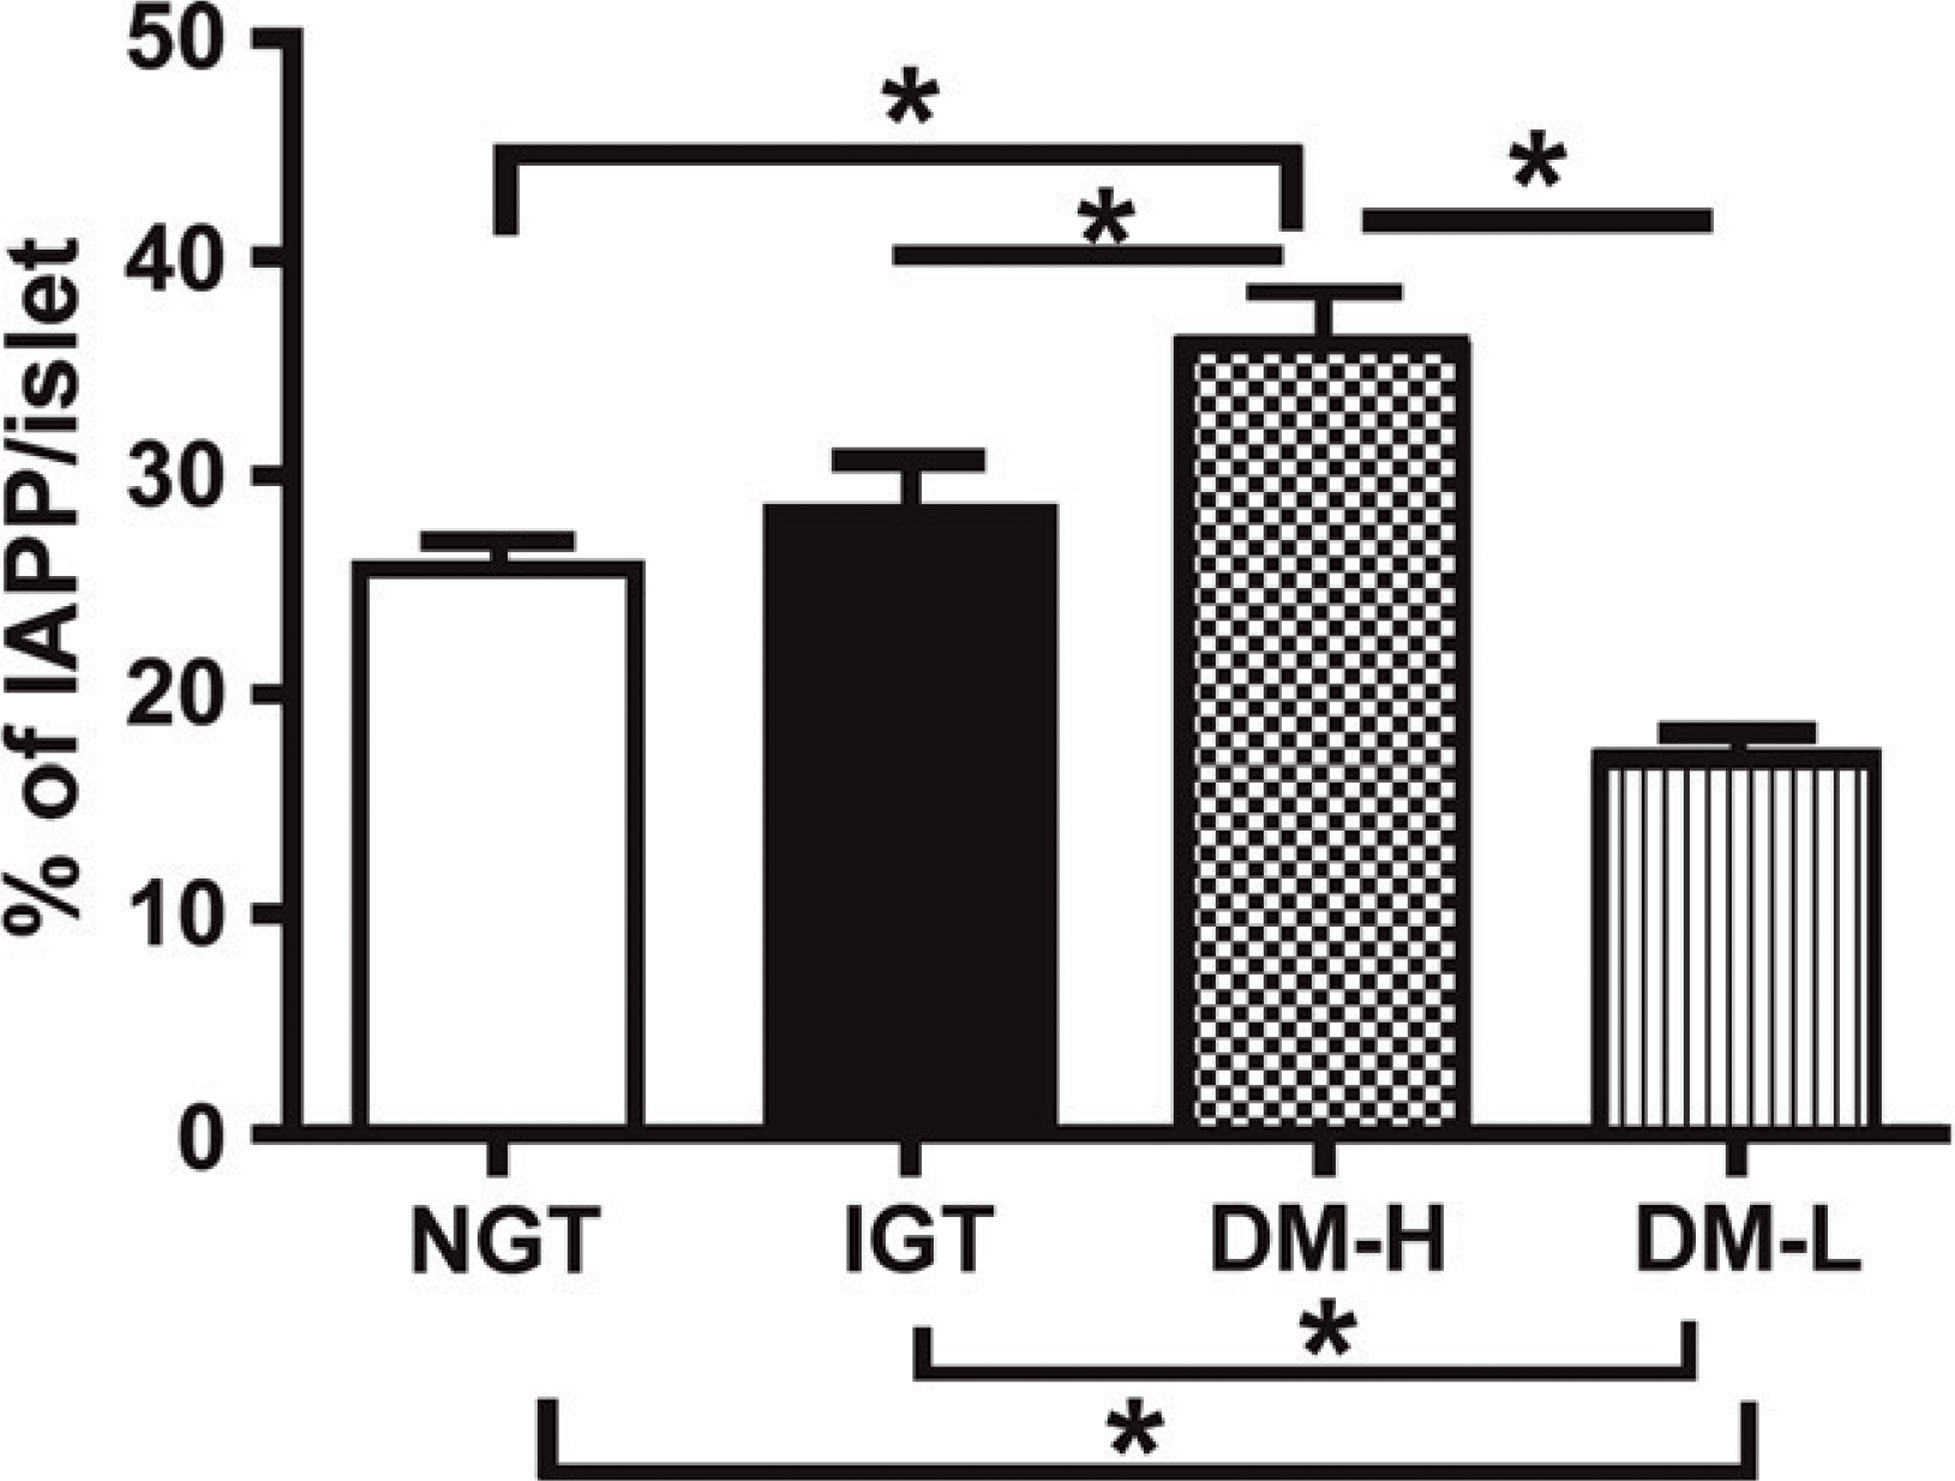
Expression of IAPP in each group. The percentage of IAPP immunoreactivity in the islets as detected by immunohistochemical staining. ∗ p<0.05.
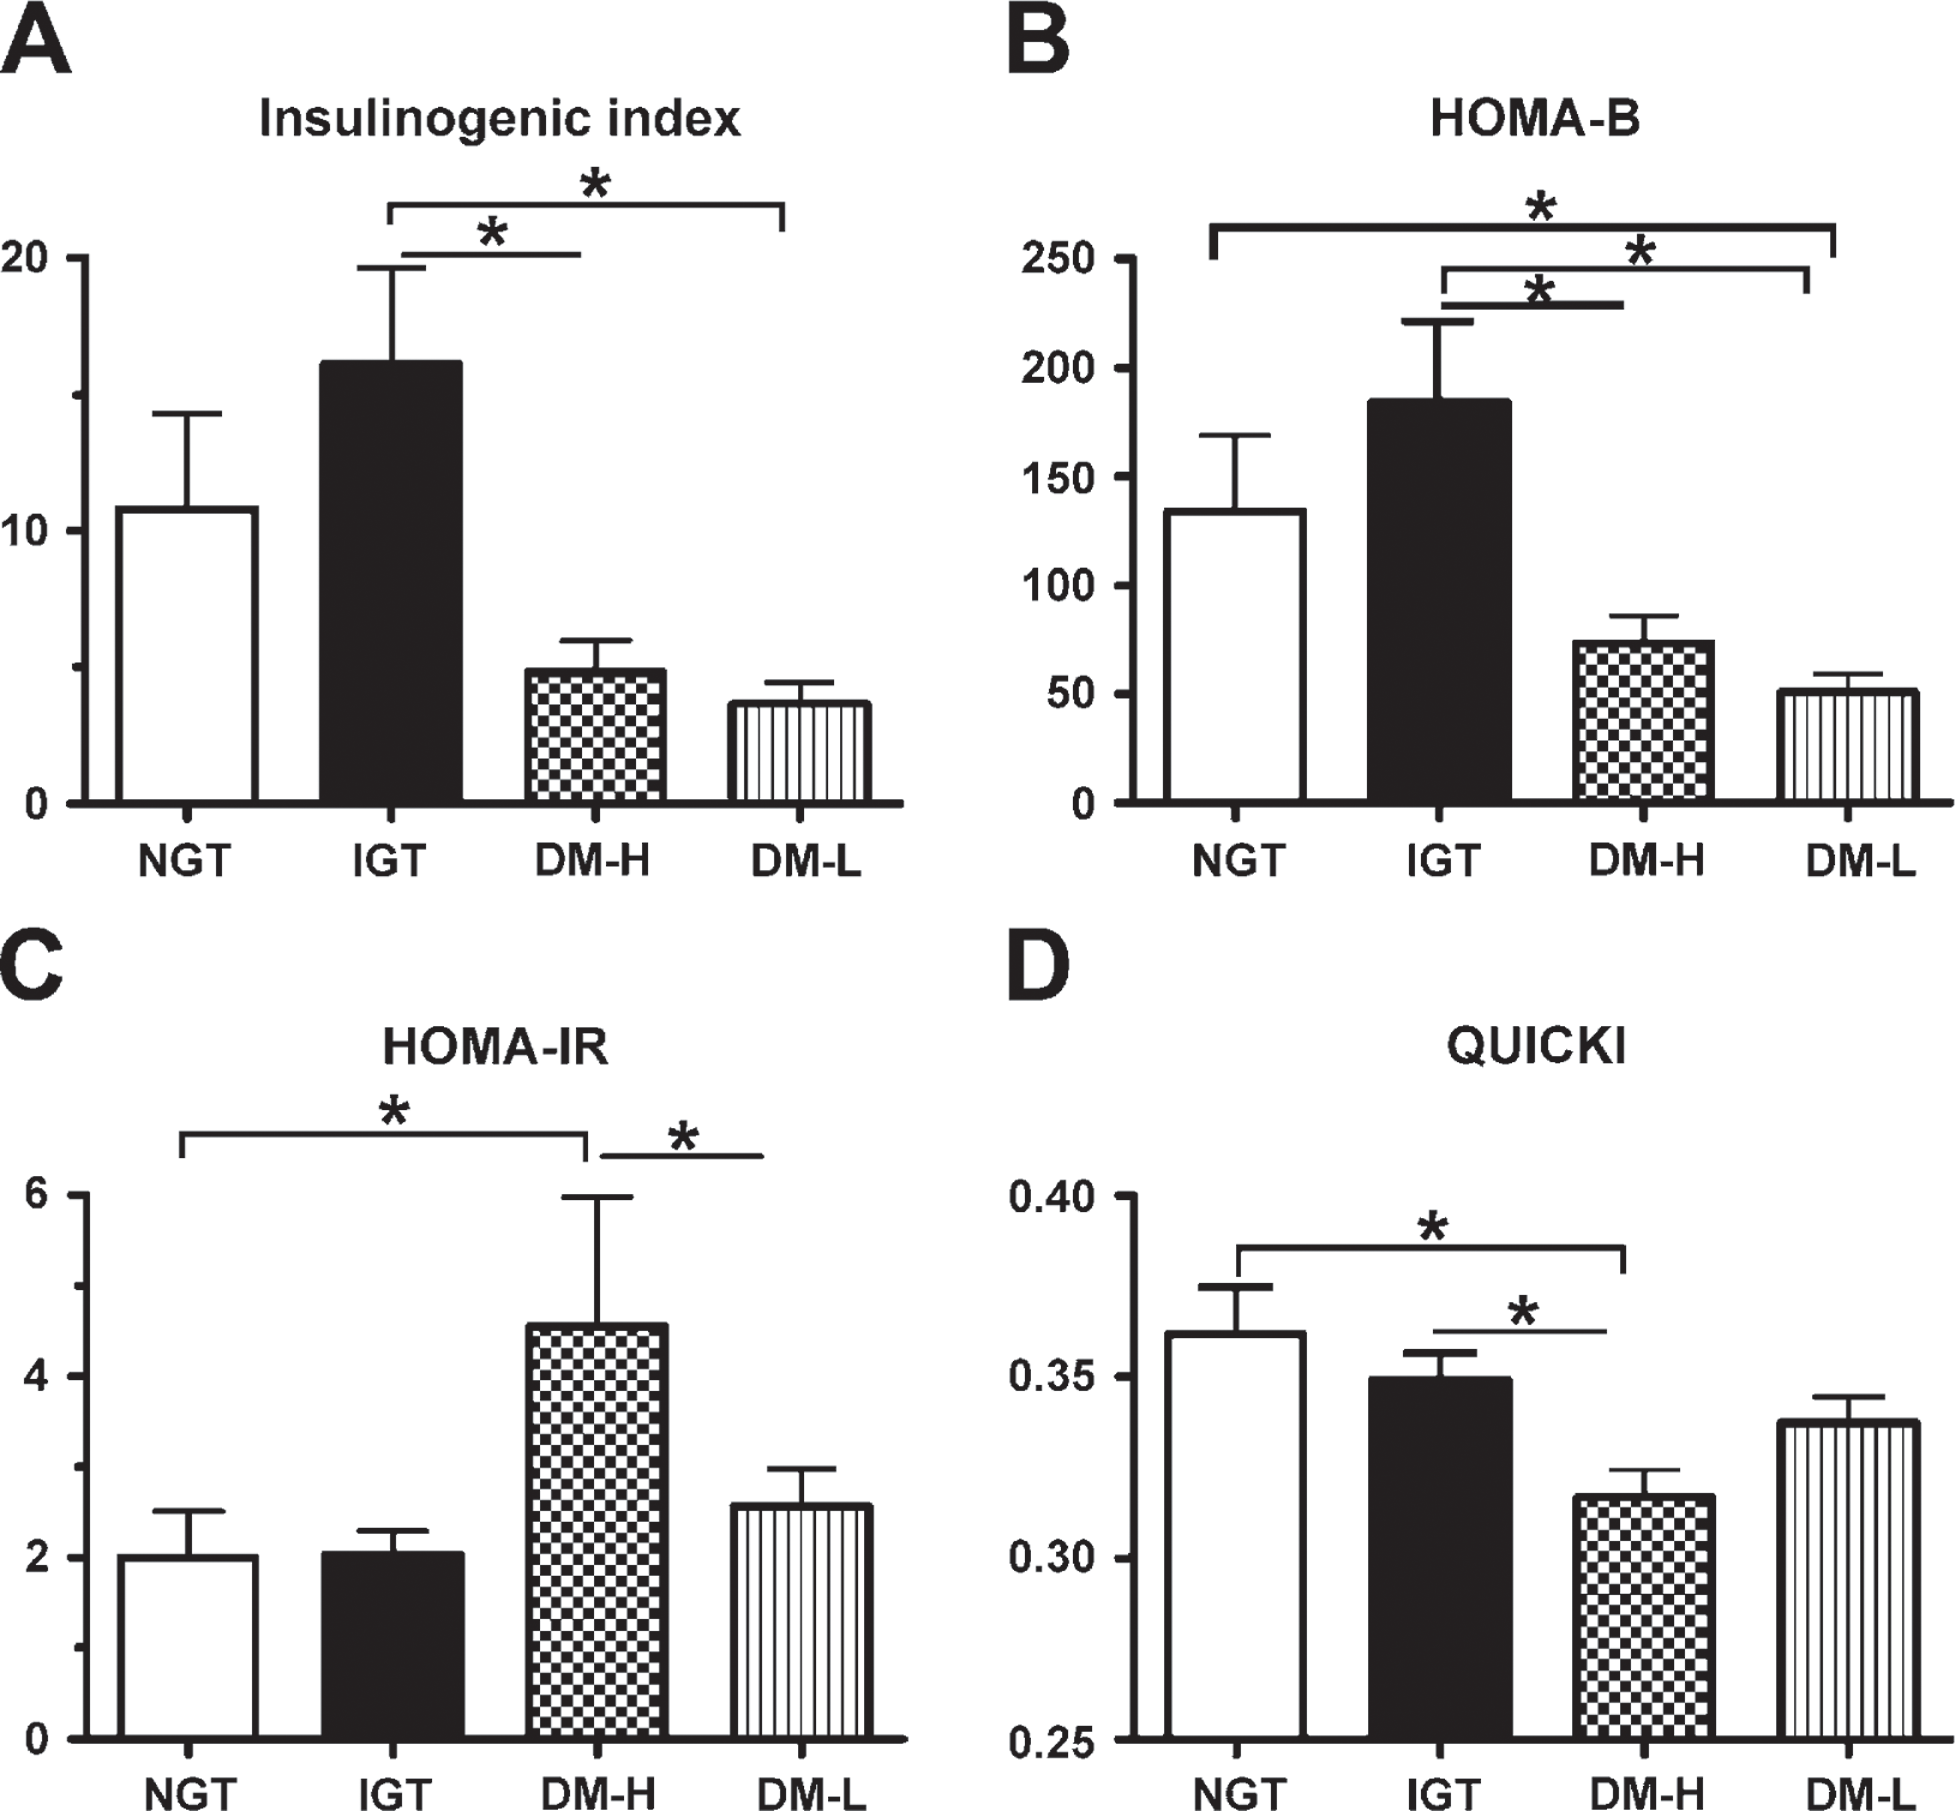
Comparison of the NGT and IGT groups showed no significant differences in the insulinogenic index: HOMA-B, HOMA-IR, or QUICKI. The insulinogenic index in the IGT group was higher than that in the DM-H (16.1 ± 11.6 vs 4.8 ± 3.4, respectively, p = 0.003) and DM-L groups (16.1 ± 11.6 vs 3.6 ± 2.7, respectively, p = 0.001) (Figure 4A). The DM-L group showed lower HOMA-B values compared with the NGT (50.7 ± 30.7 vs 134.3 ± 114.7, respectively, p = 0.001) and IGT groups (50.7 ± 30.7 vs 184.5 ± 119.7, respectively, p,0.001) (Figure 4B). The DM-L group showed a decreasing insulinogenic index (HOMA-B and QUICKI) compared with the DM-H group, although the differences were not significant. However, the DM-H group exhibited a higher HOMA-IR compared with the DM-L group (4.6 ± 4.5 vs 2.6 ± 1.4, respectively, p = 0.044) (Figure 4C). The DM-H group had lower QUICKI values compared with the NGT (0.32 ± 0.02 vs 0.36 ± 0.04, respectively, p = 0.002) and IGT groups (0.32 ± 0.02 vs 0.35 ± 0.03, respectively, p = 0.017) (Figure 4D).
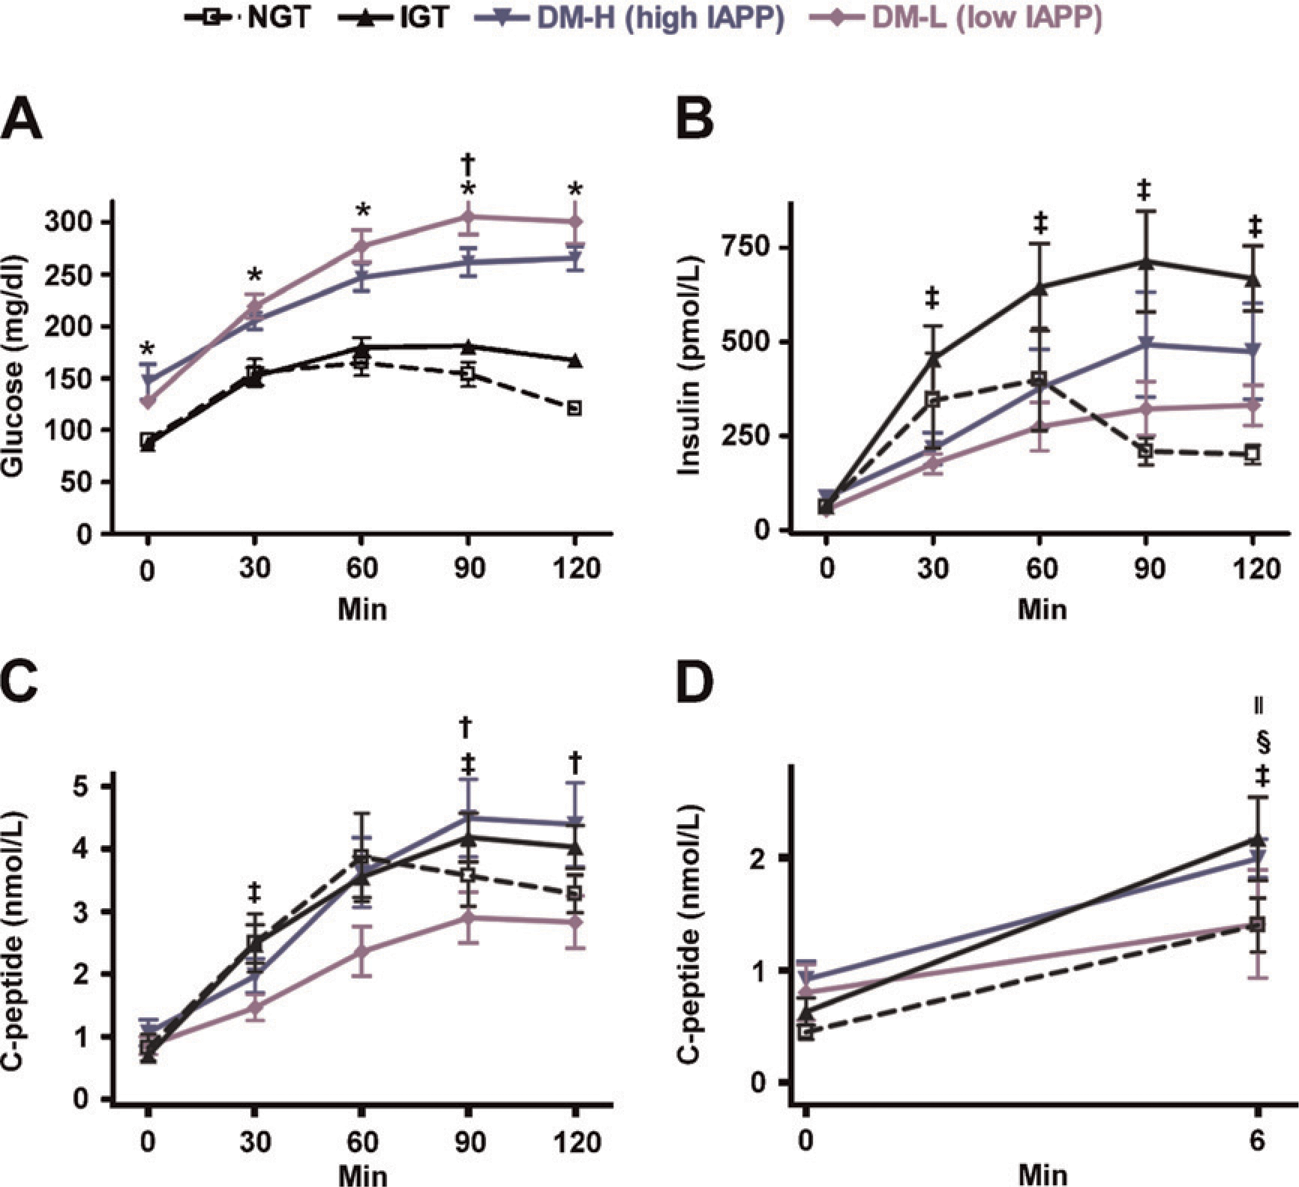
Preoperative oral glucose tolerance test (OGTT) and glucagon stimulation test (GST).
Islet Size, Fractional β-cell Area, and Relative β-cell Volume
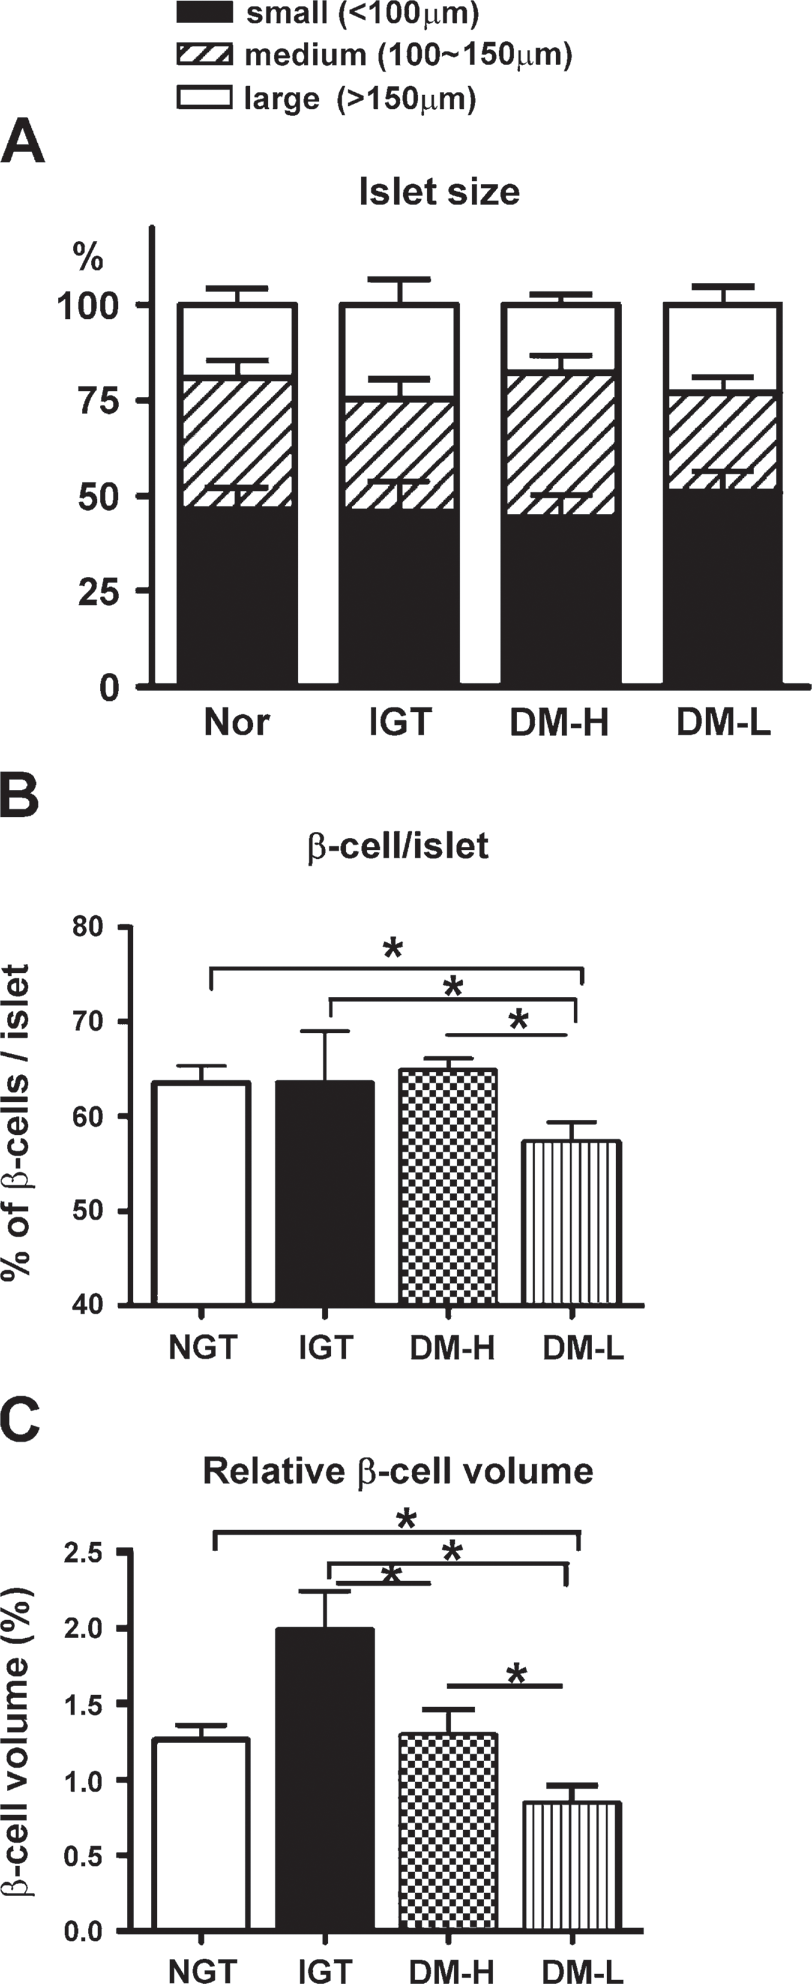
Islet size did not differ significantly among the groups [mean value (range): NGT, 11,437 μm2 (6453–17,105); IGT, 12,824 μm2 (5110–23,808); DM-H, 11,397 μm2 (6194–15,120); DM-L, 11,898 μm2 (7170–18,906)]. We divided the islets into small (<100 μm), medium (100–150 μm), and large (>150 μm) sizes by longest diameter and compared the four groups. The NGT and IGT groups tended to have more small- and medium-sized islets. Compared with the DM-L group, the DM-H group had a higher percentage of medium-sized islets and a lower percentage of large-sized islets, although this difference was not statistically significant (Figure 5A).
The fractional β-cell area was similar in the NGT (64.4 ± 6.0%), IGT (67.4 ± 8.0%), and DM-H groups (64.9 ± 4.3%). However, the DM-L group showed a significantly smaller fractional β-cell area (57.3 ± 7.3%) compared with the other groups (vs NGT, p = 0.041; vs IGT, p = 0.014; vs DM-H, p = 0.009) (Figure 5B). There was a positive correlation between the amount of IAPP and the β-cell volume (r = 0.350, p = 0.017) in all study subjects. The mean relative β-cell volume was 1.3 ± 0.3% in the NGT, 2.0 ± 0.8% in the IGT, 1.3 ± 0.6% in the DM-H, and 0.8 ± 0.4% in the DM-L groups. In the DM-L group, the relative β-cell volume was also significantly lower than that in the other groups (vs NGT, p = 0.004; vs IGT, p <0.001; vs DM-H, p = 0.023) (Figure 5C). Overall, β-cell area and relative β-cell volume in the DM-H group was similar to those in the NGT group. However, the β-cell area and relative β-cell volume in the DM-L group were remarkably decreased compared with those in the DM-H group.
Islet morphology in each group.
Proliferation, Apoptosis, and Nuclear CHOP Expression
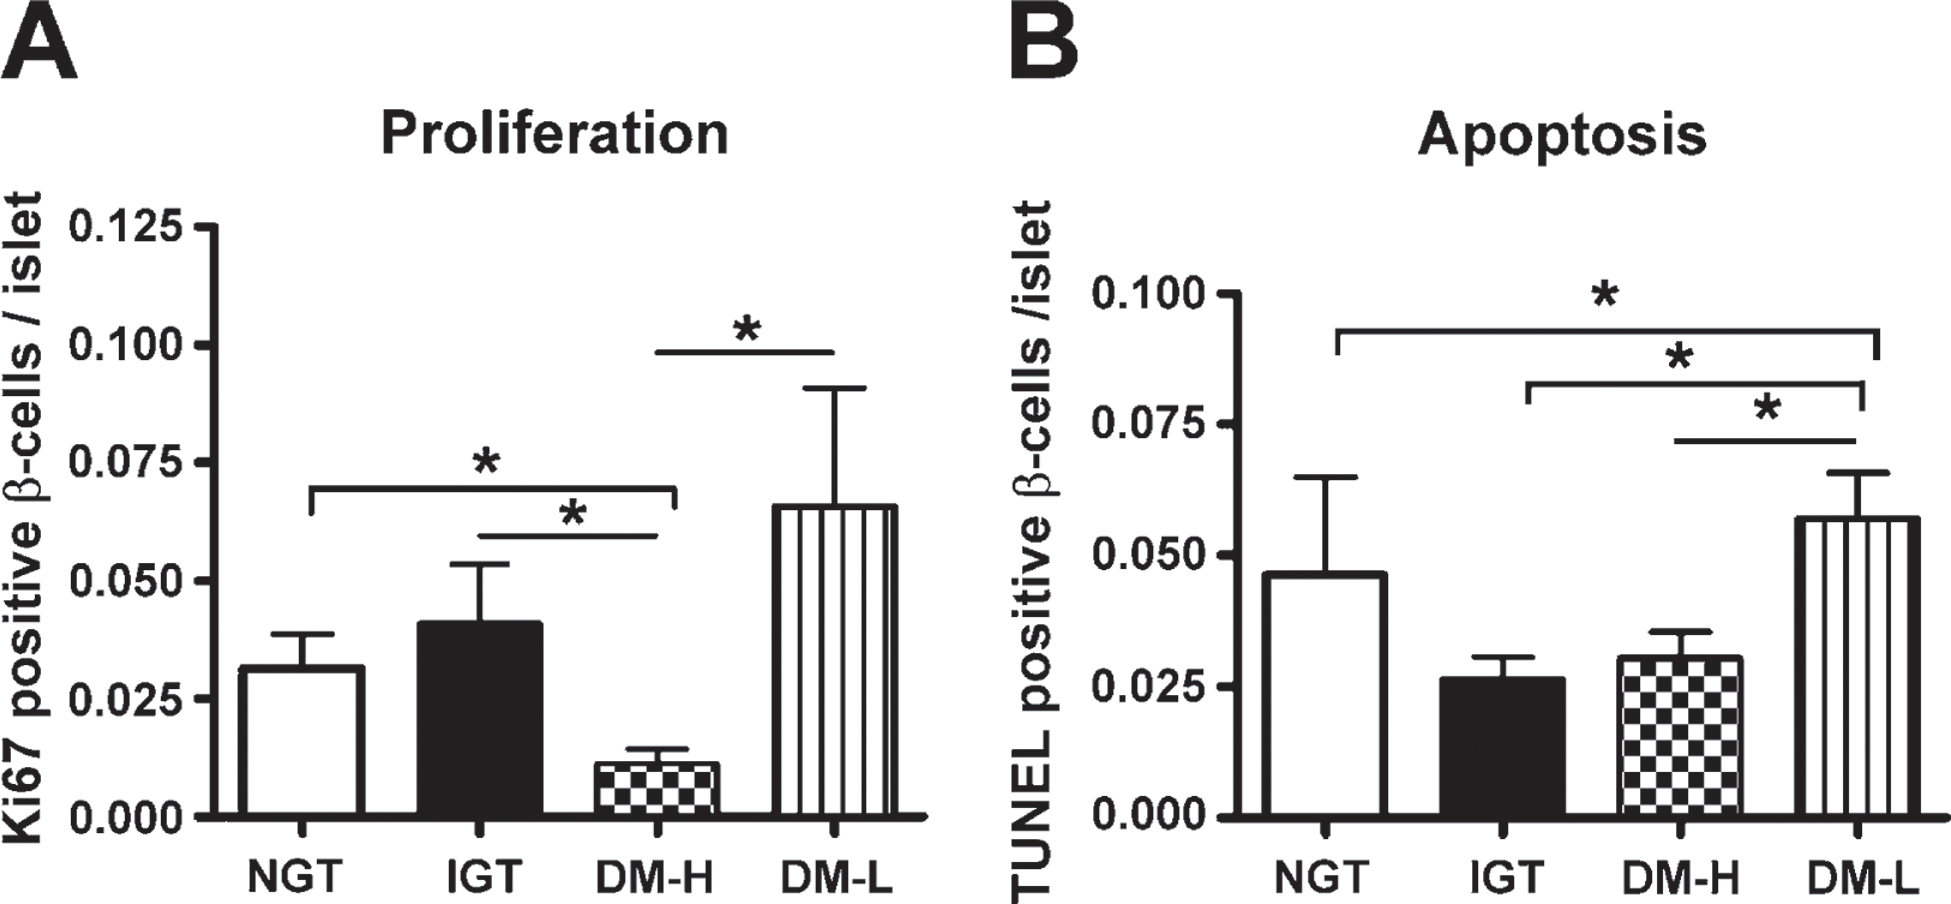
The frequency of proliferation and apoptosis was very low in all cases. The DM-H group showed decreased expression of Ki-67 in β-cells compared with the NGT (0.01 ± 0.01 vs 0.03 ± 0.02, respectively, p = 0.025) and IGT groups (0.01 ± 0.01 vs 0.04 ± 0.04, respectively, p = 0.032). The DM-L group showed a significantly higher frequency of proliferation compared with the DM-H group (0.07 ± 0.10 vs 0.01 ± 0.01, respectively, p = 0.002) (Figure 6A). The number of TUNEL-positive β-cells per islet was remarkably increased in the DM-L group (0.06 ± 0.10). This increase was statistically significant compared with the other groups (vs NGT, 0.04 ± 0.06, p = 0.013; vs IGT, 0.03 ± 0.01, p = 0.011; vs DM-H, 0.03 ± 0.02, p = 0.028) (Figure 6B). There were no differences in Ki-67 or TUNEL expression in the β-cells of the NGT and IGT groups.
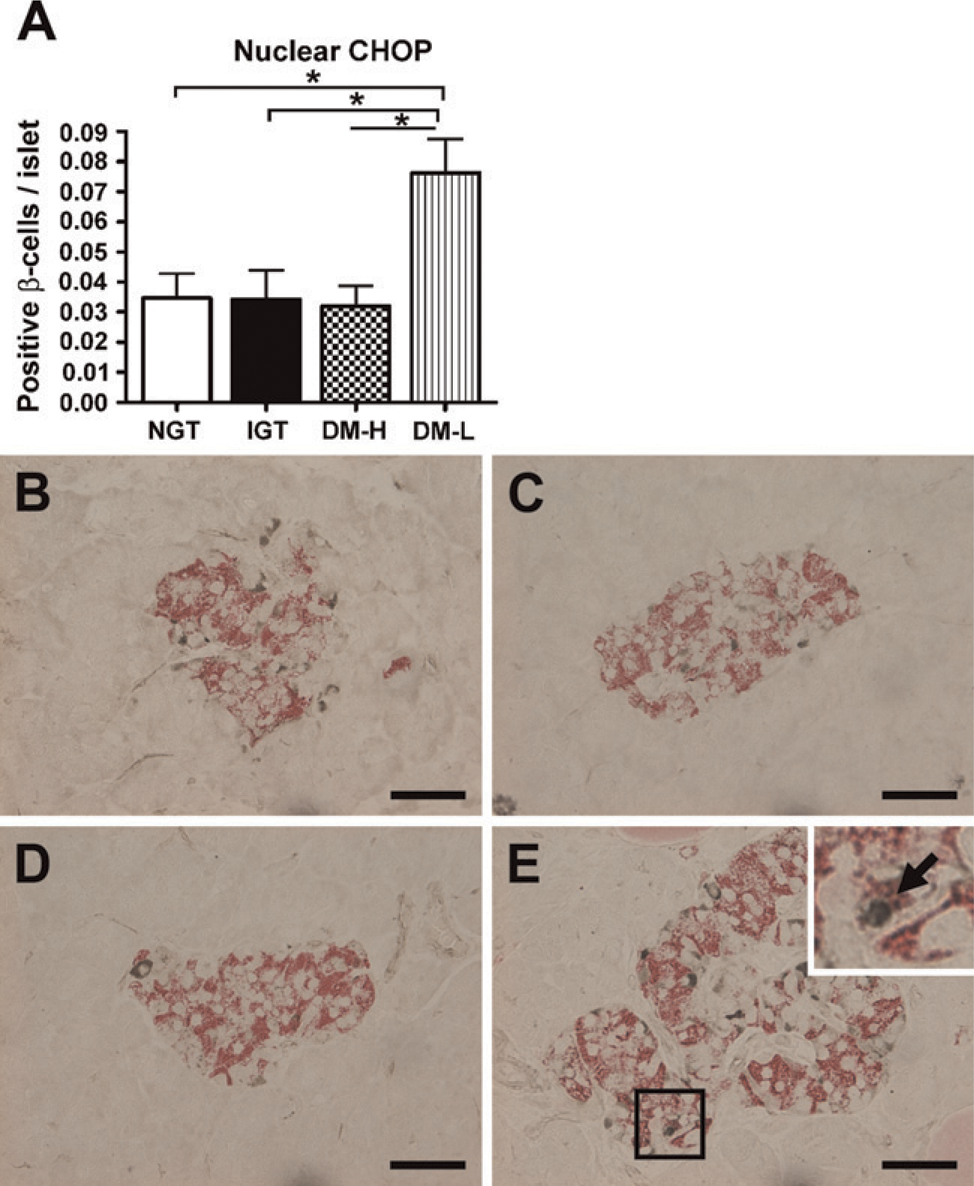
We evaluated nuclear CHOP to identify endoplasmic reticulum (ER) stress–induced apoptosis. The DM-L group showed significantly higher CHOP expression (0.08 ± 0.04) compared with the other groups (vs NGT, 0.03 ± 0.02, p = 0.004; vs IGT, 0.03 ± 0.03, p = 0.003; vs DM-H, 0.03 ± 0.02, p = 0.001) (Figure 7A). As shown in Figure 7E, CHOP was substantially detected in the nuclear fraction of the DM-L group. However, in the NGT, IGT, and DM-H groups, nuclear CHOP staining was rarely seen in the islets (Figures 7B–7D). IAPP showed a negative correlation with apoptosis (r = 20.365, p = 0.016) and CHOP (r = 20.346, p = 0.023) in all four groups.
The rate of β-cell proliferation and apoptosis in each group.
Amyloid Oligomers
Oligomer-specific immunoreactivity in pancreatic islets was rarely found in non-diabetic groups. Oligomer-specific immunoreactivity was confined mostly to insulin-containing β-cells in diabetic groups (Figures 8A and 8B). There was no significant difference in the percentage of oligomer in β-cells between the DM-H and DM-L groups (Figure 8C). However, the ratio of oligomer to IAPP was significantly increased in the DM-L group compared with the DM-H group (p = 0.006) (Figure 8D).
Discussion
We have shown that there are two types of diabetic islets in terms of IAPP immunoreactivity and character: high IAPP–expressing islets (DM-H) and low IAPP–expressing islets (DM-L), compared with non-diabetic islets. The DM-H group showed preserved insulin secretion, a β-cell volume similar to that in the NGT group, and decreased apoptosis, whereas the DM-L group showed remarkably decreased insulin secretion, decreased β-cell volume, and increased apoptosis. IAPP deposits were also found in the islets in the NGT and IGT groups. Overall, the amount of IAPP showed a positive correlation with β-cell volume and, conversely, a negative correlation with apoptosis and CHOP expression. Previous studies have shown that high IAPP was detected in non-diabetic patients compared with diabetic patients in plasma and pancreas (Clark et al. 1990; Iki and Pour 2007). These results suggest that IAPP alone is not pathogenic. Therefore, we must reconsider whether IAPP directly causes β-cell apoptosis and decreased β-cell mass.
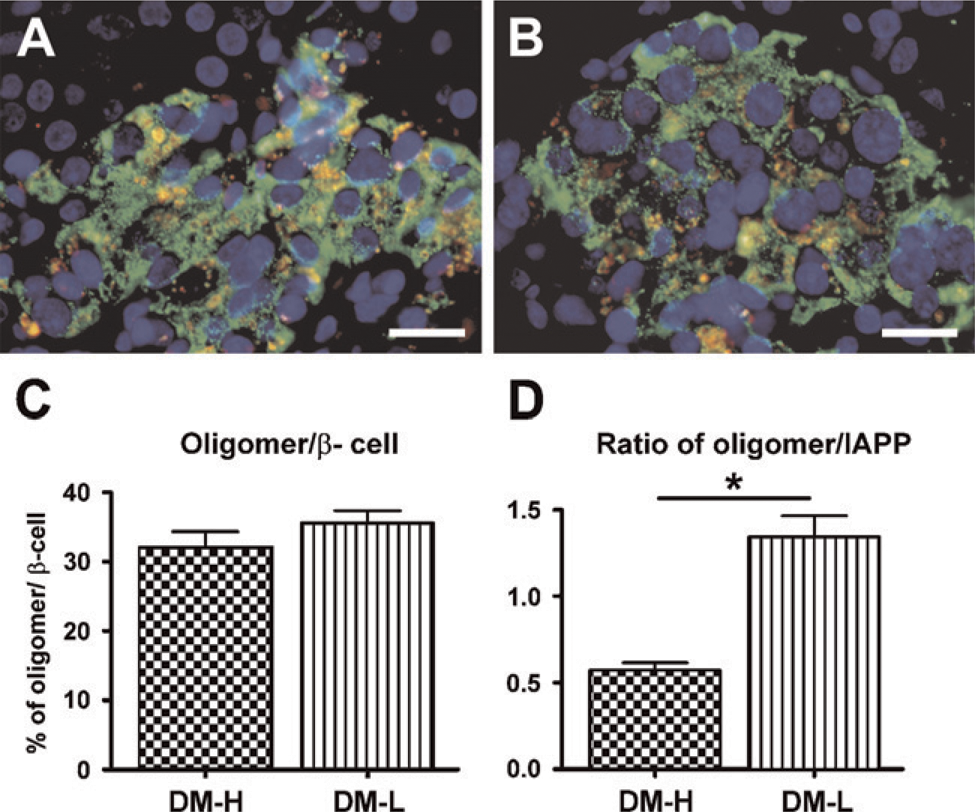
Immunofluorescent images of islet immunostained for oligomer (red) and insulin (green) in the DM-H group
Previous studies have suggested that T2DM is morphometrically characterized by IAPP aggregation into fibrillar amyloid deposits in the islets, which is associated with β-cell loss (Jaikaran and Clark 2001; Hoppener and Lips 2006). However, the relationship between IAPP and the onset and progression of T2DM in humans remains largely unknown. Clark et al. (1988) reported that in patients with diabetes of long duration, the degree of islet amyloidosis at postmortem can vary from a low prevalence (<1% of islets affected) to up to 90% of the islets affected, with a high degree of amyloid replacement in the islet cells (up to 80% of the islet mass occupied by amyloid). In our cases, the islets of only a few patients showed amyloid deposits (DM-H: 2/11; DM-L: 3/13), and the degree of islet amyloidosis did not differ between the DM-H and DM-L groups (data not shown). Although IAPP is increased in diabetic islets, we found that the amount of IAPP was not always increased in diabetes. This may be associated with the insulin secretion capacity of the islet. IAPP is a monomeric protein that is normally cosecreted with insulin from β-cells (Cooper et al. 1989; Kahn et al. 1990). Thus, in the DM-L group, the reduction in IAPP suggests that the number of β-cells is reduced. If that is so, then the reason for the increased IAPP in the DM-H group becomes clear.
We used the insulinogenic indices QUICKI and HOMA-B as indirect indices of insulin sensitivity and insulin secretion. The insulinogenic index is a well-known index of early-phase insulin secretion during the OGTT (Seino et al. 1975). Previous studies have documented that QUICKI has an excellent linear correlation with the glucose clamp index of insulin sensitivity in T2DM patients (Katz et al. 2000; Mather et al. 2001). HOMA-B has been proposed to be a good indicator of β-cell function (Wallace et al. 2004). We compared HOMA-IR among the four groups. HOMA-IR is a simple, inexpensive and reliable surrogate marker of insulin resistance (Matthews et al. 1985; Wallace et al. 2004). Worsening insulin resistance or impaired β-cell function results in a greater initial increase in the plasma glucose concentration following glucose loading (Abdul-Ghani et al. 2007). Insulin hypersecretion of β-cells to overcome the insulin resistance causes hyperinsulinemia, which is associated with the development of islet amyloid (Kautzky-Willer et al. 1994). In this study, as expected, the IGT group showed a remarkably increased insulinogenic index, HOMA-B, and HOMA-IR. The DM-H group tended to have a higher insulinogenic index and HOMA-B and a lower QUICKI compared with the DM-L group, although there were no significant differences. However, the HOMA-IR in the DM-H group was significantly higher than that in the DM-L group. Furthermore, the DM-H group showed hyperinsulinemia and increased IAPP deposition. Mulder et al. (2000) reported that IAPP-deficient mice develop a more severe form of alloxan-induced diabetes, indicating a protective effect of IAPP on β-cell damage. Our data suggest that insulin secretion capacity is not notably deteriorated in the DM-H group.
In human autopsy studies of patients with T2DM, β-cell mass is reduced by 40–60% (Rahier et al. 1983; Kloppel et al. 1985; Clark et al. 1988). In the present study, β-cell loss was more evident in the DM-L group compared with the DM-H group. Interestingly, proliferation and apoptosis rates were decreased in the DM-H group. These findings suggest that the β-cells of the DM-H group may be more resistant to apoptotic stress than those in the DM-L group. They may then show a slow, continuous turnover of β-cells and consequently a similar β-cell volume compared with the NGT group. Accelerated cell death may result in decreased β-cell mass. The β-cell workload of protein synthesis, folding, processing, and secretion, with proteins such as insulin and IAPP in need of excessive insulin secretion, has been shown to predict vulnerability to apoptosis. Further, β-cell rest has been shown to delay or prevent onset of diabetes (Grill and Bjorklund 2001). The present study in living human tissues showed that high IAPP–expressing islets have a higher capacity for insulin secretion and a lower apoptosis rate than low IAPP–expressing islets. However, the reason for the lower β-cell proliferation rate in the DM-H group is still unclear. Further studies are required to define the role of IAPP in β-cell anti-proliferation.
It is noteworthy that we observed an increased nuclear CHOP expression in the DM-L group. Recent studies have suggested that high IAPP expression induces protein misfolding and ER stress–mediated β-cell apoptosis (Huang et al. 2007a,b). ER stress is an important pathway in the increased apoptosis of β-cells in T2DM (Ozcan et al. 2004; Huang et al. 2007b; Laybutt et al. 2007; Marchetti et al. 2007). One of the most commonly used indicators of ER stress–induced apoptosis is the increased expression and nuclear translocation of CHOP (Oyadomari and Mori 2004). Huang et al. (2007b) reported that human IAPP-expressing INS-1 cells show increased nuclear CHOP expression. In contrast, in our study, low IAPP–expressing islets showed higher ER stress–induced apoptosis. Increased apoptosis may lead to a reduction in β-cell volume and a reduction in insulin and IAPP secretion. These findings, therefore, suggest that the expression of IAPP may not always be an indicator of cell death induction. Indeed, Butler et al. (2003a) reported that the amount of amyloid detectable in the islets is not always correlated with the degree of β-cell loss.
Accumulation of misfolded proteins is believed to compromise the ER membrane (Schroder and Kaufman 2005). It has been proposed that small soluble oligomers of IAPP are toxic to β-cells through induction of membrane instability and apoptosis (Janson et al. 1999; Kayed et al. 2004; Demuro et al. 2005). In this study, the DM-L group showed increased CHOP expression and an increased ratio of oligomer to IAPP compared with the DM-H group. Our findings suggest that the composite of aggregates (not IAPP, but oligomers) may be more important in the induction of β-cell apoptosis.
There are several limitations to this study. First, the number of cases was small. Second, pancreatic specimens were obtained from patients with tumors. However, performing a living human pancreatic biopsy is ethically unacceptable in the absence of pathology. Several studies have shown that altered glucose metabolism or diabetes occurs before the clinical manifestation of pancreatic cancer. These studies have also suggested that diabetes is caused by the tumor itself (Permert et al. 1993; Gullo et al. 1994). Conversely, another study reported that pancreatic tumors do not seriously affect the endocrine pancreas (Yoon et al. 2003). Katsumichi and Pour (2007) reported no morphometric changes in the tumor-free area in diabetic pancreases and found no link between T2DM and pancreatic cancer. However, we cannot exclude the possibility of alterations in pancreatic histology induced by tumors. Third, even though we uniformly analyzed the head of each pancreas, such an examination may not be representative of the whole pancreas. Fourth, we stained and analyzed toxic oligomer in paraffin-embedded human pancreas tissues (Zhao et al. 2009), although Haataja et al. (2008) reported that A11 antibody decreases specificity and sensitivity in paraffin-embedded tissue. However, we used two different A11 antibodies (obtained from Chemicon and the laboratory of Charles G. Glabe, University of California, Irvine) to confirm detection of toxic oligomer.
In summary, we observed two different kinds of islets in type 2 diabetic patients, in terms of IAPP immunoreactivity: high IAPP and low IAPP. Our findings did not support the hypothesis that more IAPP is produced and deposited in the islets of diabetic patients than in those of healthy individuals. However, we showed that high IAPP–expressing islets have better insulin secretion capacity, preserved β-cell volume, decreased ER stress–induced apoptosis, and decreased ratio of oligomer to IAPP compared with low IAPP–expressing islets. Therefore, IAPP expression may not always be an indicator of cell death induction. These findings indicate that amyloid oligomer distribution may contribute to the differences in islets of T2DM and consequently result in β-cell apoptosis. Future research is necessary to determine why IAPP expression differs in islets and whether changes in the character of IAPP influence apoptosis.
Footnotes
Acknowledgements
This work was supported by grants from the IN-SUNG Foundation for Medical Research, from the Samsung Biomedical Research Institute (grant CB02091), from the Korea Health 21 R&D Project, Ministry of Health & Welfare, Republic of Korea (grant A080009), and from the Organ Transplantation Center of Samsung Medical Center.
We thank Dr. Peter C. Butler for his helpful comments in the preparation of this manuscript. We also thank Dr. Charles G. Glabe for the preparation and provision of A11 antibody.