
Abstract
Mitochondria are key regulators of cellular energy and are the focus of a large number of studies examining the regulation of mitochondrial dynamics and biogenesis in healthy and diseased conditions. One approach to monitoring mitochondrial biogenesis is to measure the rate of mitochondrial DNA (mtDNA) replication. We developed a sensitive technique to visualize newly synthesized mtDNA in individual cells to study mtDNA replication within subcellular compartments of neurons. The technique combines the incorporation of 5-bromo-2-deoxyuridine (BrdU) and/or 5-ethynyl-2'-deoxyuridine (EdU) into mtDNA, together with a tyramide signal amplification protocol. Employing this technique, we visualized and measured mtDNA biogenesis in individual cells. The labeling procedure for EdU allows for more comprehensive results by allowing the comparison of its incorporation with other intracellular markers, because it does not require the harsh acid or enzyme digests necessary to recover the BrdU epitope. In addition, the utilization of both BrdU and EdU permits sequential pulse–chase experiments to follow the intracellular localization of mtDNA replication. The ability to quantify mitochondrial biogenesis provides an essential tool for investigating the alterations in mitochondrial dynamics involved in the pathogenesis of multiple cellular disorders, including neuropathies and neurodegenerative diseases.
Keywords
A
Mitochondrial damage is central to the pathophysiology of a number of inherited and acquired diseases, including hereditary and acquired neuropathies (Feldman 2003; Vincent et al. 2005; Abou-Sleiman et al. 2006; Kwong et al. 2006; Leinninger et al. 2006; Polymenidou and Cleveland 2008). In the nervous system, mitochondria are of particular interest, owing to the high energy demand of neurons. Mitochondria are distributed in all neuronal compartments, including the cell body, axons, dendrites, and synaptic terminals. Mitochondrial biogenesis allows neurons to meet changing energy loads and to redistribute mitochondria throughout all compartments of the neuron.
Our laboratory has demonstrated the critical role of mitochondria in the progression of hyperglycemia-mediated neuronal damage (Vincent and Feldman 2004; Vincent et al. 2004,2005). These studies are being expanded to characterize whether glucose-mediated changes in mitochondria involve healthy metabolic fission and biogenesis. Here we describe a sensitive technique to label newly synthesized mitochondrial DNA (mtDNA) in individual cells by combining the incorporation of thymidine analogs into mtDNA with a tyramide signal amplification (TSA) protocol. This technique is a valuable tool for visualizing and measuring mtDNA biogenesis within individual neurons, and importantly, in specific compartments such as somas, dendrites, axons, and synapses. This is the first report to use 5-ethynyl-2'-deoxyuridine (EdU) to visualize mtDNA biogenesis and to combine it with 5-bromo-2-deoxyuridine (BrdU) to perform sequential pulse-chase paradigms, whereas other reports have only used BrdU alone (Amiri and Hollenbeck 2008) or have used the two thymidine analogs to measure nuclear DNA replication (Cappella et al. 2008; Salic and Mitchison 2008). In addition, the labeling procedure for EdU does not involve the harsh acid or enzyme digests needed for BrdU epitope recovery, and therefore allows greater flexibility and more comprehensive results by comparing its incorporation with that of other intracellular markers (Cappella et al. 2008; Kaiser et al. 2009).
The ability to visualize and quantify mitochondrial biogenesis will afford new insight into the mechanisms underlying the pathogenesis of multiple mitochondrial-based neurological disorders. Our technique is applicable to sensory neurons, which are historically difficult cells to study, and could easily be applied to other cell types. This has significant implications in furthering the understanding of both normal cellular physiology as well as impaired disease states.
Materials and Methods
Materials
F12 medium and Dulbecco's modified Eagle's medium (DMEM) were purchased from Mediatech, Inc. (Manassas, VA). Antibodies for pyruvate dehydrogenase (PDH) E2/E3bp component, Alexa Fluor 488, Alexa Fluor 594, and Prolong Gold containing 4',6-diamidino-2-phenylindole (DAPI) were obtained from Invitrogen (Eugene, OR). Antibodies were obtained for BrdU (Vector Laboratories; Burlingame, CA), Tuj1 (Neuromics; Edina, MN), and trkA (R and D Systems; Minneapolis, MN). Tyramide Signal Amplification, Zenon Alexa Fluor 594 mouse IgG2a labeling and Click-iT EdU Microplate Assay kits were purchased from Invitrogen (Eugene, OR). All other chemicals were purchased from Sigma-Aldrich (St. Louis, MO).
Cell Culture
Mouse and human neuroblastoma cells were cultured in DMEM with 10% fetal bovine serum and antibiotics (mouse F11) or with 10% calf serum (human SH-SY5Y) and maintained at 37C in a humidified atmosphere containing 10% CO2. Cells were subcultured using trypsin-EDTA (Invitrogen; Grand Island, NY) and were used for experiments 1 day after seeding at an initial density of 9000 cells per 12-mm glass coverslip.
Timed pregnant rats were purchased from Charles River Laboratories (Wilmington, MA). All rodent care and use was approved and regulated by the Unit for Laboratory Animal Medicine at the University of Michigan. Dissociated dorsal root ganglion (DRG) neurons were isolated from E15 embryos or adult Sprague Dawley rats following previously published methods (Vincent and Feldman 2008). Neurons were plated on laminin-coated (25 μg/ml) 12-mm glass coverslips in Neurobasal (embryonic) or DMEM+F12 (adult) media supplemented with B-27 additives (without antioxidants), 1.4 mM
Incorporation of BrdU or EdU
BrdU (Sigma-Aldrich) stock solution (15 mM) was prepared in 0.1 M phosphate-buffered saline (PBS) solution, sterile filtered, and stored at −20C, and EdU stock (Invitrogen; Eugene, OR) was provided by the manufacturer at 10 mM. Neuroblastoma cells or DRG neurons were incubated with or without 10–15 μM BrdU or 10 μM EdU for 0, 6, 12, or 24 hr.
In control experiments, 7 μM aphidicolin (3 mM stock in DMSO; Sigma) was added to culture media to inhibit DNA polymerase α (nuclear). Ethidium bromide (10 mg/ml stock; Promega, Madison, WI) at 0.5, 1.0, or 1.5 μg/ml or 2',3'-dideoxycytidine (ddC, 10 mM stock; Sigma-Aldrich) at 50, 100, or 200 μM was added to culture media to inhibit DNA polymerase γ (mitochondrial). In the EdU control experiments, inhibitors were added 4 hr prior to and included in the 12 hr incubation with EdU to parallel other studies using ddC as an inhibitor of DNA polymerase γ (Amiri and Hollenbeck 2008). Sequential labeling experiments were performed by completely removing media with the first thymidine analog, rinsing twice in fresh media, and replacing with media containing the second thymidine analog.
BrdU Labeling and Signal Amplification
Cells were fixed with 2% paraformaldehyde for 10 min at room temperature, rinsed twice in 0.14 M PBS, pH 7.4, and permeabilized with 0.1% Triton X-100 in PBS for 10 min at room temperature. DNA was denatured with 2 N HCl for 30 min at 37C to recover the BrdU epitope, and then rinsed three times in PBS. In some cases, cells were incubated with Image-iT FX Signal Enhancer (Invitrogen; Eugene, OR) for 30 min at room temperature to reduce background staining of Alexa Fluor secondary antibodies. For standard immunofluorescence, cells were blocked in PBS containing 0.1% Triton X-100 and 5% goat serum for 30 min at room temperature and incubated with mouse primary anti-BrdU (1:50) in blocking solution overnight at 4C. Cells were washed three times for 10 min in PBS, incubated with goat anti-mouse secondary antibody conjugated to Alexa Fluor 488 (1:1000) in blocking solution for 1 hr at room temperature, followed by three 10-min washes in PBS.
For signal amplification, cells were processed as mentioned above for fixation, permeabilization, and denaturation of DNA. Endogenous peroxidases were blocked with 1% H2O2 in PBS for 30 min at room temperature, followed by three rinses in PBS. BrdU immunofluorescence was performed by incubation in 1% blocking solution from the TSA kit for 1 hr at room temperature and then incubating cells with a mouse monoclonal antibody against BrdU (Vector Laboratories; Burlingame, CA) at 1:50 in 1% blocking solution overnight at 4C. The next day, cells were rinsed three times in PBS and incubated with a horseradish peroxidase (HRP)-conjugated goat anti-mouse antibody diluted 1:100 in 1% blocking solution for 45 min at room temperature. Cells were rinsed three times in PBS, incubated with fluorescently labeled tyramide at 1:100 in amplification buffer plus 0.0015% H2O2 for 10 min at room temperature, and rinsed three times in PBS.
EdU Labeling and Signal Amplification
Cells were fixed with 2% paraformaldehyde for 10 min at room temperature, rinsed twice in PBS, and permeabilized with 0.1% Triton X-100 in PBS for 10 min at room temperature. Endogenous peroxidases were blocked with 1% H2O2 in PBS for 30 min at room temperature, followed by three rinses in PBS. EdU was labeled following the protocol in the Click-iT EdU Microplate Assay Kit. EdU reaction cocktail was made just prior to use by combining 2x Click-iT reaction buffer, Click-iT EdU buffer additive, CuSO4, and Oregon Green azide. Cells were postfixed in EdU fixative for 5 min at room temperature, and equal volumes of the EdU reaction cocktail were added to each cover-slip and incubated for 25 min at room temperature, protected from light. The cocktail was removed, and cells were washed twice in 1% blocking solution from the kit. The Oregon Green azide signal was amplified with a TSA kit, similar to the BrdU amplification. Cells were blocked in 1% blocking solution from the TSA kit plus 5% normal goat serum (NGS) in PBS for 1 hr at room temperature, followed by incubation with an HRP-conjugated rabbit antibody against Oregon Green (from the EdU Microplate Assay Kit) diluted 1:300 in 1% blocking solution plus 5% NGS in PBS overnight at 4C. The next day, cells were rinsed three times in PBS, incubated with Alexa Fluor 488–labeled tyramide at 1:100 in amplification buffer plus 0.0015% H2O2 for 10 min at room temperature, and rinsed three times in PBS.
Dual BrdU and EdU Labeling and Signal Amplification
Dual staining of BrdU and EdU was performed by sequentially labeling and amplifying each signal. Cells were fixed with 2% paraformaldehyde for 10 min at room temperature, rinsed twice in PBS, and permeabilized with 0.1% Triton X-100 in PBS for 10 min at room temperature. Endogenous peroxidases were blocked with 1% H2O2 in PBS for 30 min at room temperature, followed by three rinses in PBS. EdU was labeled and amplified first, following the protocol described above. After the final PBS rinse, DNA was denatured with 2 N HCl for 30 min at 37C to recover the BrdU epitope. The acid treatment did not compromise the EdU signal. Cells were then rinsed three times in PBS, and the HRP conjugated to Oregon Green was quenched by 2% H2O2 in PBS for 20 min at room temperature, followed by three rinses in PBS. BrdU signal was labeled and amplified following the protocol described above.
Immunofluorescence Following EdU Labeling
In some samples, a Zenon Mouse IgG2a Kit (Invitrogen; Eugene, OR) was used to prelabel the primary mouse anti-PDH, a mitochondrial marker antibody (200 μg/ml stock), with Alexa Fluor 594. Briefly, 5 μl of Zenon labeling reagent was used for every 1 μg of PDH antibody and incubated for 5 min at room temperature. The labeling reaction was stopped by adding 5 ml (per 1 μg antibody) of Zenon blocking reagent for 5 min at room temperature. Cells were incubated with 5 μg/ml of the Alexa Fluor 594–labeled PDH antibody in PBS with 10% goat serum for 1 hr at room temperature followed by three 10-min washes in PBS.
In other samples, standard immunofluorescence was performed by blocking cells in PBS containing 0.1% Triton X-100 and 5% goat (or donkey) serum for 30 min at room temperature and then incubating them with primary antibodies, mouse anti-Tuj1 (1:500), or goat anti-trkA (1:50), in blocking solution overnight at 4C. Cells were washed three times for 10 min in PBS, then incubated with species-specific secondary antibodies (goat anti-mouse or donkey anti-goat) conjugated to Alexa Fluor 594 (1:1000) in blocking solution for 1 hr at room temperature, followed by three 10-min washes in PBS.
Imaging and Analysis
All coverslips were mounted on glass slides with Prolong Gold containing DAPI. Fluorescence signals were viewed on an Olympus FluoView 500 laser scanning confocal microscope with a 60x oil-immersion (1.4 NA) objective and magnified two times with FluoView version 5.0 software. DAPI, Alexa Fluor 488, and Alexa Fluor 594 were excited with a 405-nm laser diode, 488-nm argon laser, and 543-nm HeNe green laser, respectively. Differential interference contrast images were collected with the Alexa Fluor 488 signal. Sequential scans were used to maximize signal separation. Three-dimensional (3D) z-series were captured at 0.225-μm intervals with Kalman averaging (two frames). Maximum projections were used to show BrdU or EdU incorporation into mtDNA of representative cells from each condition. Adobe Photoshop (CS3, Adobe Systems, Inc.; San Jose, CA) software was used to make minor adjustments in levels and to arrange the final images.
AutoQuant (version X, Media Cybernetics, Inc.; Bethesda, MD) was used to deconvolve 3D confocal images to show colocalization of EdU signal in mtDNA with mitochondria. Deconvolution was done with an adaptive point spread function (blind) for five iterations with high noise.
Analysis of BrdU- and EdU-labeled mtDNA was performed using Volocity software (version 4.2, Improvision, Inc.; Waltham, MA). Confocal z-series were deconvolved with fast restoration and cropped to isolate individual neurons. BrdU- or EdU-labeled mtDNA was identified and measured by the following protocol: fill holes in objects, separate touching objects by 0.1 μm3, and exclude objects by size (0.008–0.5 μm3). The cytosolic volume of each neuron was measured by subtracting the volume of the nucleus from the total cell volume. All experiments were performed on cultured cells from at least three separate occasions with at least two to four replicates per condition. Twenty representative neurons were measured for each group. Prism 5 software was used to prepare graphs and to determine statistically significant differences using ANOVA with Tukey's posthoc comparisons or two-tailed t-tests (GraphPad Software; La Jolla, CA).
Results
Amplification of BrdU Signal in mtDNA
Historically, the tymidine analog BrdU is one of the most popular analogs used for studying nuclear DNA replication during the S-phase of the cell cycle. Our goal was to use this strategy to visualize newly synthesized mtDNA. Mitotic F11 neuroblastoma cells grown in the presence of BrdU for 12 hr demonstrated nuclear incorporation of BrdU by standard immunofluorescence; however, there was no clear labeling of mtDNA, even in over-saturated images (Figure 1A). Failure to detect BrdU signal in mtDNA either was due to a lack of mtDNA synthesis during the 12 hr or the signal was too weak to visualize. Two approaches were used to enhance the BrdU signal. Image-iT FX was used to reduce background associated with Alexa Fluor fluorescent secondary antibodies. This process reduced noise and provided an enhancement of the BrdU label in mtDNA of F11 cells (Figure 1B). Unfortunately, the increased visualization of BrdU signal in mtDNA of F11s was inconsistent, and signal in other cell types, such as primary sensory neurons, was not sufficiently enhanced (data not shown).
The second approach was to enhance the BrdU signal with TSA. The primary BrdU antibody was labeled with a secondary antibody conjugated with HRP to enzymatically amplify the original signal with a fluorescently labeled tyramide. TSA significantly enhanced the visualization of BrdU incorporation into mtDNA (Figure 1C). F11 cells that were grown without BrdU revealed no false labeling in mtDNA or the nucleus following the TSA protocol (Figure 1D).
Inhibitors of DNA polymerase a (nuclear) or DNA polymerase γ (mitochondrial) were used to verify the specificity of TSA BrdU signal in nuclear DNA and mtDNA. Aphidicolin is an inhibitor of DNA polymerase α and prevents cell division by blocking the cell cycle at early S-phase (Huberman 1981). Amplified BrdU signal was present in both nuclear DNA and mtDNA when F11 cells were incubated with BrdU for 12 hr (Figures 2A and 2C). F11 cells treated with aphidicolin during the 12-hr BrdU incubation resulted in BrdU incorporation into mtDNA but not into nuclear DNA (Figure 2B). Incorporation of BrdU into mtDNA was blocked by treatment of F11 cells with ethidium bromide, an inhibitor of DNA polymerase γ, during the 12-hr incubation with BrdU, whereas nuclear DNA synthesis was preserved (Figure 2D).
Cultured DRG neurons were also used to evaluate the utility of the TSA BrdU signal for newly synthesized mtDNA. Embryonic DRG neurons incubated with BrdU for 24 hr and processed with BrdU-TSA revealed a significant amount of mtDNA synthesis (Figures 3B and 3C). Most of the labeled mtDNAs were located within the soma (Figures 3B and 3C). In some cases, positively labeled mtDNAs were observed within the neurites (Figure 3D).
Amplification of EdU Signal in mtDNA
EdU, a recently introduced thymidine analog (Buck et al. 2008), was used to determine its effectiveness at labeling newly synthesized mtDNA. F11, SH-SY5Y, or DRG neurons incubated with EdU for 6–24 hr demonstrated clear nuclear DNA but not mtDNA labeling following an unamplified copper-catalyzed Click reaction of the EdU (alkyne) and fluorescent label (Oregon Green azide; data not shown). Tyramide-amplified EdU signal was visible in both nuclear DNA and mtDNA when F11 cells were incubated with EdU for 12 hr (Figure 4A). The presence of aphidicolin during the 12-hr EdU incubation resulted in incorporation of EdU into mtDNA but not into nuclear DNA (Figure 4B). Incubation with inhibitors of DNA polymerase γ, ethidium bromide (Figure 4C), or ddC (Figure 4D) blocked the incorporation of EdU into mtDNA but did not interfere with nuclear DNA replication. Surprisingly, we found that ethidium bromide at 1 μg/ml was more effective at blocking the incorporation of EdU into mtDNA than a range of ddC concentrations (50–200 μM). Ethidium bromide also blocked the incorporation of BrdU into mtDNA without the need for the preincubation period that has been reported for ddC (Amiri and Hollenbeck 2008).
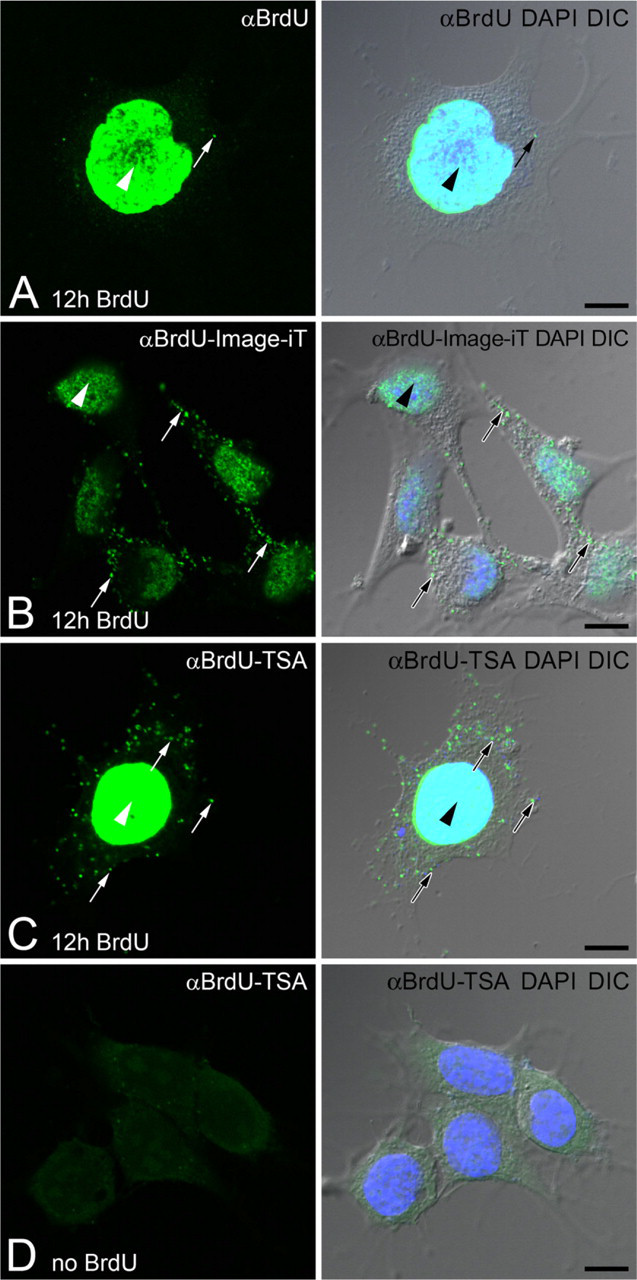
Signal amplification of 5-bromo-2-deoxyuridine (BrdU) incorporated into mitochondrial DNA (mtDNA). F11 neuroblastoma cells are incubated with BrdU for 12 hr. BrdU signal (αBrdU, green) is compared with DNA stain [4',6-diamidino-2-phenylindole (DAPI), blue] and cell morphology [differential interference contrast (DIC) image].
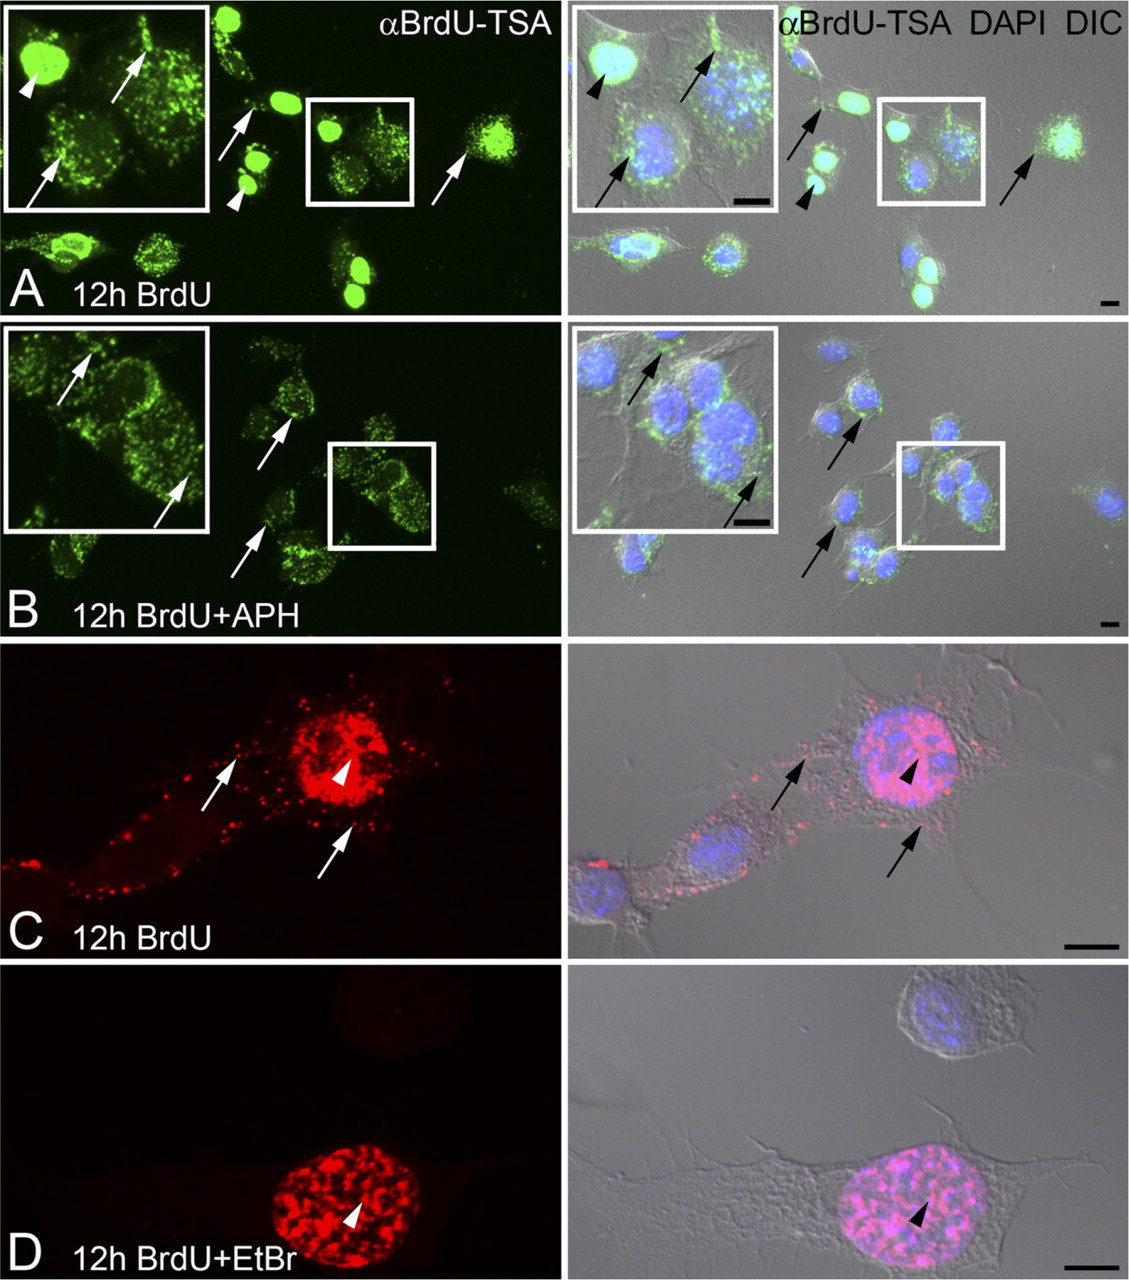
Inhibitors of nuclear (a) or mitochondrial (γ) DNA polymerases differentially block BrdU incorporation. F11 neuroblastoma cells are incubated with BrdU for 12 hr with or without the addition of DNA polymerase inhibitors. Amplified BrdU signal [αBrdU-TSA, (
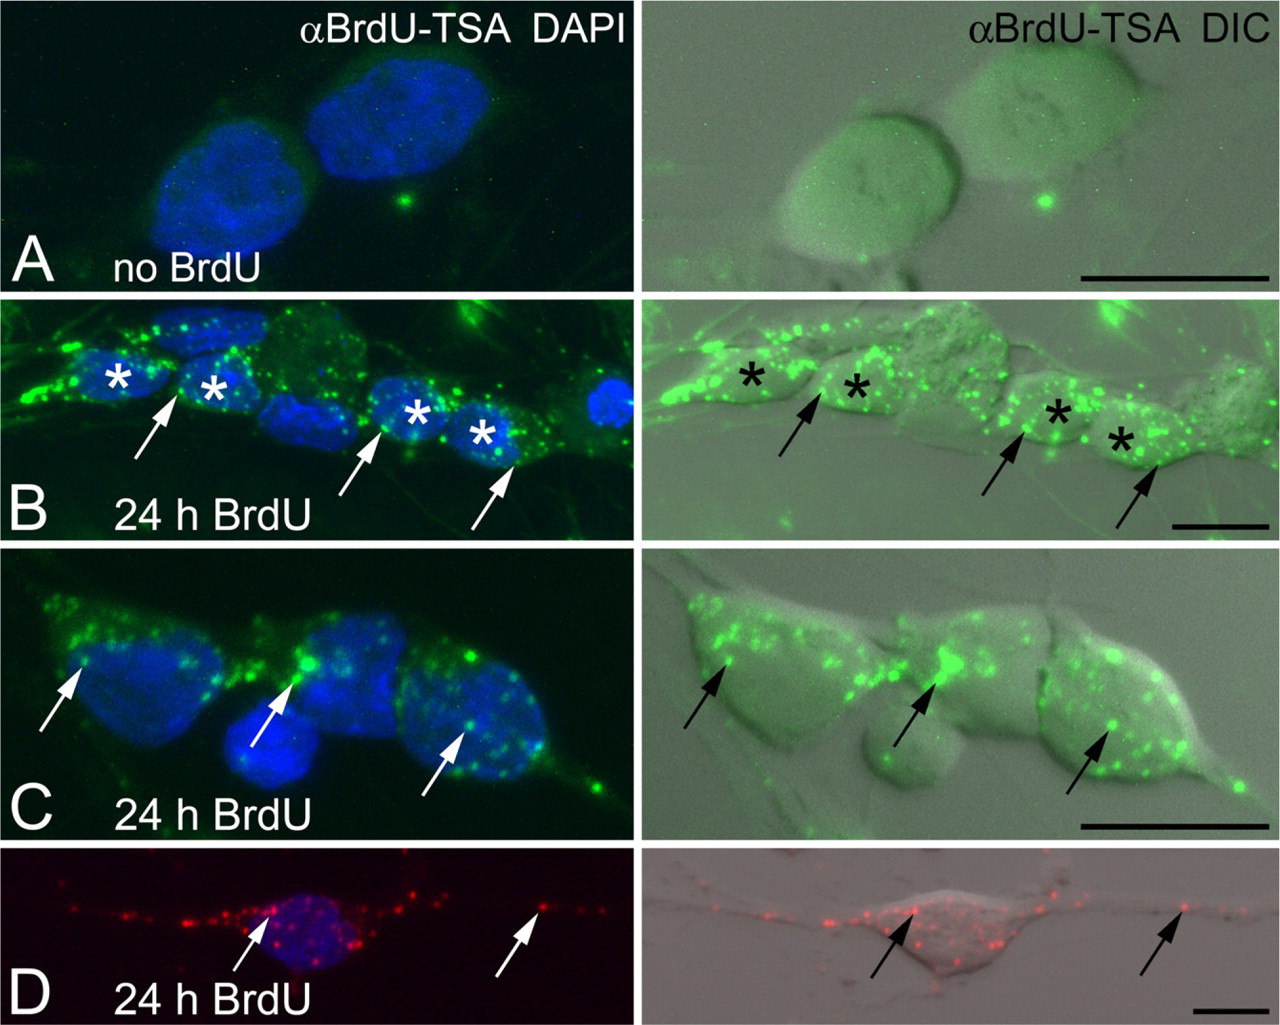
BrdU incorporation into mtDNA of primary sensory neurons. Embryonic dorsal root ganglion (DRG) neurons are incubated with BrdU for 24 hr. Amplified BrdU signal (αBrdU-TSA;
The EdU protocol allowed for subsequent fluorescent labeling of other cellular structures or proteins by eliminating the harsh HCl DNA denaturation step that is necessary for exposing the BrdU epitope. SH-SY5Y cells grown in the presence of EdU for 6 hr contained few positively labeled mtDNAs (Figure 5A). The EdU signal colocalized with a mitochondrial protein, PDH, further supporting the specificity of the mtDNA signal. The amplified EdU signal was visible in cultured DRG neurons (Figures 5B–5D). There was no difference in the quality (Figures 3B–3D and 5B) or quantity (Figure 5E) of positively labeled mtDNA in embryonic DRG neurons after 24-hr exposure to either BrdU or EdU. Cultured DRG neurons from adult mice also demonstrated EdU labeling of mtDNA (Figures 5C and 5D). Adult DRG neurons were identified with a pan-neuronal marker (Tuj1) or a subtype-specific marker (trkA receptor). The number of EdU-labeled mtDNAs was more abundant in trkA-labeled adult neurons, compared with NGF-dependent embryonic DRG neurons after 24 hr in vitro (Figure 5E). Adult neurons are consistently larger than embryonic DRG neurons, and when the number of labeled mtDNAs per neuron was corrected for cell volume, the embryonic neurons were more actively replicating mtDNA than were adult neurons (Figure 5F).
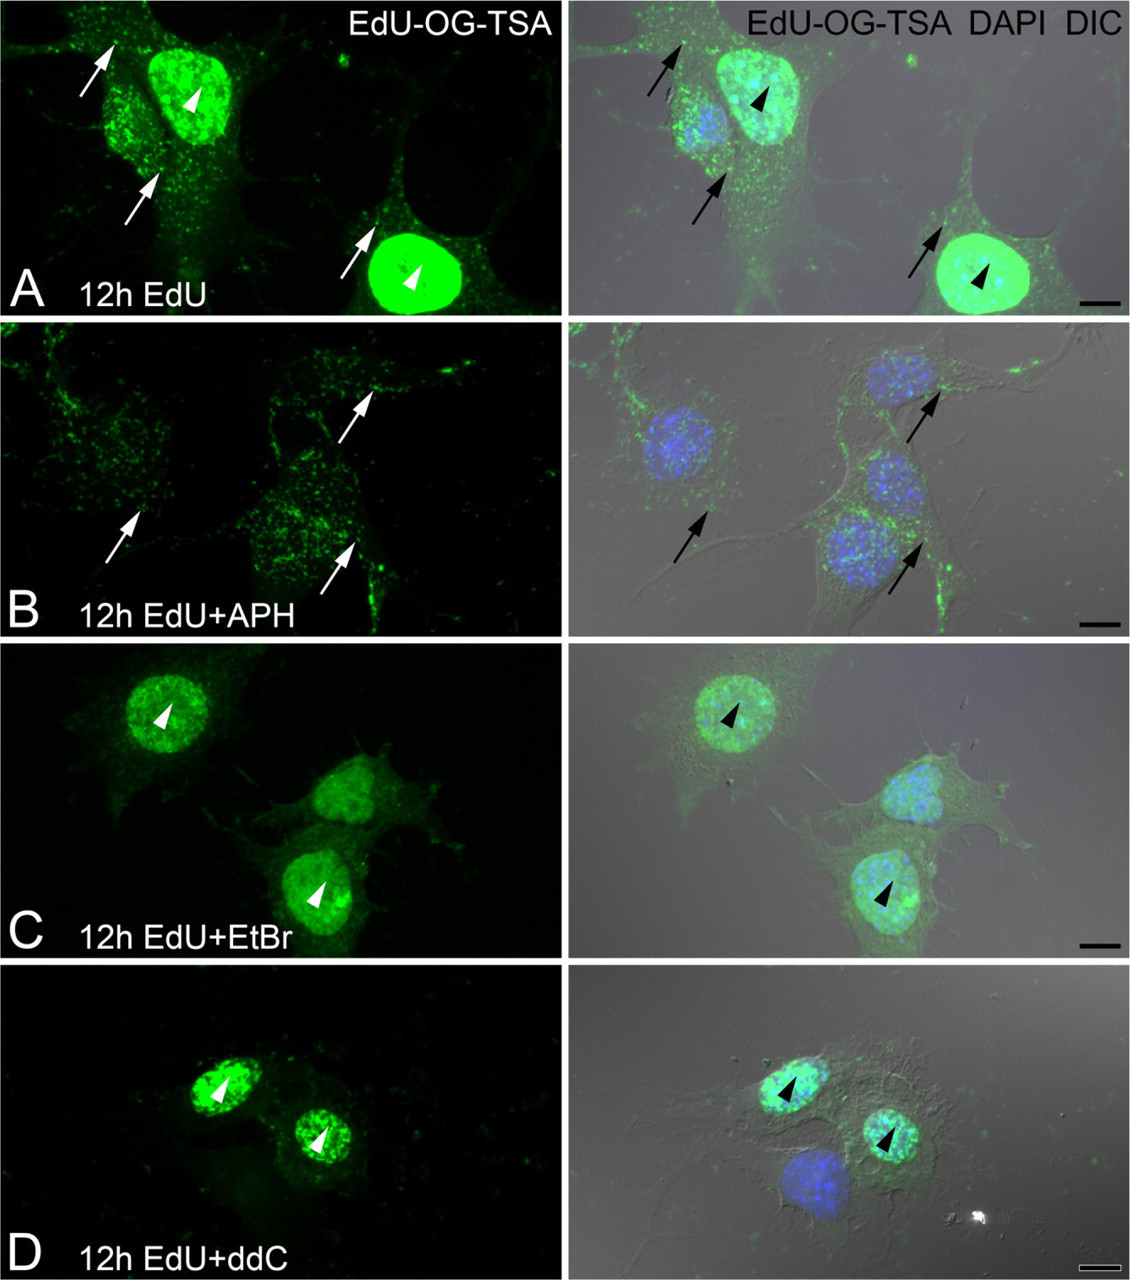
Inhibitors of nuclear (α) or mitochondrial (γ) DNA polymerases differentially block EdU incorporation. F11 neuroblastoma cells are incubated with or without DNA polymerase inhibitors 4 hr prior to and together with EdU for an additional 12 hr. Amplified EdU signal (EdU-OG-TSA) is compared with DNA stain (DAPI, blue) and cell morphology (DIC).
Dual BrdU and EdU Labeling of mtDNA
The visualization of individually amplified BrdU and EdU signals in mtDNA made it possible to examine whether these labels could be used sequentially in pulse labeling experiments. F11 cells were grown in the presence of BrdU for 12 hr and then switched to medium containing only EdU for an additional 12 hr (Figure 6A). Nuclear DNA replication was inhibited with the addition of aphidicolin in the medium. Both signals were amplified to visualize incorporation into mtDNA. After a total of 24 hr, cells contained mtDNAs only labeled with BrdU, only labeled with EdU, or dually labeled with BrdU and EdU (Figure 6A). The sequence of analogs was switched to determine whether the order of exposure affected the ability to individually and dually label mtDNA. There was no difference in labeling patterns when EdU was pulsed during the first 12 hr and BrdU was pulsed in the second 12 hr (Figure 6B). In these experiments, mtDNAs were labeled with BrdU only or EdU only, or were dually labeled with BrdU and EdU.
Discussion
Mitochondrial dynamics and biogenesis are regulated by a variety of cellular mechanisms and have a significant impact on health and disease. We developed a sensitive assay to visualize and quantify newly synthesized mtDNA in individual cells. EdU incorporation into mtDNA is a significant improvement in this technique because standard BrdU epitope retrieval protocols are harsh and require acid or DNase treatments of the cells or tissue. The milder staining procedure for EdU provides the flexibility to compare EdU labeling with multiple cellular markers.
BrdU is a common way to label DNA synthesis, and other studies have used it to label mtDNA (Davis and Clayton 1996; Magnusson et al. 2003; Amiri and Hollenbeck 2008). In this study, BrdU and EdU signals incorporated into mtDNA were too weak to visualize with standard immunofluorescence. The signal was improved by reducing the background labeling with Image-iT, which is designed to reduce nonspecific binding of Alexa Fluor dyes. When cells were pretreated with Image-iT prior to standard immunofluorescence, there was a moderate improvement in visualizing BrdU signal in mtDNA. Substantial improvement in signal strength was obtained with the use of TSA. This protocol resulted in discrete labeling of BrdU/EdU in mtDNA with minimal nonspecific background fluorescence.
Many compounds are designed to interfere with DNA synthesis (Mattoccia and Roberti 1974; Cozzarelli 1977; Joyce and Steitz 1994). We used aphidicolin to block nuclear DNA polymerase α (Ikegami et al. 1978; Davis and Clayton 1996). The presence of aphidicolin in the media significantly inhibited incorporation of BrdU and EdU into the nucleus of dividing F11 cells. At the same time, there was no loss of signal incorporated into mtDNA. We also treated F11 cells with ethidium bromide and ddC, known inhibitors of DNA polymerase γ (Mattoccia and Roberti 1974; Keilbaugh et al. 1993), which blocked BrdU and EdU incorporation into mtDNA while maintaining nuclear DNA labeling. Visualizing the incorporation of BrdU/EdU into mtDNA could serve as a tool to test new drugs that differentially block DNA polymerase subtypes with the potential to observe cellular and subcellular effects.
The use of EdU to label mtDNA significantly enhanced our ability to investigate mtDNA synthesis, because we were able to compare its signal with other cellular markers. We used a known mitochondrial protein, PDH, to verify that the EdU signal was localized within mitochondria, further supporting the validity of the technique. Culture conditions often involve multiple cell types and, therefore, cell-specific markers are needed to differentiate among them. We used a pan-neuronal marker (Tuj1) and a subtype-specific (trkA receptor) marker to identify DRG neurons from other non-neuronal cells present in the cultures. This provides a definite advantage over other assays for mtDNA biogenesis that rely on isolating DNA from cells to measure changes in mtDNA levels, where cell-specific signals are lost in the process.
Visualization of newly synthesized mtDNA at the subcellular level provides an opportunity to quantify mitochondrial biogenesis and make comparisons between cells and/or treatments. BrdU incorporation and EdU incorporation were quantified in confocal z-series using 3D analysis software. We were able to measure and verify that embryonic DRG neurons had roughly the same number of labeled mtDNAs using either BrdU or EdU during equivalent labeling durations. Comparisons were also made between embryonic and adult DRG neurons. Adult neurons typically had more mtDNAs labeled with EdU than did embryonic neurons; however, when normalized to cell volume, the smaller embryonic DRG neurons actually had more newly synthesized mtDNAs per cytoplasmic volume.
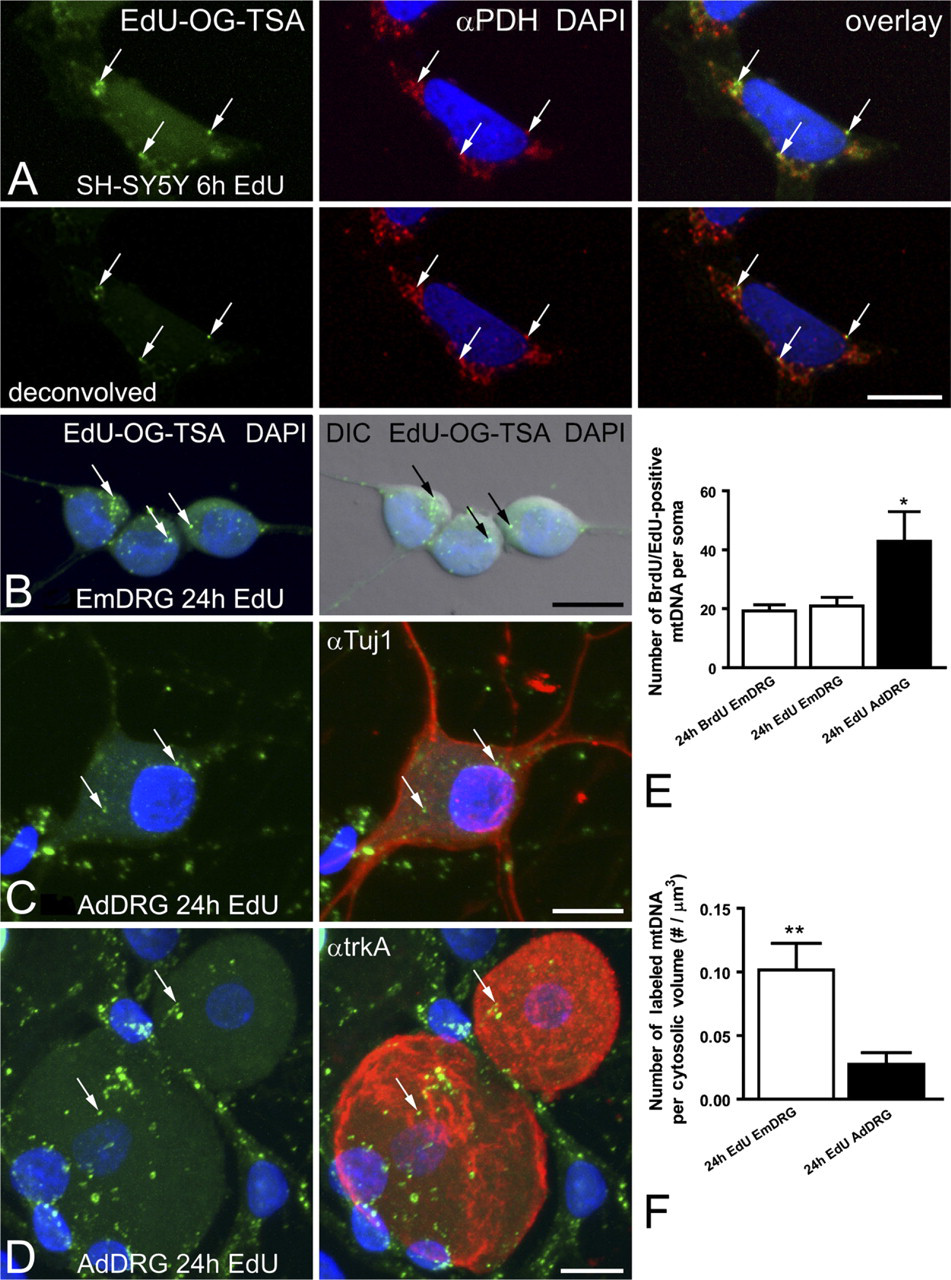
Amplified EdU signal in mtDNA is associated with mitochondria and other cell-specific markers.
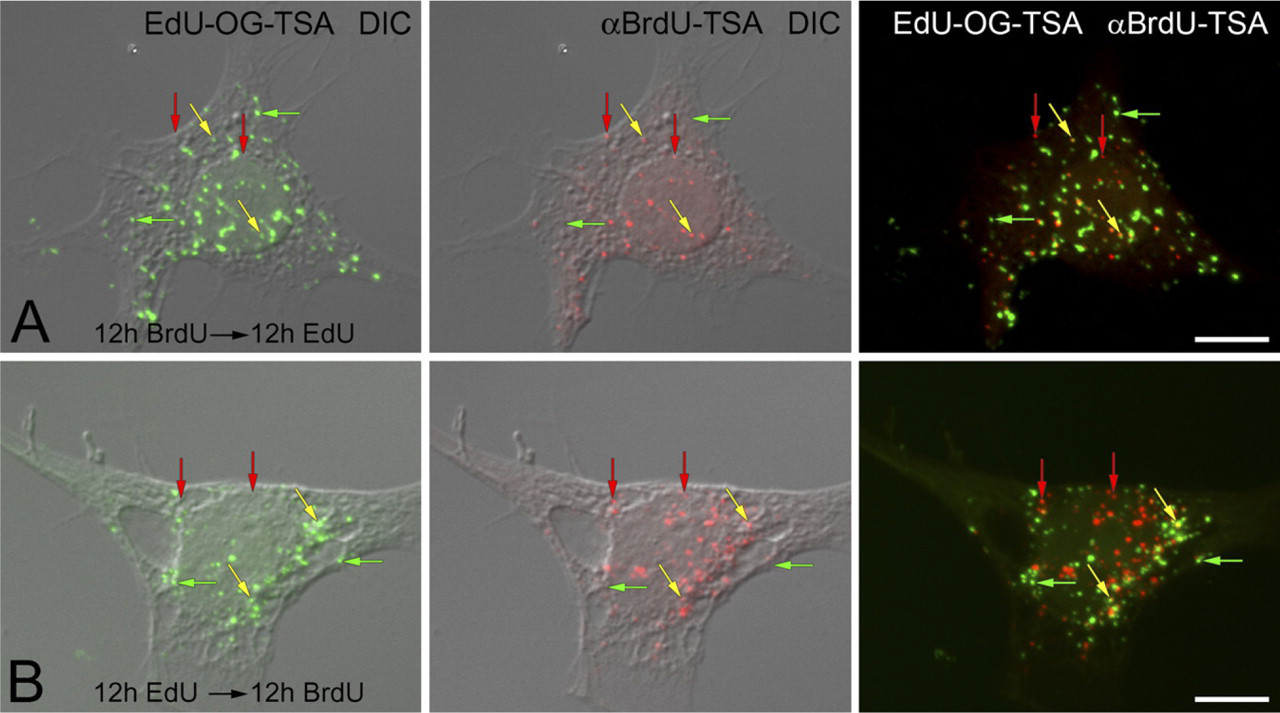
Sequential pulse labeling of mtDNA with BrdU and EdU. F11 neuroblastoma cells are sequentially incubated with BrdU or EdU for 12 hr and then switched to the other thymidine analog for an additional 12 hr. EdU (EdU-OG-TSA, green fluorophore) and BrdU (αBrdU-TSA, red fluorophore) are compared with cell morphology (DIC).
The ability to amplify and visualize both BrdU and EdU labels in mtDNA provides a powerful tool to conduct more sophisticated studies by pulse labeling cells with one thymidine analog and following it with a second pulse label. Cells were pulse labeled with BrdU for 12 hr, followed by a second pulse labeling with EdU for 12 hr. This procedure resulted in mtDNAs that were labeled with BrdU alone, EdU alone, or doubled labeled with both BrdU and EdU. Similar results were observed when EdU was pulsed prior to BrdU. This demonstrates that neither EdU nor BrdU interferes with subsequent mtDNA replication and that mtDNA containing one analog is able to incorporate a second analog. Additionally, the amplification protocols for BrdU and EdU can be performed in the same cells without inadvertently amplifying the EdU signal during the subsequent BrdU amplification step.
The utility of this signal amplification technique to visualize and measure newly synthesized mtDNA with EdU and BrdU at the cellular level will considerably advance experiments in our laboratory that examine the regulation of mitochondrial biogenesis in the context of diabetes and diabetic neuropathy, a common complication of diabetes. Studies are already under way in our laboratory to demonstrate that hyperglycemia induces an increase in the number of sites where BrdU is incorporated into mtDNA of DRG neurons (Edwards et al. 2010). The use of EdU as a marker for mtDNA replication and dual labeling mtDNA replication with BrdU and EdU will allow for pulse labeling paradigms to answer time course or subcellular compartmentalization questions that could not be addressed with a single label.
Footnotes
Acknowledgements
This work was supported by National Institutes of Health Grants NS-38849 and DK-076160, the Juvenile Diabetes Research Foundation Center for the Study of Complications in Diabetes, the Program for Neurology Research and Discovery and The A. Alfred Taubman Medical Research Institute at the University of Michigan. This work used the Morphology and Image Analysis Core of the Michigan Diabetes Research and Training Center, funded by National Institutes of Health Grant 5P60 DK-20572 from the National Institute of Diabetes and Digestive and Kidney Diseases.
The authors thank Dr. Kelli A. Sullivan for careful reading of the text and Scott T. Clarke from Molecular Probes/Invitrogen for his valuable advice on the various Click-iT EdU labeling kits and the generous donation of reagents to support the initial development of the EdU amplification technique.