
Abstract
A procedure for simultaneous quantification of DNA methylation of several genes in minute amounts of sample material was developed and applied to microdissected formalin-fixed and paraffin-embedded breast tissues. The procedure is comprised of an optimized bisulfite treatment protocol suitable for samples containing only few cells, a multiplex preamplification and subsequent locus specific reamplification, and a novel quantitative bisulfite sequencing method based on the incorporation of a normalization domain into the PCR product. A real-time PCR assay amplifying repetitive elements was established to quantify low amounts of bisulfite-treated DNA. Ten prognostic and diagnostic epigenetic breast cancer bio-markers (PITX2, RASSF1A, PLAU, LHX3, PITX3, LIMK1, SLITRK1, SLIT2, HS3ST2, and TFF1) were analyzed in tissue samples obtained from two patients with invasive ductal carcinoma of the breast. The microdissected samples were obtained from several areas within the tumor tissue, including intraductal and invasive carcinoma, adenosis, and normal ductal epithelia of adjacent normal tissue, as well as stroma, tumor infiltrating lymphocytes, and adipose tissue. Overall, reliable quantification was possible for all genes. For most genes, increased DNA methylation in invasive and intraductal carcinoma cells compared with other tissue components was observed. For TFF1, decreased methylation levels were observed in tumor cells.
Keywords
DNA
In cancer research, the development of laser micro-dissection (LMD) systems has addressed the dilemma that any analysis, irrespective if genomic, transciptomic, or proteomic, is susceptible to contamination by non-neoplastic cells. This contamination might mask tumor-specific alterations. Material resulting from LMD is suitable for a wide range of downstream applications such as loss of heterozygosity studies, gene expression analysis, and a variety of proteomic approaches (Esposito 2007). Despite all conceptional advantages of micro-dissected samples, the use of LMD is mostly limited to very specialized research questions that cannot be addressed by alternative procedures. The main reasons are that LMD is time consuming, labor intensive, and usually yields only tiny amounts of highly specific analytes. Hence, for DNA analysis, only a limited amount of template DNA can be expected from these sample types. This amount is further correlated to the size of the microdissected areas, which defines the resolution of the method for elucidating the biological heterogeneity within a tumor. An additional challenge has been encountered for samples from formalin-fixed and paraffin-embedded tissues (FFPETs), which often contain fragmented DNA of poor quality for molecular biological applications such as PCR (Srinivasan et al. 2002). Because of these limitations, only a limited number of studies have been published describing high-resolution DNA methylation analysis within tumor tissues (Hui et al. 2000; Cui et al. 2001; Umbricht et al. 2001; Lehmann et al. 2002; Nakayama et al. 2003; Lodygin et al. 2004; Woodson et al. 2004; Di Vinci et al. 2005; Greenspan et al. 2006; Hanson et al. 2006; Henrique et al. 2006; Yan et al. 2006; Aitchison et al. 2007; Rodriguez-Canales et al. 2007). However, these studies either allowed only for a qualitative analysis of the presence of methylated DNA or they required a high number of microdissected cells (usually >1000 cells) to analyze a single or only a few biomarkers.
The analysis of DNA methylation using sequencing requires an additional bisulfite conversion step, which results in deamination of all unmethylated cytosines to uracil, leaving only methylated cytosines unaltered (Frommer et al. 1992). Bisulfite treatment has been reported to cause DNA loss because of degradation under harsh chemical conditions (Tanaka and Okamoto 2007) and the requirement for an additional purification step. Genome-wide amplified DNA is a suitable template for many applications (i.e., single nucleotide polymorphism analysis) (Paez et al. 2004). However, until now, no genome-wide DNA amplification method retaining CpG methylation has been reported. Genome-wide amplification of bisulfite-treated DNA using degenerated primers (Yang et al. 2007) is hampered because of the fragmented template derived from the bisulfite treatment and the fixation of the tissue. Thus, quantitative DNA methylation analysis in minute amounts of material, in particular from FFPETs, represents a challenge.
To overcome the limitations described above, a procedure for analyzing several biomarkers simultaneously and quantitatively in a very small number of cells is reported herein. This procedure combines an optimized protocol for bisulfite treatment of minute amounts of template DNA with a multiplexed preamplification of all loci of interest in parallel, followed by a separate reamplification of the single loci. To improve quantitative analysis, a novel method for quantitative bisulfite sequencing based on the Sanger method was developed. This quantitative bisulfite sequencing method is based on the incorporation of a domain into the PCR product, which is subsequently used for signal normalization.
Furthermore, a quantitative real-time PCR based on the amplification of a repetitive element was established, which allows for the accurate quantification of minute sample amounts on a single copy level. Such an assay is needed to exclude samples that only contain single copies of the human genome and that therefore might not yield a biologically reasonable result.
The developed procedure was applied to analyze the methylation of 11 loci quantitatively in microdissected cells from FFPET from two cases of invasive ductal carcinoma of the breast. From these two cases, 54 tissue areas with different cell components, including ductal carcinoma in situ (DCIS), invasive ductal carcinoma (IDC), normal ducts, adenosis, stroma, adipose tissue, and tumor infiltrating lymphocytes (TILs), were micro-dissected and analyzed.
Besides the known methylation biomarkers PITX2, PLAU, TFF1, RASSF1A, LIMK1, SLIT2, SLITRK1, and HS3ST2 (Foekens et al. 1990; Schwartz et al. 1991; Martin et al. 1995; Ruibal et al. 1999; Bae et al. 2004; Muller et al. 2004; Pakneshan et al. 2004, 2005; Shinozaki et al. 2005; Hoque et al. 2006; Lesche et al. 2006; Maier et al. 2007; Nimmrich et al. 2008), the promoter regions of the genes LHX3 and PITX3 were analyzed. These genes show high sequence similarity to, or are potentially regulated by, PITX2 (Charles et al. 2005). Within the PITX2 gene, two alternative promoters that regulate the transcript variants A and B (promoter A) and variant C (promoter C) were studied.
Materials and Methods
Patients and Tissue
Tissue specimens from 13 breast cancer patients diagnosed at the Institute of Pathology, Charité University Hospital, Berlin, Germany, were analyzed for this study. Appropriate consent was obtained from all patients.
LMD and Lysis
Three-μm sections were prepared from FFPETs for subsequent LMD sample preparation. Sections were mounted on membrane-covered slides (Leica Microsystems; Wetzlar, Germany) and briefly stained with hematoxylin. Two-μm reference sections were prepared from the same block and stained with hematoxylin and eosin. LMD was performed using a Leica Microsystems device. Microdissected samples were captured in caps of 500-μl PCR tubes filled with 25 μl lysis buffer [50 mM Tris-HCl, pH 8, 1 mM EDTA, 0.5% (v/v) Tween 20 (Sigma-Aldrich; St. Louis, MO), 10 ng/μl poly-dA (Roche; Basel, Switzerland), and 3 g/liter proteinase K (Carl Roth; Karlsruhe, Germany)]. LMD samples were centrifuged briefly and incubated at 60C for 8 hr. Two μl proteinase K solution (300 g/liter) was added, and the samples were incubated for another 4 hr at 60C.
DNA from non-dissected tissue sections was prepared as follows: three sections (10 μm each) were transferred into a 2-ml tube and spun down (5 min at 16,000 × g). On hundred ninety μl lysis buffer was added, and the sections were incubated for 10 min at 65C and 1000 rpm in a thermomixer. Ten μl proteinase K solution (30 g/liter) was added, and the samples were incubated for 24 hr at 60C and 1000 rpm in a thermomixer.
DNA Preparation, Bisulfite Conversion, and Purification
Bisulfite-treated reference DNA for quantitative realtime PCR was prepared as previously described (Tetzner et al. 2007). Two μg human genomic DNA from whole blood (Promega; Madison, WI) was applied to the bisulfite reaction and subsequently quantified by UV spectrophotometry using a Nanodrop ND-1000 spectral photometer (Nanodrop Technologies; Wilmington, DE).
Unmethylated DNA was prepared by multiple displacement amplification (MDA), a genome-wide amplification method (Dean et al. 2002). For the preparation of MDA DNA mixtures with defined methylation ratios, a portion of this amplificate was treated with SssI methyltransferase (New England Biolabs; Ipswich, MA) in the presence of S-adenosyl-methionine, according to the manufacturer's instructions, and mixed with the unmethylated amplificate to give mixtures with 0%, 5%, 10%, 25%, 50%, 75%, and 100% methylation. Two μg of each of these mixtures was bisulfite treated using the EpiTect kit (Qiagen; Hilden, Germany).
DNA from washed research sperm (NW Andrology and Cryobank; Spokane, WA) was extracted using the QIAamp DNA Mini Kit (Qiagen). Artificially methylated sperm DNA was prepared using SssI methyltransferase as described above. Bisulfite treatment of sperm and artificially methylated sperm DNA was done using the EpiTect kit. Mixtures of bisulfite-treated sperm DNA and bisulfite-treated artificially methylated sperm DNA were prepared (ratios of 0%, 25%, 50%, 75%, and 100%).
Bisulfite-converted DNA from whole tissue sections was prepared by applying 20 μl lysate (see above) directly to the EpiTect kit protocol. The preparation was done according to the manufacturer's instructions (FFPE tissue protocol), with the following modifications: the bisulfite reaction mixture was mixed with 310 μl buffer BL and 250 μl ethanol (99.9%) before the transfer to the EpiTect spin column.
The DNA concentration of MDA DNA mixtures, mixtures of sperm and artificially methylated sperm DNA, and DNA from whole tissue sections was determined using the MER9 long terminal repeat (LTR) quantification assay as described below.
Bisulfite treatment of LMD samples was performed in 500-μl PCR tubes with the following composition: 20–25 μl tissue lysate, 38 μl dissolved bisulfite mix (from EpiTect kit), and 6 μl diethylene glycol dimethyl ether (Merck; Darmstadt, Germany) containing 125 g/liter Trolox (Sigma-Aldrich). The reaction mixture was incubated for 5 min at 99C, 22 min at 60C, 3 min at 99C, 87 min at 60C, 3 min at 99C, and 177 min at 60C in a PCR cycler. Purification of the DNA was achieved using Zymo-Spin IC silica membrane columns (Zymo Research; Orange, CA). One hundred sixty-six μl buffer AVL containing poly-A (both Qiagen) and the reaction mixture was transferred to the column. The empty bisulfite reaction tube was washed with 90 μl buffer AVL, which was subsequently transferred to the spin column. The mixture on the column was mixed properly and incubated for 10 min at room temperature. Two hundred fifty μl ethanol (99.9%) was added to the column. The column was vortexed briefly and centrifuged for 2 min at 16,000 × g. The column was transferred into a new collection tube (Qiagen), loaded with 500 μl buffer BD (from EpiTect Kit), and centrifuged 2 min at 16,000 × g. The column was transferred into a new collection tube, and the bound DNA was washed consecutively with 500 μl buffer AW1 and AW2 (both Qiagen). Each buffer was removed by spinning the columns 2 min at 16,000 × g, and the respective collection tube was discarded. Finally, the column was centrifuged again for 2 min at 16,000 × g without buffer to completely remove the wash buffer. Bisulfite-converted DNA was eluted into a 1.5-ml tube using 12.5 μl water (preheated to 50C). After incubation for 1 min at room temperature, the DNA was eluted by centrifugation for 1 min at 6000 × g. The elution step was repeated once. The total eluate was transferred into a 200-μl PCR tube. The empty 1.5-ml elution tube was washed with 22 μl water, which was also transferred to the PCR tube. One μl of eluted DNA from LMD samples was applied to the MER9 LTR realtime PCR quantification (as described below).
PCR Amplification
Multiplexed PCR preamplification of bisulfite DNA was performed in a 50-μl reaction volume in the presence of 2 U HotStar Taq polymerase (Qiagen), 1 × PCR buffer (Qiagen), 0.2 mM each dNTP (dGTP, dATP, dCTP, dTTP; Fermentas, Burlington, Canada), and 0.05 μM each of the 22 primers (Table 1). This pre-amplification product (0.5 μl) was applied to further PCR reamplification of each single locus. Reamplification was done in a 25-ml scale (1 U HotStar Taq polymerase, 1 × PCR buffer, 0.2 mM each dNTP, 0.5 μM both primers). Amplifications were performed using the following temperature profile: 15 min at 95C and 50 (preamplification) and 45 cycles (reamplification), respectively, with 20 sec at 95C, 45 sec at 58C, and 30 sec at 72C per cycle.
Quantitative Real-time PCR Methylation Analysis (QAMA Assay)
QAMA (Lehmann et al. 2002; Lehmann and Kreipe 2004; Zeschnigk et al. 2004) analysis of sample DNA was done in 20-μl volumes with the following composition: 20 ng bisulfite DNA, 1 × PCR buffer with passive ROX reference (Eurogentec; Seraing, Belgium), 1 U HotGoldStar Taq polymerase (Eurogentec), 0.2 mM each dNTP (dTTP, dATP, dGTP, and dCTP; Fermentas), 0.6 μM each primer, and 0.2 μM each detection probe. The MgCl2 concentration varied between the different assays (3.5 mM for TFF1 and 3 mM for PITX2 and PLAU). The following primers and detection probes were used: PITX2 promoter A, GTAGGGGAGGGAAGTAGATGTT (forward primer), TTCTAATCCTCCTTTCCACAATAA (reverse primer), 6-FAM-AGTCGGAGTCGGGAGAGCGA-BHQ1 (detection probe for methylated DNA), and HEX-AGTTGGAGTTGGGAGAGTGAAAGGAGA-BHQ1 (detection probe for unmethylated DNA); TFF1, GATGGTATTAGGATAGAAGTATTA (forward primer), CCCTCCCAATATACAAATAAAAACTA (reverse primer), 6-FAM-CACCGTTCGTAAAATCC-BHQ1 (detection probe for methylated DNA), and HEX-ACACCATTCATAAAATCCCCTAAT-BHQ1 (detection probe for unmethylated DNA); and PLAU, GTTTTTTTTAAATTTTTGTGAG (forward primer), CCTCCCCTATCTTACAA (reverse primer), 6-FAM-ACCCGAACCCCGCGTACTTC-BHQ1 (detection probe for methylated DNA), and HEX-ACCCAAACCCCACATACTTCCACA-BHQ1 (detection probe for unmethylated DNA).
Sequences of preamplification and sequencing primers
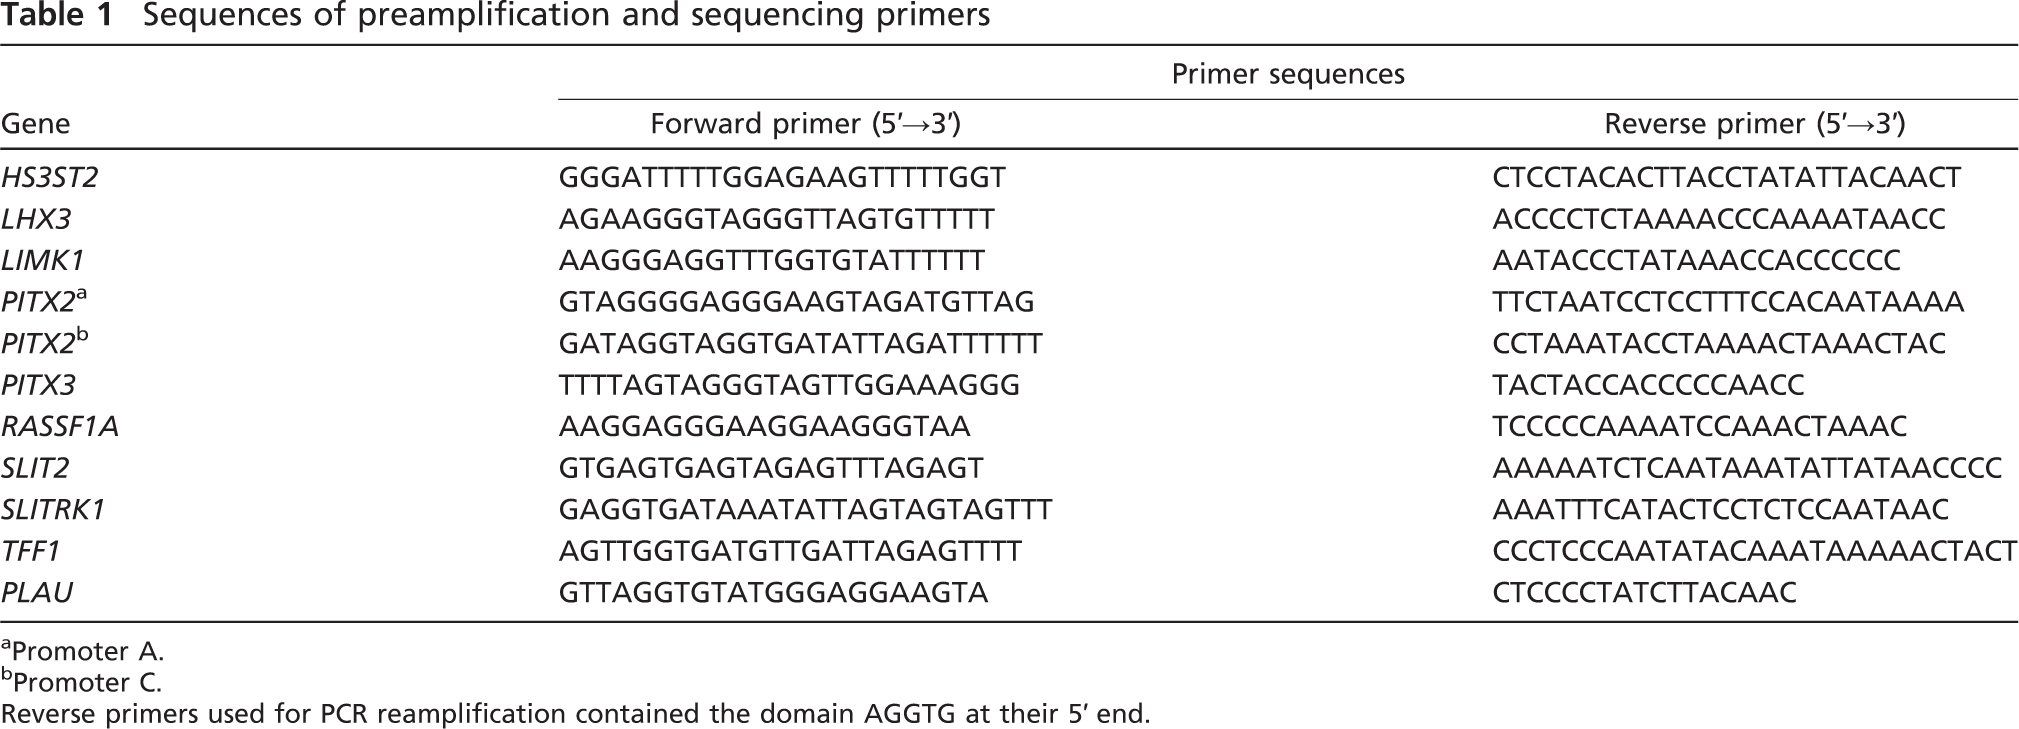
Promoter A.
Promoter C.
Reverse primers used for PCR reamplification contained the domain AGGTG at their 5′ end.
PCR was performed using a 7900HT Fast Real-Time PCR system (Applied Biosystems; Foster City, CA) using the following temperature profile: 10 min at 95C and 45 cycles with 15 sec at 95C and 60 sec at 60C (PLAU), 62C (PITX2), or 58C (TFF1), respectively. Methylation scores were calculated as previously described (Lehmann and Kreipe 2004).
Real-time PCR Quantification of Bisulfite-converted DNA From Microdissected Samples (MER9 LTR Assay)
Real-time PCR quantification of small sample amounts was done in 20-μl volumes with the following composition: 1 × PCR buffer with passive ROX reference (Eurogentec), 1 U HotGoldStar Taq polymerase (Eurogentec), 0.2 mM each dNTP (dTTP, dATP, dGTP, and dCTP, Fermentas), 4 mM MgCl2 (Eurogentec), 0.6 μM each primer (forward: GGTTTTATAGTTTTTAGAGTTGAGAGTT, reverse: CATCCCTTCTTTTCCCATAA), and 0.2 μM detection probe (HEX-AATACTAATAACTAACTTACTATTAAT-BHQ1). The detection probe contained modified cytidines (LNA). PCR was performed using a 7900HT Fast Real-Time PCR system (Applied Biosystems) using the following temperature profile: 10 min at 95C and 45 cycles with 15 sec at 95C and 45 sec at 60C.
Sequencing and Raw Data Processing
ExoSAP-IT (1.5 μl; GE Healthcare, Chalfont St. Giles, UK) was added to 3.5 μl of PCR product and incubated for 45 min at 37C and 15 min at 95C. Cycle sequencing was performed in a total volume of 20 μl with the following composition: 5 μl ExoSAP-IT digested PCR product, 1 μl BigDye Terminator v3.1 (Applied Biosystems), 4 μl buffer [320 mM Tris-HCl, pH 9, 6 mM MgCl2, 10% (v/v) Sulfolan (Merck)], 5 μl dNTP mixture (0.02 mM dATP, dGTP, dCTP, and dTTP each), and 0.5 μM sequencing primer. The reaction was incubated for 2 min at 96C and 25 cycles with 30 sec at 96C, 15 sec at 55C, and 4 min at 60C in a thermocycler MultiCycler PTC 225 Tetrad (Bio-Rad Laboratories; Hercules, CA). The cycle sequencing product was purified using the DyeEx 96 kit (Qiagen) according to the manufacturer's recommendations. Ten μl Hi-Di form-amide (Applied Biosystems) was added to the cycle sequencing product, which was subsequently analyzed using the 3730 DNA Analyzer (Applied Biosystems). ABI sequencing electropherograms were converted to .txt files using BioEdit 6.0.7 software (Isis Pharmaceuticals; Carlsbad, CA) and imported into a spreadsheet. The trace containing the methylation information was visualized, and the normalization signal was identified. For all samples, electropherograms were aligned using the normalization signals in the primer tails. The signals were normalized by integrating the signals of the normalization tail and by dividing each data point of the electropherogram by this reference value. The signals of the CpG sites of completely methylated DNA were used as a reference to identify the CpG positions in the LMD samples. The maximum intensity in the region ± 30 data points from the respective peak in the reference trace was defined as methylation peak maximum in the LMD sample. Thirty data points surrounding each identified peak maximum within each trace were integrated to obtain the methylation score for the respective CpG.
Results
The optimized workflow for DNA methylation analysis of multiple genes in microdissected cells from FFPETs is summarized in Figure 1. Besides the sample lysis, bisulfite conversion, and the subsequent purification, the workflow is comprised of the steps as described in the following paragraphs.
Quantification of Minute DNA Amounts
As a prerequisite for analyzing small amounts of DNA, a real-time PCR assay, which allows for accurate quantification of the human bisulfite genome down to single copy level, was developed. This real-time assay enables the exclusion of samples that only contain single copies of the human genome. These single copies might not be representative for the sample and therefore would not result in biologically reasonable results. The developed assay is based on the amplification of the LTR MER9. Because this sequence is represented on multiple loci within the human genome, only a portion of the genome is needed as a template for real-time PCR quantification. The response curve of this assay is shown in Figure 2. The assay is highly precise when applying between 1 and 12,500 copies of the bisulfite genome.
Multiplex PCR Pre- and Reamplification
Because LMD samples yield only very limited amounts of template DNA, a multiplex preamplification PCR protocol was established. All gene-specific primers were used in one PCR reaction and under stringent conditions (low primer and MgCl2 concentration, high annealing temperature) to avoid the formation of side products. The preamplification product was used as a template for the subsequent amplification of each single locus in separate PCRs.
Quantitative Bisulfite Sequencing
During the locus-specific reamplification PCR, a normalization signal was incorporated into the PCR product using modified primers. This normalization signal enables the accurate quantification of the methylation level of the respective locus in a given sample. After bisulfite treatment, the converted DNA contains cytosines only at positions that were originally methylated (Figure 3I). The converted DNA is amplified using reverse primers containing guanosines at their 5′ end, leading to an incorporation of cytosines into the PCR product (Figure 3II). These additional cytosines at the 3′ end of the PCR product are present in each PCR product molecule (Figure 3III) and can be used for methylation signal normalization.
The measurand received after signal normalization is a normalized peak area. A calibration curve is needed to obtain a percentage of methylation from such normalized peak areas. Mixtures from genome-wide amplified DNA (MDA DNA) and artificially methylated MDA were used for calibration (data not shown).
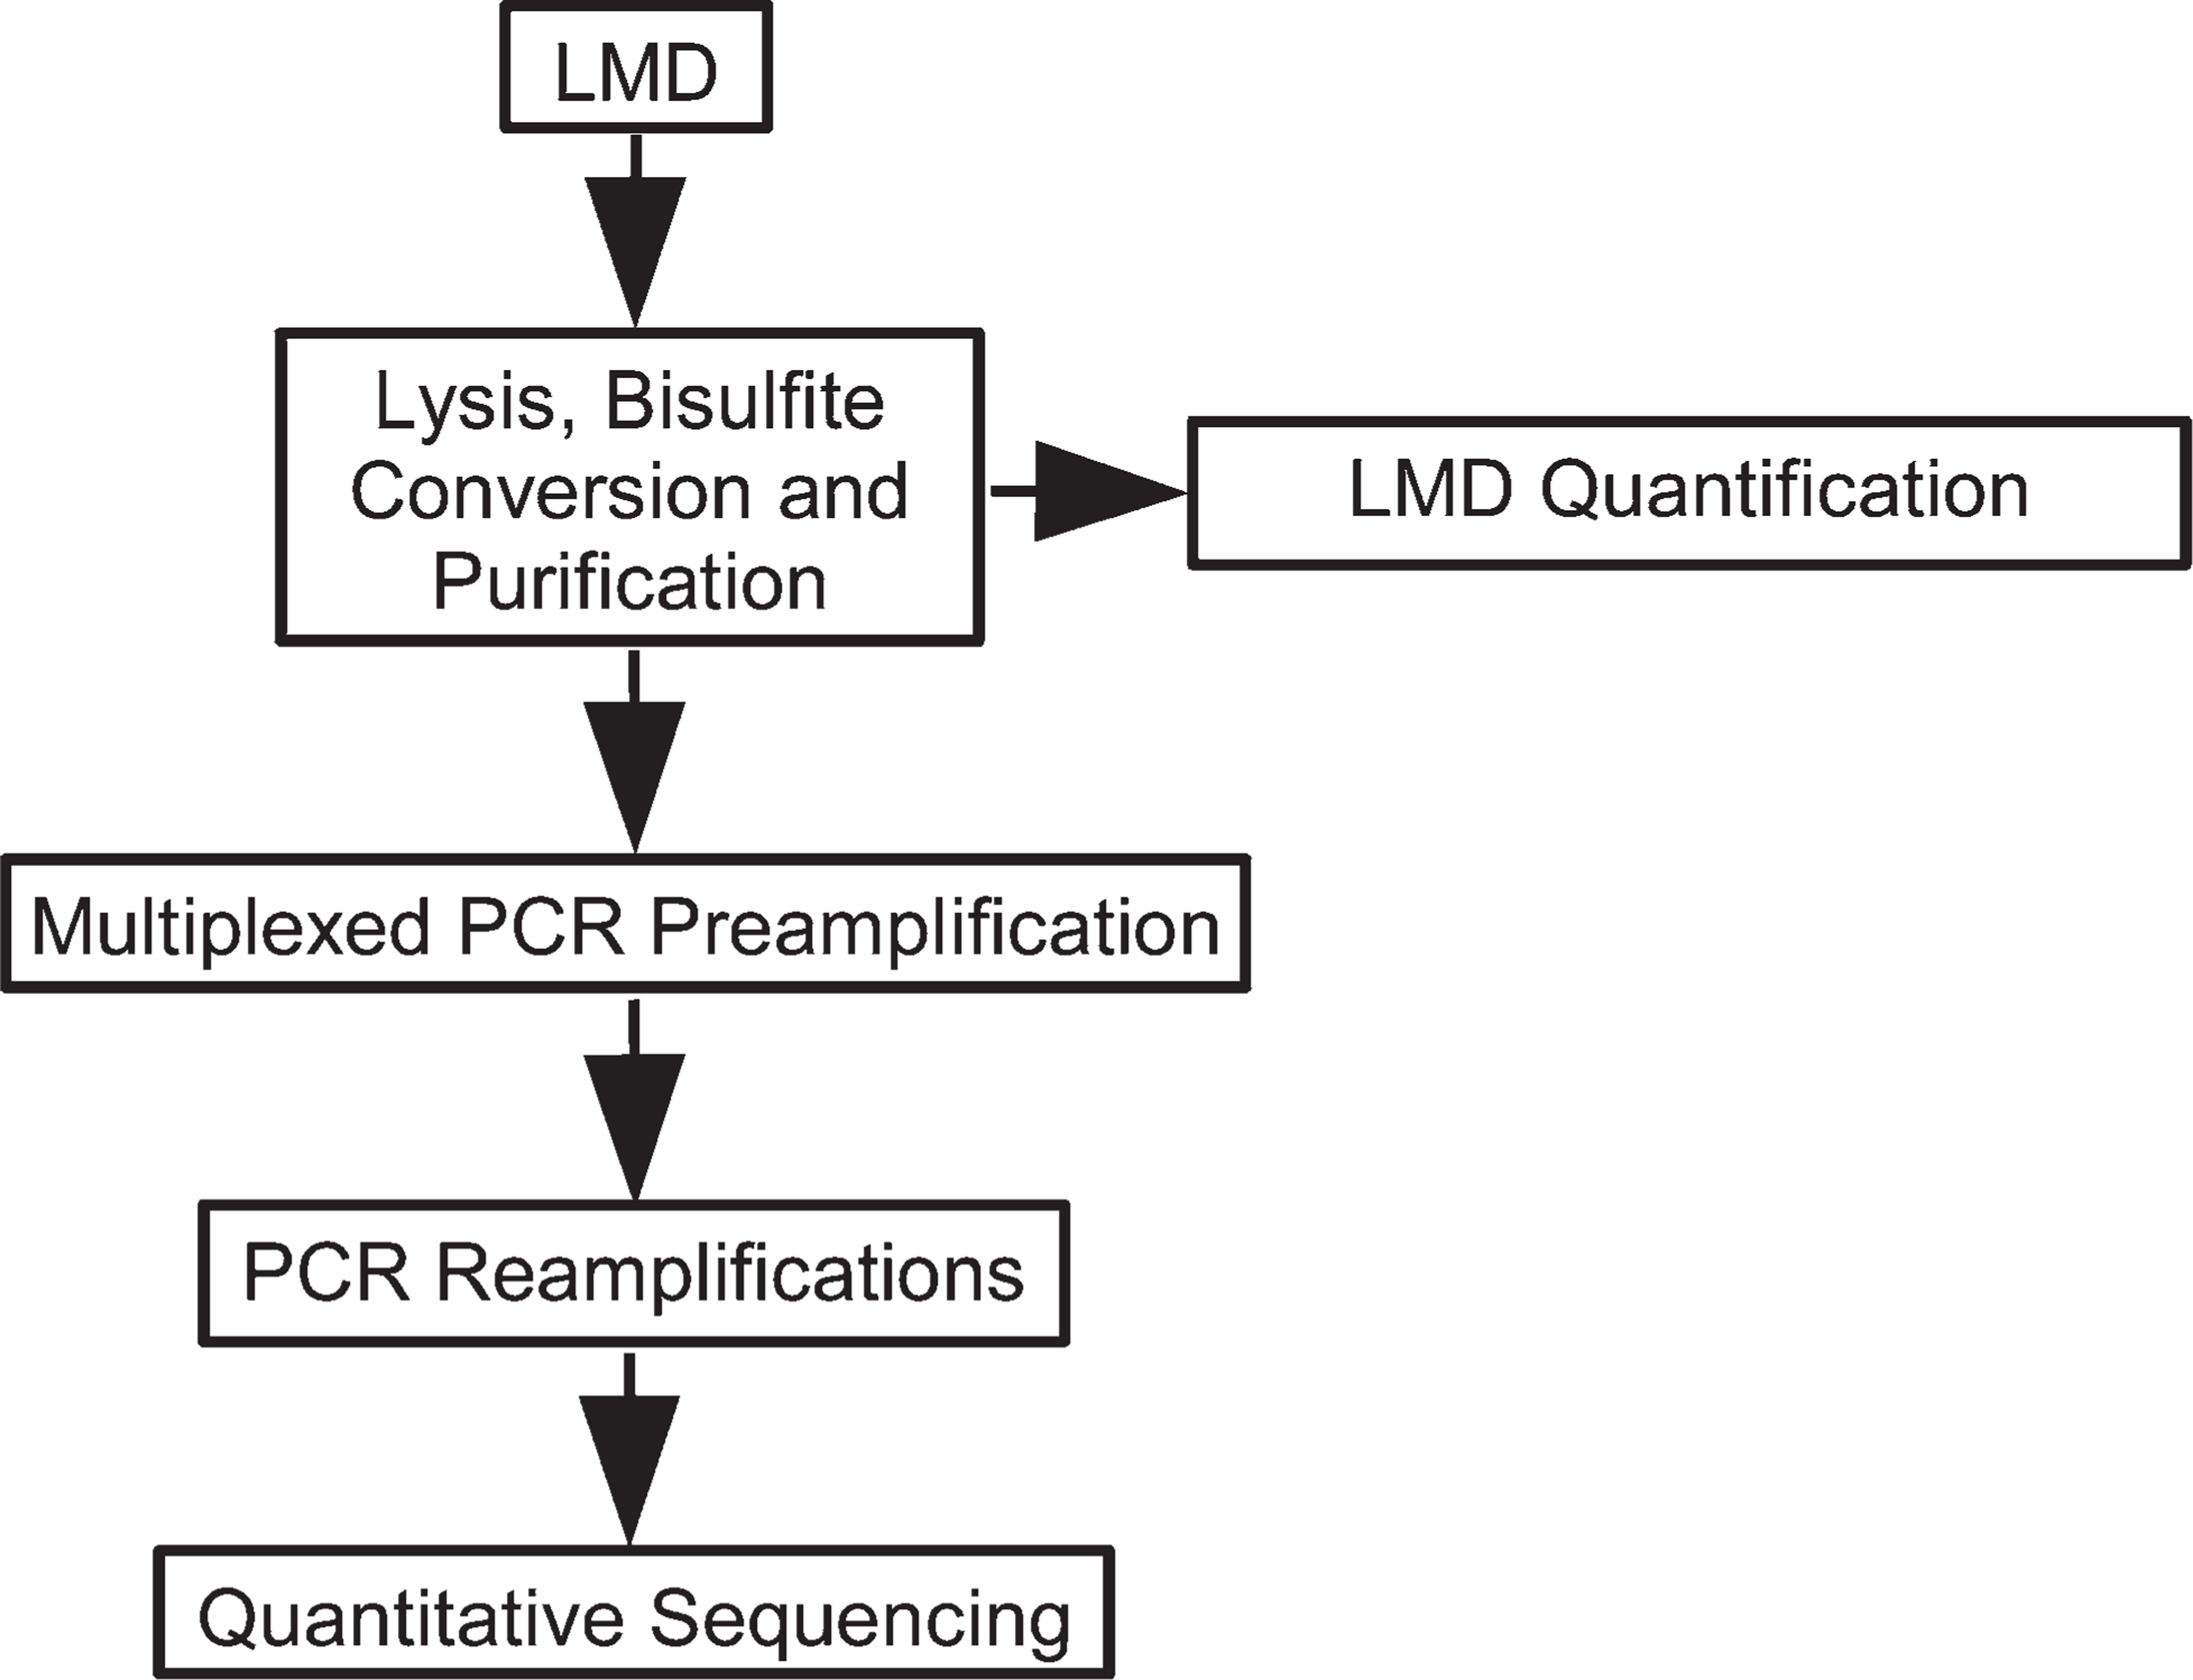
Flowchart of the procedure for analysis of DNA methylation in laser microdissection (LMD) samples.
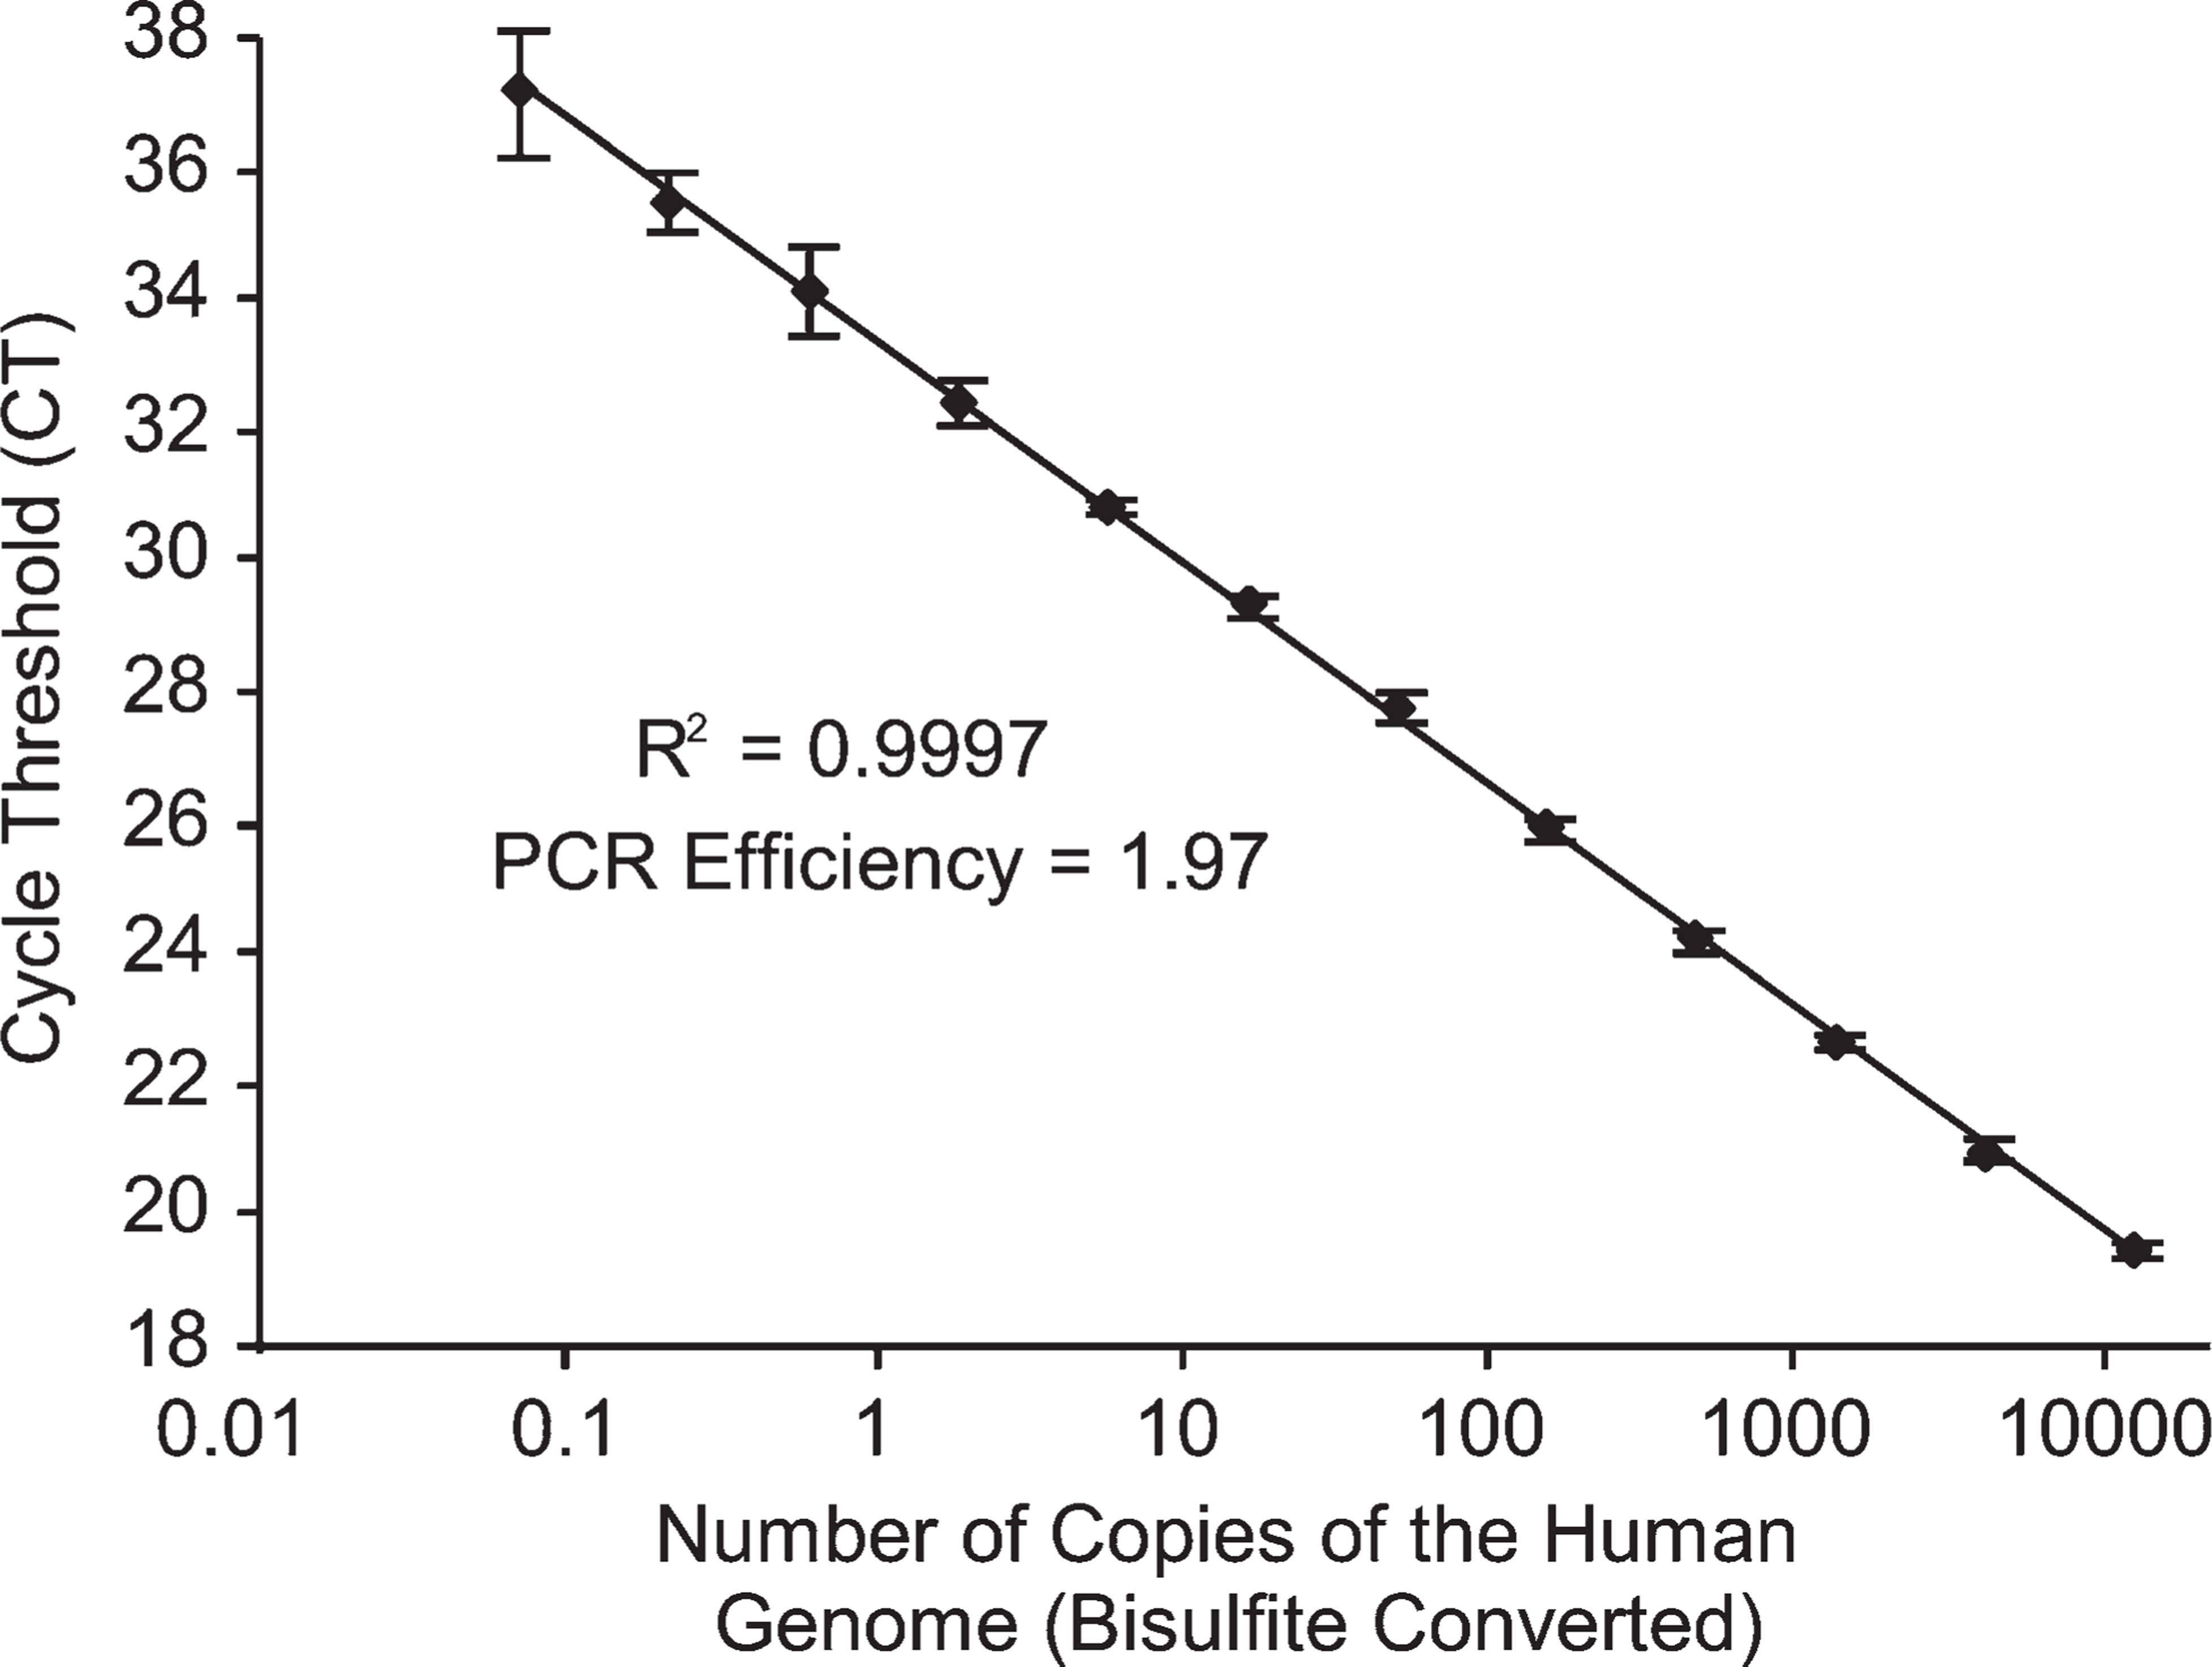
Response curve of the MER9 long terminal repeat (LTR) quantification assay in the range of 12,500-0.07 copies of the human genome (bisulfite converted). Shown are means of six replicates ± SD.
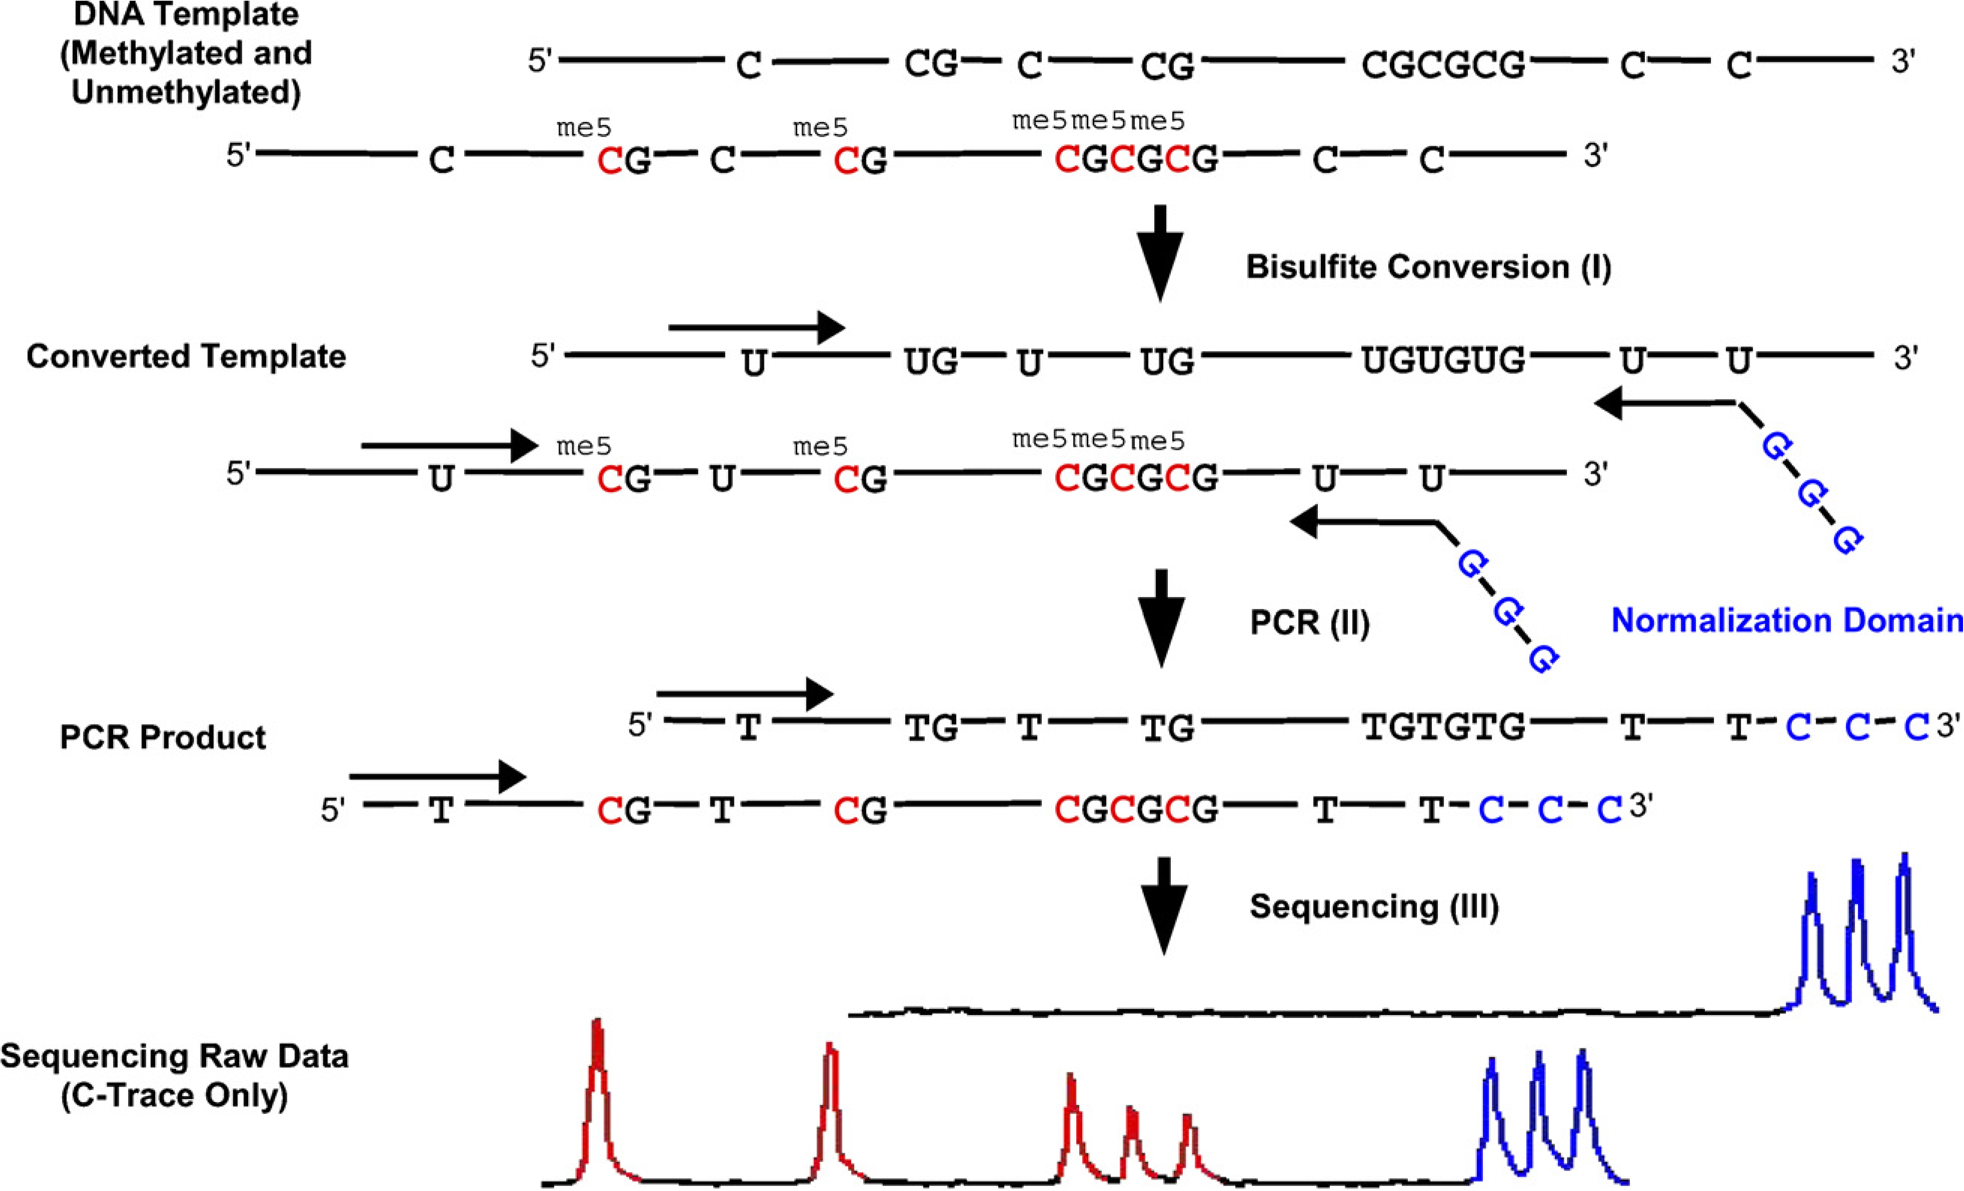
Principle of the quantitative bisulfite sequencing method using a normalization domain. (
To confirm the results of the quantitative sequencing method, an independent technology, the real-time PCR based QAMA technology (Lehmann et al. 2002; Lehmann and Kreipe 2004; Zeschnigk et al. 2004), was used as a comparative methodology. DNA preparations from 13 FFPET breast tumor specimens were analyzed for three loci (PITX2 promoter A, PLAU, and TFF1) to evaluate the procedure using samples that fully reflect the DNA quality that is to be expected in LMD sample material from FFPET. The results obtained by quantitative sequencing and from QAMA assay analysis showed high concordance (Figure 4), thus showing that FFPET samples can be analyzed reliably.
Workflow Verification for Minute DNA Amounts
The capability of the procedure to analyze 11 loci in as few as 100 diploid cells was tested. Methylation mixtures representing the DNA equivalent of 100 cells (660 pg) were applied to the multiplex PCR preamplification reaction. The mixtures were prepared from sperm DNA and artificially methylated sperm DNA (ratios of 0%, 25%, 50%, 75%, and 100%). The input amount of 660 pg was confirmed using the MER9 LTR quantification assay. As shown in Figure 5, the normalized intensities for most loci correlated well with the methylation mixtures. Two loci (LIMK1 and TFF1) were found to be extensively methylated in sperm DNA and thus could not be evaluated. The analysis of some loci (i.e., LHX3, PLAU) showed a deviation from linearity, which might indicate a weak PCR bias (i.e., preferred amplification of methylated DNA).
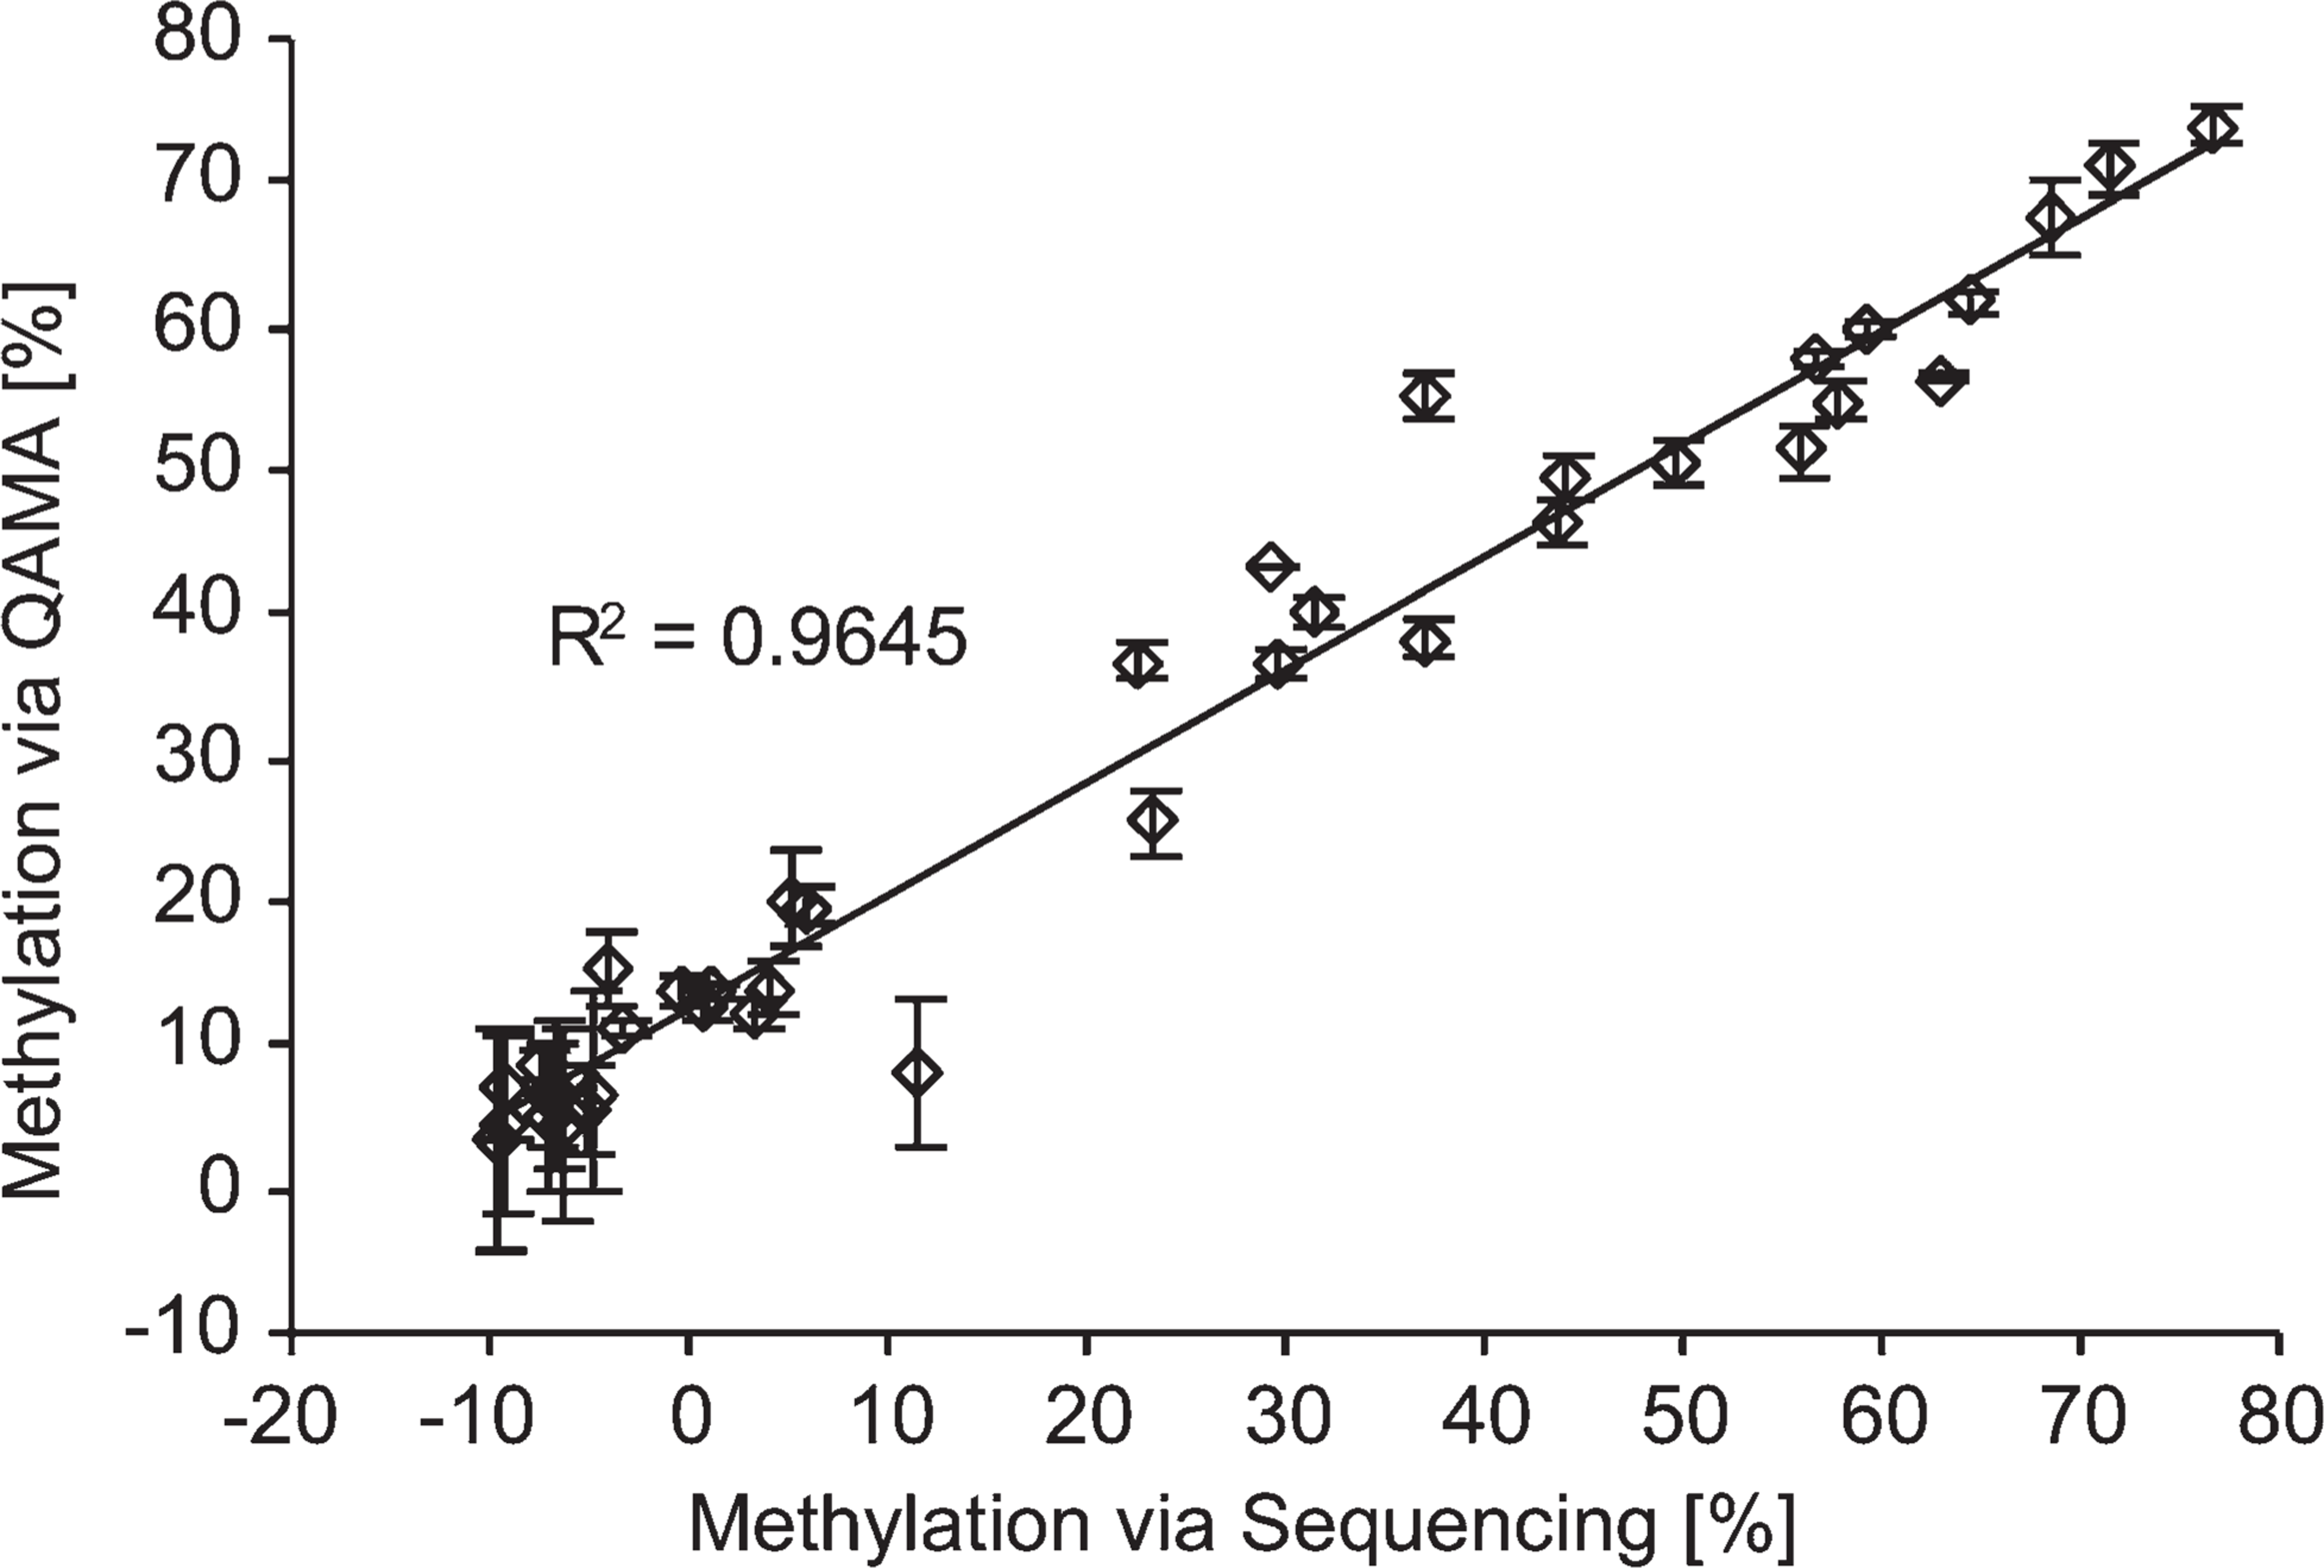
Correlation of methylation results determined by quantitative sequencing and quantitative real-time PCR methylation analysis (QAMA assay), respectively. Shown are results from three loci (PITX2 promoter A, PLAU, and TFF1) in 13 breast cancer tumors. y-axis, means of triplicate QAMA measurements ± SD; x-axis, quantitative sequencing (single measurement).
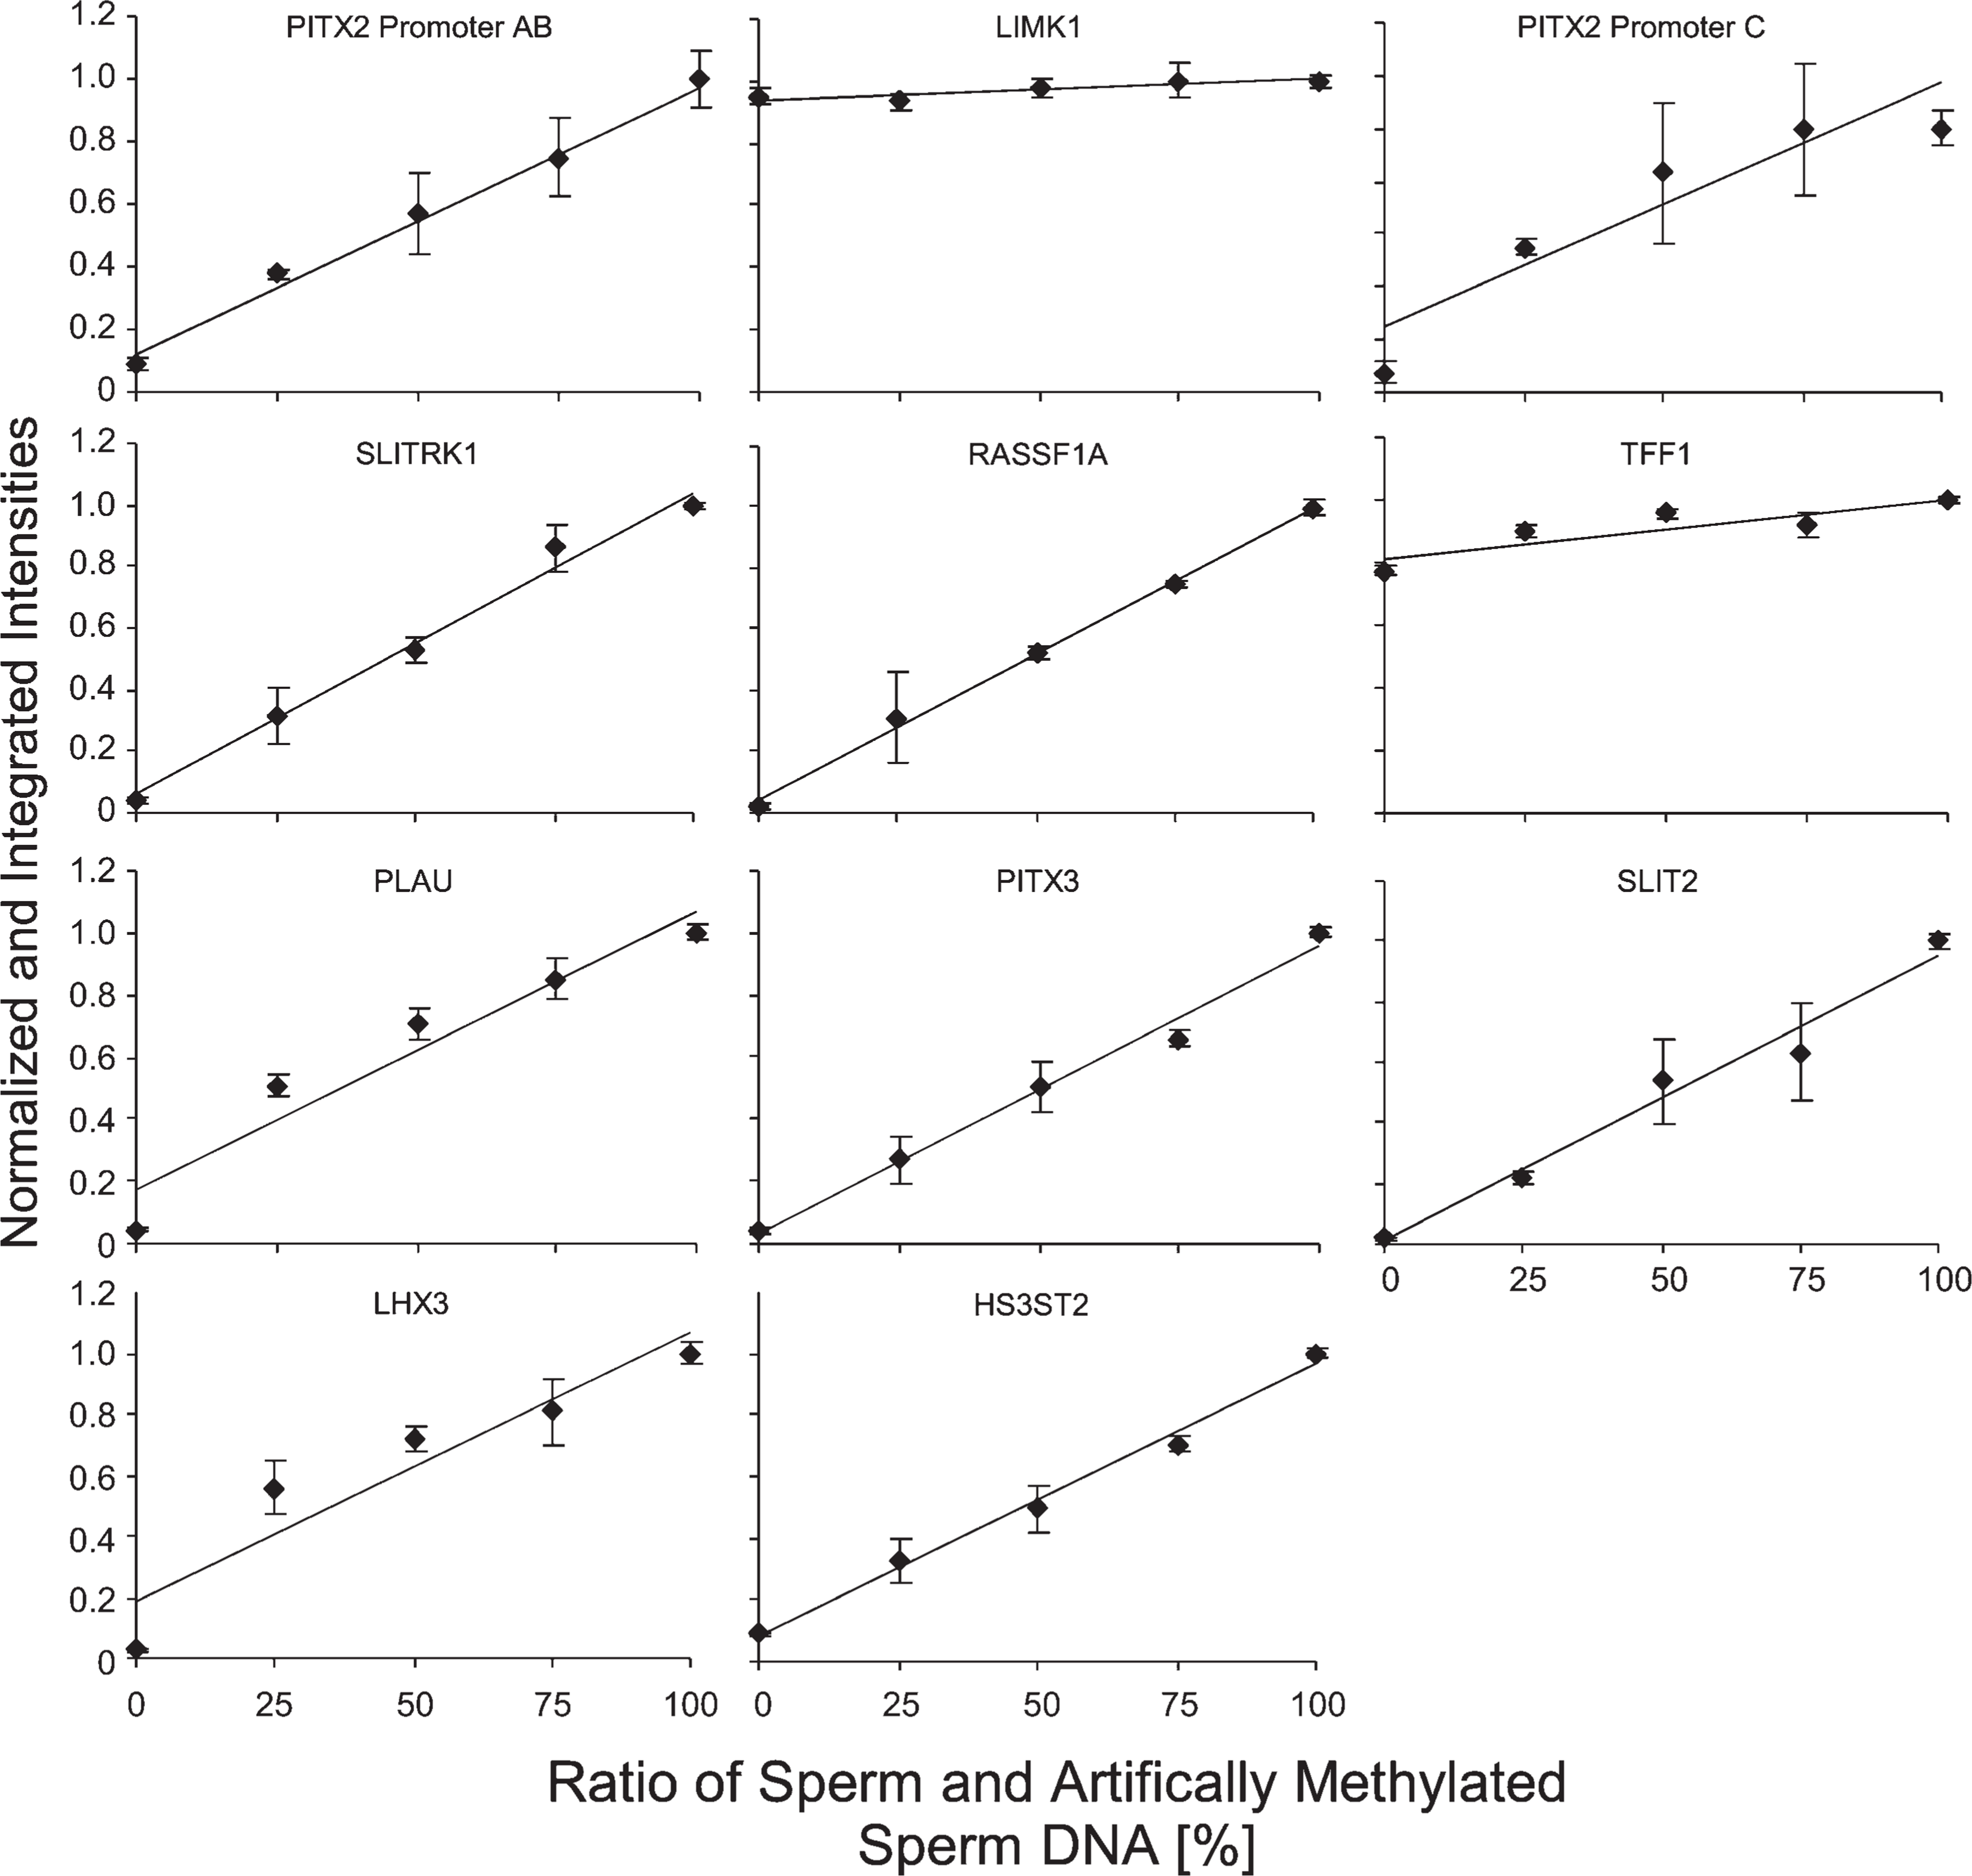
Results of QAMA for 11 loci from a total DNA equivalent of 100 diploid cells processed using the described procedure (starting with multiplex PCR preamplification). Mixtures of bisulfite-converted DNA from sperm and artificially methylated DNA from sperm were analyzed. Shown are means (±SD) of three independently processed replicates. Note that LIMK1 and TFF1 extensive methylation was found in sperm; therefore, it is not possible to use this material to evaluate the dose-response characteristics.
Analysis of Clinical LMD Samples
From the series of 13 cases, 2 breast cancer cases with vidence of elevated PITX2 methylation in whole tissue lysates were selected for microdissection. Hematoxylin and eosin-stained reference sections were used to identify the cells of interest (Figure 6). A total of 54 histologically defined tissue compartments (10 DCIS, 12 IDC, 4 adenosis tissues, 11 normal ducts, 8 stroma, 6 TILs, and 3 adipose tissue) were obtained by laser microdis-section from six paraffin blocks. The 54 LMD samples yielded on average 207 amplifiable copies of the human genome after bisulfite conversion as measured with the MER9 LTR assay. Eight LMD samples, mainly cells isolated from stroma and normal ducts, had to be excluded because of low template amount (<25 genome copies). The methylation levels of the samples that passed the quality control procedure are depicted in Figures 7 and 8. The methylation of the genes PITX2 (promoters A and C), PLAU, and LHX3 showed a similar distribution between the different tumor components (Figure 7). These genes exhibit elevated methylation in IDC and DCIS compared with normal ducts, adenosis tissue, stroma, and TILs. PITX3 was methylated similarly to these genes in samples from patient A but showed no methylation in samples from patient B. The gene TFF1 showed inverse methylation patterns compared with the other genes: low methylation levels in tumor cells (DCIS and IDC) and higher levels in other tumor components. Although the differences in methylation between these cellular components were found to be relatively high for both promoters of PITX2, the differences for LHX3 and PITX3 are much smaller. In addition, a methylation difference between normal ducts and TILs on the one hand and stroma and adipose tissue on the other hand was observed. This is most notable in patient B, where LHX3 showed higher methylation in TILs and normal ducts compared with adipose tissue and stroma. Again, TFF1 showed inverse methylation in these groups. PITX2 (promoter A) also showed increased methylation in TILs compared with adipose tissue and stroma in patient B. DCIS and IDC showed no difference in methylation; the same holds for normal ducts and adenosis tissue. Overall, the methylation among one cell type from the same patient was homogeneous and did not vary between blocks, whereas the methylation of the same cell type differed between patients A and B, i.e., PITX2 (both promoters), LHX3, and PLAU were more highly methylated in DCIS and IDC from patient A than from patient B.
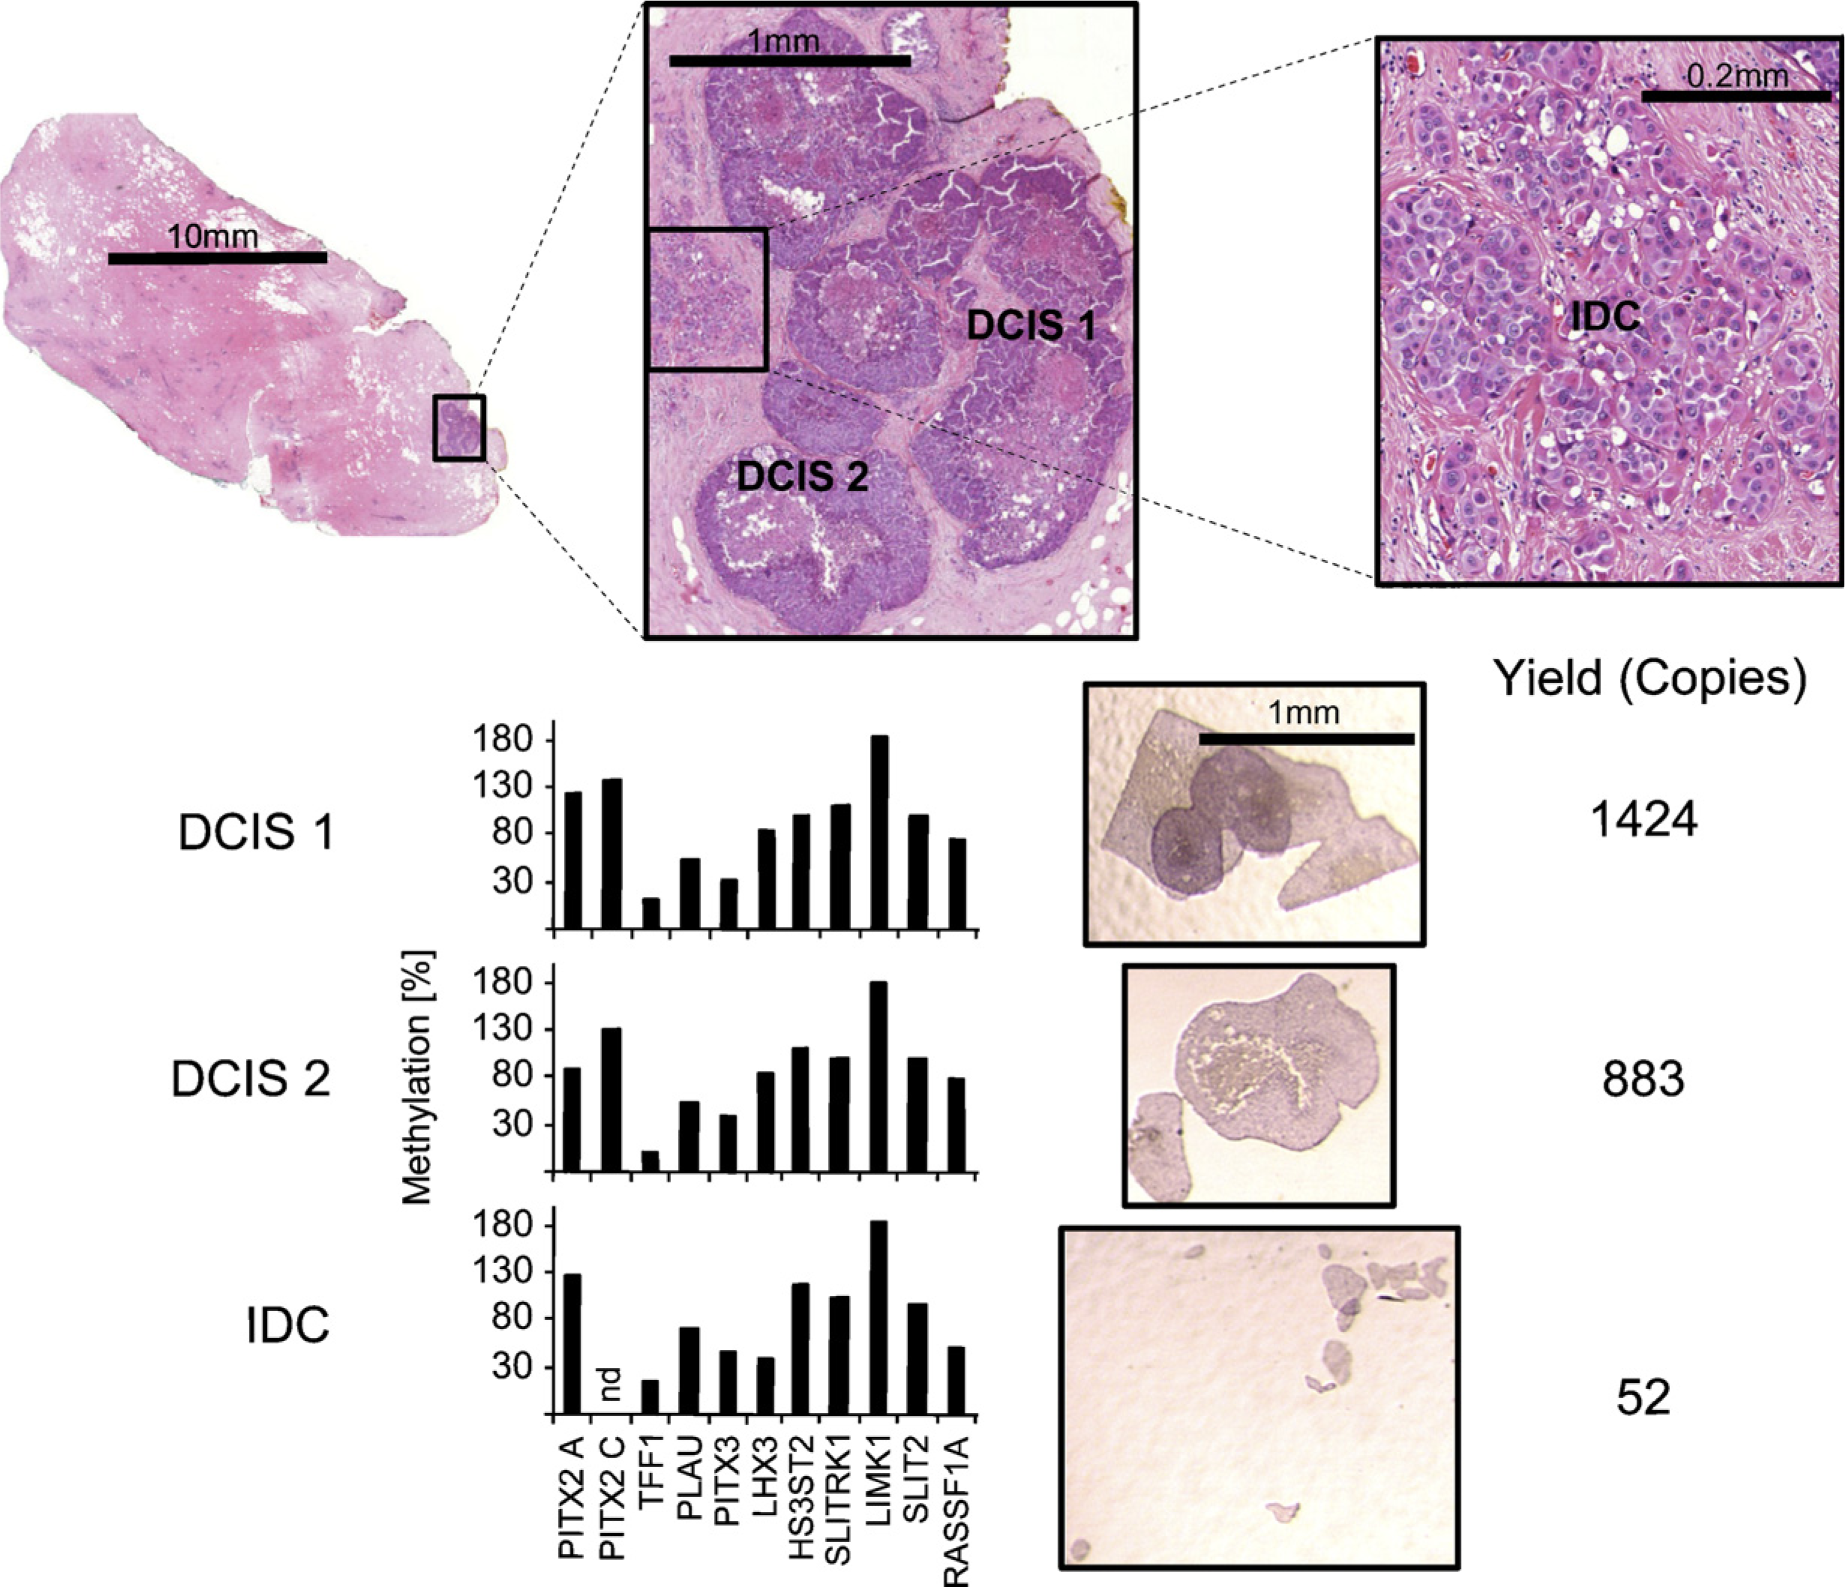
Exemplified procedure on LMD specimens. Histologically distinct areas of interest were identified from a patient with diagnosed invasive ductal carcinoma using a hematoxylin-stained section (reference section). One area with invasive tumor cells (IDCs) and two regions with ductal carcinoma in situ (DCIS1 and DCIS2) are depicted. Microdissection was carried out using hematoxylin-stained sections that were prepared adjacent to the reference section. After DNA preparation and bisulfite conversion, the DNA was quantified (copies of the bisulfite-converted human genome) using the MER9 LTR assay, and the methylation of 11 loci was measured in each LMD sample. nd, failed analysis of single loci within one LMD sample.
The methylation of the genes SLITRK1, LIMK1, HS3ST2, SLIT2, and RASSF1A (Figure 8) is comparable to the methylation of the previously noted genes (except TFF1). All genes are hypermethylated in DCIS and IDC compared with the other components. No differences among samples from one cell type and from different blocks were detectable. Normal ducts and adenosis tissue showed no differential methylation of these genes. Again, the methylation of these genes differed between the two patients. Overall, all genes (except TFF1) exhibited higher methylation levels in DCIS and IDC from patient A compared with patient B. It is notable that the non-tumor components, especially normal ducts and TILs, showed low-level methylation for most of the analyzed genes.
Discussion
DNA methylation alterations are among the most promising candidates for biomarker research. Allowing for precise analysis of methylation patterns from minute amounts of microdissected materials would further open up new possibilities to use DNA methylation as a tissue biomarker. In this study, a procedure is described that allows for the simultaneous quantitative analysis of DNA methylation of several loci in a very limited number of cells from LMD samples of archival FFPETs. This method includes an optimized protocol for bisulfite conversion and subsequent purification. After bisulfite conversion, two consecutive PCR reactions for amplification of the loci of interest were performed. In this study, 11 loci were preamplified in a multiplexed PCR, and each locus was subsequently reamplified in a separate PCR reaction. Thus, this method enables the analysis of the DNA methylation of several genes in one LMD sample. Such multiplexed preamplification has previously been shown to be suitable for target-specific template preamplification in combination with methylation-specific real-time PCR (Fackler et al. 2004, 2006).
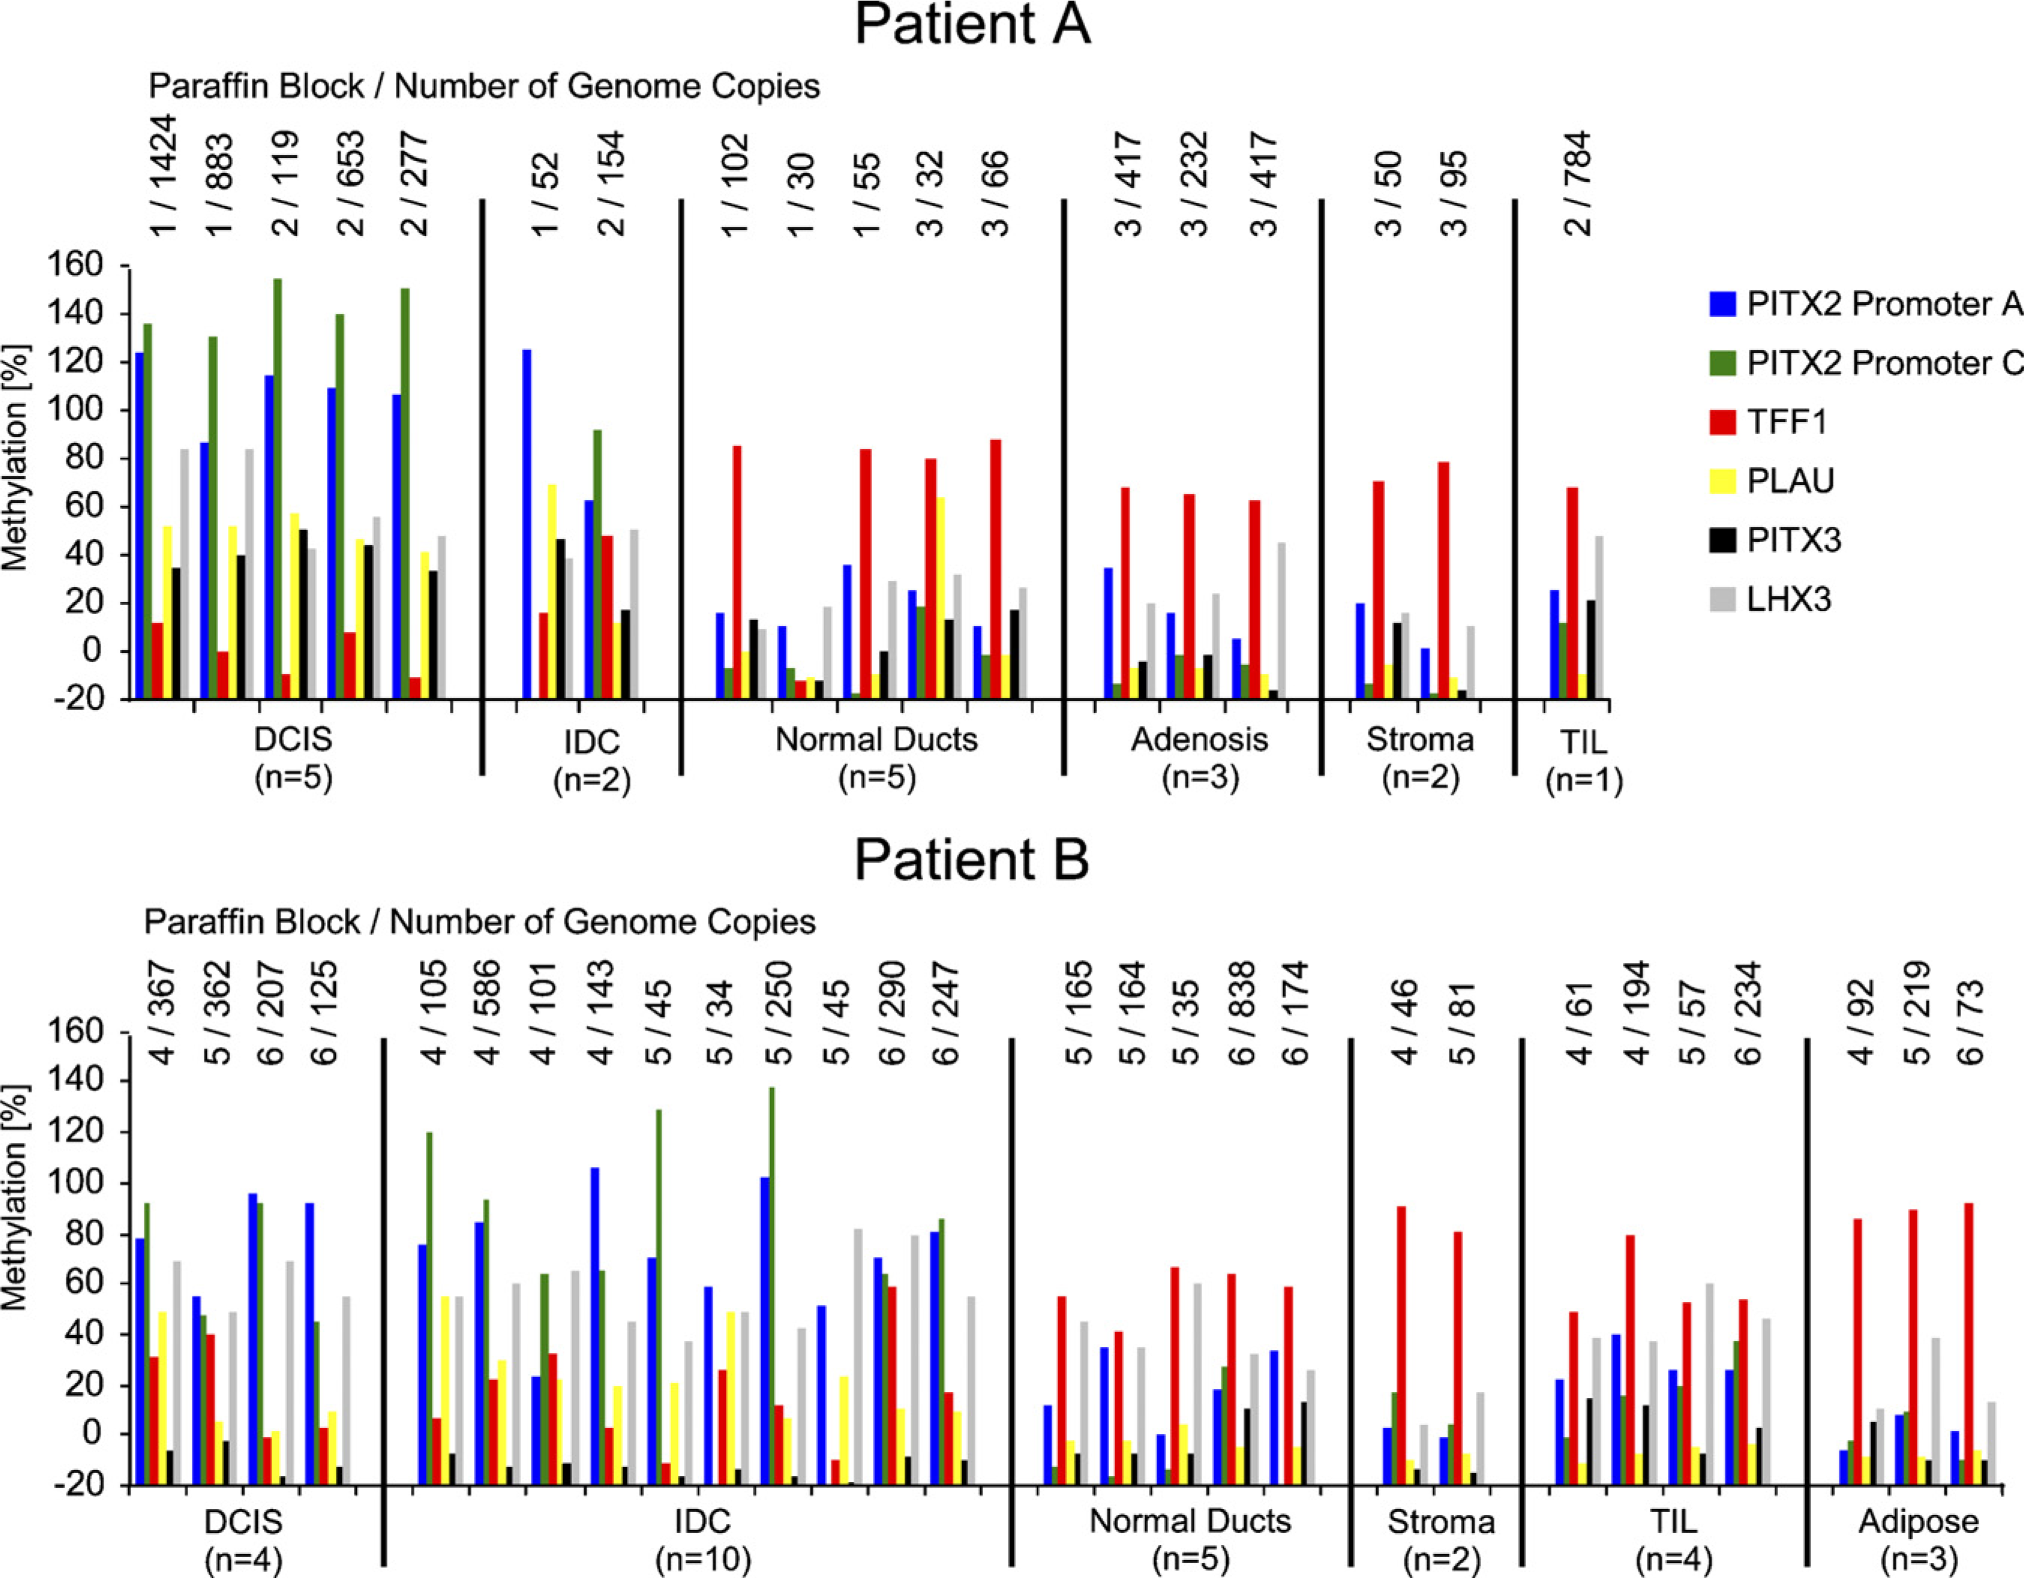
Summary of results for six loci (PITX2 promoters A and C, TFF1, PLAU, PITX3, and LHX3) in 46 microdissected samples from breast cancer patients A and B. The number of the original paraffin block from which the LMD sample came and the number of genome copies quantified using the MER9 LTR assay are listed above each LMD sample.
The incorporation of a normalization signal into the PCR product was previously used to avoid basecaller artifacts (Han et al. 2006) and has herein been proven to be suitable for accurate quantification of DNA methylation. As of today, clone bisulfite sequencing based on the Sanger method is among the most commonly used methods for DNA methylation analysis (Fraga and Esteller 2002; Liu et al. 2004). However, compared with other technologies such as pyrosequencing (Tost et al. 2003; Tost and Gut 2007), accurate quantification is directly correlated with the number of analyzed clones and therefore is time consuming and expensive. Direct sequencing approaches (Lewin et al. 2004) that provide a measure of the degree of methylation at a particular target by comparing cytosine and thymine signals are susceptible to basecaller artifacts and therefore limited in their resolution. Thus, novel methods for accurate quantitative bisulfite sequencing show a significant improvement for methylation analysis.
The exact knowledge about the number of DNA copies in an LMD sample is highly valuable. A measurement originating only from a few copies might not reflect the actual representation of methylated and unmethylated copies. The MER9 LTR real-time PCR assay allows for accurate quantification of the human bisulfite genome down to single copy level. This assay was successfully used to exclude samples with too low DNA content (<25 copies of the human genome) to avoid artifacts resulting from the analysis of low copy numbers.
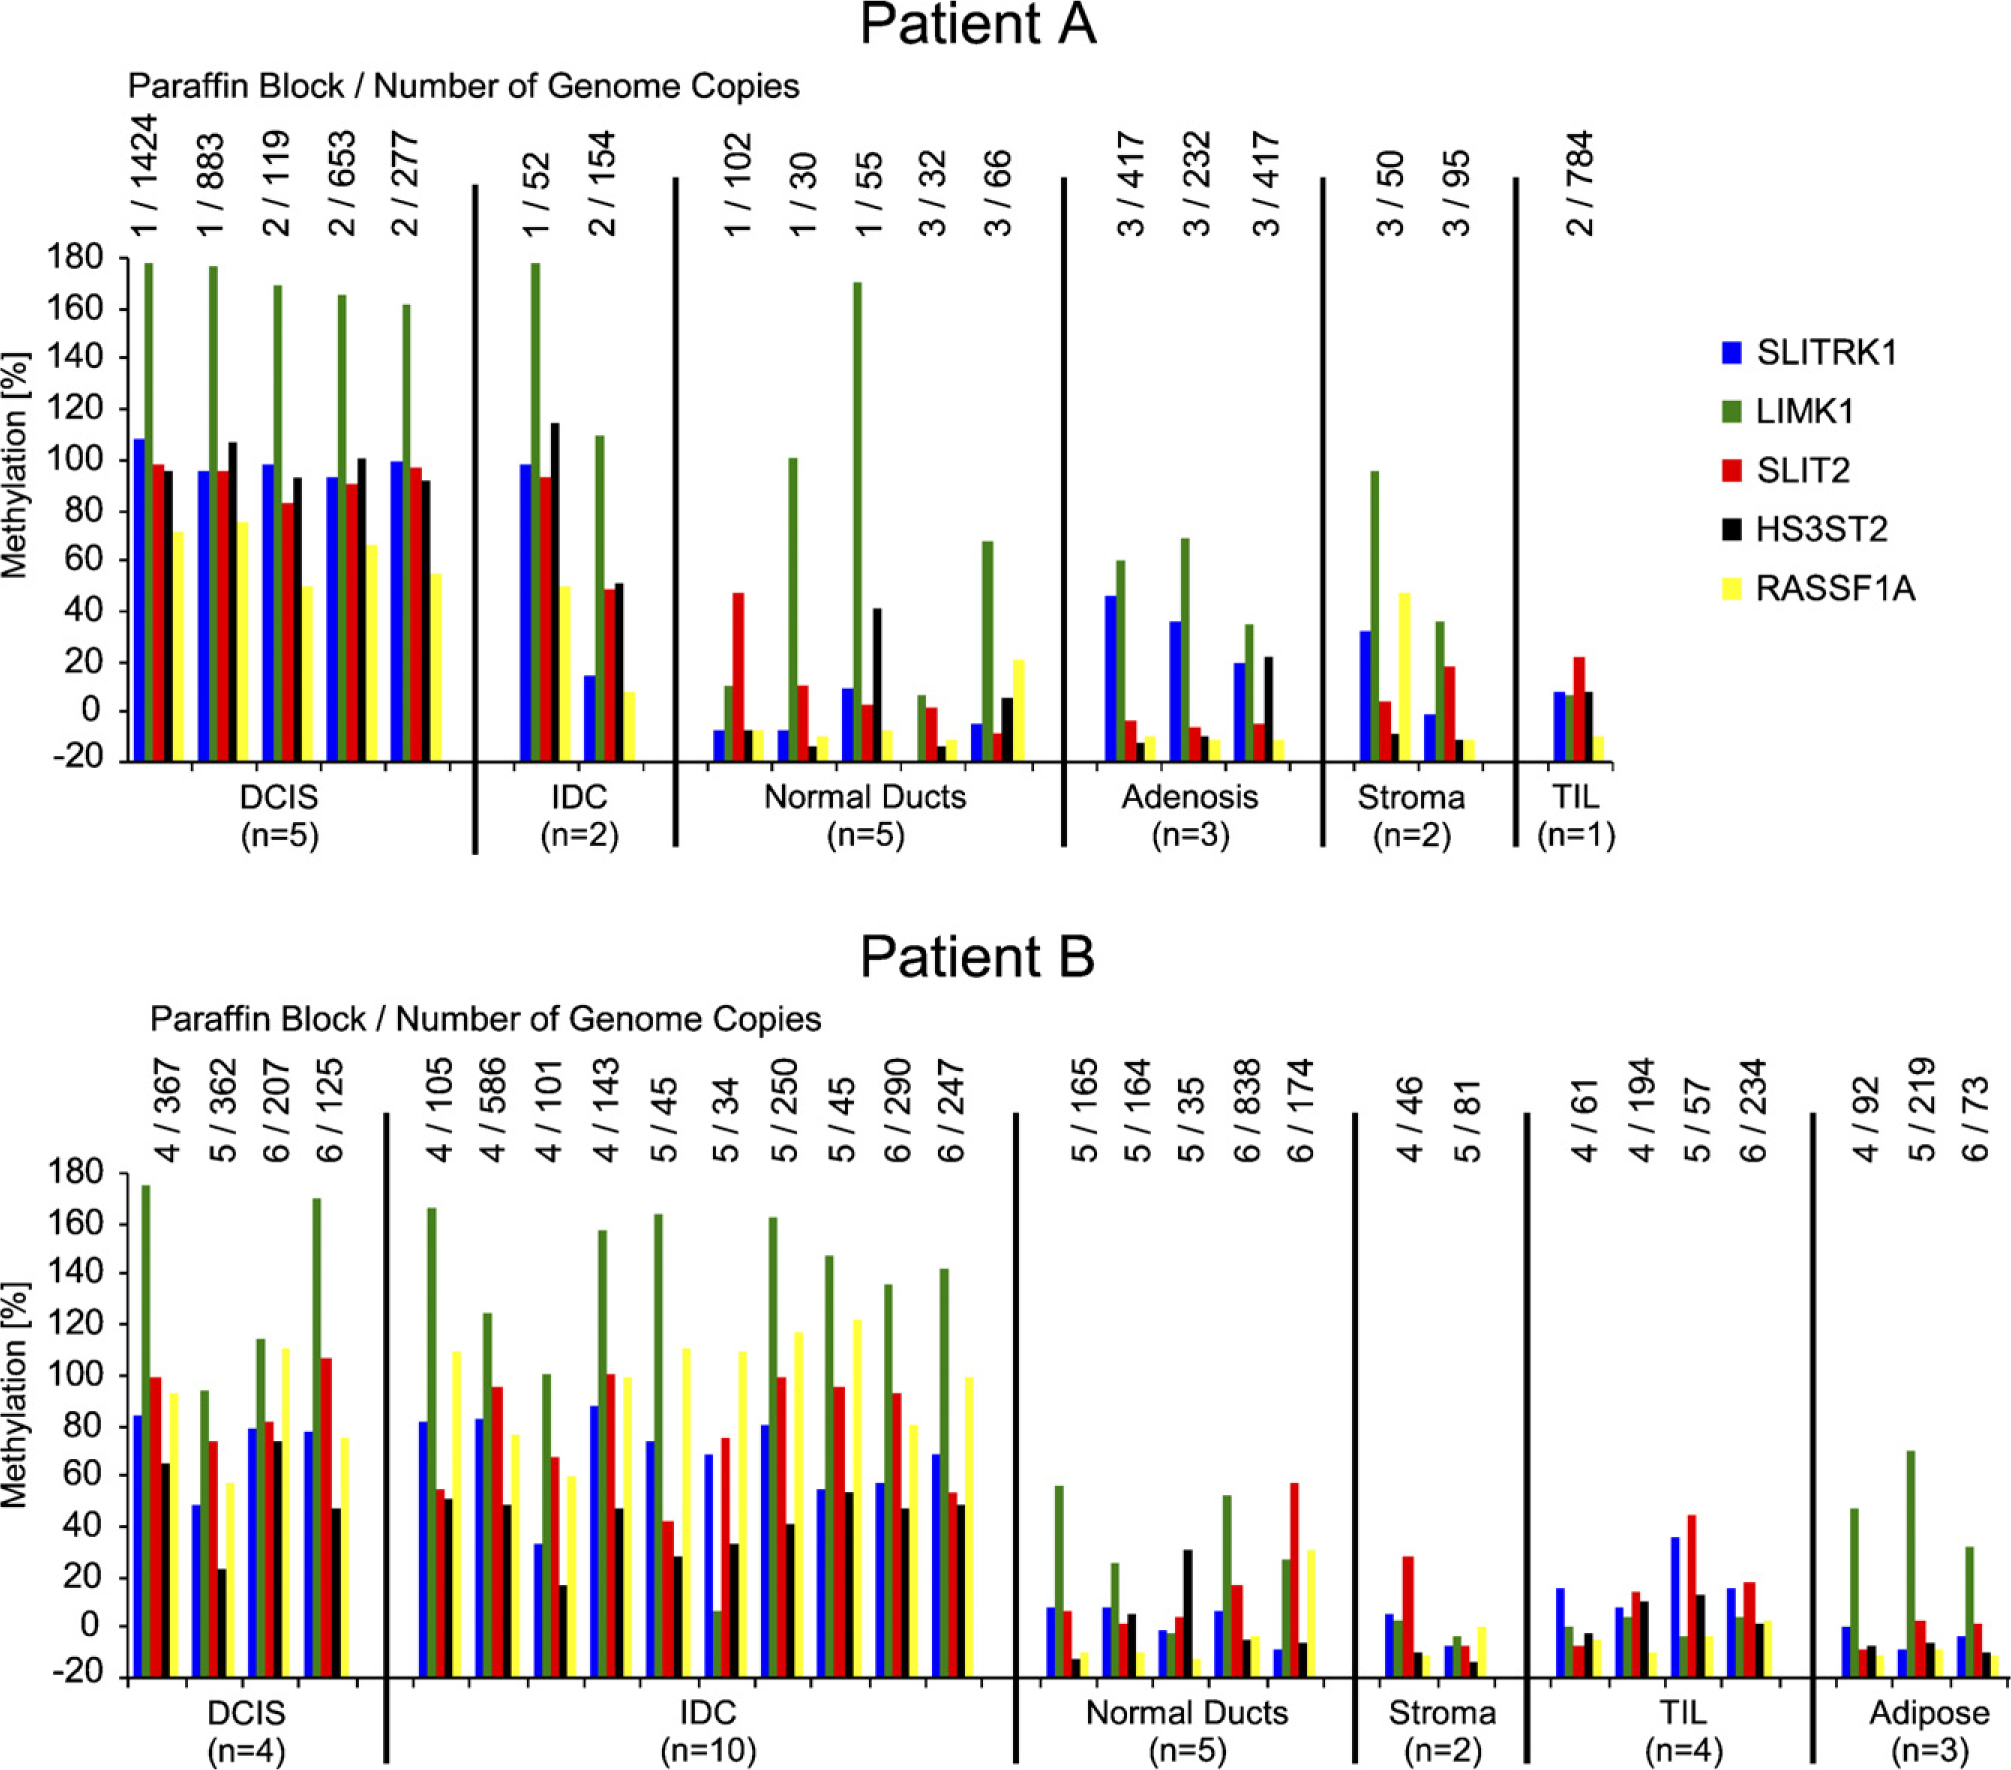
Methylation of five genes (SLITRK1, LIMK1, SLIT2, HS3ST2, and RASSF1A) in 46 microdissected samples from breast cancer patients A and B. The number of the original paraffin block from which the LMD sample came and the number of genome copies quantified using the MER9 LTR assay are listed above each LMD sample.
The quantitative results of the methylation measurement generated with the developed quantitative bisulfite sequencing method were highly concordant with a real-time PCR-based quantitative DNA methylation assay (Lehmann et al. 2002; Lehmann and Kreipe 2004; Zeschnigk et al. 2004). This technique has previously been used to identify PITX2 methylation as a biomarker for outcome prediction in breast cancer (Maier et al. 2007; Nimmrich et al. 2008). The newly developed sequencing method allows for the quantitative methylation analysis of multiple loci in LMD samples from FFPETs, as shown for 11 loci in this study.
The results of the quantitative bisulfite sequencing method are normalized peak areas. To yield the percentage of methylation, these peak areas must be transformed into percentage methylation based on calibration curves that were prepared by applying DNA mixtures with known percentages of methylation. The challenge of preparing suitable calibration mixtures is to use DNAs that, on the one hand, are completely methylated and completely unmethylated and, on the other hand, show a symmetric representation of the analyzed locus. The use of mixtures obtained from genome-wide amplified DNA (MDA DNA) and artificially methylated MDA DNA led in some cases to values <0% and >100%. MDA DNA is partially single stranded and therefore it is not possible to generate completely methylated MDA DNA. However, it is not possible to mix this DNA with completely methylated DNA from natural origin because the loci are not represented symmetrically (Arriola et al. 2007). Thus, sperm DNA was used as model DNA to verify the workflow to ensure that equal copy numbers of the target sequences were present. DNA from sperm bears the potential to be a DNA of natural origin, which should have no major chromosomal rearrangements and has been reported to be unmethylated at many loci (Rakyan et al. 2008). However, DNA from sperm shows methylation for some loci (i.e., LIMK1 and TFF1) and is not suited to calibrate these particular assays. Thus, the individual choice of a suited reference DNA for each loci might further improve the quantitative sequencing method.
In evaluating this method, 54 LMD samples from two selected cases of breast cancer were analyzed. Besides the genes PITX2, RASSF1A, TFF1, PLAU, LIMK1, SLITRK1, SLIT2, HS3ST2 and TFF1, with known aberrant methylation in breast cancer (Foekens et al. 1990; Schwartz et al. 1991; Martin et al. 1995; Ruibal et al. 1999; Bae et al. 2004; Muller et al. 2004; Pakneshan et al. 2004, 2005; Shinozaki et al. 2005; Hoque et al. 2006; Lesche et al. 2006; Maier et al. 2007; Nimmrich et al. 2008), aberrant methylation of PITX3 and LHX3 in breast cancer is reported herein for the first time. PITX3 was analyzed because of its high sequence homology with PITX2 and partly redundant function (L'Honore et al. 2007), whereas LHX3 was chosen because regulation by PITX2 was reported (Charles et al. 2005). Although only two patients were analyzed, evidence of increased methylation was found when comparing normal with malignant ducts in both cases. Almost all analyzed genes showed hypermethylation in DCIS and IDC compared with stroma, TILs, normal ducts, adipose tissue, and adenosis tissue. TFF1 showed inverse methylation compared with these genes. No difference between DCIS and IDC was found, indicating that aberrant methylation of the analyzed genes probably occurs early during malignant transformation of the cell. Interestingly, in samples from patient B, most genes showed elevated methylation in normal ducts and TILs compared with adipose tissue and stroma. This could indicate that normal ducts neighboring the tumor might already exhibit some evidence of altered methylation. A reason for this could be a potential field effect, leading to alterations of methylation in normal components adjacent to the tumor or the existence of a subpopulation of cells within the normal ducts, which shows similarities to the tumor cells on an epigenetic level. Such a field has previously been reported (Yan et al. 2006); however, normal components at higher distance from the tumor, or in healthy ducts from patients who did not suffer from breast cancer, would need to be analyzed to explore this. The finding of DNA methylation of the analyzed genes in TILs is unexpected and surprising. However, because TILs showed only low levels of methylation, this finding might hint at the presence of subtypes within TILs, which clearly merits further study.
It is well established that tumor development and progression occurs as an interaction between tumor cells and their stromal environment (for review, see Li et al. 2007; Witz 2008), and the concept of epithelial to mesenchymal transition as a driver of tumor progression has become more important in recent years (Guarino et al. 2007; Soltermann et al. 2008). To carefully analyze this interplay between epithelial and stromal cells in tumor progression, a microdissection is inevitable. For these studies, the described procedure will be a powerful tool to shed further light with higher resolution onto epigenetic mechanisms in cancer pathogenesis. However, this method is suitable for many applications beyond LMD analysis, whenever multiplex analysis of low template amounts is desirable.