
Abstract
The Golgi silver impregnation technique gives detailed information on neuronal morphology of the few neurons it labels, whereas the majority remain unstained. In contrast, the Nissl staining technique allows for consistent labeling of the whole neuronal population but gives very limited information on neuronal morphology. Most studies characterizing neuronal cell types in the context of their distribution within the tissue slice tend to use the Golgi silver impregnation technique for neuronal morphology followed by deimpregnation as a prerequisite for showing that neuron's histological location by subsequent Nissl staining. Here, we describe a rapid method combining Golgi silver impregnation with cresyl violet staining that provides a useful and simple approach to combining cellular morphology with cytoarchitecture without the need for deimpregnating the tissue. Our method allowed us to identify neurons of the facial nucleus and the supratrigeminal nucleus, as well as assessing cellular distribution within layers of the dorsal cochlear nucleus. With this method, we also have been able to directly compare morphological characteristics of neuronal somata at the dorsal cochlear nucleus when labeled with cresyl violet with those obtained with the Golgi method, and we found that cresyl violet–labeled cell bodies appear smaller at high cellular densities. Our observation suggests that cresyl violet staining is inadequate to quantify differences in soma sizes.
Keywords
T
Materials and Methods
Twenty-nine Lister Hooded rats, 17 to 18 days old, were used, and all procedures were performed in accordance with the United Kingdom Home Office regulations.
Fixation
Brains were dissected out of the skull and immediately fixed in 5% paraformaldehyde for at least 2 days at a temperature of 21C. The paraformaldehyde fixative solution was buffered at various pH levels (pH 5.8, 7.4, or 7.6) according to the chromation process. When the chromation process was performed in distilled water (i.e., no buffer) the initial fixative medium was buffered at pH 7.4.
Rapid Golgi Staining
After initial fixation, brains were transferred into freshly prepared chromating solution containing 3% potassium dichromate and 4% or 5% paraformaldehyde in either distilled water (i.e., not buffered) or in PBS solutions of pH 5.8, 7.4, or 7.6 (i.e., in concert with the initial fixation mentioned above). Additionally, the chromating solutions also contained either 2% glutaraldehyde or 2% chloral hydrate. All chromating solutions were changed daily with freshly prepared solutions. After 48 hr of chromation, the brains were washed several times with a 2% silver nitrate solution in distilled water before incubation in silver nitrate for another 48 hr for heavy metal precipitation to occur. During the whole staining process, brains were covered with aluminum foil to avoid light exposure. Tissue blocks labeled with the Golgi method were sectioned as detailed below.
Cresyl Violet Staining
Tissue slices (50 μm thick) were mounted on targeting molecule polysine-coated slides (VWR International; Braunschweig, Germany) and stained with 0.1% fast cresyl violet (Lamb; London, UK) dissolved in distilled water and filtered. Slices were stained in cresyl violet for 4 min and maintained under agitation. When the brains were previously labeled with the Golgi method, the staining time in cresyl violet was extended to 6–7 min. Slices were dehydrated for 2 min using 100% ethanol, cleared in xylene for another 2 min, and covered with DPX and a coverslip. In some cases, slices were stained with cresyl violet using a progressive dehydration protocol procedure. Here, brain slices were first hydrated in MilliQ water for 30 min and then placed under agitation in cresyl violet staining solution for 3–5 min before being rinsed in MilliQ water. Brain slices were progressively dehydrated in 70% alcohol (for 10 min), 95% alcohol (with a few drops of 10% acetic acid; for 2–3 min), and finally 100% alcohol (for 10 min). Slices were cleared in xylene for 5 min before being covered with DPX and a coverslip.
Lucifer Yellow Labeling
In some separate experiments, fresh slices were used, and cells were filled with Lucifer yellow (Fluka; Buchs, Switzerland), and the size of the cell body was measured and compared with the soma size of Golgi-stained cells. Lucifer yellow cell filling was performed on freshly dissected tissue and freshly cut slices. Whole cell recordings of DCN neurons were performed under microscopic control with glass borosilicate electrodes (3–5 MOhm) containing 0.1% Lucifer yellow and (in mM) 97.5 Kgluconate, 32.5 KCl, 5.4 EGTA, 10 HEPES, and 1 MgCl2 (pH 7.1 with KOH). Lucifer yellow was allowed to fill up the cell for at least 30 min. Slices containing the labeled cells were transferred into 4% paraformaldehyde dissolved in phosphate buffer (pH 7.4) and fixed for ∼12 hr before being rinsed with the phosphate buffer (pH 7.4), mounted on a polysine slide, and covered with 1% agarose and a coverslip.
Tissue Slicing
For slicing of fresh tissue (used for Lucifer yellow staining), 150-μm-thick coronal slices containing the DCN were cut under binocular guidance using a Leica Vibroslicer VT1000S (Nussloch, Germany), in an ice cold low sodium artificial cerebrospinal fluid containing (in mM): 2.5 KCl, 1.2 NaH2PO4, 10 D-glucose, 0.5 ascorbic acid, 25 sucrose, 26 NaHCO3, 0.1 CaCl2, and 4 MgCl2, bubbled with 95% O2 and 5% CO2 (pH 7.4). Slices were transferred to a recording chamber on a Zeiss Axiovert microscope (Göttinghen, Germany) and perfused with oxygenated artificial cerebrospinal fluid containing (in mM) 125 NaCl, 2.5 KCl, 1.2 NaH2PO4, 10 D-glucose, 0.5 ascorbic acid, 2 Na pyruvate, 3.0 myo-inositol, 26 NaHCO3, 2 CaCl2, and 1 MgCl2 bubbled with 95% O2 and 5% CO2 (pH 7.4). When using fixed tissue (used for Golgi and/or cresyl violet staining), slices were cut at 50 μm thickness in distilled water, collected and mounted on polysine-coated slides, and left to dry overnight at room temperature in a dust-free enclosure before they were counterstained with cresyl violet.
Image Acquisition
Slices were visualized using a Nikon Eclipse TE2000-U inverted microscope, and images were acquired with a Nikon DXM1200F digital camera and Nikon NIS Elements 2.20 software (Kanagano, Japan). Images of Golgi-labeled cells were obtained using a z-stack of two to four microphotographs taken at 1- to 2-μm intervals throughout the slice and put into a single focused image with the software Image-J 1.36. Lucifer yellow–filled cells were examined on an Olympus confocal microscope (IX70) with a ×60 objective (Nagano-Ken, Japan). Images of Lucifer yellow–stained cells were obtained using a z-stack of 20–90 microphotographs taken at a 0.5-μm interval throughout the slice and put into a single-focused image with the Olympus Fluoview software.
Analysis
Nissl-stained Cells. Analysis of cell density and cell soma surface areas was performed on two to three slices per rat, and three rats were used per staining condition. The whole DCN was cut from its caudal to its rostral end, and DCN slices were analyzed at three depths throughout the nucleus (i.e., 100, 250, and 400 μm deep). Analysis of cell numbers and cell soma surface areas was performed using rectangular areas (89 × 55 μm) placed as a fixed matrix (as in King et al. 2002) of three rows and three columns, and the three rows represented the three layers: the external (molecular), intermediate (fusiform), and internal (deep) layers. In the vertical plane, each rectangle was separated by a 60-μm gap between the molecular and the fusiform layer and by a 100-μm gap between the fusiform and the deep layer. In the horizontal plane, rectangles were separated from each other by a 90-μm gap. Analysis of cell density and cell soma surface area was performed on all cells that were in the optical focal plane lying within or were crossing the inclusion boundaries, using a method similar to that of King et al. (2002). Cell density was measured per area and not volume. Cell soma surface was analyzed for all cell profiles contained within the six rectangles (two rectangles per layer). Cell soma surface analysis was done by outlining the soma border but excluding the emerging dendrites and axon using the method and the terms described by McDonagh et al. (2002) and Zwaagstra and Kernell (1981). Only cell soma surface areas ≥39 μm2 corresponding to a diameter ≥7 μm were included in the analysis. This lower limit was set to include granule cells known to have diameters of ∼7–9 μm (Mugnaini et al. 1980b; Alibardi 2003). A diameter lower limit of 7 μm also excluded glial cells from the counting (Skoglund et al. 1996). Area localization was based on the rat stereotaxic atlas of Paxinos and Watson (1998).
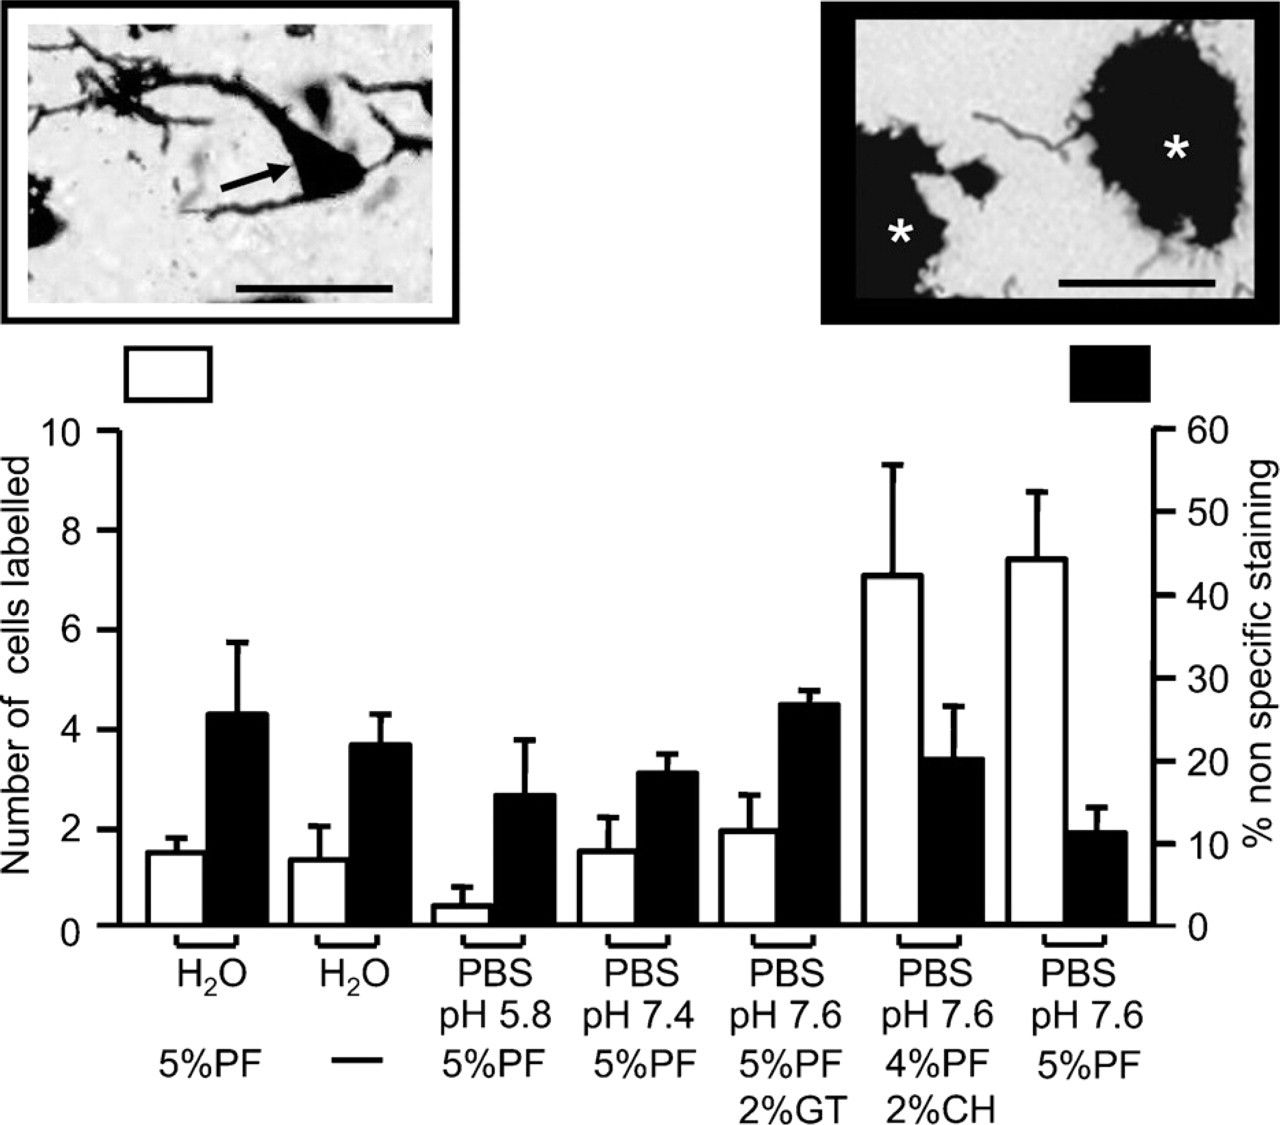
Golgi staining of dorsal cochlear nucleus (DCN) neurons is dependent on the chromating solution. Summary histograms representing the following: white, mean ± SD number of labeled cells per DCN slice (n=6); black, mean ± SD percentage of area not specifically stained relative to the total DCN area (n=6). CH, chloral hydrate; GT, glutaraldehyde; PF, paraformaldehyde. Inset at left is an example of a neuron-specific labeling highlighted by arrow (potassium dichromate solution was dissolved in PBS, pH 7.6, and 4% paraformaldehyde plus 2% chloral hydrate). Inset at right is an example of nonspecific staining highlighted by white asterisks (potassium dichromate dissolved in H2O and 5% paraformaldehyde). Bar = 50 μM.
Golgi- and Lucifer Yellow–stained Cells. The number of Golgi-labeled cells was estimated throughout the total DCN, and both left and right sides of three brains were used for every staining condition reported in Figure 1, giving a total of 61–74 slices analyzed per condition. The surface of the non-neuronal (a-specific) Golgi staining (defined as all the black to orange precipitates) was estimated in 8 DCN slices per rat from both left and right sides, giving a total number of 24 slices analyzed per condition (three rats per condition). Surface (or profile) areas were measured using the Image-J 1.36 freehand selection tool (National Institutes of Health; Bethesda, MD), allowing selection of the contour of the DCN, the nonspecific staining, and the cell soma surface area together, with the Image-J 1.36 area calculator plug-ins, allowing estimating the surface areas.
Statistics
Data are expressed as mean ± SD. Unless specified otherwise, data were analyzed by one- or two-factor ANOVA (general linear model) tests followed by Tukey's test using the statistical software ezANOVA (http://www.sph.sc.edu/comd/rorden/ezanova/home.html) or Mini Tab 14. Post hoc power analysis was performed using Gpower 2.0 software (http://www.psycho.uni-duesseldorf.de/aap/projects/gpower/).
Results
We started by setting up optimal staining conditions for labeling individual neurons of the rat DCN using the rapid Golgi silver impregnation method before combining it with cresyl violet staining so that we could characterize the morphology of individual neurons within the context of layers of the DCN.
Cell Labeling Using the Rapid Golgi Method
We used the rapid variant of the Golgi silver impregnation method to label neurons of the DCN over 4 days. This labeling method can be divided into two steps. First, cells were impregnated with both trivalent and hexavalent chromium ions over 2 days, and this is known as the chromation step. This process requires the presence of aldehydes and is known to be influenced by time, temperature, and pH (Kopsch 1896; Colonnier 1964). The chromation step was followed by a precipitation step also lasting 2 days, in which the chromium ions react with heavy metal ions, silver in this case, to give a chromogenic reaction product that serves as the visual marker of the labeled cells. We optimized our protocols by experimenting with various aldehyde donors during the chromation step, namely paraformaldehyde, glutaraldehyde, or chloral hydrate, and also using phosphate buffer to give us a pH range of 5.8–7.6. In another set, the chromation step was carried out in the absence of buffer with or without paraformaldehyde (5%). The quality of the Golgi staining was assessed by determining whether the staining was confined to neurons (pointed with the arrow in Figure 1, left inset) or to nonspecific staining (shown as asterisks in Figure 1, right inset). The stained neuron in Figure 1 showed a clearly visible cell body with a pyramidal shape and dendrites, whereas nonspecific labeling in Figure 1 had an undefined patchy presentation instead of a neuronal shape. Figure 1 also shows a histogram plot illustrating the effects of pH and aldehyde on neuronal and non-neuronal staining by plotting the average number of labeled neurons per DCN slice (white bars) and the surface area of the non-neuronal staining relative to the total DCN area (black bars). We quantified the number of labeled cells and the extent of the non-neuronal staining and compared the different conditions using one-factor ANOVA and Tukey tests. We found that the highest number of labeled cells were obtained when we used either PBS, pH 7.6, with 5% paraformaldehyde or PBS, pH 7.6, with 4% paraformaldehyde and 2% chloral hydrate (Figure 1, white bars; Tables 1 and 2, left columns). Using a PBS solution, pH 7.6, with 5% paraformaldehyde also led to reduced non-neuronal labeling (Figure 1, black bars; Tables 1 and 2, right columns). Using a PBS solution, pH 7.6, with glutaraldehyde instead of paraformaldehyde reduced the number of labeled cells (Figure 1), suggesting that glutaraldehyde is not ideal for neuronal staining with the Golgi silver impregnation method. Similarly, more acidic pH conditions or aqueous solutions produced only few labeled neurons (Figure 1; Table 1, left column).
One-factor ANOVA–Tukey tests comparing the labeling obtained in various chromating solutions
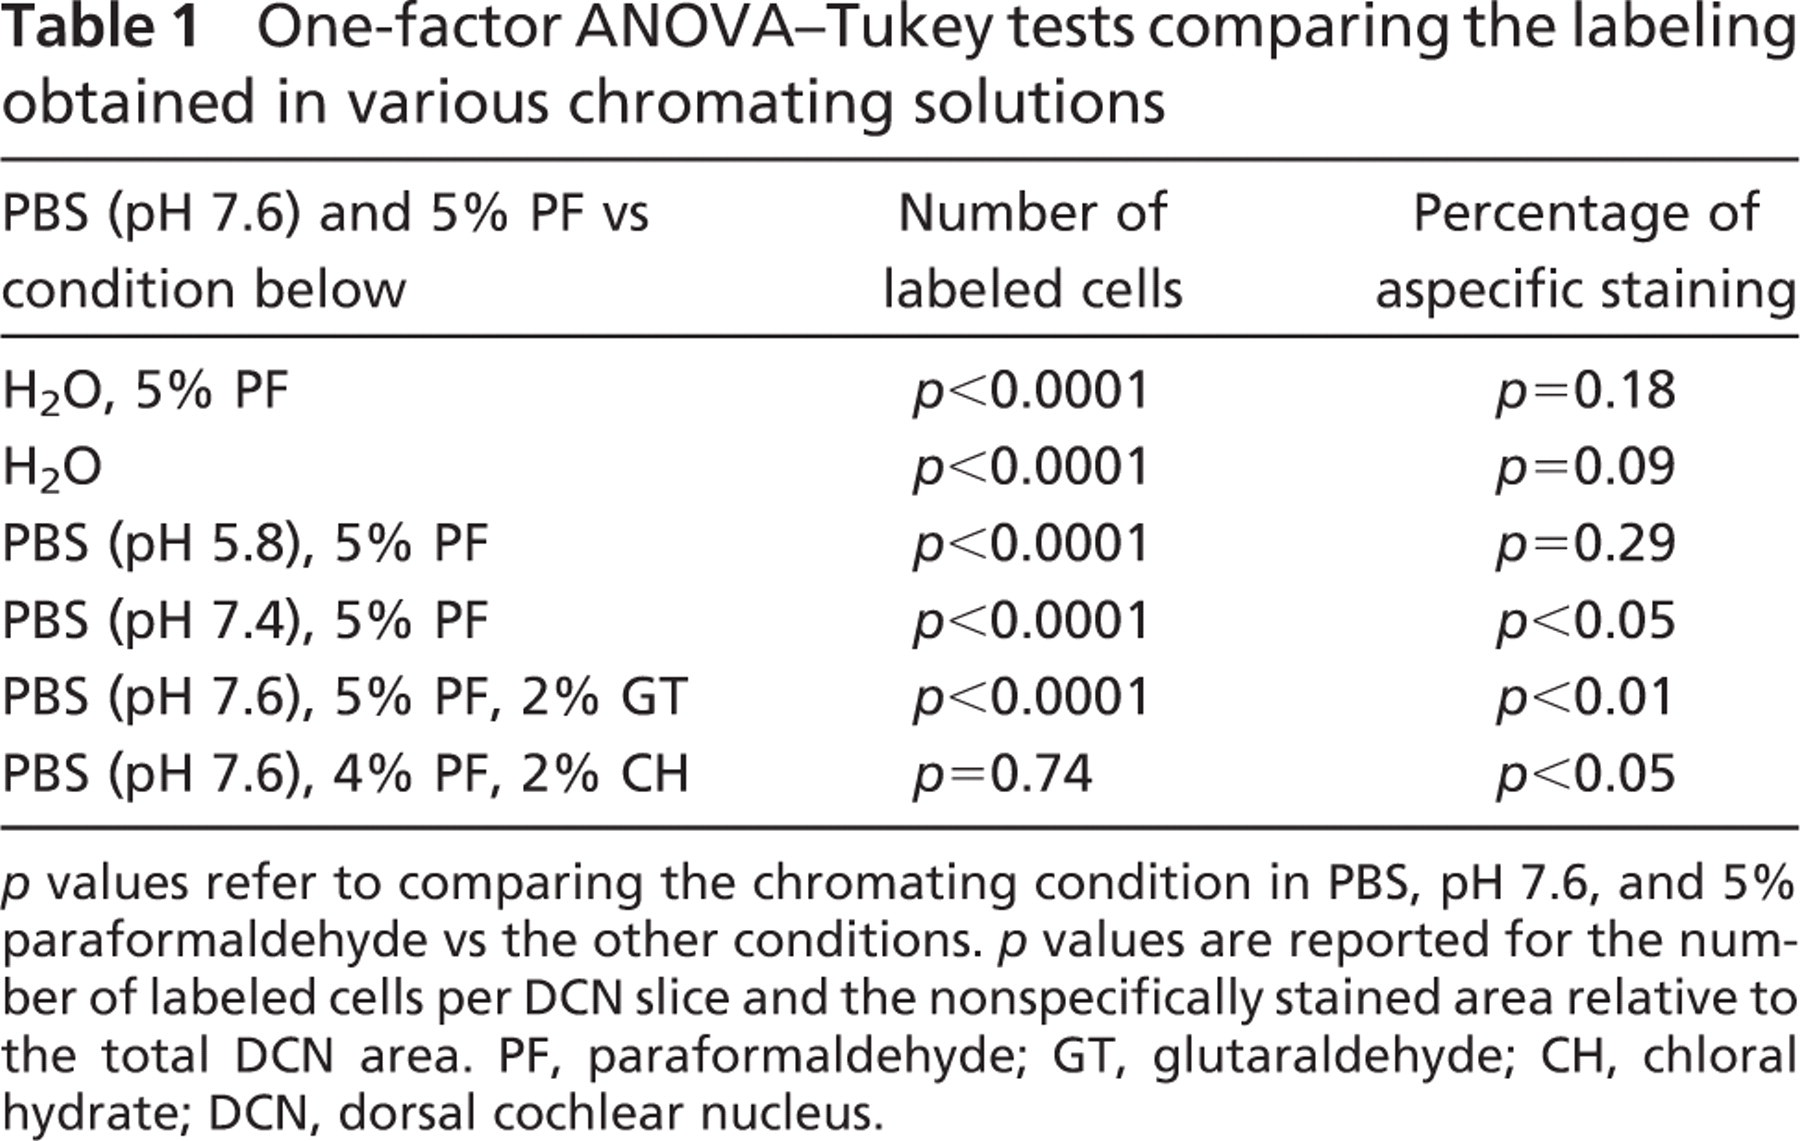
p values refer to comparing the chromating condition in PBS, pH 7.6, and 5% paraformaldehyde vs the other conditions. p values are reported for the number of labeled cells per DCN slice and the nonspecifically stained area relative to the total DCN area. PF, paraformaldehyde; GT, glutaraldehyde; CH, chloral hydrate; DCN, dorsal cochlear nucleus.
Cell Labeling Using the Combined Cresyl Violet–Rapid Golgi Method
Brains were previously labeled with the Golgi method using the optimal chromating conditions in a PBS solution, pH 7.6, with 5% paraformaldehyde, and slices containing the DCN were subsequently counterstained with cresyl violet. In addition to acting as a control stain of the neuronal tissue, cresyl violet allowed us to study the silver-impregnated neurons in the context of the DCN laminated structure. While staining the tissue with cresyl violet, studies report first hydrating the slices with distilled water, then staining them with cresyl violet, and finally dehydrating them by using progressively graded solutions of ethanol, namely 50–70% and 100% (Gittins and Harrison 2004; Friedland et al. 2006). In our experience, we found that this commonly used approach produced cracking within Golgi-labeled tissue, leading us to modify our protocol such that sections were transferred directly to the cresyl violet solution without prior hydration and from the cresyl violet solution directly to 100% ethanol for 2 min. Figure 2 shows the morphologies of silver-impregnated neurons before (Figure 2A) and after (Figure 2B) counterstaining the tissue with cresyl violet. The cresyl violet stain shows laminated areas of higher density of labeling suggestive of cell layering within the DCN, whereas Golgi-stained cells showed typical neuronal morphologies. We also used the combined Golgi–cresyl violet staining in slices containing the cerebellum and other brainstem nuclei easily recognizable by the cresyl violet staining. Figure 3A shows cerebellar Purkinje cells aligned in the Purkinje cell layer, with their typical spiny dendritic tree oriented toward the molecular layer (Palay and Chan-Palay 1974; Friedland et al. 2006). Figures 3B and 3C show two labeled motoneurons in the facial nucleus (Grinevich et al. 2005) and a giant neuron in the lateral vestibular nucleus (Uno et al. 2003), respectively. The supratrigeminal nucleus is easily recognizable by its capping of the trigeminal motor nucleus (Figure 3D), and it contains pyramidal and small ovoid neurons as shown in Figure 3E.
One factor ANOVA–Tukey tests comparing the labeling obtained in various chromating solutions
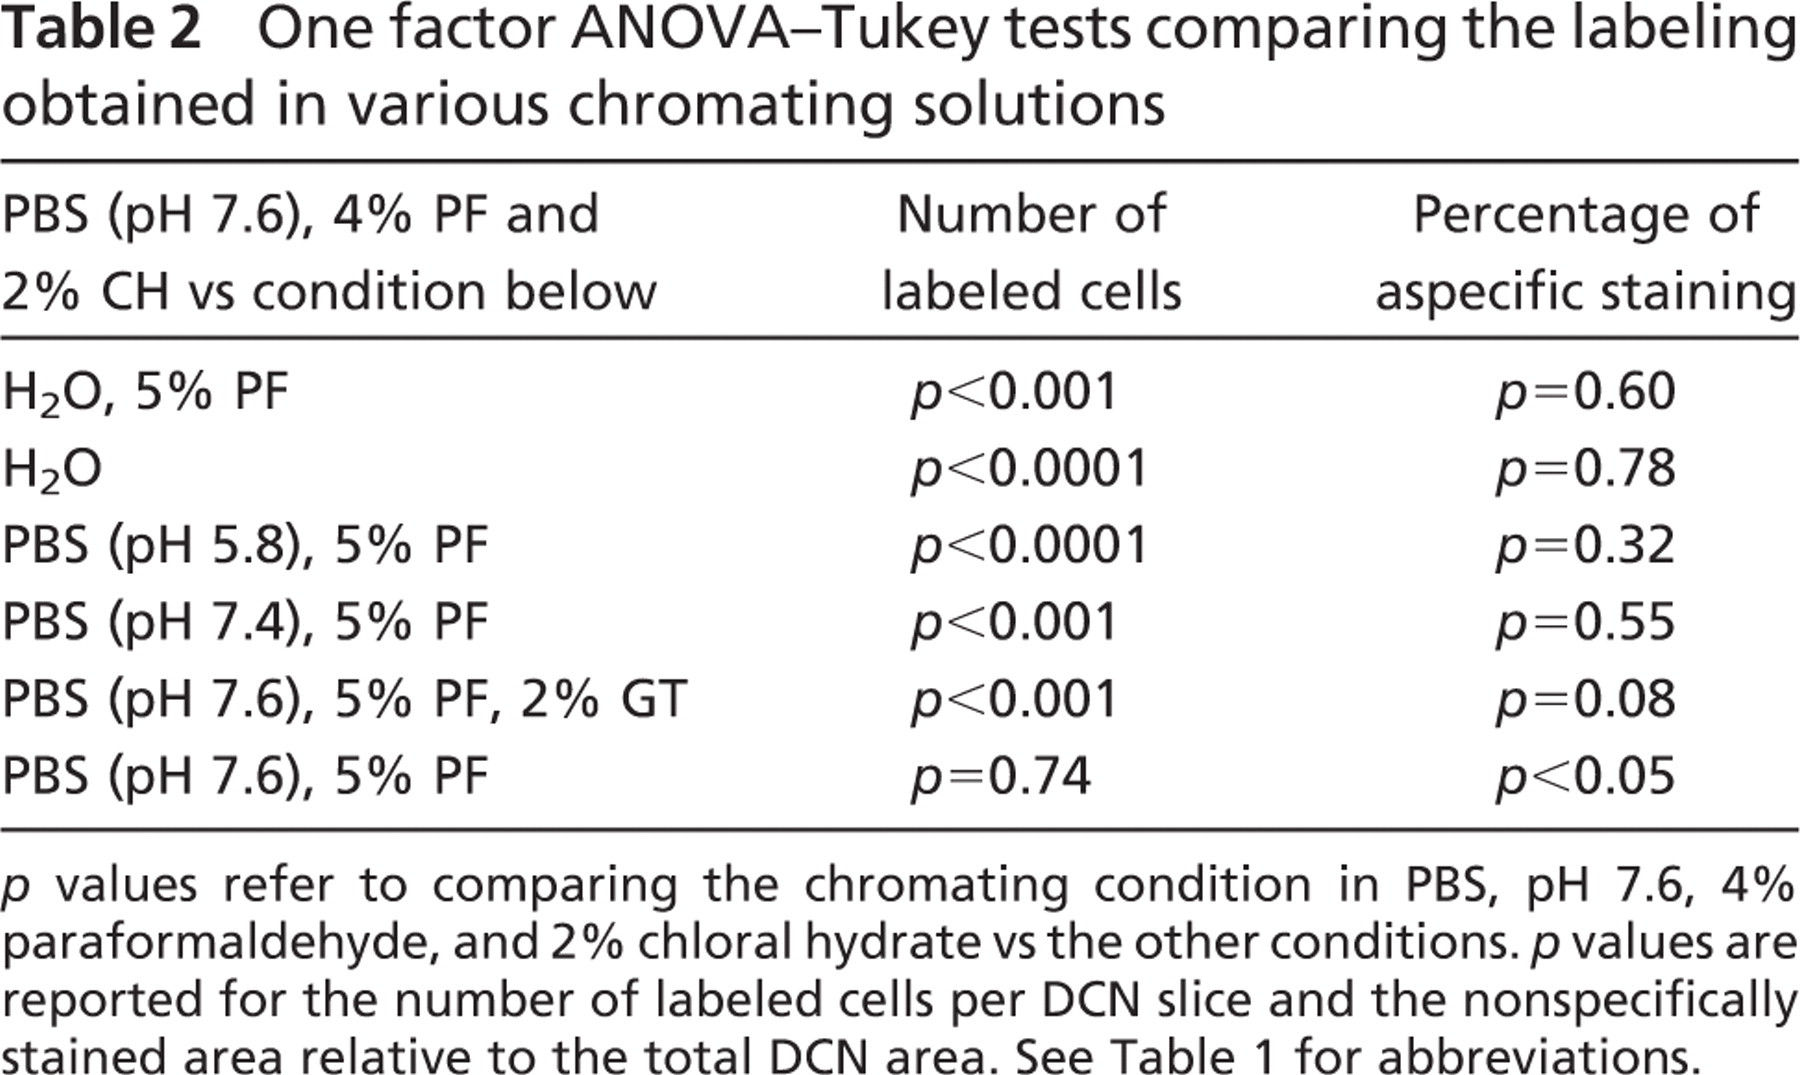
p values refer to comparing the chromating condition in PBS, pH 7.6, 4% paraformaldehyde, and 2% chloral hydrate vs the other conditions. p values are reported for the number of labeled cells per DCN slice and the nonspecifically stained area relative to the total DCN area. See Table 1 for abbreviations.
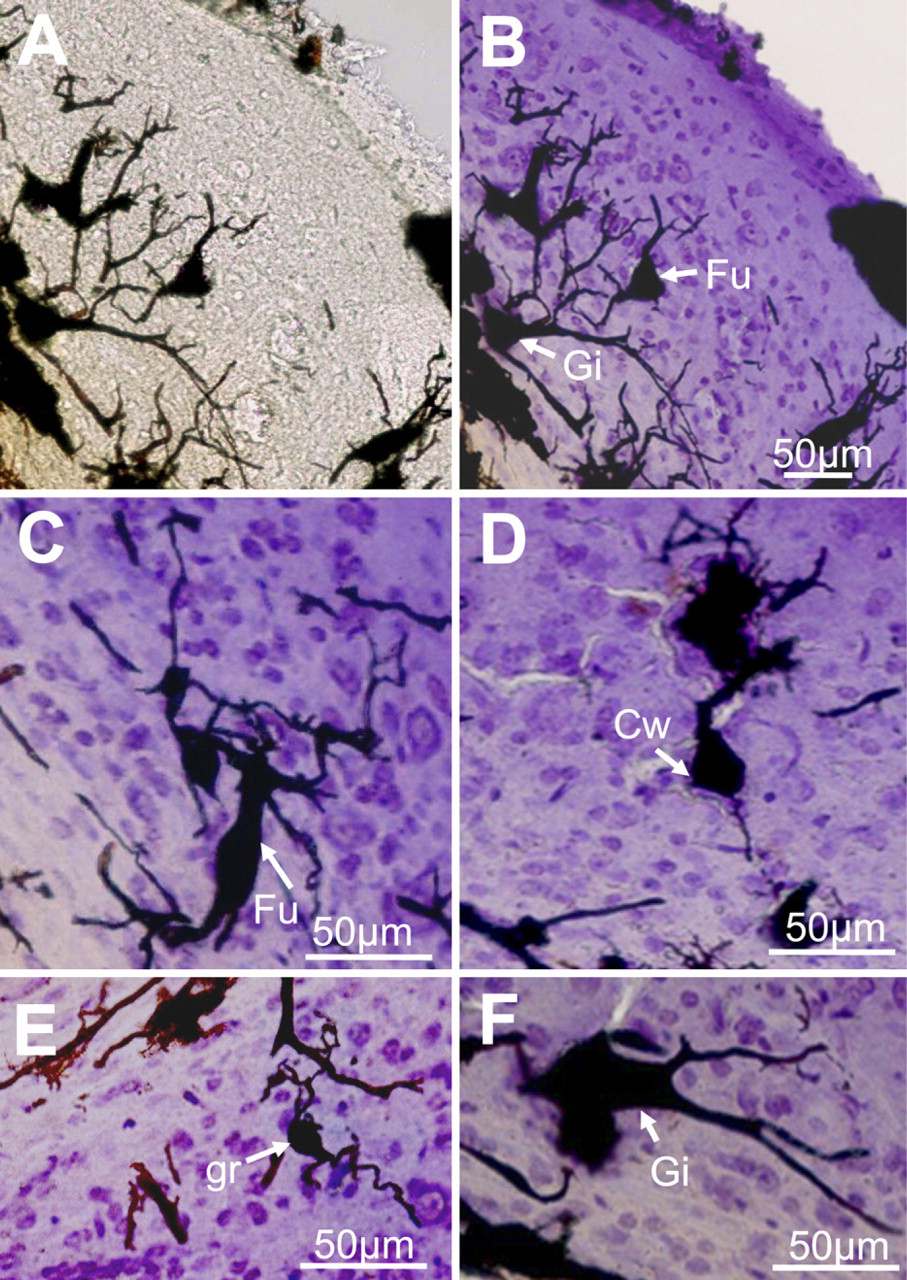
Combined cresyl violet and Golgi labeling of DCN neurons and cytoarchitecture. (
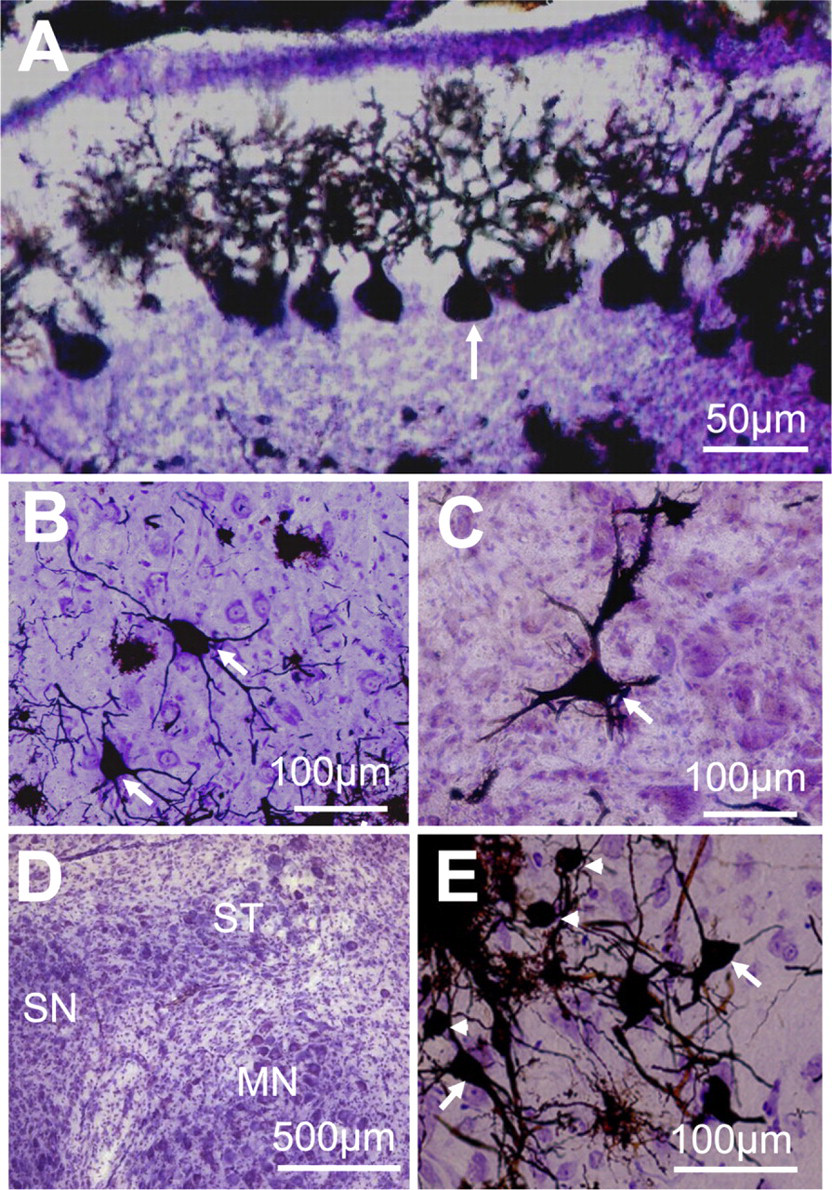
Combined labeling of neurons and cytoarchitecture in the cerebellum and brainstem nuclei. (
Characterization of the DCN Cytoarchitecture and Cellular Localization Within the Layers
We tested whether the DCN is made from a homogeneous cell population or whether it can be subdivided into layers. We validated the layers by labeling slices with cresyl violet and by establishing a matrix of nine rectangles distributed as three rows, an external, intermediate, and inner layer (see Materials and Methods), and we quantified the cellular density and the cell soma surface area within those rectangles (three rectangles are shown in Figure 4A). Figure 4C shows a plot of the soma surface area as a function of the cell density within those three layers. The external layer was characterized by the lowest cell density of 1.6 ± 0.7 cells/1000 μm2 (n=27 rectangles) compared with the cell density of 4.5 ± 1.0 cells/1000 μm2 (n=27) in the medial layer and the cell density of 7.2 ± 1.0 cells/1000 μm2 (n=27) in the inner layer (p<0.0001, two-factor ANOVA test). Cells in the intermediate layer were also characterized by a larger soma surface area (112 ± 18 μm2, n=18) compared with cells within the external layer (51 ± 6 μm2, n=18) and with cells within the inner layer (58 ± 11 μm2, n=18, p = 0.002, two-factor ANOVA test). Cell soma surface areas were similar for the same layer when the slices were chosen at three different depths within the DCN (n=6 rectangles and 3 rats, two-factor ANOVA test, p = 0.167). Our DCN cell layer organization is similar to the DCN laminar organization reported in previous studies (see Discussion), and we refer to the external layer as the molecular layer, the intermediate layer as the fusiform cell layer, and the inner layer as the deep layer. The combined Golgi–cresyl violet staining method therefore made it possible to localize the different cells within the three layers with a high degree of certainty. Figure 2 gives an overview of some morphological cell types observed in this study. Within the fusiform cell layer, fusiform cells are characterized by an elongated cell body of 34 ± 4 μm diameter (n=5) across their major axis and a diameter of 19 ± 3 μm (n=5) across their minor axis (Figures 2B and 2C) (Maruyama and Ohmori 2006). Fusiform cells are also characterized by basal dendrites directed toward the deep layer and apical dendrites directed toward the molecular layer. Usually, the apical dendrite divides into several branches (Figure 2C). Cartwheel cells are found at the boundary between the molecular layer and the fusiform cell layer and have a diameter of 14 and 22 μm (n=2), as well as a thick primary dendrite that gives rise to arborizations in the form of a tree that extends into the molecular layer (Figure 2D; Wouterlood and Mugnaini 1984). Giant cells with a cell body exceeding 30-μm diameter (diameter of 38 ± 7 μm, n=6) (Zhang and Oertel 1993) are characterized by multiple thick dendrites projecting along the deep layer and toward the fusiform cell layer (Figures 2B and 2F). Small-diameter cells likely to be granule cells (Mugnaini et al. 1980b) with an oval cell body and two to three primary dendrites were mainly found in the deep layer (diameter of 11 ± 2 μm, n=3) and also in the molecular layer (diameter of 9 ± 2 μm, n=3). Figure 2E shows a granule cell with its classically described dendritic claws (Mugnaini et al. 1980b).
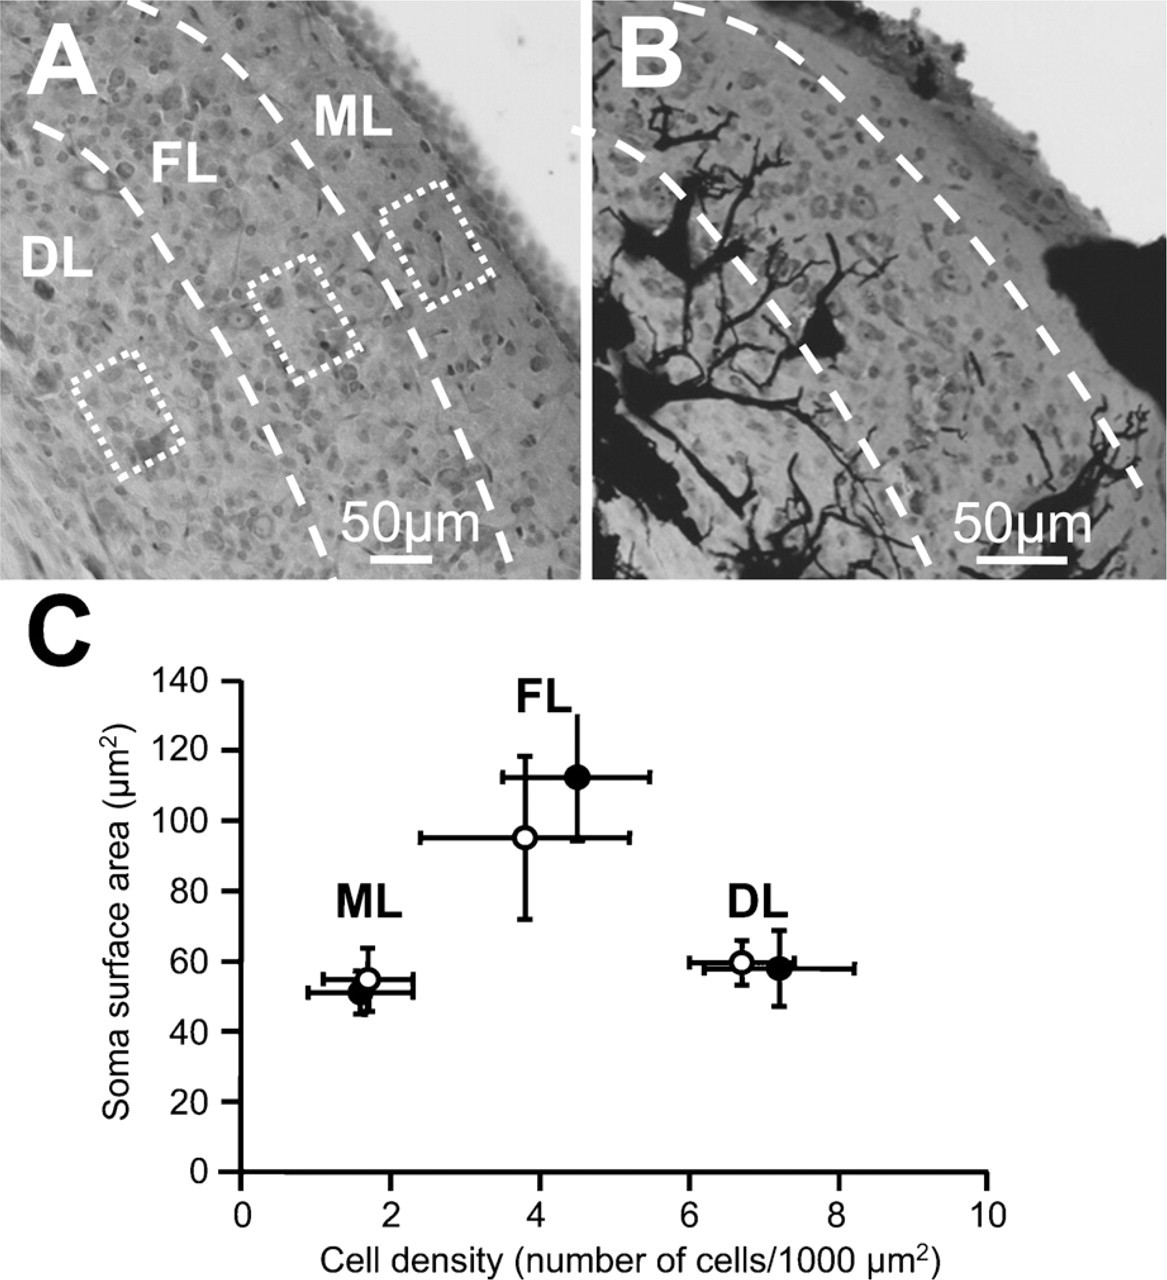
Analysis of the DCN architecture labeled with cresyl violet before and after Golgi staining. (
DCN Cytoarchitecture After Golgi Staining
We checked whether the Golgi staining procedures did not interfere fundamentally with the native cytoarchitecture of the DCN and quantified the cell density and the soma surface area of cresyl violet–stained sections previously stained with the Golgi method. Figure 4C represents an analysis of the DCN architecture on cresyl violet–stained cells without any previous Golgi staining (black circles) and after having previously labeled the tissue with the Golgi method (white circles). After Golgi and cresyl violet staining, DCN layers could still be distinguished by differences in their cell density and cell soma surface area. The external or molecular layer was still characterized by the lowest cell density of 1.7 ± 0.6 cells/1000 μm2 (n=24 rectangles) compared with the cell density of 3.8 ± 1.4 cells/1000 μm2 in the intermediate or fusiform layer (n=24) and to the cell density of 6.7 ± 0.7 cells/1000 μm2 (n=24) in the inner or deep layer (p<0.00001, two-factor ANOVA test). After Golgi and cresyl violet staining, cells in the fusiform layer were also characterized by a larger soma surface area (95 ± 23 μm2, n=16 rectangles) compared with cells within the molecular layer (55 ± 9 μm2, n=16) and with cells within the inner or deep layer (59 ± 6 μm2, n=16, p<0.00001, two-factor ANOVA test). Within each layer, Nissl-stained cell bodies had a similar soma surface area with or without previously labeling the tissue with the Golgi method (two-factor ANOVA test, p = 0.58, n=5 and 6 rectangles, respectively, containing between 100 and 400 cells per layer). Power analysis with values of 80% and 100% for 100 and 400 cells, respectively, indicates that our sample size is sufficient to detect a 10% variation of cell soma surface areas between the two staining conditions, further suggesting similar Nissl staining conditions in the presence or absence of Golgi staining. Cell densities were also similar for the same layer when the slices were chosen at three different depths within the DCN (n=9 rectangles and 3 rats, two-factor ANOVA test, p = 0.602), supporting the idea that the layer distribution is uniform throughout the DCN. Cell density was also similar within each particular layer, with or without previously labeling tissue with the Golgi method (two-factor ANOVA test, p = 0.73, n=9 and 6, respectively), showing that Nissl-stained layer characteristics stayed unchanged despite Golgi labeling.
Estimation of the Soma Surface Areas After Golgi or Cresyl Violet Staining
Although we found no difference in the Nissl-stained cytoarchitecture when we analyzed the cell bodies labeled with cresyl violet, we noticed that some cells labeled with the Golgi method had a bigger cell soma surface area compared with the average cell soma surface area obtained with cresyl violet staining. For example, giant cells are characterized by a soma surface area of 426 ± 181 μm2 (n=16) while stained with the Golgi method. This value exceeds by 2.5 times the highest values of the cell soma area measured in cresyl violet staining condition (172 ± 63 μm2, Student t-test, p = 1 × 10⁻⁵, n=16). We represented the ability of the two staining methods to differently label the cell soma surface area by their cumulative distributions of the soma surface areas (Figure 5). Cumulative distributions were represented for each cell layer (Figures 5A–5C) and seem to be different for the fusiform cell layer (Figure 5B) and the deep layer (Figure 5C), whereas no major difference was observed for the molecular layer (Figure 5A). This suggests that Golgi-labeled cells are bigger than cresyl violet–stained cells within the fusiform and the deep layers. This difference in the cell soma surface area between Golgi- and Nissl-stained cells can be represented as the area difference between the two curves represented in Figures 5A–5C. In the molecular layer (Figure 5A), 50% of cells have a soma surface area 953 μm2 when labeled with cresyl violet (n=67), and 50% of cells have a soma surface area 960 μm2 when labeled with the Golgi method (n=76). Maximal values (representing the total number of cells) are similar for both staining conditions (reaching ∼100 μm2). In the fusiform cell layer (Figure 5B), 50% of cells have a soma surface area 964 μm2 when labeled with cresyl violet (n=284), and 50% of cells have a soma surface area 9107 μm2 (n=291) when labeled with the Golgi method. Cell soma surface areas do not exceed 490 μm2 when stained with cresyl violet, whereas cell soma surface areas of Golgi-stained cells reach 674 μm2 when stained with the Golgi method. In the deep layer (Figure 5D), 50% of cells have a soma surface area 958 μm2 when labeled with cresyl violet (n=488), and 50% of cells have a soma surface area 981 μm2 when labeled with the Golgi method (n=377 cells). Cell soma surface area does not exceed 398 μm2 when staining with cresyl violet, whereas cell soma surface area of Golgi stained cells reach values of 883 μm2. We further tested whether there was any correlation between this area difference and the cell density reported for the different layers. Figure 5D shows a correlation (r 2 = 0.83) between the difference in the cell surface soma area obtained between the two staining methods and the cell density, indicating that bigger cells within a dense layer are more likely to be underestimated when quantified with the cresyl violet staining method. We estimated the soma surface area of cresyl violet stained cells using a standard cresyl violet staining method that used progressive dehydration and found similar soma surface area values using the standard cresyl violet staining procedure or the abbreviated cresyl violet staining of 55 ± 17 (61 cells) and 53 ± 19 μm2 (87 cells), respectively, in the molecular layer (p = 0.39, unpaired Student t-test), 123 ± 54 (88 cells) and 106 ± 98 μm2 (286 cells), respectively, in the fusiform layer (p = 0.12, unpaired Student t-test), and 56 ± 17 (124 cells) and 58 ± 24 μm2 (390 cells), respectively, in the deep layer (p = 0.48, unpaired Student t-test). We finally filled cartwheel, fusiform, and giant cells with Lucifer yellow to compare their cell soma surface area with those obtained with the Golgi method and found similar values of soma surface areas when cells were filled with Lucifer yellow or when labeled with the Golgi method (Figure 6).
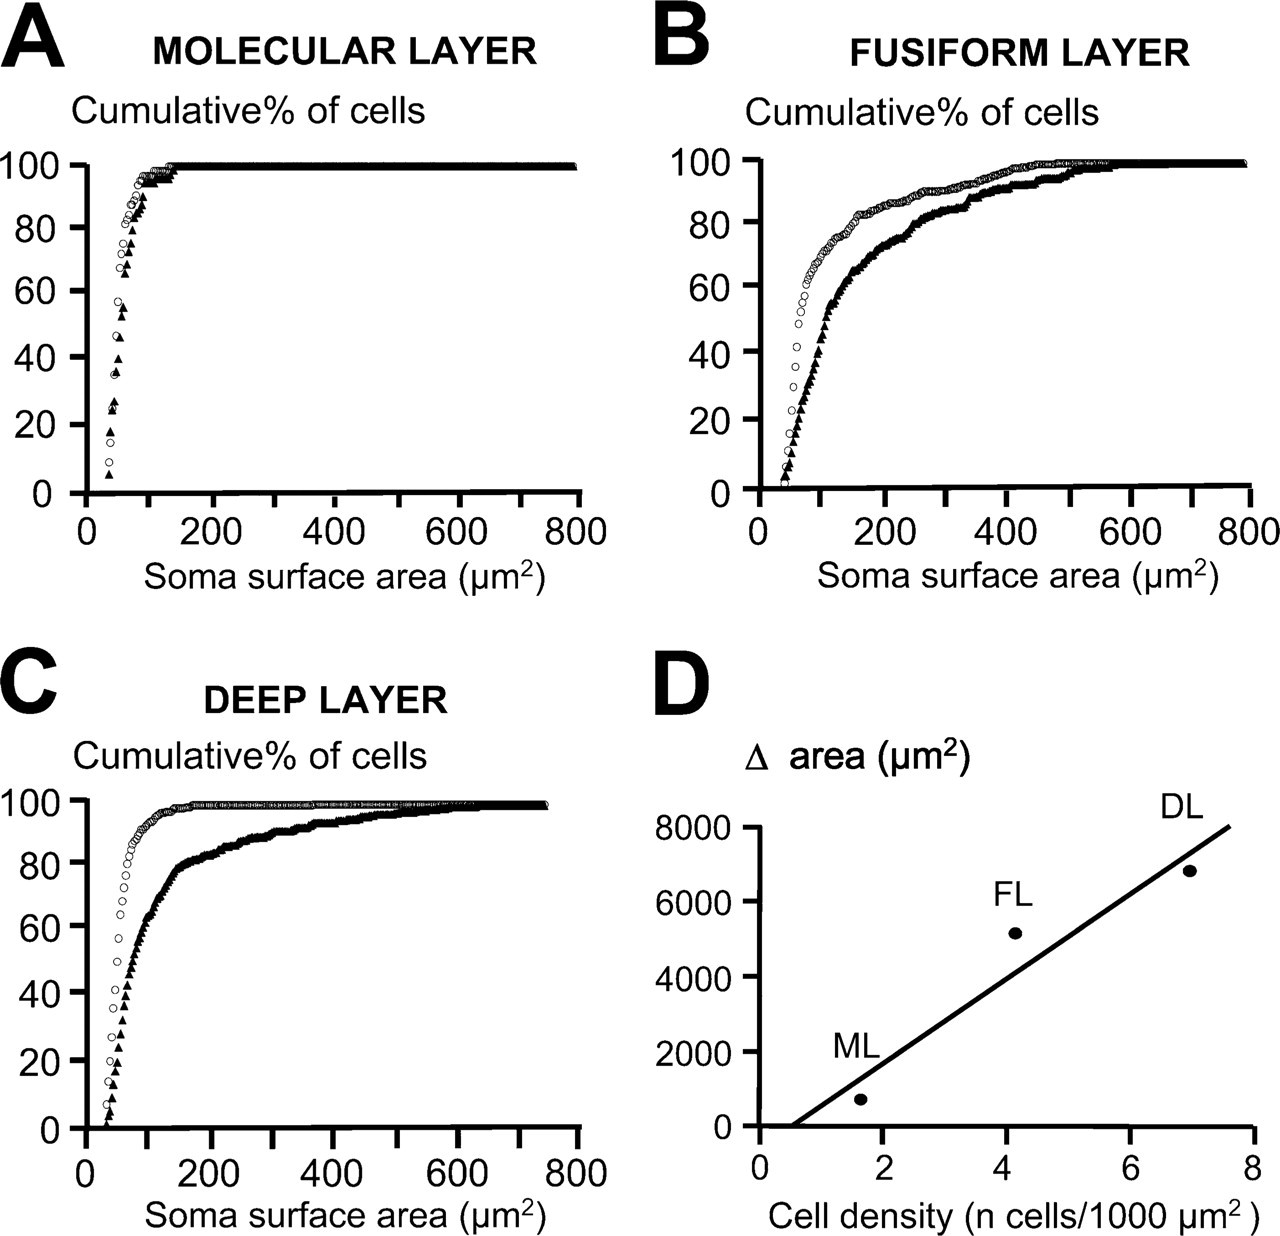
Comparative analysis of the cell soma surface area between cresyl violet–stained cells and Golgi-stained cells. A cumulative frequency plot represents the cumulative percentage of cells in function of the soma surface area of cells labeled with cresyl violet (white circle) and with the Golgi method (black triangle) for the molecular layer (
Discussion
The aim of this work was to set up a rapid method combining Golgi and Nissl staining so that we could study detailed neuronal morphology together with cytoarchitecture without using any form of intracellular labeling such as horseradish peroxidase (Oertel et al. 1990). We were able to characterize neuronal morphology directly from single tissue sections without having to reconstruct the neurons of interest (Blackstad et al. 1984). Using cresyl violet allowed us to characterize the cell layers within the DCN similar to those reported in previous studies from different species or different rat strains (Osen 1969; Brawer et al. 1974; Mugnaini et al. 1980a, b; Browner and Baruch 1982; Hackney et al. 1990). We used the Nissl stain alongside the Golgi silver staining method to place labeled neurons within those layers, and we were able to counterstain our tissue sections without the need to deimpregnate the silver stain as has been the case in previously published literature (Pasternak and Woolsey 1975; Werner and Brauer 1984; Werner et al. 1986, 1989). We also used this rapid method combining Golgi and Nissl staining in other brain areas. We had to overcome two major obstacles that attend the Golgi silver impregnation technique, first on its own and second, in combination with cresyl violet.
Cell Labeling Using the Rapid Golgi Method
The Golgi silver impregnation method is unreliable because potassium dichromate and silver nitrate can react unselectively, forming bulk crystals on the surface of the specimen inquestion (Pasternak and Woolsey 1975); therefore, the Golgi silver impregnation method has been modified by adding either formaldehyde to the potassium dichromate solution (Kopsch 1896) or glutaraldehyde (Colonnier 1964) to the potassium dichromate solution. Those methods have been shown to improve the quality and the reaction time of the Golgi staining. Other modifications such as using microwaves (Marani et al. 1987; Zhang et al. 2003), altering the composition of the chromation solution and its pH (Van der Loos 1956; Morest and Morest 1966; Adams 1979; Grandin et al. 1988; Angulo et al. 1994, 1996), or using a vacuum (Friedland et al. 2006) improved the labeling of neurons. We compared the quality of the Golgi staining by altering the aldehyde types (paraformaldehyde, glutaraldehyde, or chloral hydrate) and the pH of the phosphate buffer used in the chromating solution. We showed that potassium dichromate added into a phosphate-buffered medium at a weak basic pH (pH 7.6) with 5% paraformaldehyde favored the labeling of neurons over nonspecific labeling within the tissue. The nonspecific staining is likely caused by the uncontrolled chemical reaction between potassium dichromate, which acts as the primary impregnation compound, and the chromogen, silver nitrate. This chemical reaction is governed by the ratio of Cr3+ and Cr2O7 2-ions, which is dependent on the concentration of protons and the presence of aldehydes (Angulo et al. 1996). Chromium (III) cross-links the carboxyl terminal of intracellular proteins and binds to Cr2O7 2- (Angulo et al. 1996). Nevertheless, Cr3+ does not react with the silver nitrate in contrast to Cr2O7 2-, which produces the black silver chromate, thereby defining the morphological profile of neurons. The low-quality staining obtained at more acidic pH could be related to an excess of Cr3+relative to Cr2O7 2-. Good labeling conditions are therefore dependent on an adequate ratio of Cr3+ and Cr2O7 2- (Angulo et al. 1996).
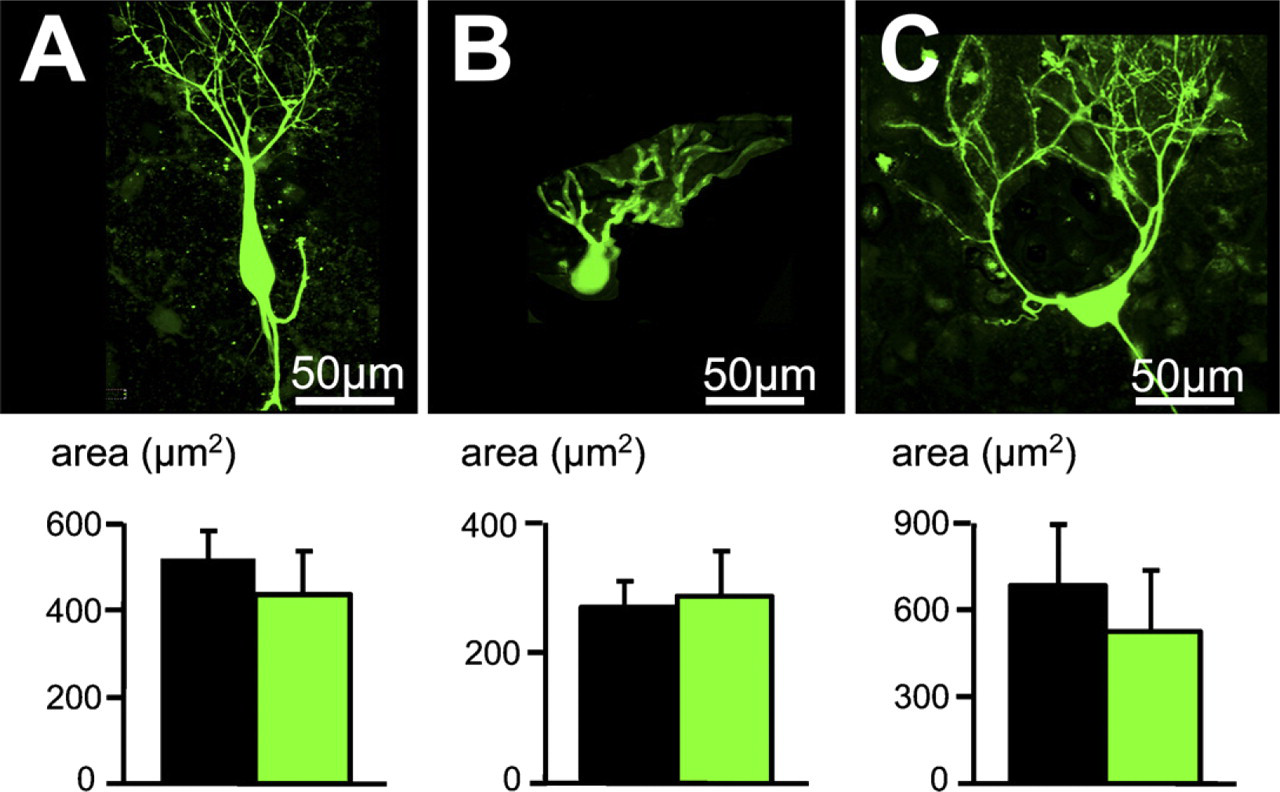
Comparative analysis of the cell soma surface area between Lucifer yellow–filled cells and Golgi-stained cells. (
Cytoarchitecture Labeling and Distribution of the Cell Types
Our analysis of the cell density and soma surface areas allowed us to characterize three layers within the Lister Hooded rat DCN similar to previous studies performed in other species or rat strains (Osen 1969; Brawer et al. 1974; Mugnaini et al. 1980a, b; Browner and Baruch 1982; Webster and Trune 1982; Oertel and Wu 1989; Hackney et al. 1990; Alibardi 2006). The peripheral (molecular) layer is characterized by a low density of cells in Nissl staining, and this is probably because of the fact that it contains mainly parallel fibers and processes of fusiform cells and cartwheel cells. In contrast to the molecular layer, the fusiform and the deep layers had higher densities of cells. Another difference was that cells within the fusiform cell layer had larger soma surface areas in Nissl stain compared with cells of the molecular and deep layers. Our results further showed that the laminar organization of the DCN seems to be unaffected by the Golgi staining histological procedures. Consequently, our combined Nissl–Golgi staining method can be used to characterize different cell types and assign them to specific DCN layers. From the observations made in this study, the predominant DCN cell types have been characterized and mapped within the three cell layers. Cartwheel cells are localized between the molecular and the fusiform cell layer, whereas fusiform cells are localized in the fusiform cell layer (Mugnaini 1985; Hackney et al. 1990; Maruyama and Ohmori 2006). Giant cells were localized in the deep layer (Hackney et al. 1990; Zhang and Oertel 1993), and granule cells are present mainly in the deep layer (Mugnaini et al. 1980b). The cellular composition and localization within the Lister Hooded rat DCN is similar to previous studies and therefore validates our rapid method combining the Golgi silver impregnation technique with Nissl staining, without the need for deimpregnation as an intervening step. Using the Golgi silver staining method, we were also able to label morphologically identified cells within the supratrigeminal nucleus that could only be located by its position relative to the trigeminal motor nucleus. The presence of pyramidal and small ovoid neurons within this structure suggests the coexistence of neuronal subgroups that could be involved in modulating the process of mastication (Donga and Lund, 1991).
Estimation of the Cell Soma Surface Area
Previous reports are based on quantifying differences in sizes and shapes of neuron somata within the cochlear nucleus using cresyl violet staining (Seldon and Clark 1991; Saada et al. 1996). Our study showed that Golgi-labeled cells had larger cell soma compared with their equivalents labeled with Nissl stain. This could be explained by Golgi precipitates bursting out of the cell body, making the cell body appear larger, but this is unlikely to be the case because cells filled with Lucifer yellow had similar soma surface areas as those measured in Golgi-stained cells. It is likely that cresyl violet staining tends to underestimate the cell soma surface area because of the Nissl stain being directed primarily at the Nissl substance of the cytoplasm and not at the boundaries of the cell (cell membrane). This might therefore explain why the general cell outline is underestimated by Nissl stain, hence the discrepancies in cell sizes between the Nissl and Golgi staining.
Given our use of an abbreviated Nissl staining procedure, it is theoretically possible that cell bodies may not have taken the stain satisfactorily, thereby explaining this discrepancy. To control for this possibility, we also measured neuronal cell bodies using the standard cresyl violet staining method that used progressive tissue dehydration (using graded ethanol solutions). When comparing neuronal staining obtained with the full and abbreviated dehydration methods, we found that cell body sizes were very similar, suggesting that we were unlikely to have underestimated neuronal cell body sizes as a result of the abbreviated dehydration procedure. Interestingly, Geisler et al. (2002) reported an increased staining intensity of the cell bodies when cresyl violet at a pH of 4.5–5 was used in combination with Luxol fast blue, and it is possible that the pH of the cresyl violet solution may have affected staining intensity, and possibly, neuronal cell body size. Our study showed that bigger cells within a dense layer are more likely to be underestimated when quantified with the cresyl violet staining method. This can be explained by the cellular overlap at high density making the estimation of the cell size unreliable. In contrast, Golgi-stained cells are easily distinguished from their background (unstained neighboring cells).
Footnotes
Acknowledgements
This work was supported by GlaxoSmithkline, Medi-search, and the Wellcome Trust.
The authors thank Ian Forsythe and Margaret Barnes Davies for comments on the manuscript, Tim Ecclestone from Nikon Instruments for technical advice, and Mike Mulheran for advice on power analysis.