
Abstract
Osteoporosis poses a significant global health concern, affecting both the elderly and young individuals, including athletes. Despite the development of numerous antiosteoporotic drugs, addressing the unique needs of young osteoporosis patients remains challenging. This study focuses on young rats subjected to ovariectomy (OVX) to explore the impact of high-molecular-weight hyaluronan (HA) on preventing OVX-induced osteoporosis. Twenty-four rats underwent OVX, while 12 underwent sham procedures (sham control group). Among the OVX rats, half received subcutaneous injections of HA (MW: 2700 kDa) at 10 mg/kg/week into their backs (OVX-HA group), whereas the other half received saline injections (0.5 ml/week) at the same site (OVX-saline group). OVX-HA group exhibited significantly higher percentages of osteoclast surface (Oc. S/BS), osteoblast surface per bone surface (Ob. S/BS), and bone volume/tissue volume (BV/TV) compared with OVX-saline group at the same age. The proportions of Ob. S/BS and BV/TV in the OVX-HA group closely resembled those of the sham control group, whereas the proportion of Oc. S/BS in the OVX-HA group was notably higher than that in the sham control group. In summary, the administration of HA significantly mitigated bone resorption and enhanced bone formation, suggesting a crucial role for HA in the treatment of young adult osteoporosis.
Introduction
Osteoporosis, driven by the global aging population, has become a significant concern.1–4 However, it extends beyond the elderly, affecting younger individuals due to factors like congenital female sex hormone deficiency or ovariectomy.5,6 Recent reports reveal low bone mineral density (BMD) in young female athletes,5,7,8 particularly those with the female athlete triad (FAT), encompassing menstrual irregularities, amenorrhea, and energy availability issues.9,10 While osteoporosis drugs like bisphosphonates, selective estrogen receptor modulators, parathyroid hormone, denosumab, and romosozumab show promise in enhancing BMD, preventing fractures, and improving Quality of Life,11–18 there is a notable gap in treating young female athletes effectively. This gap poses a potential risk of increased fractures in this demographic.
Previous research has highlighted hyaluronan (HA)’s positive impact on bone resorption and BMD in young rat models of osteoporosis induced by ovariectomy (OVX).19,20 HA, a naturally occurring substance produced by various cells within the human body, 21 serves as the primary ligand of the CD44 receptor. 22 The fact that CD44 receptors express on the surfaces of cell types involved in bone metabolism, such as osteoblasts, osteoclasts, and bone marrow cells,23,24 implies a potential relationship between HA and bone metabolism. Furthermore, recent studies have suggested that reactive oxygen species (ROS) may contribute to the apoptosis of osteocytes and osteoblasts, potentially leading to osteoporosis.25–29 High-molecular-weight HA, a specific form of HA, is believed to have the potential to mitigate the various effects of ROS on cancer cells.30–32 High-molecular-weight HA is widely employed in treating joint disorders like osteoarthritis and rheumatoid arthritis, known for its favorable safety profile.33–38 Consequently, the administration of high-molecular-weight HA could emerge as a novel treatment for osteoporosis in young adults.
Bone remodeling, a dynamic process encompassing both bone formation and resorption, is pivotal for comprehending bone metabolism. 39 While traditional measures like BMD assessments have provided valuable insights into bone health, 40 the field has seen recent advances emphasizing the significance of bone turnover markers. These markers offer a glimpse into the balance between bone formation and resorption, though they fall short in delivering detailed insights into localized bone remodeling. In contrast, bone morphometry, an underutilized technique in osteoporosis research, 41 provides a more comprehensive approach. It enables precise analysis of bone remodeling dynamics, capturing the intricate changes in bone formation and resorption processes while offering valuable data on diverse bone morphometric parameters, including bone structure and dynamics. 42 Despite being less common in osteoporosis studies, bone morphometry emerges as a pivotal tool for accurately assessing and comprehending bone metabolism.
This study aimed to investigate the impact of high-molecular-weight HA which was administered via subcutaneous injection to provide sustained release in preventing OVX-induced osteoporosis in young rats 43 by evaluating bone morphology. Our hypothesis was that subcutaneous injection of high-molecular-weight HA would mitigate the reduction in BMD in rats subjected to OVX.
Materials and Methods
Animals and Experimental Design
Six-week-old female Sprague–Dawley rats, weighing 133 ± 6 g, were procured from Charles River Laboratory Japan, Inc. The rats were housed under specific pathogen-free conditions and were subjected to either OVX or sham OVX at the Charles River facility in Japan. The rats were then injected subcutaneously into the central parts of their back with either saline (0.5 ml/week) or HA (MW: 2700 kDa; Denka Co Ltd, Japan) at a dose of 10 mg/kg/week. This study utilized a total of 36 rats with 12 rats allocated to each of three groups: the sham control group (rats with sham OVX), OVX-saline group (rats with OVX injected with saline), and OVX-HA group (rats with OVX injected with HA). The rats were sacrificed at two time points: 3 and 6 weeks after the injections (Fig. 1A). The left legs were designated for bone morphometry assessments, whereas the right legs were utilized for histopathological examinations.
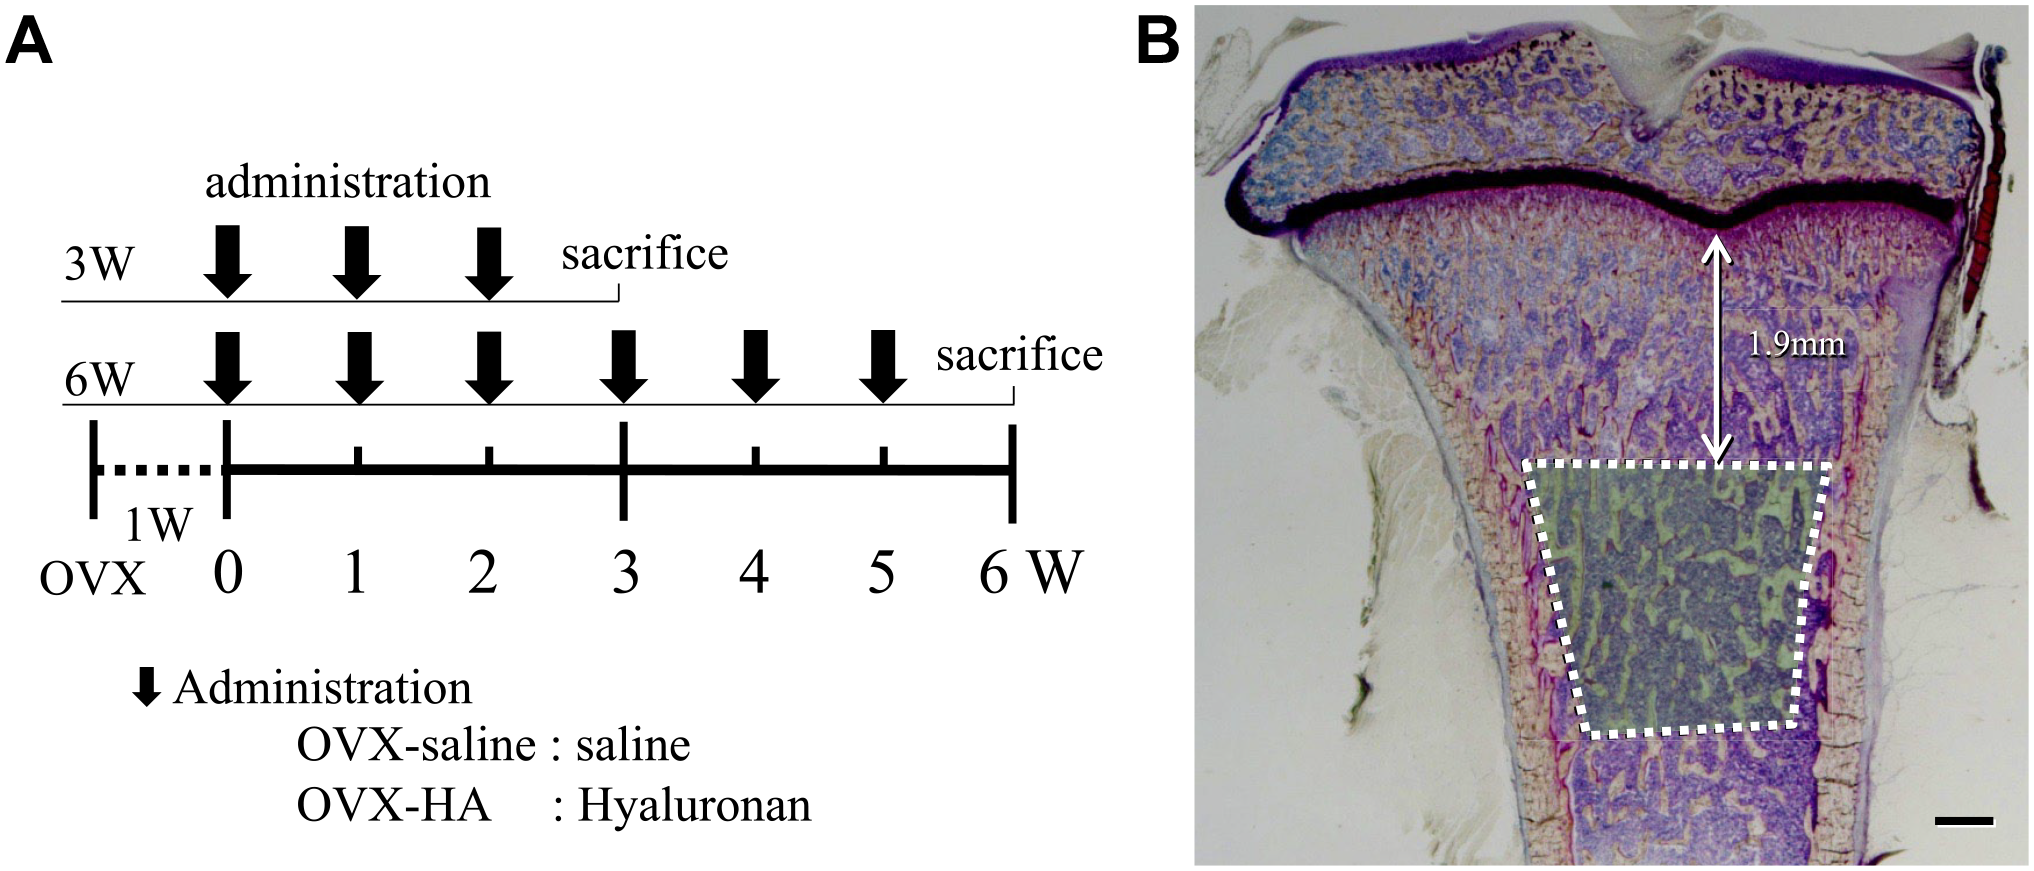
Treatment schedule and bone histomorphometric measurement region: A) Six-week-old female Sprague–Dawley rats underwent OVX, followed by subcutaneous injections of either saline (0.5 ml/week) or HA (10 mg/kg/week, MW: 2700 kDa). Rats were sacrificed at 3 and 6 weeks after injection. B) Bone histomorphometric analysis was conducted on secondary bone trabecular regions situated 1.9 mm below the tibial growth plate. Bar=500 μm (B).
Bone Histomorphometry
To assess bone formation rates, tetracycline hydrochloride (20 mg/kg; Sigma-Aldrich, St Louis, MO) and calcein (20 mg/kg; Sigma-Aldrich) were intravenously injected 2 and 5 days before the rats were sacrificed, respectively. The left tibias were employed for this analysis. Tissue samples were fixed with 70% ethanol, stained with Villanueva bone stain, embedded in methyl methacrylate, and sectioned (5 μm). Thin sections were prepared, and secondary bone trabecular regions located 1.9 mm below the tibial growth plate were analyzed (Fig. 1B). Subsequently, two of the five slides containing the maximum length of medullary cavity were selected for measurement to ensure the most comprehensive representation of the specimens. The bone formation rate is calculated using the distance between the two fluorescent bands, representing the mineralizing surface per bone surface (MS/BS, %), and the time interval between their administration, indicating the mineral apposition rate (MAR, μm). Statistical analysis involved ANOVA, and the data are presented as mean ± standard deviation of the mean. In addition, measured parameters included total bone volume per tissue volume (BV/TV, %), trabecular thickness (Tb. Th, μm), osteoid surface per bone surface (OS/BS, %), osteoblast surface per bone surface (Ob. S/BS, %), osteoid thickness (O. Th, μm), eroded surface per bone surface (ES/BS, %), osteoclast surface per bone surface (Oc. S/BS, %), and bone formation rate per bone surface (BFR/BS, μm3/μm2/year)
Histopathology
The right tibias were fixed with 10% formalin neutral buffer solution (pH 7.4). The samples were decalcified with 0.5 mol/l EDTA (pH 7.5) for 7 days, and subsequently embedded in paraffin. A paraffin-embedded tibia was cut into 4-μm-thick sections. After deparaffinization, the samples were stained with Masson’s trichrome (Muto Pure Chemicals Co., Ltd., Japan). Sections were observed under Imager A1 (Carl Zeiss Co., Ltd.; Japan), and optical and polarized images were obtained. Two of the five slides containing the maximum length of medullary cavity were used for measurement.
HA Staining
Following the deparaffinization of the paraffin-embedded samples, the samples underwent a reaction with biotinylated hyaluronic acid binding protein (B-HABP) (2 μg/ml) (Seikagaku Biobusiness Corporation; Japan) and were then incubated with DyLight 488 Streptavidin (Vector Laboratories, Inc.; CA). 44 As a control, samples were immersed in Streptomyces hyalurolyticus (Seikagaku Fine Biochemicals; Japan) at a concentration of 100 TRU/ml and kept at 37C for 1 hr. Immunofluorescence images were captured via Imager A1 (Carl Zeiss Co., Ltd).
Statistical Analysis
The statistical significance of differences between groups was evaluated using the Mann–Whitney U t-test. For the testing of all hypotheses, a two-sided α threshold of 0.05 was considered statistically significant. All statistical analyses were conducted using SPSS Statistics version 24.0 software (IBM; Armonk, NY) and Excel software (Microsoft; Redmond, WA).
Study Approval
All rat protocols were approved by the Murayama Medical Center Institutional Review Board, and all experiments were carried out based on committee guidelines.
Results
The Body Weight of Rats
The body weights of all three groups showed a consistent increase over the 6-week period. Notably, a more pronounced weight gain was evident from 0 to 3 weeks following either HA or saline administration compared with the subsequent 3–6 weeks. Between 1 and 6 weeks postinjection, the body weights of rats in both the OVX-HA and OVX-saline groups were significantly higher than those of rats in the sham control group (p<0.05) (Fig. 2).
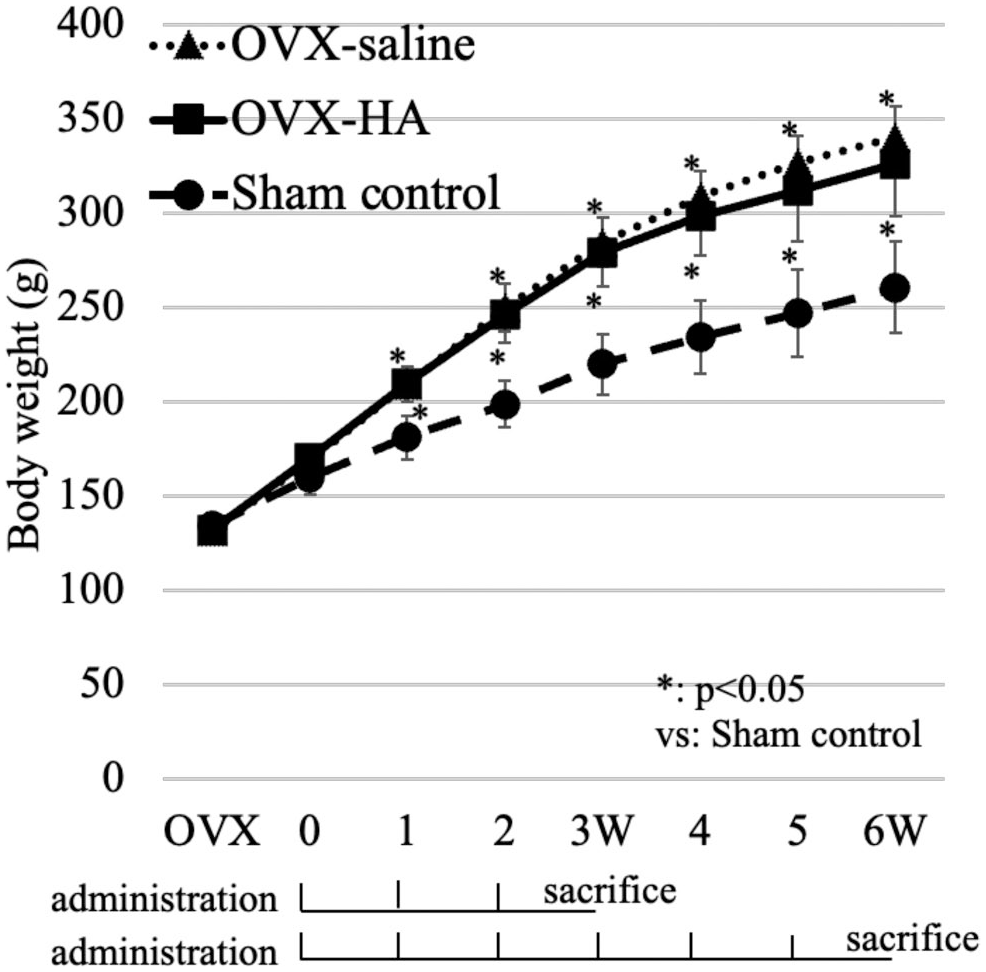
The body weight of rats: The line graph shows the body weight of all the rats in OVX-HA, OVX-saline, and sham control groups. From 2 to 6 weeks following the initial injection, rats in both the OVX-HA and OVX-saline groups exhibited a statistically significant increase in body weight compared with the sham control group *p<0.05, Mann–Whitney U test.
Histology of Osteoclast
In the sham control group at 3 weeks after the initial administration of saline or HA to the other groups, one osteoclast was located in one scallop as its cell body was buried in the scallop. In the OVX-saline group at the same time after the initial administration of saline, big multinuclear osteoclasts existed, and the bottom side of their cell bodies spread on the eroded surface, with long cell bodies branching like ameba. The staining intensity of the nuclear and cell bodies was lower in the OVX-saline group than in the sham control group. In the OVX-HA group at the same point, like in the sham control group, osteoclasts whose cell bodies were almost buried in shallow scallops were observed. Their cell bodies were a bit smaller than those in the OVX-saline group (Fig. 3).
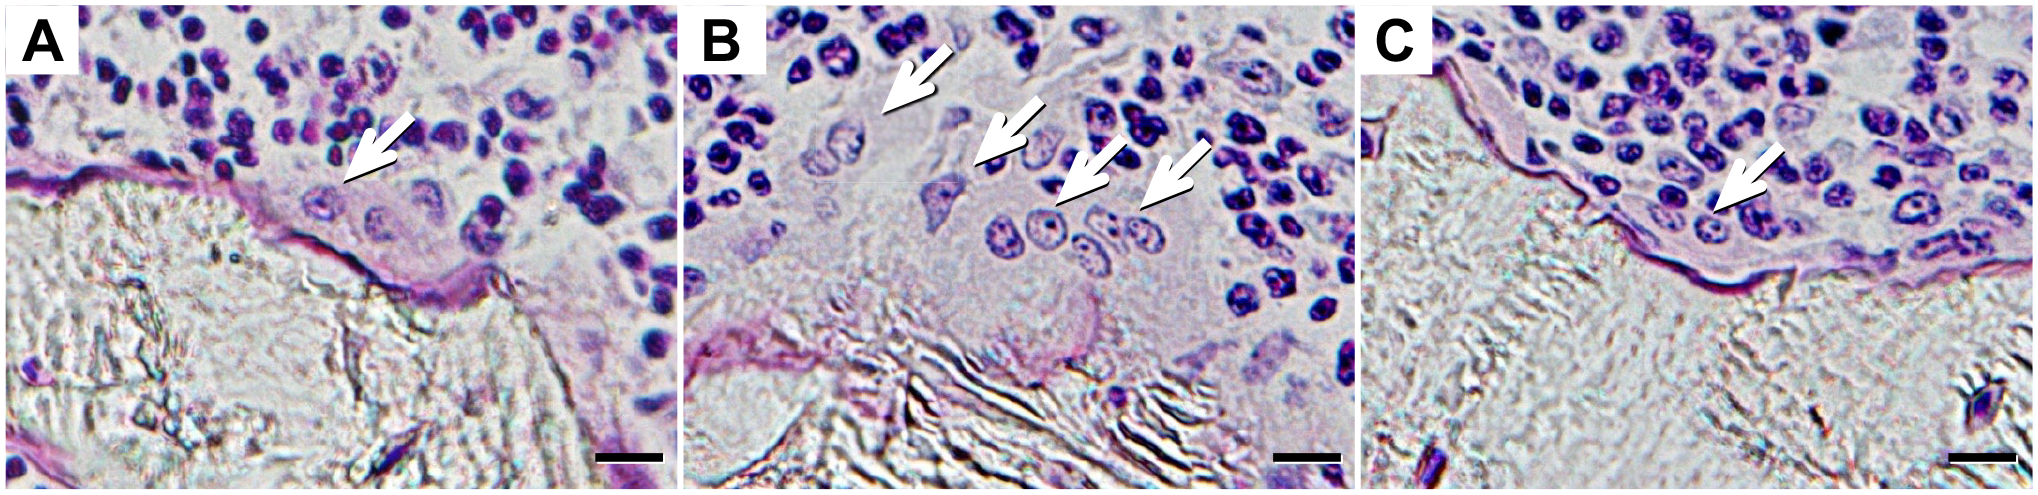
Villanueva bone stain: A) Sham control (3W). B) OVX-saline (3W). C) OVX-HA (3W). White arrow indicates larger multinuclear osteoclasts in the OVX-saline group compared with sham control and OVX-HA groups. Bar=10 μm (A) to (C).
Histology of Osteoblast
Osteoblasts in the sham control group at 3 weeks after the first injection of saline or HA to the other groups had a bit flat shape with lower heights than those in the OVX-saline group at the same point. In the OVX-HA group at the same time, the cell body of an osteoblast was very high with wide nucleuses. The O. Th in the OVX-HA group was wider than that in the sham control and the OVX-saline group (Fig. 4A to C). The double bone labeling width with tetracycline and calcein in the OVX-saline group was wider than that in the sham control group but the same as that in the OVX-HA group (Fig. 4D to F).
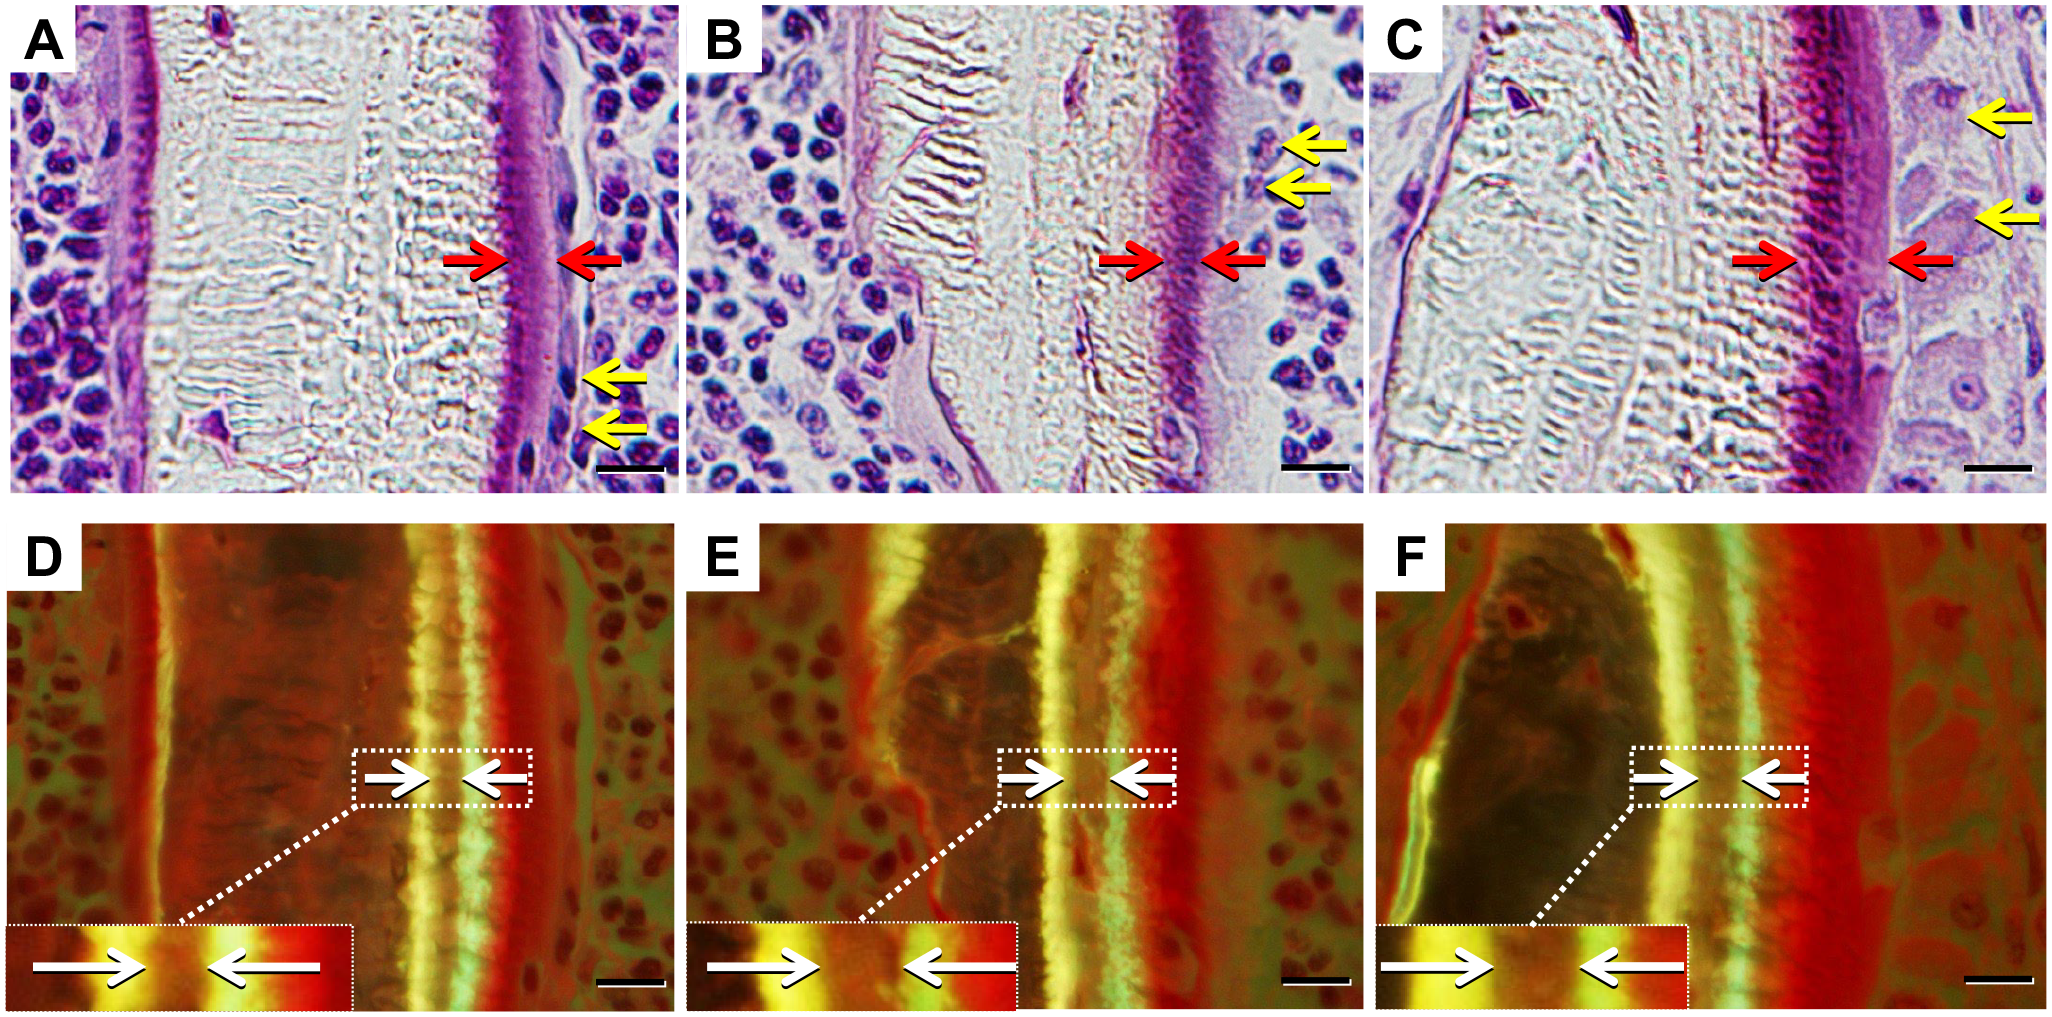
Histology of osteoblast Villanueva bone stain: A) Sham control (3W), B) OVX-saline (3W), C) OVX-HA (3W). Double bone labeling with tetracycline and calcein: D) Sham control (3W), E) OVX-saline (3W), F) OVX-HA (3W). Double bone labeling is observed just beneath the osteoid surface. Red arrow indicates wider osteoid thickness in the OVX-HA group compared with the sham control and OVX-saline groups. Yellow arrow indicates taller osteoblasts with wide nuclei. White arrow indicates wider double bone labeling width in the OVX-saline and the OVX-HA group than in the sham control group. Bar=10 μm (A) to (F).
Bone Volume and Osteoid Surface
In the sham control group at 3 weeks after the initial injection of saline or HA to the other groups, there were thick plate-shaped trabecular bone and osteoid surface was seen on the irregular bone surface of the trabecular bone. Meanwhile, in the OVX-saline group at the same time, island- or rod-shaped bone trabecular scattered with no continuity of the bone trabecular, and the bone volume was significantly lower than that in the sham control group. In the OVX-HA group at the same point, thick trabecula bone gathered, and the continuity of the trabecular bone was observed. Both trabecular bone surfaces were covered with osteoid surfaces in the OVX-HA group, whereas osteoid surfaces were observed in one side of trabecular bone surfaces in the sham control and OVX-saline groups (Fig. 5A to C).
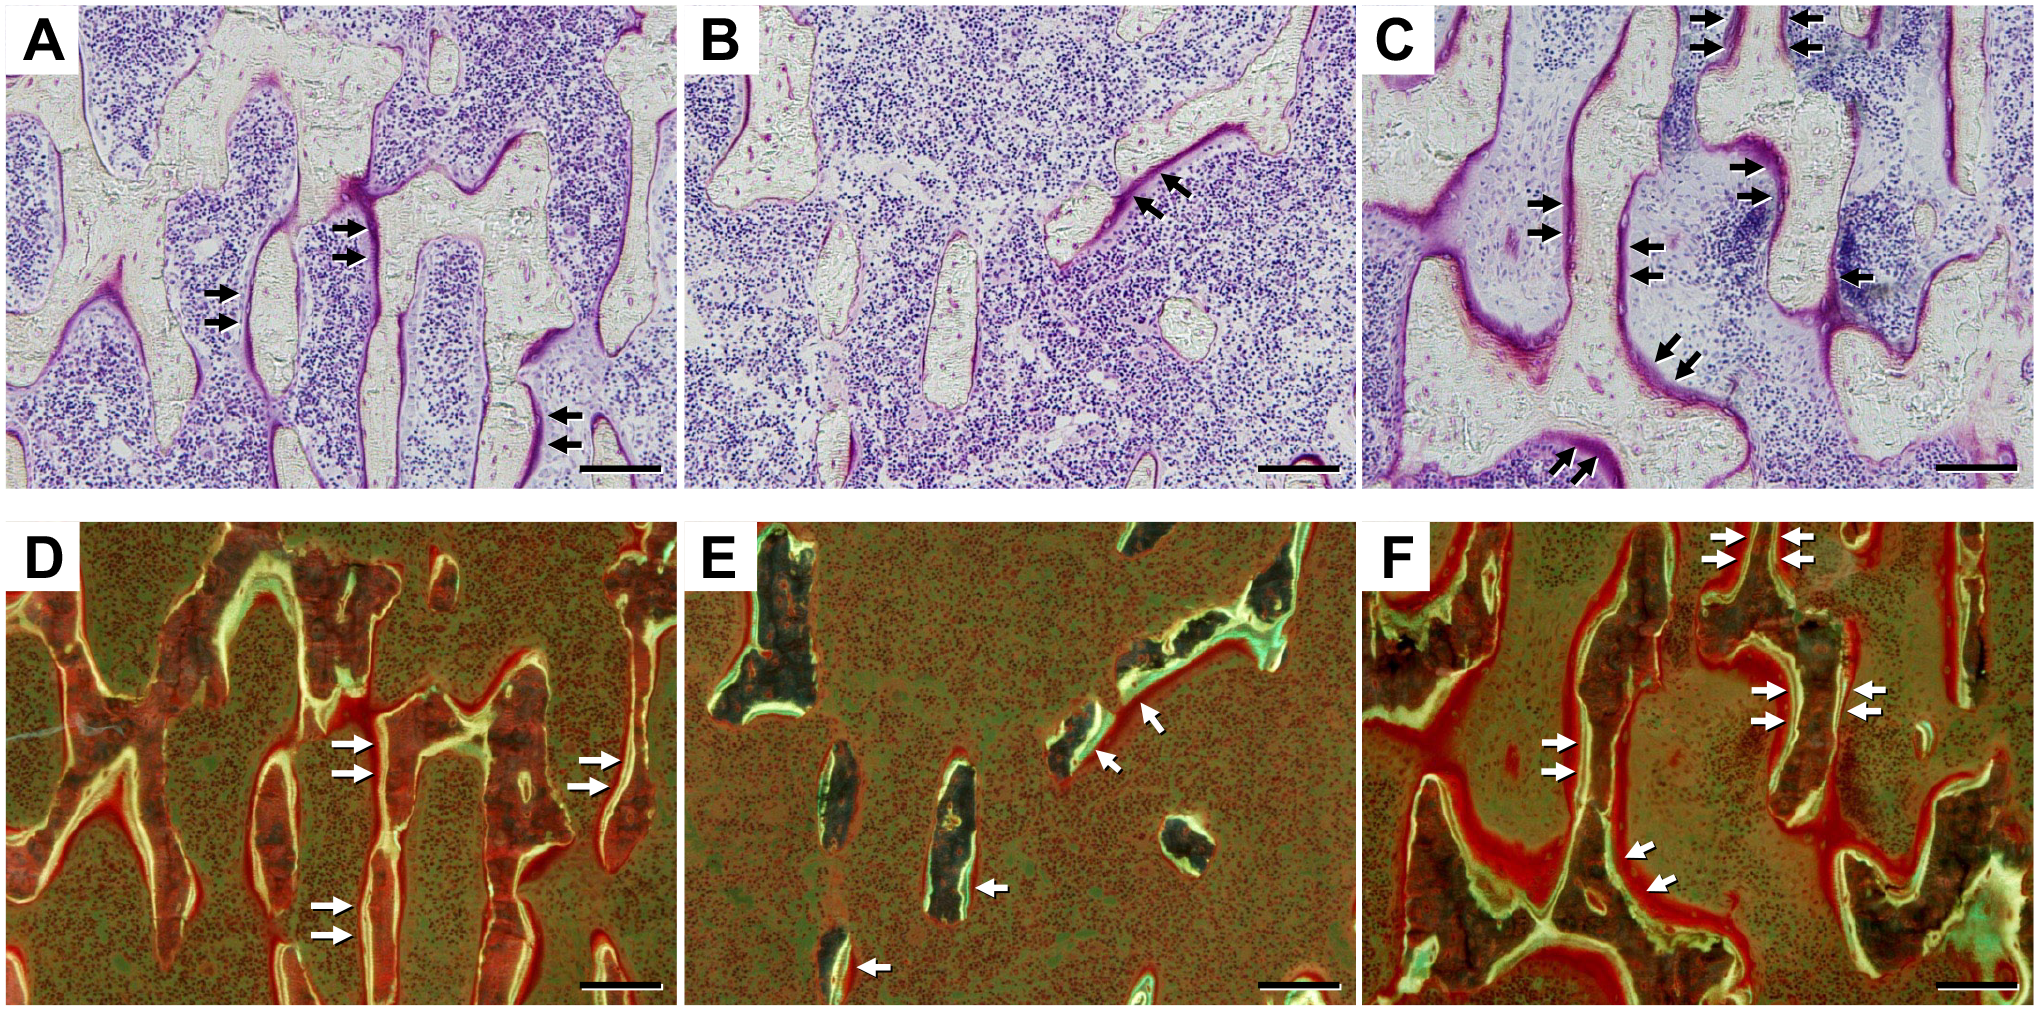
Bone volume and osteoid surface Villanueva bone stain: A) Sham control (3W), B) OVX-saline (3W), C) OVX-HA (3W). Double bone labeling with tetracycline and calcein: D) Sham control (3W), E) OVX-saline (3W), F) OVX-HA (3W). In the OVX-saline group, bone volume is lower than in the sham control and OVX-HA groups. Both trabecular bone surfaces are covered with osteoid surfaces in the OVX-HA group, while osteoid surfaces are observed on one side of trabecular bone surfaces in the sham control and OVX-saline groups. Black arrows indicate osteoid surface (A), (B), (C), while white arrows denote areas labeled with tetracycline and calcein (D), (E), (F). Bar=100 μm (A) to (F).
Double Bone Labeling
In the sham control group at 3 weeks after the first injection of saline or HA to the other groups, double bone labeling was observed just below the osteoid surface but located in only one side of the surfaces, whereas it was seen on the one sides of small numbers of island- or rod-shaped bone. In the OVX-HA group at the same point, as opposed to the sham control and the OVX-saline groups, double bone labeling existed on both bone surfaces of the trabecular bones (Fig. 5D to F).
Bone Histomorphometry
Oc. S/BS (%) in OVX-saline rats at 3 weeks after the initial administration were significantly elevated compared with the sham control and OVX-HA rats at the same time points (p<0.01). Specifically, the sham control group exhibited 8.3 ± 1.1%, the OVX-saline group had 15.0 ± 3.0%, and the OVX-HA group showed 8.9 ± 2.8%. This trend persisted at 6 weeks, with the sham control group at 7.7 ± 2.2%, the OVX-saline group at 14.7 ± 2.0%, and the OVX-HA group at 7.3 ± 1.9% (Fig. 6).
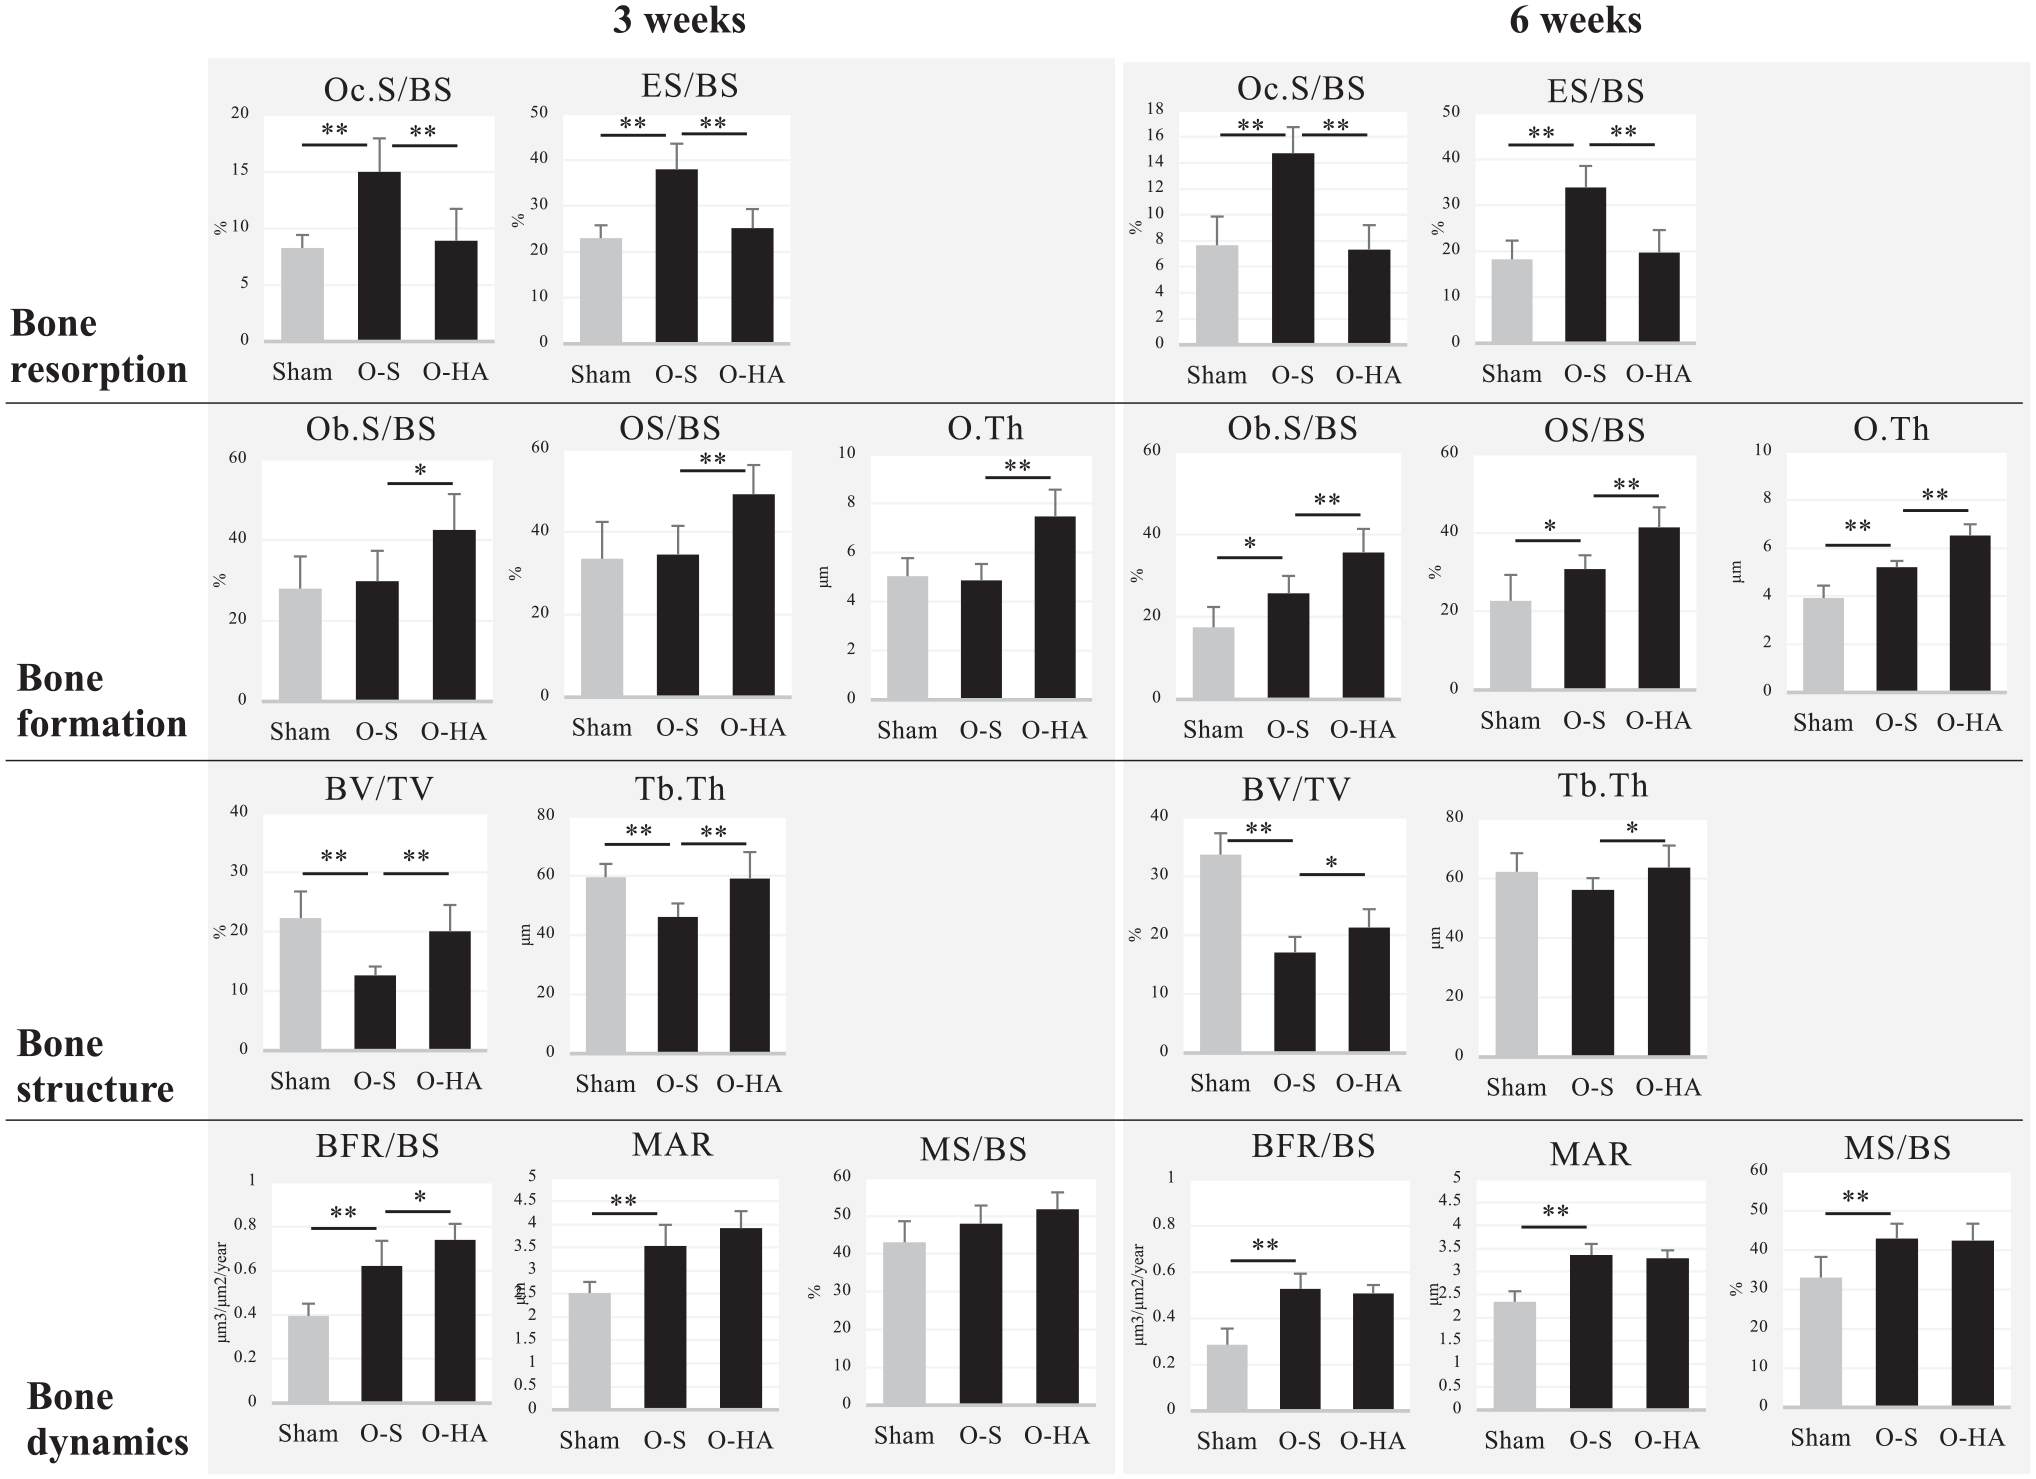
Bone histomorphometry: In the OVX-saline group, bone resorption at 3 and 6 weeks after the first injection is higher than in the sham control group, but bone formation at 3 weeks is almost the same as that in the sham control group. In the OVX-HA group, bone formation is higher than in the OVX-saline group, whereas bone resorption is lower than in the OVX-saline group. Bone structure in the sham control and OVX-HA group is higher than in the sham control group. Bone dynamics in the OVX-saline group is higher than in the sham control group but almost the same as in the OVX-HA group. Abbreviation: sham: sham control, O-S: OVX-Saline, O-HA: OVX-HA, Oc.S: osteoclast surface, BS: bone surface, ES: eroded surface, Ob.S: osteoblast surface, OS: osteoid surface, O. Th: osteoid thickness, BV: bone volume, TV: tissue volume, Tb. Th: trabecular thickness, BFR: bone formation rates, MAR: mineral apposition rate, MS: mineralized surface, *p<0.05, **p<0.01, Mann–Whitney U test.
Similarly, the ES/BS (%) in OVX-saline rats at 3 weeks after the first administration exhibited significantly higher percentages compared with the sham control and OVX-HA rats at the corresponding time points (p<0.01). Specifically, the sham control group had 23.0 ± 2.8%, the OVX-saline group had 38.0 ± 5.6%, and the OVX-HA group had 25.2 ± 4.2%. This pattern endured at the 6-week mark, wherein the sham control group demonstrated rates of 18.2 ± 4.7%, the OVX-saline group exhibited percentages of 33.9 ± 4.7%, and the OVX-HA group displayed values of 19.7 ± 4.9% (Fig. 6).
Ob.S/BS (%) and OS/BS (%) were significantly higher in OVX-HA rats at 3 weeks after the initial administration than those in the sham control and OVX-saline groups (Ob.S/BS: p<0.05, OS/BS: p<0.01): sham control 28.0 ± 8.0% and 33.5 ± 8.9%, OVX-saline 29.8 ± 7.5% and 34.5 ± 7.0%, OVX-HA 42.5 ± 8.9% and 49.2 ± 7.1% in Ob.S/BS and OS/BS, respectively. In addition, the O. Th (μm) in OVX-HA rats at 3 weeks after the first administration was significantly wider than that in the sham control and OVX-saline groups (p<0.05): sham control 5.0 ± 0.7 µm, OVX-saline 4.9 ± 0.7µm, OVX-HA 7.5 ± 1.1µm. The same trends were observed in all parameters at 6 weeks: sham control 17.5 ± 4.9%, 22.7 ± 6.6%, and 3.9 ± 0.5 µm; OVX-saline 25.7 ± 4.2%, 30.8 ± 3.5%, and 5.2 ± 0.3 µm; and OVX-HA 35.6 ± 5.7%, 41.4 ± 5.1%, and 6.5 ± 0.5 µm in Ob. S/BS, OS/BS, and O. Th, respectively (Fig. 6).
At 3 weeks after the initial administration, the BV/TV (%) and Tb. Th (μm) showed significantly lower percentages in the OVX-saline rats than the sham and OVX groups (p<0.01): sham control 22.3 ± 4.5% and 59.5 ± 4.5 µm, OVX-saline 12.7 ± 1.5% and 46.1 ± 4.6 µm, and OVX-HA 20.1 ± 4.4% and 59.1 ± 8.9µm in BV/TV and Tb. Th, respectively. Regarding BV/TV and Tb. Th at 6 weeks after the first injection, the values for the OVX-HA and sham control groups were higher than those for the OVX-saline group (p<0.05), but the difference between the OVX-saline and sham control groups was not significant (p=0.10): sham control 33.7 ± 3.6% and 62.3 ± 6.2 µm, OVX-saline 17.1 ± 2.7% and 56.2 ± 4.0 µm, and OVX-HA 21.3 ± 3.1% and 63.7 ± 7.4 µm in BV/TV and Tb. Th, respectively (Fig. 6).
At 3 weeks after the initial administration, the BFR/BS (μm3/μm2/year) and MAR (μm) in the OVX-HA and OVX-saline groups were faster than those in the sham control group (p<0.01): sham control 0.39 ± 0.06 and 2.5 ± 0.2, OVX-saline 0.62 ± 0.11 μm3/μm2/year and 3.5 ± 0.5 OVX-HA 0.74 ± 0.07 μm3/μm2/year and 3.9 ± 0.4 in BFR/BS and MAR, respectively. This trend persisted at the 6-week mark, with BFR/BS and MAR values in the sham control group at 0.29 ± 0.07 μm3/μm2/year and 2.3 ± 0.2 μm, respectively. In the OVX-saline group, the corresponding values were 0.53 ± 0.07 μm3/μm2/year and 3.4 ± 0.2 μm, while in the OVX-HA group, they were 0.51 ± 0.04 μm3/μm2/year and 3.3 ± 0.2 μm (Fig. 6).
On the other hand, the figure for MS/BS (%) in the sham control group at 3 weeks was lower than that in the OVX-HA group at the same time period, and at 6 weeks, the figure in the sham control group was significantly smaller than that in the OVX-saline and OVX-HA groups (p<0.01): sham control 43.1 ± 5.6% and 33.0 ± 5.3%, OVX-saline 48.0 ± 4.8% and 43.0 ± 3.8%, and OVX-HA 51.8 ± 4.5% and 42.4 ± 4.3% at 3 and 6 weeks, respectively (Fig. 6).
Masson Trichrome Stain
Masson trichrome stain showed red and blue stained areas. At 6 weeks after the initial administration, low magnification examination revealed the presence of numerous wide plate-shaped trabecular bones stained with both red and blue in the sham control and OVX-HA group. The red stained areas appeared to align in longitudinal directions (Fig. 7A and D). OVX-HA group revealed the same findings as that of sham control group (Fig. 7C). In contrast, in the OVX-saline group, there was a noticeable decrease in the amount of trabecular bone, with scattered red island bones and bone marrow fat (Fig. 7B). Under high magnification, the substrate of spindle-shaped bone cells exhibited red staining in both the sham control and OVX-HA group, while the round-shaped bone cells displayed blue staining (Fig. 7D and F). In contrast, the entire areas of island bones with layered structures in the OVX-saline group were stained red (Fig. 7E).
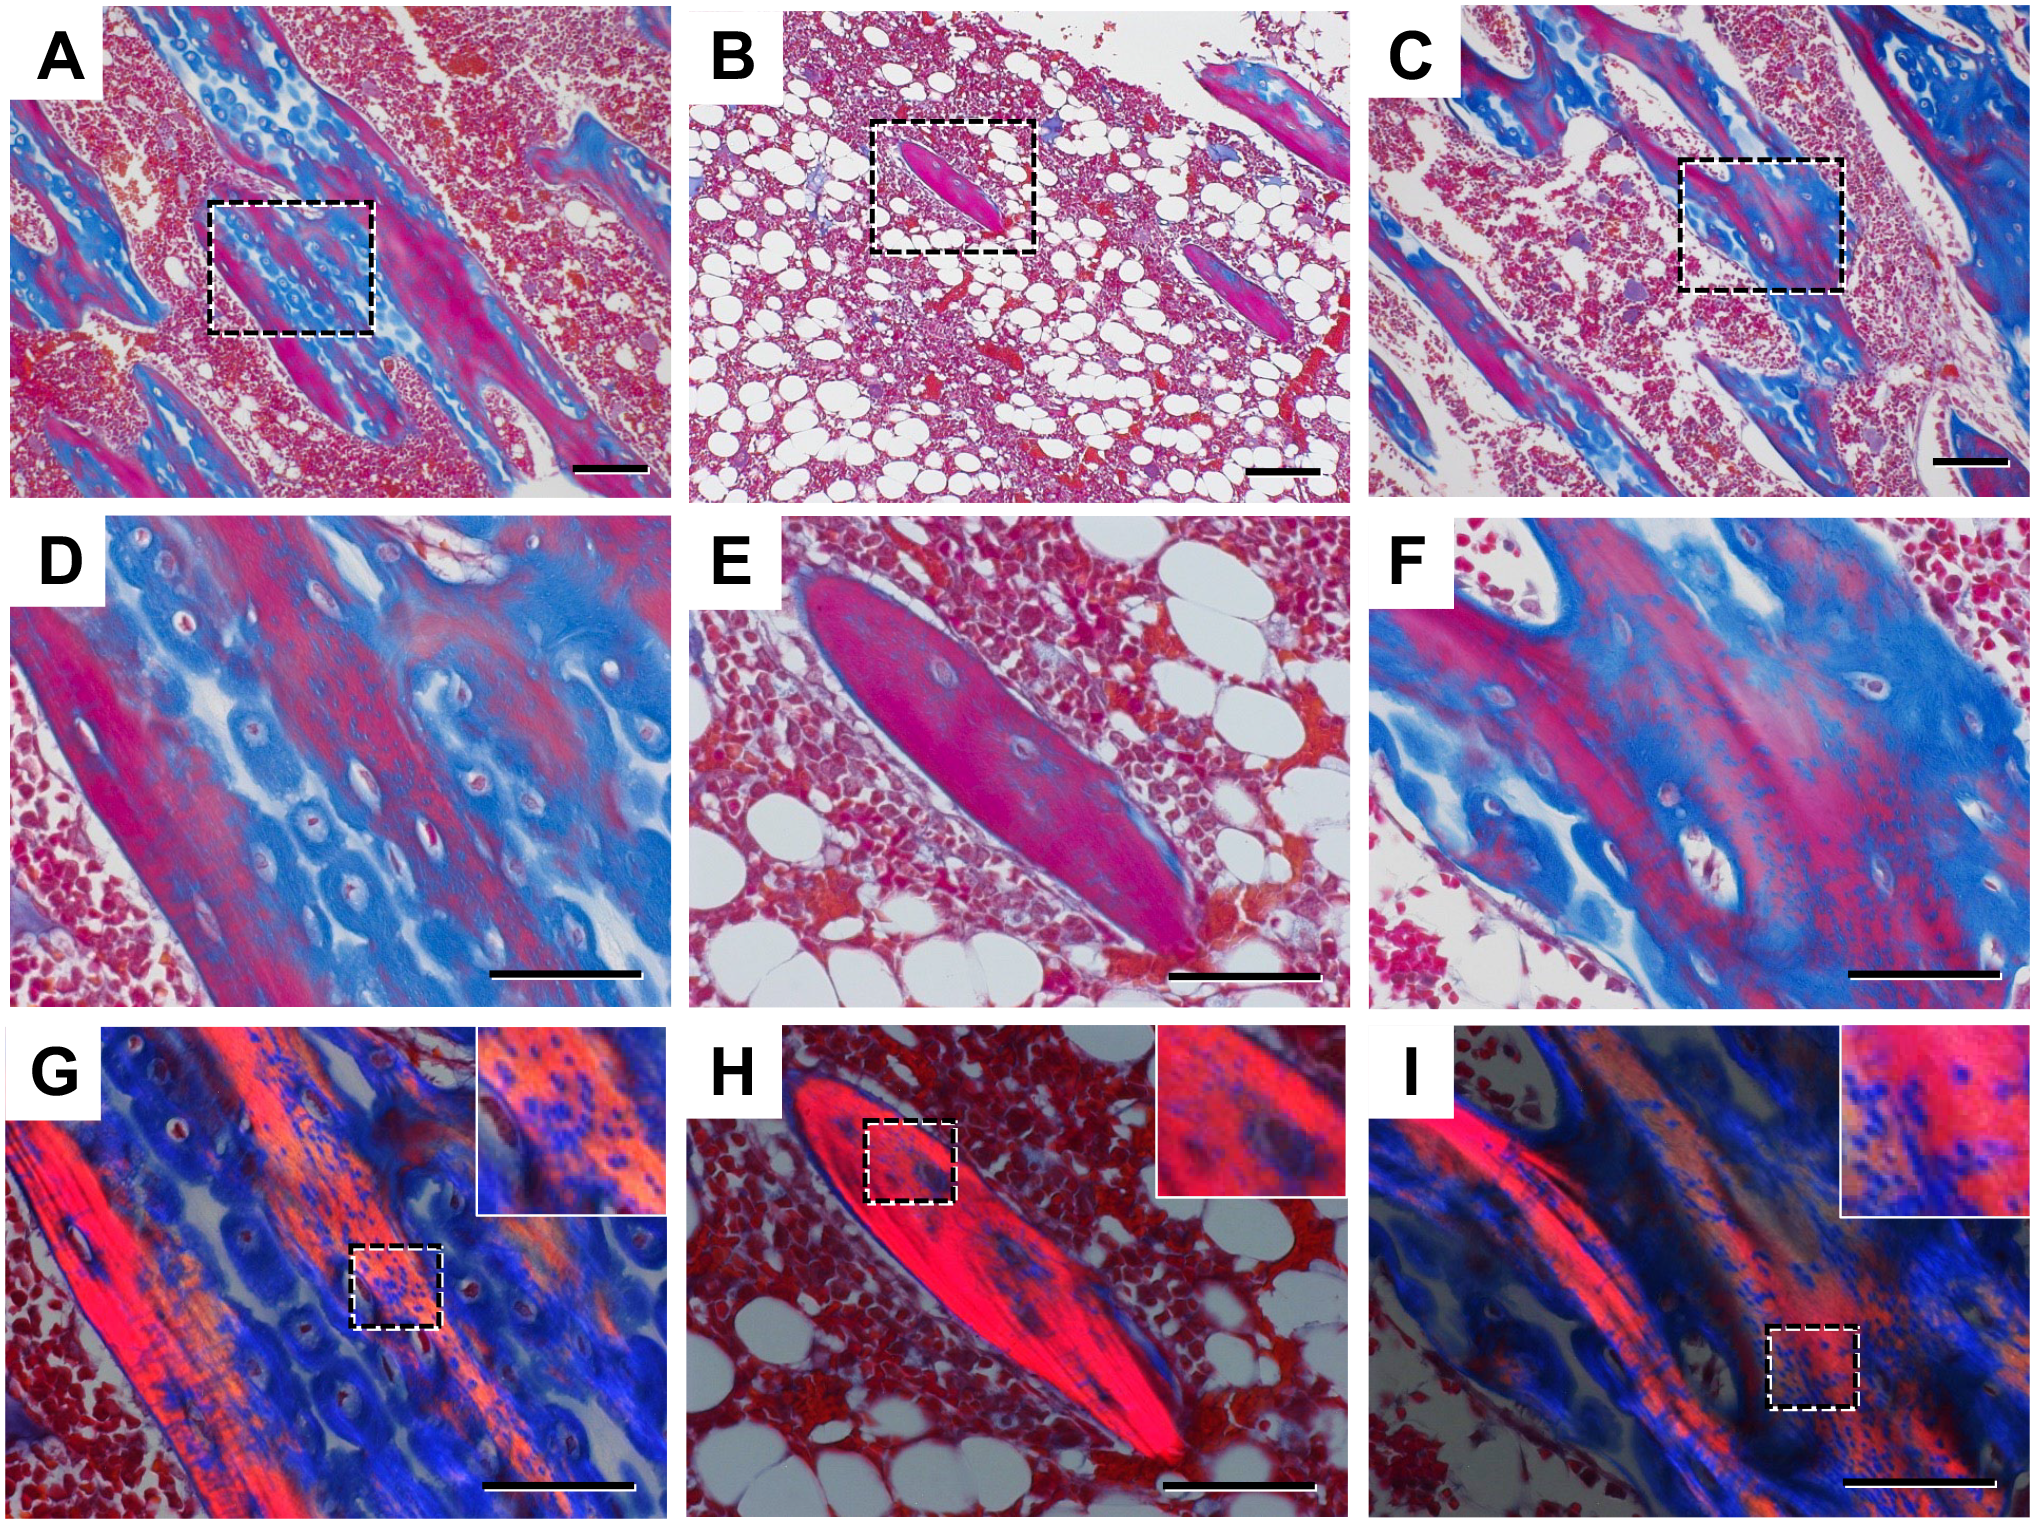
Masson trichrome stain: Low magnification. A) Sham control, B) OVX-saline, C) OVX-HA. High magnification: D) Sham control, E) OVX-saline, F) OVX-HA. Polarized light microscope: G) Sham control, H) OVX-saline, I) OVX-HA. Low magnification shows wide plate-shaped trabecular bones staining with red and blue scattered and red ones existing longitudinally in the sham control and OVX-HA groups (A), (C). In the OVX-saline group, the amount of trabecular bone decreased, and red island bones and bone marrow fat were observed (B). High magnification indicates that in the sham control and OVX-HA group, the substrate of spindle-shaped bone cells was stained with red, whereas that of round-shaped bone cells was stained with blue (D), (F). In the OVX-saline group, whole areas of island bones with layer structures were stained with red (E). Polarized light microscope reveals polarized light in the red areas, with small areas where polarized light is not observed in the tissues with polarized light in the sham control and OVX-HA groups (G) to (I). Bar=100 μm (A) to (C), Bar=50 μm (D) to (I).
Polarized light was observed in the red areas, indicating their birefringent nature, whereas no polarized light was observed in the blue areas. In the island bones, all substrates other than cells were stained red, and polarized light was observed in the majority of these areas. In the sham control and OVX-HA group at 6 weeks after the first injection, however, small dot-like areas lacking polarized light were noticed within the tissues exhibiting polarized light (Fig. 7G to I). These areas may indicate the transition from woven bone to lamellar bone.
HA Stain
At 6 weeks after the initial administration, HA staining with B-HABP revealed more intense staining in the chondrocyte membrane within the hypertrophic zone of the epiphyseal plate in both the sham control and OVX-HA groups compared with the OVX-saline group (Fig. 8A to C). The Streptomyces hyaluronidase treatment study of the sham control demonstrated a loss of HA stainability in the hypertrophic zone (Fig. 8D).
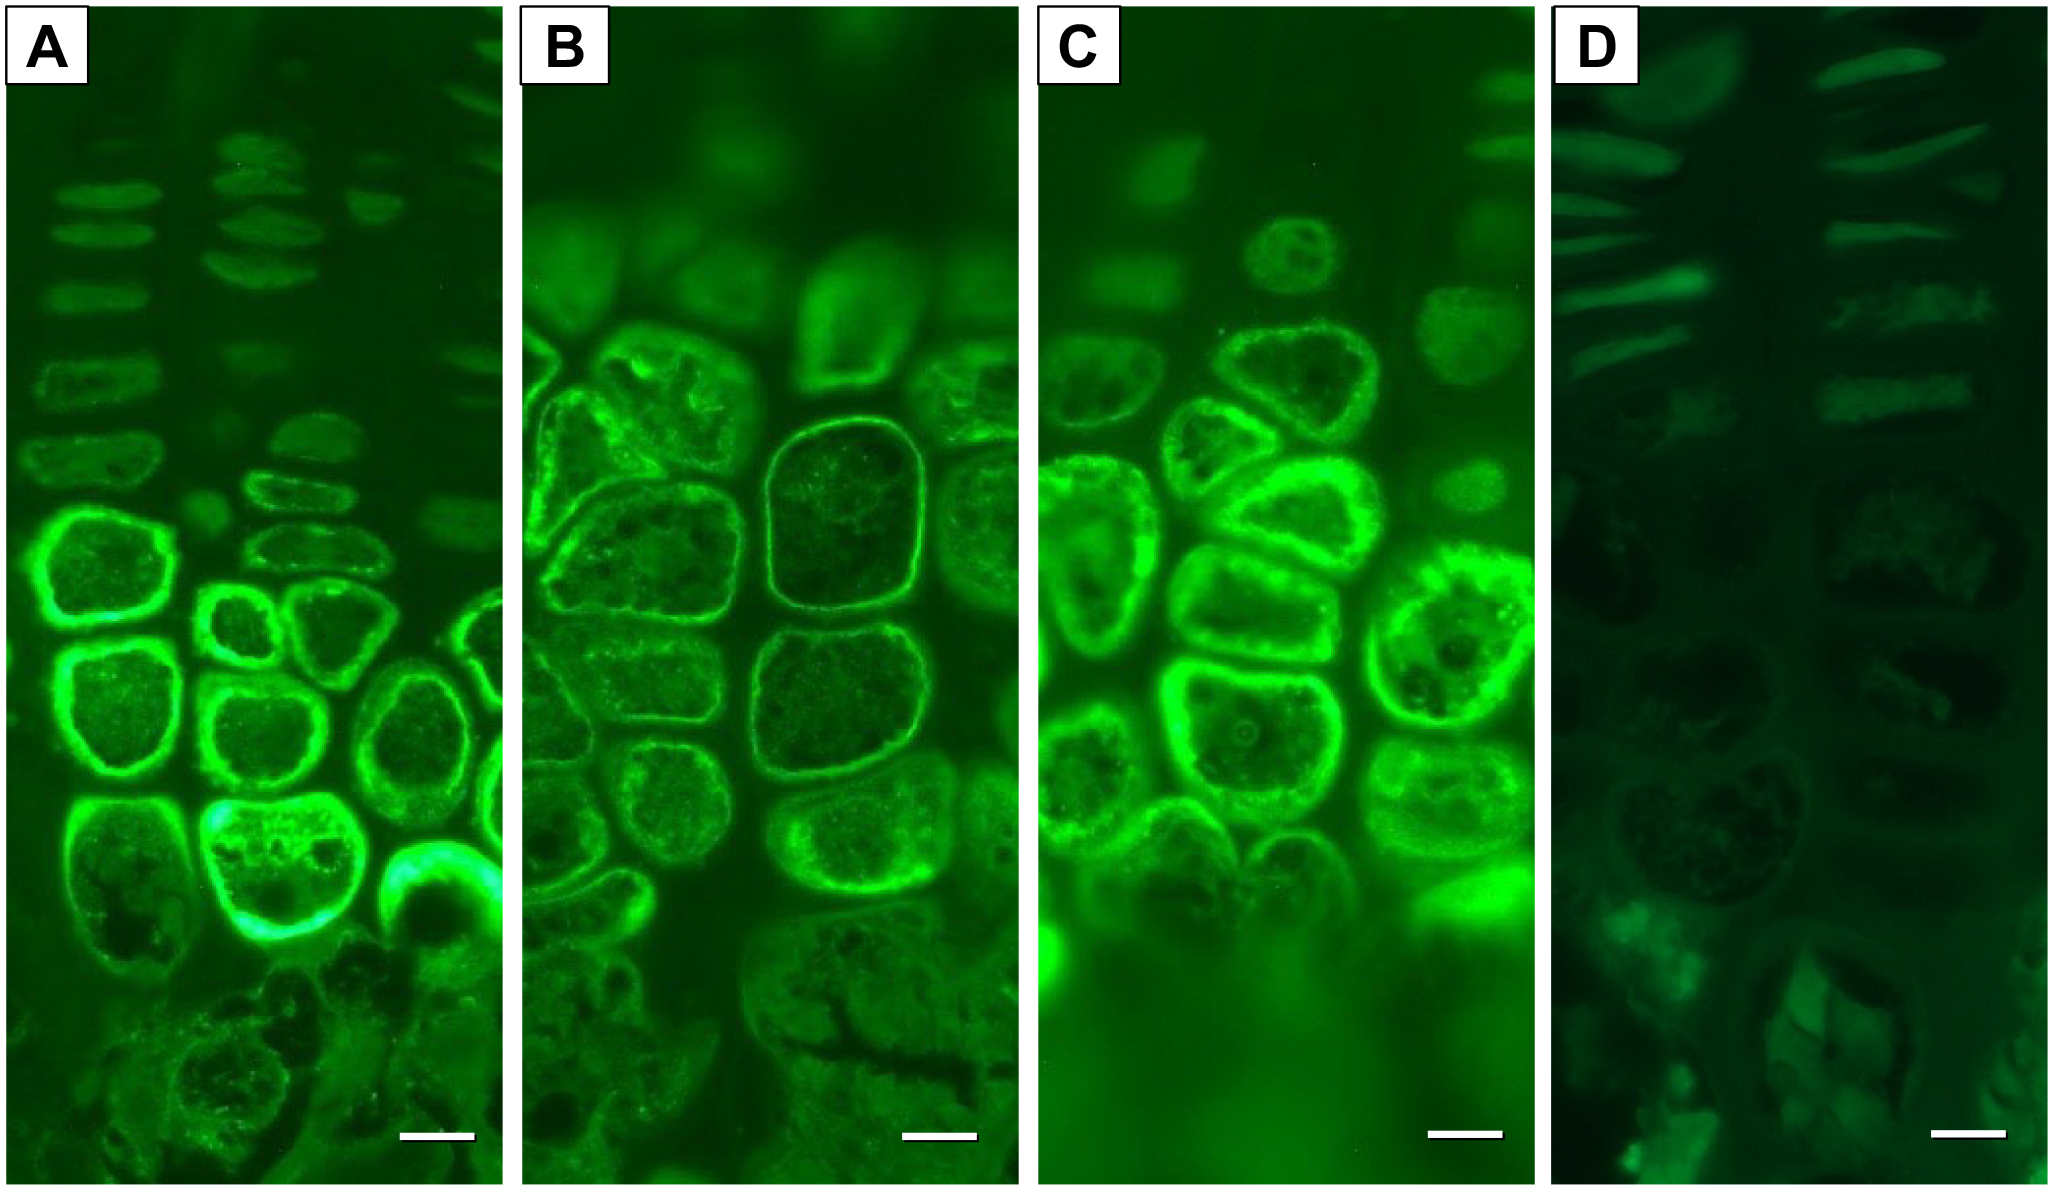
HA stain in the epiphyseal growth plate: In the sham control and the OVX-HA groups, thick and strong staining was observed inside the cell membrane of chondrocytes in the hypertrophic zone (A), (C), while the staining in the OVX-saline group was thin and weak (B). The Streptomyces hyaluronidase treatment study revealed a loss of HA stainability in the hypertrophic zone (D). Bar=10 μm (A) to (D).
Discussion
In our study, we administered high-molecular-weight HA to ovariectomized (OVX) rats, and the results demonstrate that HA administration effectively inhibited trabecular bone loss by reducing bone resorption caused by OVX while concurrently promoting bone formation, as evidenced by increased O. Th and osteoblast surfaces.
Bone remodeling, the continuous process of replacing old or damaged bone with new bone matrix through the coordinated activity of osteoclasts and osteoblasts, plays a pivotal role in maintaining bone volume and strength. 39 This coordination, known as coupling, involves the transition from bone resorption to formation within the remodeling cycle. 45 While coupling is essential for preserving skeletal integrity, it can be compromised in conditions like menopause or pathological states. If the imbalance between bone resorption and formation persists, it can lead to reduced bone density and an increased risk of fragility fractures. 46 Therefore, it is crucial not only to inhibit bone resorption but also to stimulate bone formation to counteract this condition.
HA has been widely employed in the treatment of osteoarthritis, especially through intra-articular knee injections, with favorable outcomes.34–36 Beyond its physical effects, HA has been reported to exert metabolic effects through receptors such as CD44.22,39 Notably, studies have shown that HA stimulates chondrocytes,47,48 leading to the hypothesis that HA may influence endochondral ossification, a process involved in bone formation through chondrocytes.
Our study revealed that HA effectively inhibited osteoclast activity and stimulated osteoblasts. Concerning the impact of HA on osteoclasts, Ariyoshi et al. 49 demonstrated that HA had various effects on osteoclast differentiation depending on its molecular weight. In addition, Chang et al. 50 reported that HA could inhibit the differentiation of macrophages into osteoclasts. On the other hand, with respect to osteoblasts, studies have shown that HA increased the number of osteoblasts and promoted their differentiation into bone-forming cells. 51 Moreover, some research has highlighted the significant role of HA in stimulating the differentiation of bone marrow stromal cells into osteoblasts.22,52 Finally, Sasaki and Watanabe 53 reported that HA had the potential to enhance bone wound healing. Collectively, these findings suggest that HA might have some effects on bone metabolism.
Some authors have evaluated the effect of orally administered high-molecular-weight HA on urine and serum bone turnover markers, as well as BMD, in OVX rats.19,20 These studies consistently demonstrated that high-molecular-weight HA effectively inhibited bone loss in OVX rats. The HA staining results in our study revealed a notable decrease in HA production in the growth plate of OVX rats, which might reflect a potential systemic reduction in HA levels throughout their bodies. This observation aligns with findings by Röck et al., 54 who reported estrogen’s role in promoting HA production in the skin. The estrogen deficiency induced by OVX may contribute to the observed decrease in HA production, potentially influencing bone metabolism and serving as a factor in the development of osteoporosis in these rats. However, further investigation will be required to investigate the reason for the reduction of HA in growth plate. Intriguingly, our study also demonstrated an increase in HA production in OVX rats treated with HA. This finding suggests that HA supplementation could be a promising therapeutic avenue for young individuals with osteoporosis, particularly female athletes at risk of the FAT. This triad, characterized by menstrual dysfunction, low energy availability (with or without an eating disorder), and decreased BMD, highlights the complex interplay of factors that contribute to osteoporosis in this demographic.
Recently, parathyroid hormone has been used as a treatment for osteoporosis due to its dual effect on both bone formation and absorption, preventing fractures.15,16 Midura et al.55,56 demonstrated that parathyroid hormone promoted the synthesis and deposition of HA in osteoblasts, suggesting that HA might play a crucial role in altering bone metabolism induced by parathyroid hormone administration.
Our study demonstrated that HA administration, similar to parathyroid hormone, promoted bone formation by increasing the number of osteoblasts in trabecular bone and enhancing O. Th. However, the impact of HA on bone resorption may differ from that of parathyroid hormone. We found that HA injection significantly inhibited osteoclast activity in OVX mice, while some reports have demonstrated that parathyroid hormone indirectly promotes bone resorption.57,58
Increased bone formation could be attributed to diverse cellular processes, including growth, migration, cell cycle regulation, apoptosis, and autophagy.59–61 Recent research indicates that ROS might play a role in prompting the apoptosis of osteocytes and osteoblasts, possibly culminating in osteoporosis.25–29 Ovariectomized (OVX) rats have been utilized not only as an osteoporotic model 43 but also as an oxidative stress model, exhibiting increased ROS production. 62 Furthermore, high-molecular-weight HA is anticipated to possess scavenging capacity against ROS in cancer treatment.30–32 Consequently, high-molecular-weight HA might inhibit apoptosis of osteocytes and osteoblasts via ROS, thereby improving bone metabolism. However, further studies will be necessary to elucidate the relationship between ROS and high-molecular-weight HA.
Our study also observed both lamellar and woven bones in the trabecular bone structures due to the use of young rats. In OVX rats, there was an increase in lamellar bone due to hyperactive bone metabolism, leading to a decrease in overall bone structure. The Masson Trichrome stain results indicated the presence of separate lamellar and woven bones within the trabecular bone structures, with lamellar bones appearing red and woven bones appearing blue. The presence of layered lamellar bone structures and scattered blue dots within the woven bone of OVX rats suggests a transitional process from woven bone to lamellar bone.
Last but not least, the mice that underwent surgery gained weight at a higher rate than the sham mice. Several research papers have indicated that rats undergoing OVX experience rapid weight gain following the elimination of ovarian hormones.63–65 Burch et al. 66 speculated that region-specific differences in receptors for metabolic hormones and changes in circulating levels of those hormones might influence the increase in body weight, but the exact cause remains unknown. However, we believe that the observed weight gain in our OVX rats compared with those without OVX suggests the successful performance of the OVX surgery, potentially impacting the bone metabolism of the OVX rats.
Several points need to be considered in this study. First, we focused on bone morphometry rather than bone turnover markers to assess bone metabolism. Second, we administered HA subcutaneously instead of orally, as it allowed for precise administration of a specific amount of HA and provided a prolonged duration of effects. Finally, we utilized young rats with OVX, which may not entirely reflect human osteoporosis but serves as a commonly used model for studying osteoporosis.
In conclusion, high-molecular-weight HA improved bone metabolism by enhancing bone formation and reducing bone resorption. This finding suggests that HA could be valuable not only for preventing osteoporosis but also for treating patients with osteoporosis.
Footnotes
Competing Interests
The author(s) declared no potential conflicts of interest with respect to the research, authorship, and/or publication of this article.
Author Contributions
TK and KU performed the research. YS edited and reviewed the article. TK and KU analyzed the data and wrote the article. All authors read and approved the final manuscript.
Funding
The author(s) received no financial support for the research, authorship, and/or publication of this article.