
Abstract
The glycan moiety Lewis X (LeX) has been implicated in defining progenitor cells as well as playing a role in the progression of solid tumors, including breast cancer. Here, we used the original stage-specific embryonic antigen-1 (SSEA-1) antibody, MC-480, targeting the LeX motif to examine the expression pattern of this marker within the context of a differentiation hierarchy as well as functional properties of breast cancer cells. Immunohistochemical staining revealed the presence of SSEA-1 in a progenitor zone in the normal breast gland. In breast cancer, 81 of 220 carcinomas (37%) were positive for SSEA-1 and a distinct pattern could be correlated to major subtypes. Specifically, estrogen receptor alpha (ERα)-negative tumors showed a higher frequency of SSEA-1 expression compared to ERα-positive tumors, which are generally considered more differentiated (56% vs 29%, p<0.005). Functional assays performed on two representative breast cancer cell lines demonstrated that SSEA-1-expressing cells exhibited cancer stem cell properties as well as having more invasive potential, regardless of ERα status. A potential role of SSEA-1 in metastasis was confirmed by pairwise staining of primary- and corresponding lymph node tumors. Altogether, our data suggest that expression of SSEA-1 in breast cancer contributes to the malignant phenotype:
Introduction
We have previously documented human-specific markers that define the presence of a differentiation hierarchy that is similar in normal breast and breast cancers.1–5 Lewis X (LeX), often referred to as CD15 or stage-specific embryonic antigen-1 (SSEA-1) is a glycan motif that is found in a variety of glycoproteins, proteoglycans, and lipids. 6 Several antibodies that recognize the LeX glycan motif have been used to characterize its presence and its potential role in defining differentiation hierarchies in various tissues and cancers.7–16 However, there is still no consensus on the implication of LeX expression in the breast, including the expression pattern in normal and breast cancer tissue.8,14,17,18 On that note, it is important to recognize that the LeX motif is encountered in different contexts, and the LeX motif itself can be further modified to create sialylated (sLex) or sulfated (sulfoLex) forms. 19 The original LeX antibody, SSEA-1 clone MC-480, specifically recognizes the LeX motif exposed on long neo-lacto backbones.20,21 Thus, this SSEA-1 antibody may detect LeX in a highly specific context, yielding an expression pattern that is not exposed by other LeX antibodies. This suggests that some observations reported on LeX/CD15 in general may not adhere to SSEA-1 and vice versa. Here we focus on characterizing the expression of SSEA-1 using the original antibody clone MC-480 in breast cancer and examine the functional properties of SSEA-1-positive breast cancer cells.
Materials and Methods
Tissue Material
Normal breast tissue was obtained from women undergoing reduction mammoplasty for cosmetic reasons and was donated with written consent by donors. The Regional Scientific Ethical Committees (Region Hovedstaden, H-2-2011-052) and the Danish Data Protection Agency (2011-41-6722) have reviewed and approved the use and storage of human material. The breast carcinomas included in this study were from anonymously donated archival material. Material from some of the donated tissue has been included in previous studies.
Immunohistochemistry and Immunocytochemistry
Immunostainings were performed as previously described on 6µm tissue sections and cell cultures.2,22 Here, we used SSEA-1 antibody clone MC-480 (Developmental Studies Hybridoma Bank, Iowa) at a dilution of 1:50 for immunohistochemistry and immunocytochemistry by immunoperoxidase staining. Breast carcinomas were also characterized by staining for estrogen receptor alpha (ERα, 1D5, 1:100, Dako, Denmark). For comparison of sets of primary tumors and corresponding lymph nodes, at least two sections from each sample were evaluated, sectioned with a distance of at least 50µm apart. The stainings were evaluated by light microscopy on a Leica DM5500 (Triolab, Denmark) independently by two trained researchers.
Fluorescence-Activated Cell Sorting
Fluorescence-activated cell sorting (FACS) was used to distinguish between cells expressing varying levels of SSEA-1, including the highest 20% expressing (SSEA-1HI), moderately to low expressing (SSEA-1LOW) and negative (SSEA-1NEG) populations. Breast cancer cells were prepared as described previously 5 and stained with SSEA-1 antibody MC-480 at 1:100 followed by secondary Alexa Fluor, IgM antibody at 1:500 (Invitrogen, Thermo Fisher Scientific, Denmark). Analysis and sorting were conducted on a FACSAria Fusion instrument (BD Biosciences, Denmark).
Functional Assays
MCF7i was derived from MCF7 cells and propagated as described previously. 1 SKBR3 was cultured as described previously. 3 SSEA-1NEG and SSEA-1HI populations were sorted by FACS and cultured for 6 days before lysing or used directly for RNA extraction. Western blotting, RNA extraction and real-time reverse transcription polymerase chain reaction was performed as previously described. 23 For western blotting SSEA-1 antibody MC-480 was used at a 1:1000 dilution and beta-actin antibody AC-15 at 1:5000 (Sigma-Aldrich, Denmark) was included as loading control. Expression analysis of mRNA transcripts was performed using Taqman assays (Thermo Fisher Scientific) with the following probes: FUT3 (Hs00356857_m1), FUT4 (Hs01106466_s1), FUT5 (Hs00704908_s1), FUT6 (Hs00173404_m1), FUT9 (Hs00276003_m1), B3GNT5 (Hs00908059_m1), B4GALT4 (Hs00186850_m1), GCNT1 (Hs00155243_m1), and normalizing gene probes of GAPDH (Hs02758991_g1), PGK1 (Hs00943178_g1), and TFRC (Hs00951083_m1). Analysis of cell proliferation by EdU DNA incorporation was performed according to the manufacturer’s instructions (Click-iT, ThermoFisher Scientific). Quantifying cells in the different stages of apoptosis was performed with an Annexin V Apoptosis Detection kit according to the manufacturer’s instructions (BioVision, United Kingdom) after incubation with camptothecin (Sigma-Aldrich), 0.4µM/10µM for 48 hours in MCF7i and SKBR3, respectively. Following SSEA-1 antibody staining, proliferative and apoptotic cells were quantified by flow cytometry. For single-cell cloning assays, cells were sorted by flow cytometry into 96-well plates as described previously. 2 Here, we sorted populations into SSEA-1NEG or SSEA-1HI as described in the FACS section. Similarly, sorted cells were used in the transwell invasion assay as described previously. 1 Cells were serum-starved for 24 to 72 hours before counting and seeding on top of Matrigel-coated FluoroBlock inserts with 8µm pores (Corning, Thermo Fisher Scientific).
Results
To characterize the expression of SSEA-1 in breast tissue, first, we immunohistochemically stained cryosections from a selection of 16 normal biopsies with antibody clone MC-480. Expression was highly variable among biopsies. However, when present, the typical pattern was a scattered or focal expression in a subset of luminal epithelial cells, mostly aggregating in ductal structures rather than lobular acini, corresponding to the location of several breast progenitor markers2,22,24 (Fig. 1A). Comparingly, in breast carcinomas, immunostaining for SSEA-1 demonstrated notable intertumoral and intratumoral heterogeneity. Among a total of 220 breast carcinomas, 81 tumors (37%) were positive for SSEA-1. ERα-positive breast cancer is considered to represent a more differentiated group of tumors compared to ERα-negative tumors that include the triple-negative subtype. 25 When dividing the tumors into two major subtypes in terms of the presence of ERα, ERα-negative breast carcinomas were more frequently expressing SSEA-1 (56%, 35/63) compared to ERα-positive carcinomas (29%, 46/157) (p<0.005 tested by Pearson’s chi-square test, Fig. 1B), suggesting a correlation of SSEA-1 with a less-differentiated phenotype. In order to test the effects of SSEA-1 expression in functional assays, we analyzed two representative breast cancer cell lines. As shown in Fig. 1C and D, SSEA-1 was present in both MCF7i (ERα-positive) and SKBR3 (ERα-negative). As the LeX motif is generated by a series of enzymatic processes,26,27 we analyzed the gene expression of various putative relevant enzymes (see Materials and Methods), including the fucosyltransferases FUT4 and FUT9. We found that FUT9 was significantly upregulated in SSEA-1HI MCF7i cells, whereas FUT4 was high in SSEA-1HI SKBR3 cells (Fig. 1D) compared to corresponding SSEA-1NEG cells, suggesting that distinct enzymes may be responsible for regulating SSEA-1 expression in different subtypes of breast cancer.
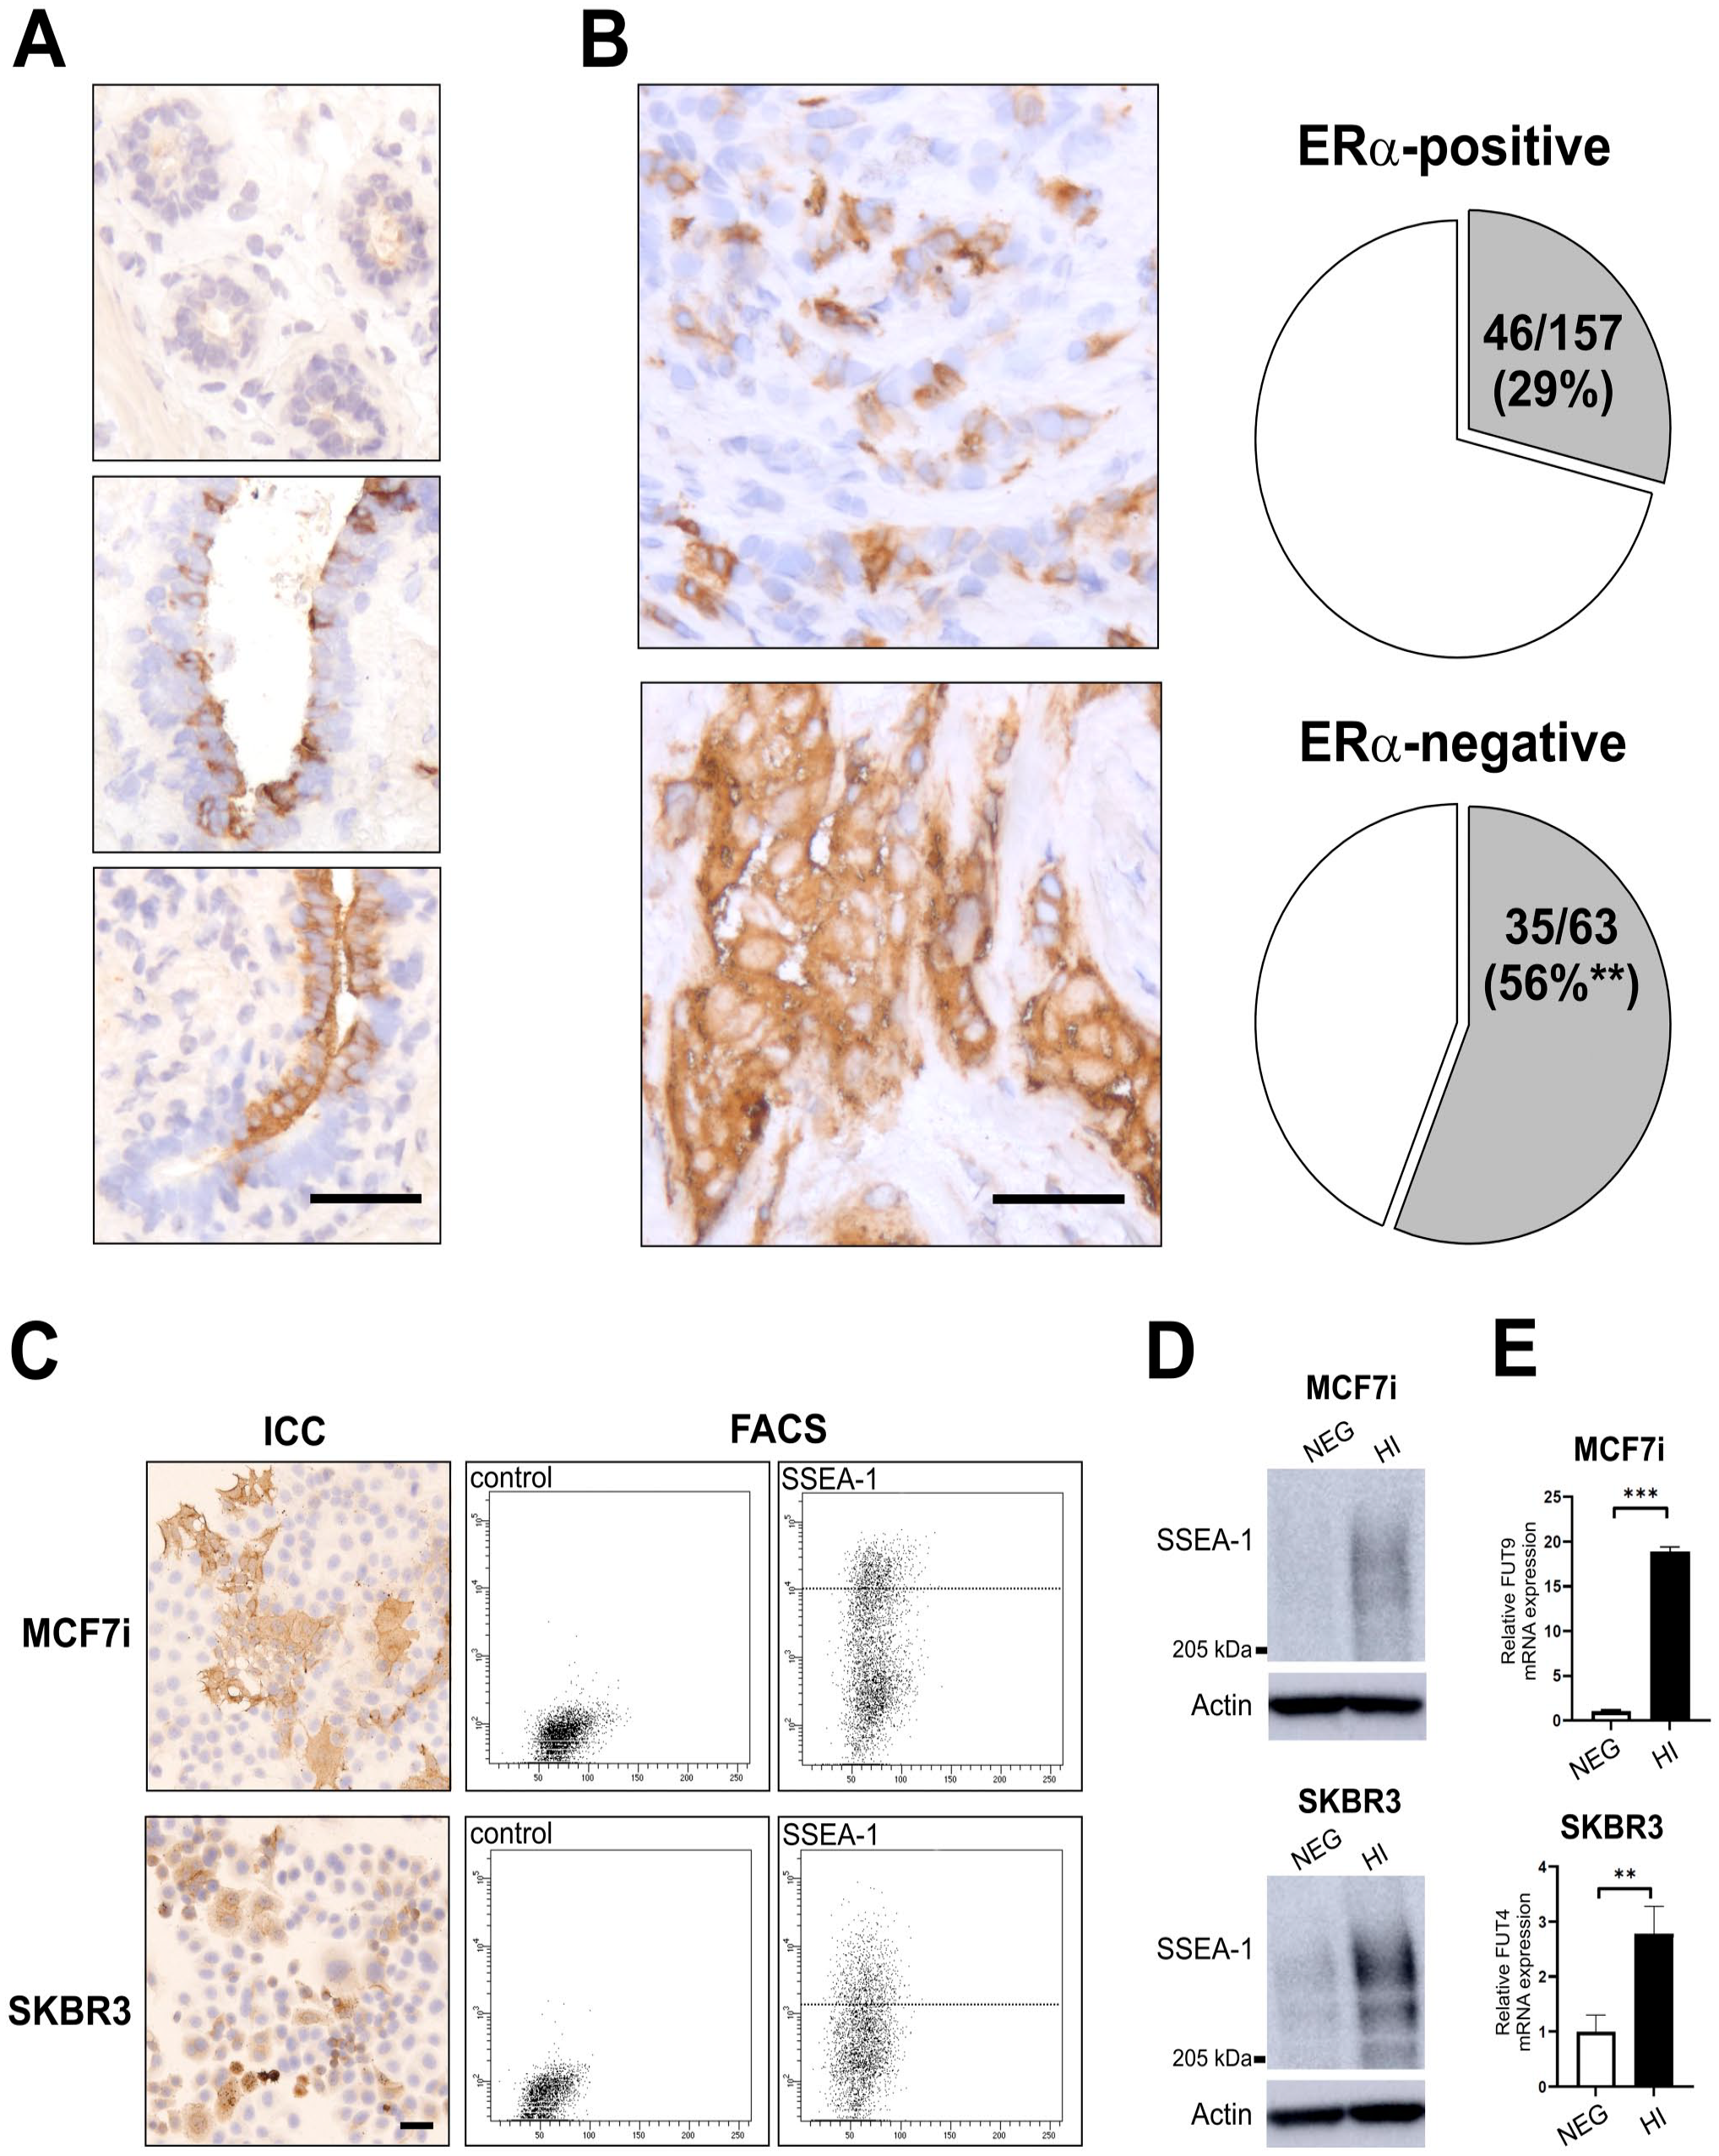
SSEA-1 is heterogeneously expressed in breast cancer. A: Representative immunohistochemical staining of normal breast tissue demonstrating the heterogeneous nature of SSEA-1-expression in lobules (upper) and ducts (middle and lower). A scattered or focal reaction was present in 12 of the 16 biopsies analyzed. Bar, 50µm. B: Representative immunohistochemical staining of breast tumors demonstrating different patterns of expressing SSEA-1. Pie graphs show the distribution of positive tumors in ER-positive and ER-negative groups from a total of 220 breast carcinomas (cutoff: >1% positivity, ** p<0.005 tested by Pearson’s chi-square test), indicating that SSEA-1 expression is significantly higher in ER- negative tumors. Bar, 50µm. C: Immunocytochemistry (ICC) and flow cytometry analysis (FACS) demonstrating heterogeneous expression of SSEA-1 in two breast cancer cell lines, MCF7i and SKBR3. The control diagrams show the analysis of staining with corresponding fluorophore-conjugated secondary antibodies. Vertical dotted lines in FACS diagrams indicate the threshold for the 20% most highly expressing cells. Bar, 50µm. D: Western blot analysis of cells sorted from SSEA-1-negative (NEG) and SSEA-1-high (HI) for MCF7i and SKBR3, for protein >200 kDa. Beta-actin is used as loading control. E: Representative realtime RT-PCR analysis of the relative expression of FUT9 and FUT4 mRNA on RNA isolated from SSEA-1 sorted cells of MCF7i and SKBR3, respectively. Error bars represent standard bars (SD) of triplicates. ** p<0.005 and *** p< 0.0001 tested by T-test.
To functionally characterize SSEA-1-expressing (SSEA-1HI) breast cancer cells, first, we analyzed the proliferative capacity of SSEA-1HI cells compared to the remaining population in MCF7i and SKBR3, using an EdU assay. We found that SSEA-1 expression did not diversify populations with regard to the proliferative index (Fig. 2A). However, when measuring the sensitivity of SSEA-1HI cancer cells to the apoptotic stimulus of camptothecin, we did find that SSEA-1HI cells were significantly more antiapoptotic (Fig. 2B). Next, we tested for cancer stem cell activities of SSEA-1HI cancer cells, using single-cell colony-forming and tumorsphere assays. In both breast cancer cell lines, SSEA-1HI cells formed more single-cell-driven colonies and tumorspheres compared to cells not expressing SSEA-1 (SSEA-1NEG) (Fig. 2C and D). In addition, transwell invasion assays showed that SSEA-1HI cells were more invasive compared to SSEA-1NEG cells in both cell lines (Fig. 2E). Based on these findings, we hypothesized that SSEA-1-expressing cells are actively involved in the process of tumor dissemination and metastasis formation. In order to corroborate this, we compared the expression of SSEA-1 in a series of 11 paired human primary tumors and lymph node metastases in situ. These results showed that when positive SSEA-1-expressing cells were generally more prevalent in the lymph nodes than corresponding primary tumors, suggesting that SSEA-1 is indeed involved in human breast cancer progression (Fig. 2F).
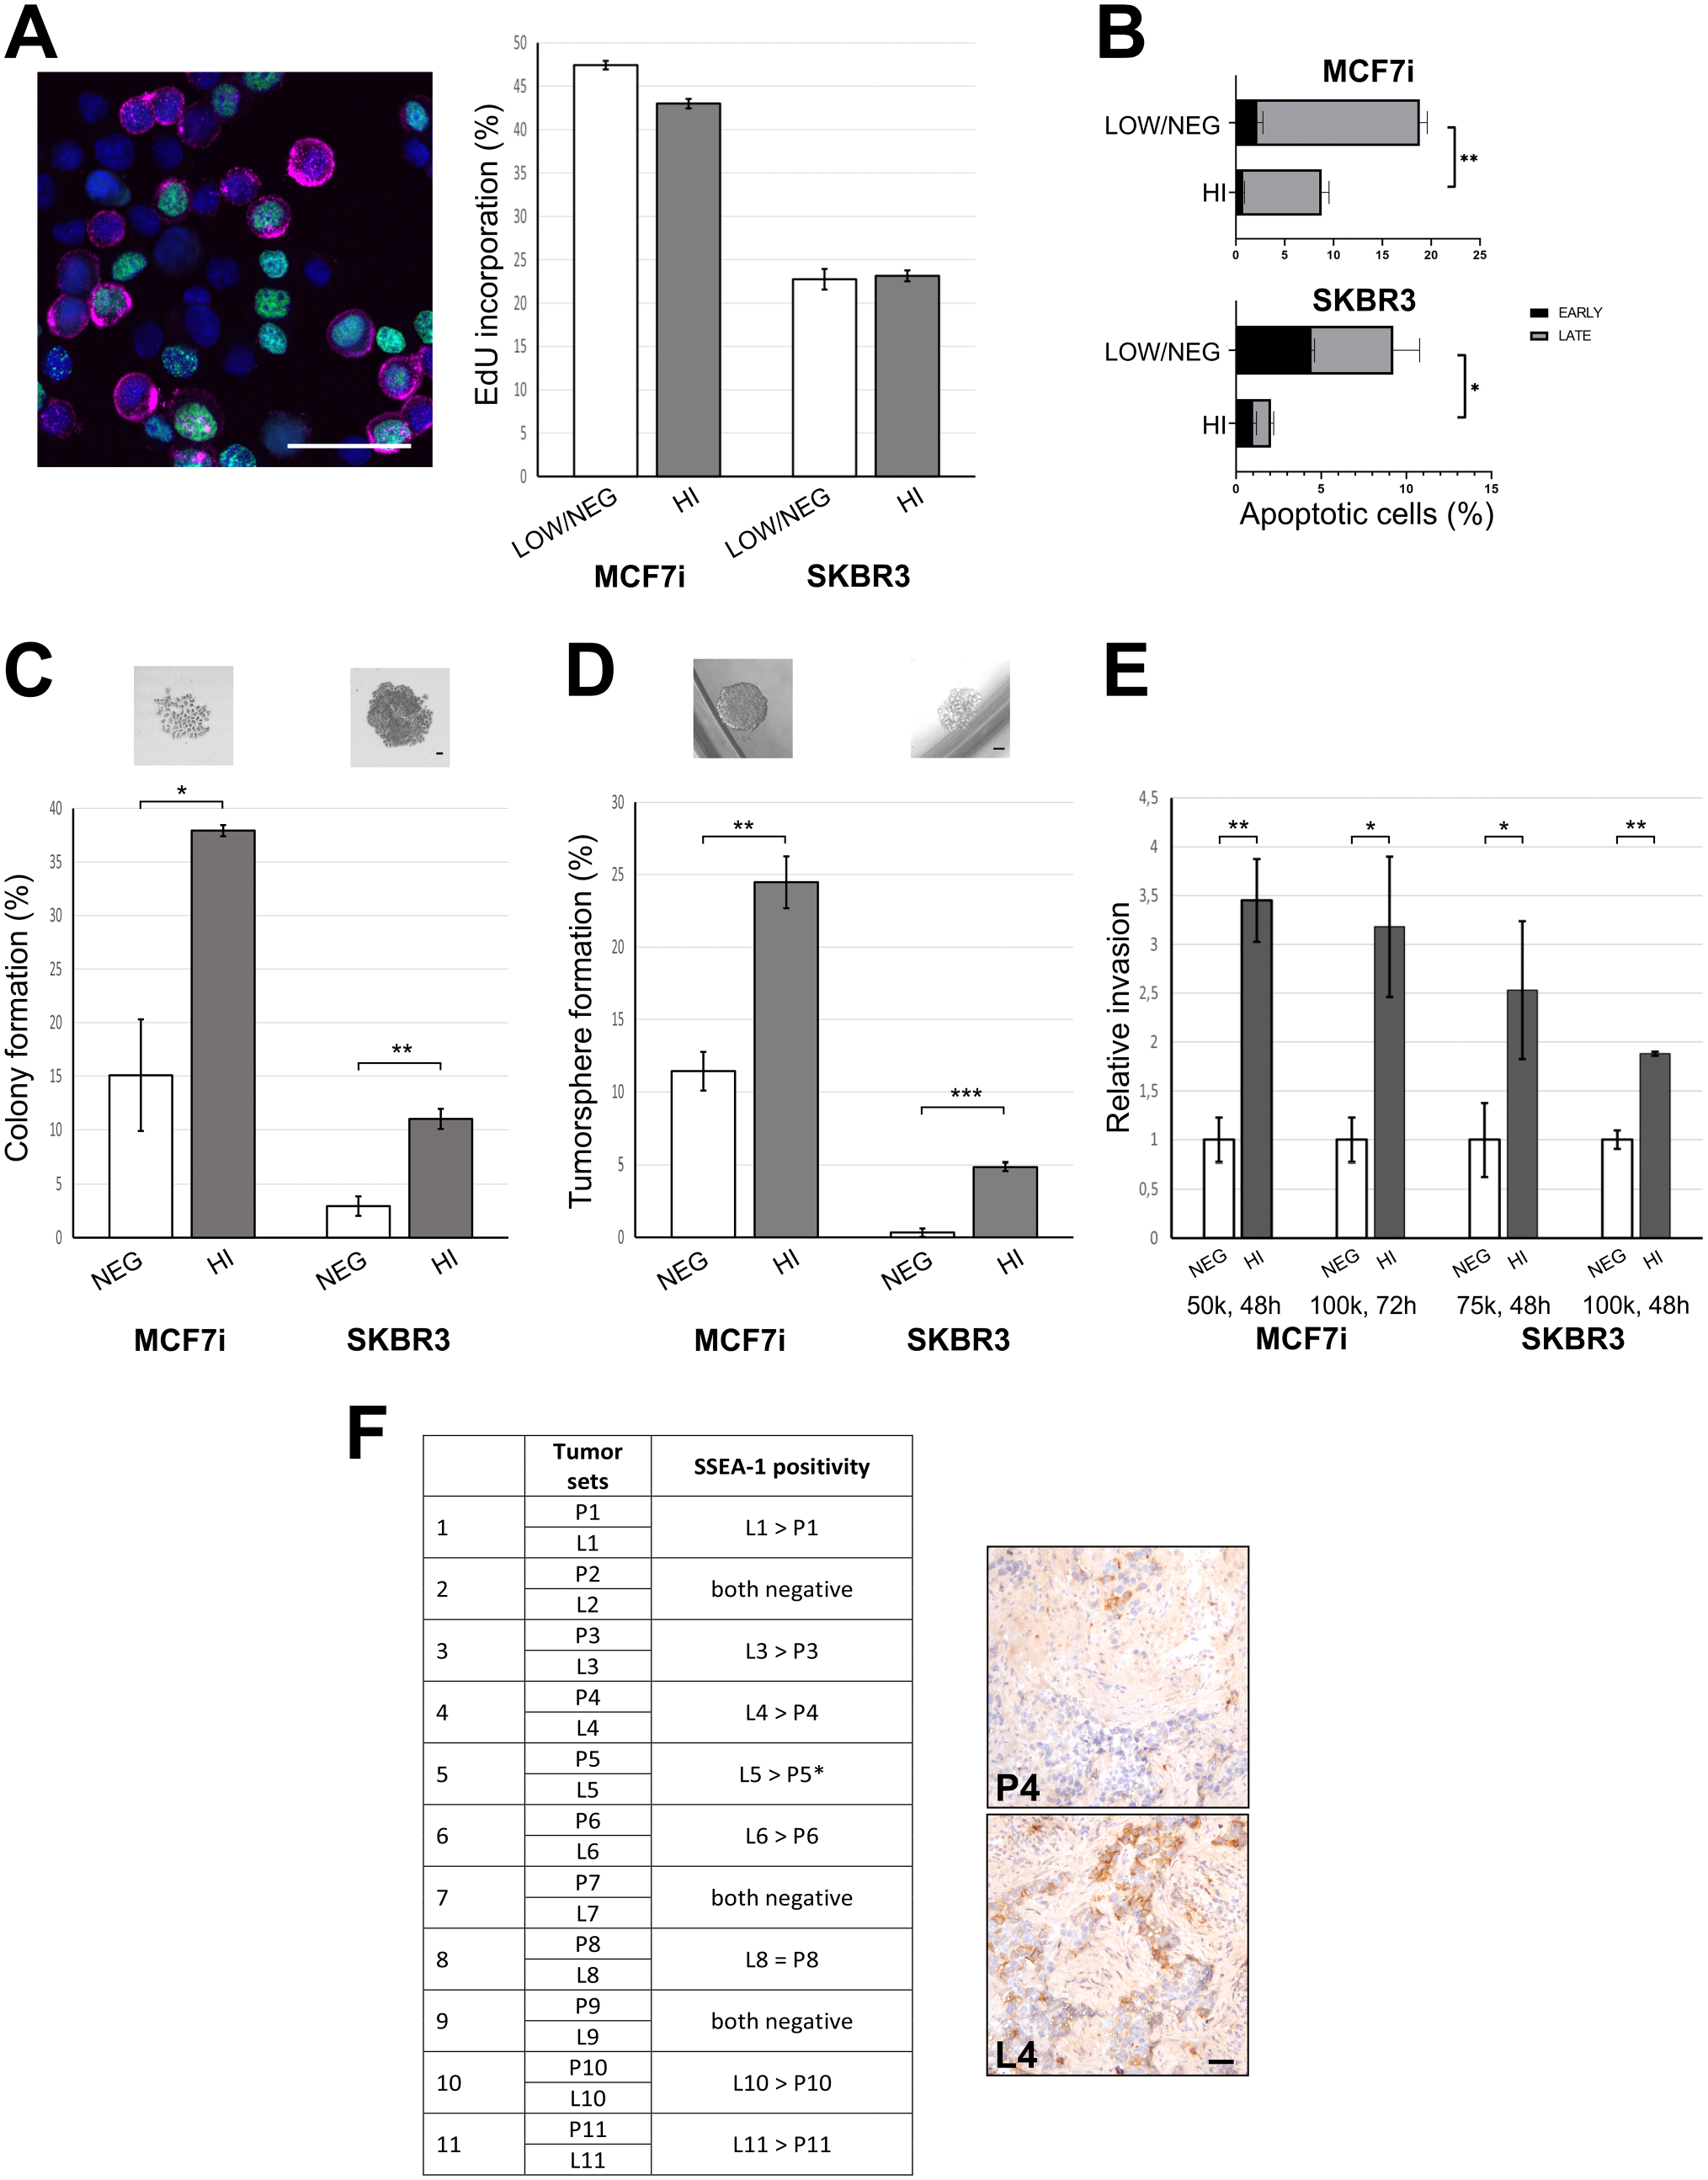
SSEA-1-expressing breast cancer cells have malignant properties. A: Analysis of the proliferative fraction in cultures of MCF7i and SKBR3 by an EdU incorporation assay. The representative immunofluorescent image shows a smear of MCF7i cells with Edu-positive cells (green) and SSEA-1 positive cells (magenta). Bar, 50µm. Bar graph shows the percentage of EdU incorporated cells within SSEA-1LOW/NEG and SSEA-1HI cells after 1 hour incubation. The data are presented as the average of triplicates (n=3) and error bars represent standard deviation (SD). B: Analysis of the percentage of camptothecin-induced apoptotic cells in SSEA-1LOW/NEG and SSEA-1HI populations from MCF7i and SKBR3. Apoptotic populations were gated into early (Annexin V-positive) and late (Annexin V-positive and DAPI-positive) apoptosis. Data are presented as an average based on three independent cultures and error bars represent SEM. * p<0.05 and ** p< 0.005 tested by two-way Anova. C: Colony formation assay, based on single cell sorting of SSEA-1NEG and SSEA-1HI cells from MCF7i and SKBR3, cultured for 1 and 2 weeks, respectively. Bars represent averages of single cell derived colonies in four independent experiments. Error bars represent SEM. * p<0.05 and ** p< 0.005 tested by T-test. Images show representable colonies derived from MCF7i and SKBR3, respectively. Bar, 50µm. D: Formation assay based on single cell sortings of MCF7i and SKBR3 into ultra-low attachment plates, cultured for 2 weeks. Bar graphs indicate averages of tumorspheres of four independent experiments with error bars representing SEM. Images show representable tumorspheres derived from MCF7i and SKBR3, respectively. Bar, 50µm. * p<0.05 and *** p< 0.0001 tested by T-test. E: Transwell invasion assays were performed on sorted MCF7i and SKBR3 cells at two conditions for each (MCF7i: 50,0000 cells for 48 hours, 100,000 cells for 72 hours and SKBR3: 75,000 cells for 48 hours, 100,000 cells for 48 hours). Each experiment was set up in triplicate and error bars represent SD. * p<0.05 and ** p< 0.005 tested by T-test. F: IHC analysis of 11 patient sets of primary tumors (P) and corresponding lymph node metastases (L), with a comparison of the fraction of SSEA-1 expressing neoplastic cells. Images are shown for the P4/L4 set. *P5 was evaluated as negative. Bar, 50µm.
Overall, this study suggests that in breast cancer, SSEA-1 is a marker of a cellular subset characterized by increased malignant behavior.
Discussion
The use of antibody-based immunostaining techniques remains an important tool when characterizing the expression of glycans on proteins or lipids, as transcriptome-based analysis is not sufficient to reveal the complex patterns of glycan motifs. Furthermore, with regard to LeX, it is also important to recognize that several anti-LeX antibodies bind the glycan motif in a highly specific context-dependent manner. 19 The initial study on SSEA-1 on normal tissues reported no immunostaining of the resting breast gland. 8 In our study, we found SSEA-1 to be expressed somewhat restricted in the normal breast gland, typically located focally in ductal luminal epithelium, comparable to what was reported previously by Croce et al., using a different monoclonal antibody targeting LeX. 14 This pattern suggests an overlap with a luminal progenitor compartment.2,22,24 In breast cancer, we detected SSEA-1-positive neoplastic cells in 37% of 220 primary carcinomas. Others have noted similar overall frequencies with antibodies against the LeX epitope.13,28 Interestingly, we found a higher frequency in ERα-negative tumors (56%), suggesting an accumulation in less-differentiated and more-aggressive tumors.
While LeX is expressed in a wide range of solid tumors, unraveling the functional implications of its presence on cancer cells has not been trivial (reviewed by Croce 29 ). However, for breast cancer patients, two studies have associated LeX with poor prognosis.18,28 Our finding that the breast cancer cell lines examined in this study expressed SSEA-1 heterogeneously supports that SSEA-1 could potentially be a marker that defines a cellular differentiation hierarchy. While these cells were not more proliferative, SSEA-1-expressing cells were endowed with other properties that correlate with a cancer stem cell- and more malignant phenotype, including increased resistance to stimulation of apoptosis, increased colony- and tumorsphere initiation from single cells as well as being more migratory through extracellular matrix. In a recent study, Miao et al. found that knockout of B3GNT5 led to a reduction in tumorsphere formation in two mesenchymal-like breast cancer cell lines while overexpressing the gene increased the propensity to generate tumorspheres in MCF7. Interestingly, activity of B3GNT5 is responsible for adding the GalNAc that constitutes part of the LeX motif recognized by SSEA-1 antibodies. 27 Accordingly, the tumor burden of xenotransplanted breast cancer cells with B3GNT5 knocked out was much reduced in this study. This is in accordance with the aforementioned in vitro properties, allowing for increased tumor dissemination, and establishment of metastases. Our analysis of lymph node tumors from human patients with increased frequency of SSEA-1-positive cells supports these findings. When Shirahama et al. found a correlation between high expression of SSEA-1 in transitional cell carcinoma of the bladder and lymph node metastasis, they suggested that SSEA-1 is required for the interaction of tumor cells with endothelial cells in lymph node tissue. 11
Interestingly, Elola et al. observed that the adhesion of MCF-7 cells to human umbilical endothelial cells was mediated by the LeX motif. 30 Admittedly, SSEA-1 antibody MC-480 was not used in their study, but it does suggest that LeX plays an important role in cancer cell extravasation through the endothelial lining at lymph nodes and metastatic tumor sites.
In summary, our present data demonstrate that expression of SSEA-1 in breast cancer correlates to a malignant phenotype. Further studies on this marker could provide valuable information with regard to understanding how it defines differentiation states in normal and cancer cells as well as its involvement in tumor dissemination and metastasis.
Footnotes
Acknowledgements
The authors thank Lena Kristensen and Anita Sharma Friismose for excellent technical assistance. Capio CFR Hospitaler (Benedikte Thuesen) and the donors are acknowledged for providing breast biopsy material.
Competing Interests
The author(s) declared no potential conflicts of interest with respect to the research, authorship, and/or publication of this article.
Author Contributions
KTK, AMMH, JK, and RV performed the experiments and analyzed the data. KTK, JK, and RV wrote the manuscript. RV designed the study.
Funding
The author(s) disclosed receipt of the following financial support for the research, authorship, and/or publication of this article: This work was supported by Valborg Lyngbyes Fond, Anna og Hans Steffensens Fond, Læge Sophus Carl Emil Friis og hustru Olga Friis’ Legat (to RV), Familien Erichsens Mindefond (to JK).