
Abstract
Immunohistochemical (IHC) staining is an established technique for visualizing proteins in tissue sections for research studies and clinical applications. IHC is increasingly used as a targeting strategy for procurement of labeled cells via tissue microdissection, including immunodissection, computer-aided laser dissection (CALD), expression microdissection (xMD), and other techniques. The initial antigen retrieval (AR) process increases epitope availability and improves staining characteristics; however, the procedure can damage DNA. To better understand the effects of AR on DNA quality and quantity in immunodissected samples, both clinical specimens (KRAS gene mutation positive cases) and model system samples (lung cancer patient-derived xenograft tissue) were subjected to commonly employed AR methods (heat induced epitope retrieval [HIER], protease digestion) and the effects on DNA were assessed by Qubit, fragment analysis, quantitative PCR, digital droplet PCR (ddPCR), library preparation, and targeted sequencing. The data showed that HIER resulted in optimal IHC staining characteristics, but induced significant damage to DNA, producing extensive fragmentation and decreased overall yields. However, neither of the AR methods combined with IHC prevented ddPCR amplification of small amplicons and gene mutations were successfully identified from immunodissected clinical samples. The results indicate for the first time that DNA recovered from immunostained slides after standard AR and IHC processing can be successfully employed for genomic mutation analysis via ddPCR and next-generation sequencing (NGS) short-read methods.
Introduction
New advances in understanding basic tumor biology and genetics have the potential to improve the lives of patients diagnosed with cancer through better diagnostic methods, prognostic capabilities, and treatment options. In particular, the ability to select the best therapy based on the molecular status of a patient’s tumor, termed precision medicine represents an exciting evolution in cancer care.1–5
A range of technological advances in the molecular pathology field are improving the breadth and utility of molecular measurements, allowing clinicians and laboratory investigators to better understand the physiological underpinning of cellular behavior and the disruption of signaling networks that occurs in disease.4,6 These improvements span a spectrum of methods, including advanced staining procedures, tissue fixation and processing protocols, techniques for recovery of biomolecules from archival formalin-fixed and paraffin-embedded (FFPE) specimens, and a large number of molecular assays that are adapted to work with semi-degraded nucleic acids and proteins.7–12
In parallel, tissue microdissection technologies continue to evolve, including better instrumentation, targeting strategies, and computer-aided image analysis.13–24 Procurement of pure or enriched target cell populations from tissue sections can be advantageous for molecular analyses compared to non-dissected samples. For example, current methods, such as slide scraping, for procuring tumor cells from histological sections generally obtain a mixture of tumor and normal cells, which can compromise the molecular analysis. Subsequent DNA sequencing can miss low-allelic-fraction mutations that occur in only a subset of the sequenced cells owing to this contamination by normal cells. Utilizing tissue microdissection to recover cells from tissue sections generates a cleaner and more accurate analysis, resulting in an increased signal-to-noise ratio with improved mutation detection. 25 In particular, subclonal, phylogenetic structures in cancer are often revealed by ultra-deep sequencing since greater front-end specificity makes it easier to find the signal of rare mutant genes in a sample.
Tissue microdissection based on molecular targeting, using either immunohistochemical (IHC) or in situ hybridization (ISH) staining, can be utilized to identify and procure cells of interest.26–29 Examples of this approach include immunodissection, computer-aided laser dissection (CALD), DepArray, and expression microdissection (xMD).20,24,25,30–33 However, each of these methods requires an up-front protein or nucleic acid labeling step, which has the potential to damage cellular biomolecules since these labeling tools were initially invented for visualization purposes only and not for subsequent molecular studies. 34
Historically, there have been two separate methodologies for antigen retrieval (AR) using either protease enzymes or heat which can be accomplished via microwave, pressure cooker, or high heat in an appropriate buffer. These approaches allow access to the target epitope but can affect the quality and quantity of the recovered biomolecules. Previous studies have documented the impact of various AR methods or combinations on biomolecule recovery from FFPE and IHC-stained tissue.35–37
To extend this line of investigation further, the present study focused on the effect of heat-induced epitope retrieval (HEIR) and IHC labeling on DNA status from immunodissected cells for high-end molecular analysis. We evaluated both clinical specimens (KRAS gene mutation positive cases) and animal model samples (lung cancer patient-derived xenograft [PDX] tissue) and measured the effects on DNA using several analytic methods, including next-generation sequencing (NGS) and digital droplet PCR (ddPCR).
Materials and Methods
PDX/Mouse Cell Line Xenograft Model
All animal procedures were reviewed and approved by the UAMS Institutional Animal Care and Use Committee (IACUC). The mouse transplantation procedure involved luciferase positive NCI-H460 Red-Fluc (BW124316, PerkinElmer, Waltham, MA) cell line material transferred via tail vein injection of 1 x 10⁶ cells. The mice were 20–30 g in weight or 11- to 23-week-old non-obese diabetic (NOD). Cg-Prkdcscid Il2rgtm1Wjl/SzJ (NSG) mouse (Stock No. 005557, Jackson Laboratory, Bar Harbor, ME). All efforts were made to minimize animal suffering.
Bioluminescence optical imaging (BLI) was performed to evaluate tumor progression and metastasis using the IVIS-200 imaging system (PerkinElmer). The NSG mice bearing tumor cells received an intra-peritoneal injection with D-luciferin, and the BLI was acquired under anesthesia by inhalation of 2%–3% of isoflurane, on a weekly basis. The acquired images were analyzed using the software system, Living Image v.4.3 (PerkinElmer). Generally, mice were sacrificed around week 5, where at this time gross metastasis was present, and documented via optical imaging.
Tissue Embedding and Histologic Staining of Mouse Tumor Tissue
The necropsy procedure followed a method previously reported. 38 At harvesting, the three organs containing metastasis (lung, liver, kidneys) were rapidly removed and subjected to formalin fixation with 10% buffered formalin solution for ~4 to 24 hr depending on the specimen size. Paraffin embedding following a standard College of American Pathologists protocol was performed to create the FFPE block for the bio-specimens of interest. Tissue sections with a slice thickness of 5–10 µm were then cut from the FFPE block onto charged histological slides using a microtome and prepared for further analyses. Hematoxylin and eosin (H&E) tissue staining was performed for further histopathological analysis. All of these procedures were based on best practices put forth by the College of American Pathologists. 39 Whole slide imaging was also performed with an Aperio digital pathology slide scanner.
Clinical Samples
Deidentified, anonymized FFPE samples were obtained from the Department of Pathology at Sinai Hospital of Baltimore following institutional review board (IRB) exempt review. Tissue sections were cut at 5-micron thickness onto charged glass slides.
Antigen Retrieval and Immunohistochemical Staining
Heat Induced Epitope Retrieval (HIER)
Microwave AR Method
Citra Plus (BioGenex, Fremont, CA) was used for HIER according to manufacturer’s instruction. Briefly, tissue slides were placed in a rack in 250 mL of 1X Citra Plus and the tissue and Citra Plus bath heated in a microwave (1100 watt) for 5 min on highest power. The power level was then reduced to 30% and the slides heated for an additional 15 min. Finally, the bath and slides were removed from the microwave and allowed to cool for 20 min on the benchtop.
Decloaker Method
A Decloaking Chamber (Decloaker, Biocare Medical, Pacheco, CA) was used as another method for HIER. Briefly, the tissue was placed in AR buffer (10x Biocare Antigen Decloaker, either pH 6.0 or pH 9.0). The BioCare Medical Decloaking Chamber was set to Set point (SP)1 at 95C for 20 to 30 min, SP2 at 90C for 10 sec, and with a SP limit of 10C for a maximum of 10 min. An additional boiling step (20 min) was also tested with the Decloaker Method (Decloaker-Boil). After completion, the slides were moved to the bench to cool for 20–30 min. Slides were then placed in diH2O for 5 min and then transferred to bath of 0.1% TBS-Tween.
Protease Induced Epitope Retrieval (PIER)
Protease AR Method
Pepsin, ficin, and trypsin (Life Technologies, Inc., Waltham, MA) were incubated individually on each slide at 37C for 15–30 min per the manufacturer’s recommendation. The optimal time of incubation was determined based on the labeling intensity and lack of background staining.
Immunohistochemistry
Slides were stored in desiccator chambers until immediately before staining. Slides were dewaxed and rehydrated through xylenes (2 x 15 min) and graded alcohols (75%, 90%, 100%; 2 min each). Antibody dilutions were optimized for IHC staining for cytokeratin AE1/AE3, starting with 1:20, 1:50, and 1:500 dilutions. Primary and secondary antibody incubation times were optimized using 30 min as a starting point for incubation. The full IHC protocol without primary antibody was used as a negative control for all IHC staining. Tissues were incubated with 3,3’-diaminobenzidine (DAB) substrate and buffer for 5 min. Following DAB incubation, slides were washed in diH2O and dehydrated through graded alcohols and xylenes (2 min each). The quality of the IHC staining was examined visually and scored by a pathologist (ME-B). The scoring system was: score = 0, no staining or non-specific staining observed, score = 1, weak specific staining, score = 2, moderate specific staining, score = 3, strong specific staining. The highest quality immunostained sections were further evaluated by imaging with an AxioLab.A1 microscope (Zeiss, Oberkochen, Germany) outfitted with an Axiocam 105 color 5.0 megapixels digital camera (Zeiss). Images were captured and evaluated to document the robustness of the staining process.
Immunodissection
Immunostained cells were procured using the ThermoFisher Scientific ArcturusXT instrument as described previously. 31 A range of 3000–9000 laser capture microdissection (LCM) shots were captured from each sample for downstream molecular analysis. Slides immunostained for dissection were not counterstained to increase contrast.
DNA Analysis
DNA Purification
The tissue was either macrodissected (razor blade scrape) or microdissected and placed in a microcentrifuge tube for overnight incubation at 56C with shaking at 400 rpm with proteinase K (Qiagen, Germantown, MD). The DNA was purified from the immunostained FFPE tissue using the GeneRead DNA FFPE Kit (Qiagen) or the Quick-DNA/RNA FFPE Miniprep Kit (Zymo Research, Irvine, CA) according to manufacturers’ instructions.
Qubit Analysis
The nucleic acid quantification assay utilized the 1X dsDNA HS Assay Kit (ThermoFisher Scientific, Waltham, MA). Quantification was performed using standard recommendations from Invitrogen/ThermoFisher with the required 500 µl thin-walled tubes (ThermoFisher Scientific). In all, 5 µl or a 10-fold dilution of the eluted DNA from each sample was used to assess quantity of the DNA with the Qubit 3.0 or 4.0 fluorometer according to manufacturer’s instruction. Our statement of purpose (SOP) includes the additional step of running a control sample after establishing standards. To validate accuracy and proper setup of the quantification assay, standard #2 is run as a sample and must be within 10% of 10 ng/µl or the procedure is repeated by reestablishing standards #1 and #2.
Fragment Analyzer
Agilent (formerly Advanced Analytical) Fragment Analyzer (FA) was used for the separation and quantification of double stranded DNA (dsDNA) using capillary electrophoresis through a narrow bore (50 µm inside diameter). The fused silica capillary array was filled with a conductive gel matrix designed to sieve the DNA molecules of a specific size range. The gel used was HS Genomic DNA kit, part number DNF-488-0500. Electrophoresis was performed using standard recommendations from Agilent. Data analysis was performed using the PROSize 3.0 software suite, available on the Agilent website (Agilent, Satna Clara, CA). 40
Quantitative PCR
The Human Genomic DNA Quant & QC Kit, Universal qPCR mix (KAPA/Roche) was used according to manufacturers’ instructions (Roche, Basel, Switzerland). The qPCR assay was completed on a StepOne Plus instrument (Life Technologies, Inc.). A total of 4 µl of each sample was used in the 20 µl qPCR reaction. The qPCR cycling parameters included an initial denaturation for 3 min at 95C followed by 40 cycles of denaturation for 10 sec at 95C, annealing/extension/data acquisition for 30 sec at 62C, followed by melt analysis. The Q129/Q41 and Q305/Q41 ratios were calculated for each sample.
Digital Droplet PCR (ddPCR)
Eight samples were analyzed in each run using the Bio-Rad KRAS G12/13 screening kit (Bio-Rad, Hercules, CA). For each individual reaction, a master mix of ddPCR SuperMix (Bio-Rad) at a final 1X concentration, ddPCR assay at manufacturer recommended concentration, and 1 ng of DNA was prepared for a total volume of 22 µl. Samples were loaded onto DG8 cartridges that were preloaded with Droplet Generator Oil according to manufacturer’s instructions (Bio-Rad). The QX200 Droplet Generator was used for the emulsion processing (Bio-Rad). Using an 8-channel pipette, 40 µl of emulsion per reaction was transferred to a ddPCR 96-well plate. The plate was sealed with a PX1 PCR Plate Sealer and analyzed on a QX200 Droplet Digital PCR System (Bio-Rad). Data analysis was completed with QuantaSoft Analysis Pro Software (Bio-Rad).
NGS (Lung Cancer DNA Library Enrichment Protocol)
DNA libraries were prepared using components from QIAseq Targeted DNA Panel Kit, Human Lung Cancer Panel, which contains amplicon enrichment for 72 genes (Qiagen). Importantly, this approach uses Universal Molecular Identifiers (UMI) to reduce the false positive rate due to PCR errors. The DNA library prep directly followed the Qiagen single primer enrichment protocol. First, 80 ng of DNA was enzymatically fragmented and end repaired in a 25 µl reaction containing a 2.5 µl 10X fragmentation buffer and a 5 µl fragmentation enzyme mix. These reactions were carried out at 4C for 1 min at 32C for 24 min and at 65C for 30 min. Immediately after the reaction, 10 µl 5X ligation buffer, 5 µl DNA ligase, 2.8 µl 25µM barcoded adapters, and water were added to 50µl, and the reaction was continued at 20C for 15 min. To ensure complete removal of free barcoded adapters, each reaction was purified for two rounds using 1.8X and 0.9X Ampure beads (Beckman, Brea, CA). Now purified, DNA was then mixed in 2.0 µl, 10 nM each target primer, 400 nM IL-Forward primer, 1X TEPCR buffer, and 0.8 µl HotStarTaq DNA polymerase. PCR enrichment conditions were 95C for 13 min, 98C for 2 min; six cycles of 98C for 15 sec, and 65C for 15 min; and 72C for 5 min. Next, 0.9X Ampure beads (Beckman) were used to remove unused primers. Then enriched DNA was combined with 400 nM IL-Universal primer, 400 nM IL-Index primer, 1X UPCR buffer, and 1 µl HotStarTaq DNA polymerase in a volume of 20 µl. The universal PCR condition was 95C for 13 min and 98C for 2 min; 20 cycles of 98C for 15 sec and 60C for 2 min; 72C for 5 min. Again, 0.9X Ampure beads were used to purify the DNA library. The library was then quantified using QIAseq Library Quant System (Qiagen). All libraries were sequenced on Illumina HiSeq 3000, using a standard pair-end, 2 x 150 bp (300 cycles total) Illumina protocol (Illumina, San Diego, CA). 41
NGS (Bioinformatic Analyses)
DNA sequenced samples were first demultiplexed and FastQ files were created from binary base call (BCL) files using bcl2fastq2 v2.18.0.12. 42 To account for the replacement of both human stroma and immune components over time by murine analogs, and effect on molecular profiling results, the application of specific algorithms via Xenome 43 was employed to avoid or reduce artifacts and biases. 44 Next, FastQC v0.11.4 45 was then used to assess the quality of the FastQ files. Then, FastQ files were uploaded to the Qiagen server for processing via the smCounter2 pipeline. 46 In brief, steps performed in this workflow include trimming of adaptors, identification of UMIs, mapping to the reference genome (GRCh37, aka hg19), read filtering and removal of low quality reads, clustering of UMIs, formation of consensus reads, variant calling, then post filtering and annotation. Binary Alignment and Map (BAM) files subsequently underwent a quality control and quality assurance analysis using the QualiMap2 method. 47 Variant Call Format (VCF) files were then uploaded along with further annotation into a custom molecular profiling database based on the Microsoft SQL Server 2012 database engine, allowing for further filtering and searching of molecular profiling data.
Results
Immunostaining for Genomic DNA Analysis
To evaluate the effect of AR on molecular analysis of clinical samples, recut histological sections from four cases were treated with either HIER, protease AR, or no AR and then immunostained with an antibody against cytokeratin. Overall, the data showed that HIER resulted in optimal staining characteristics compared to protease treated slides or no-AR sections. The non-AR treated clinical sections were only weakly positive (see Supplemental Table S1). In contrast, the protease treated and HIER sections showed improved staining with the highest intensity observed in the HIER slides. In all conditions the IHC staining was clean and specific, with little to no background. The intent of this manuscript was not to complete a robust assessment of AR methods on IHC quality as this has been reported many times in the literature,48–52 but to specifically assess AR methods and IHC effect on DNA status from immunostained and microdissected samples for downstream molecular analysis.
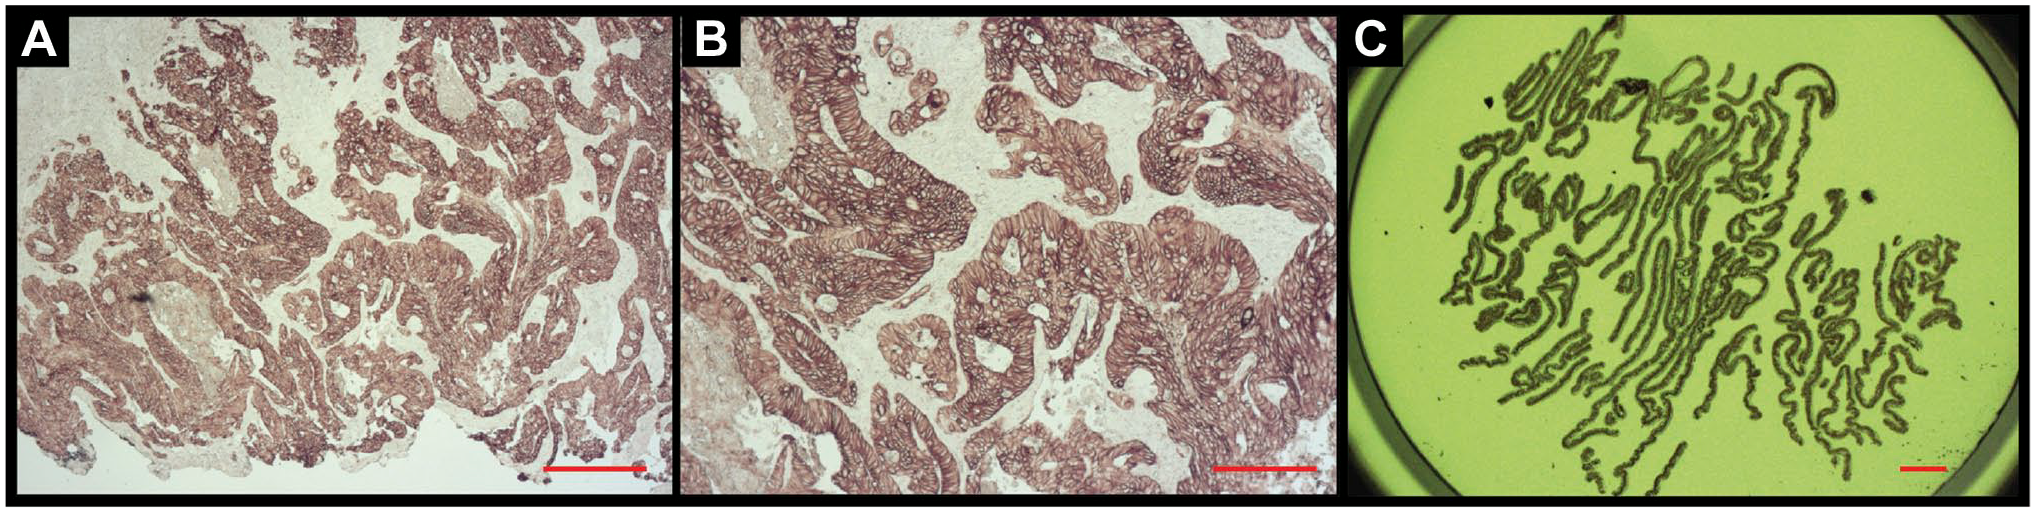
To investigate staining parameters comprehensively using less precious non-clinical specimens, mouse model tissue samples were then employed for in-depth analysis of HIER conditions, including temperature, pressure, and pH. AR parameters were evaluated using serial recuts from three organ types; lung, liver and kidney, and were (1) Decloaker (pressure cooker) and citrate buffer, pH = 6; (2) decloaker and Tris/EDTA buffer, pH = 9; and (3) boiling and AR buffer, pH = 9. The results showed a trend in staining intensity of decloaker/pH 6 < decloaker/pH 9 < boiling/pH 9 as the brown DAB color increasingly replaced the purple hematoxylin, from images A to C (Fig. 1). The most intense DAB staining was observed with boiling and pH 9 (Fig. 1C).
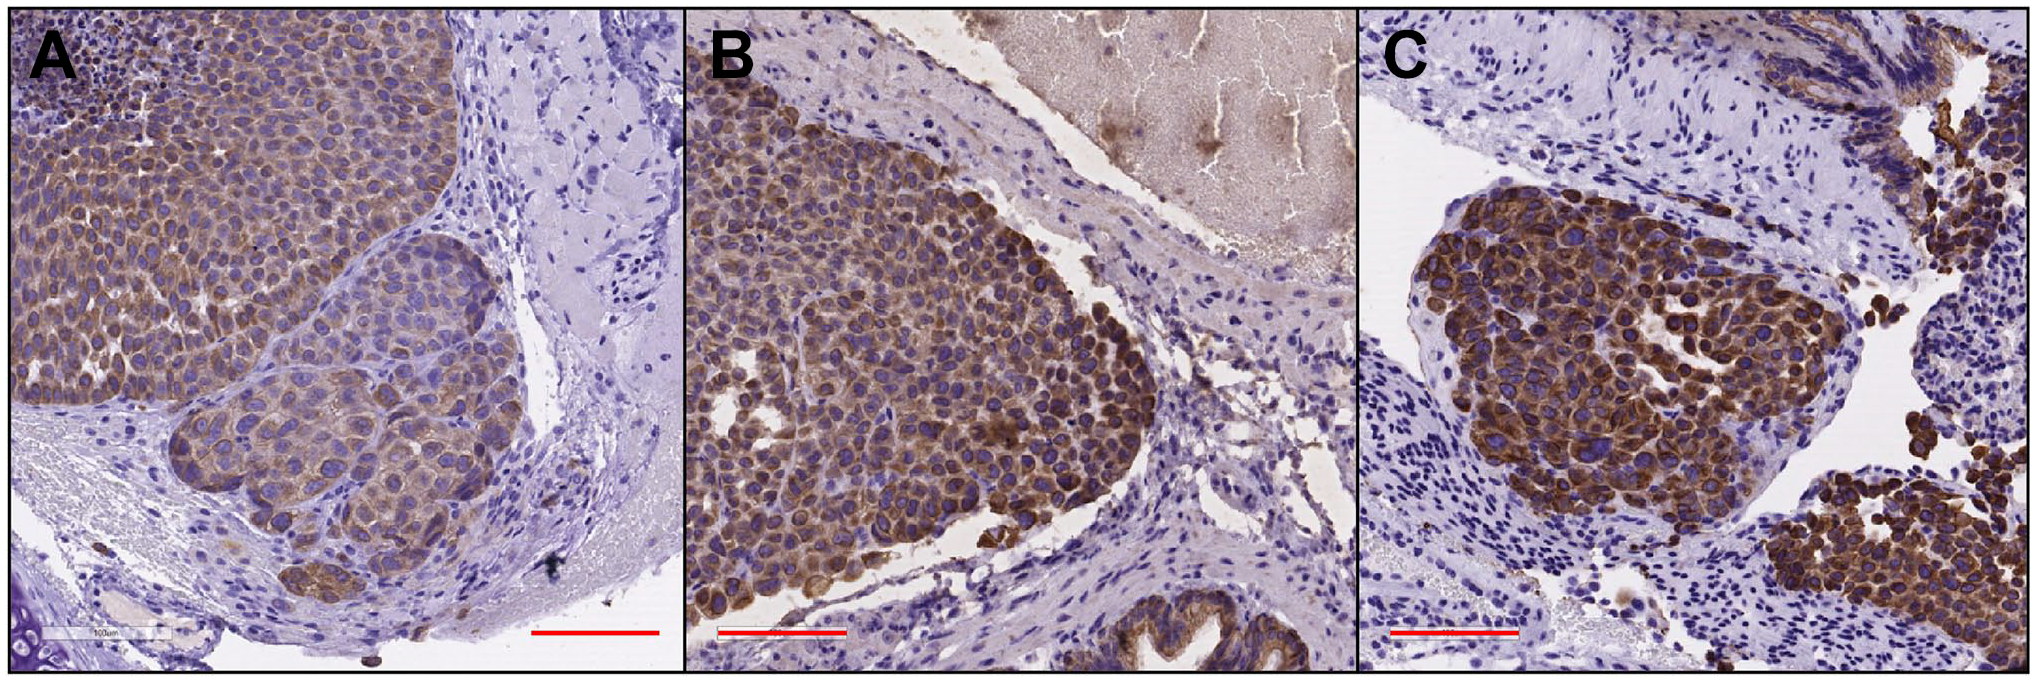
Comparing antigen retrieval staining parameters by means of tissue sections from a PDX transfected with the NCI-H460 cell line. The red scale bar equals 100µm. (A) PDX + H460, lung section is shown at 20x magnification, AR via Decloaker (Heat + Pressure), pH = 6, and IHC for cytokeratin. (B) PDX + H460, lung section at 20x, AR via Decloaker (Heat + Pressure), pH = 9 and IHC for cytokeratin. (C) PDX + H460, lung section at 20x, AR via boiling, pH = 9, and IHC for cytokeratin. Abbreviations: AR, antigen retrieval; IHC, immunohistochemical; PDX, patient-derived xenograft.
DNA Quantity and Quality in Clinical Cases
DNA status from the clinical tissue sections after AR and IHC were assessed by Qubit, fragment analyzer, and the KAPA library quantification assay. The data from the four cases are shown in Table 1. The slides from each of the four cases (#43, 47, 78, and 79) were processed in six different ways as listed in the column at far left (see Materials and Methods section for additional details): 1 = No AR, +IHC; 2 = Microwave AR, no IHC; 3 = Microwave AR, +IHC; 4 = Trypsin AR, no IHC; 5 = Trypsin AR +IHC; 6 = Control, no AR, no IHC.
Multiple QA/QC Testing of Clinical Samples.
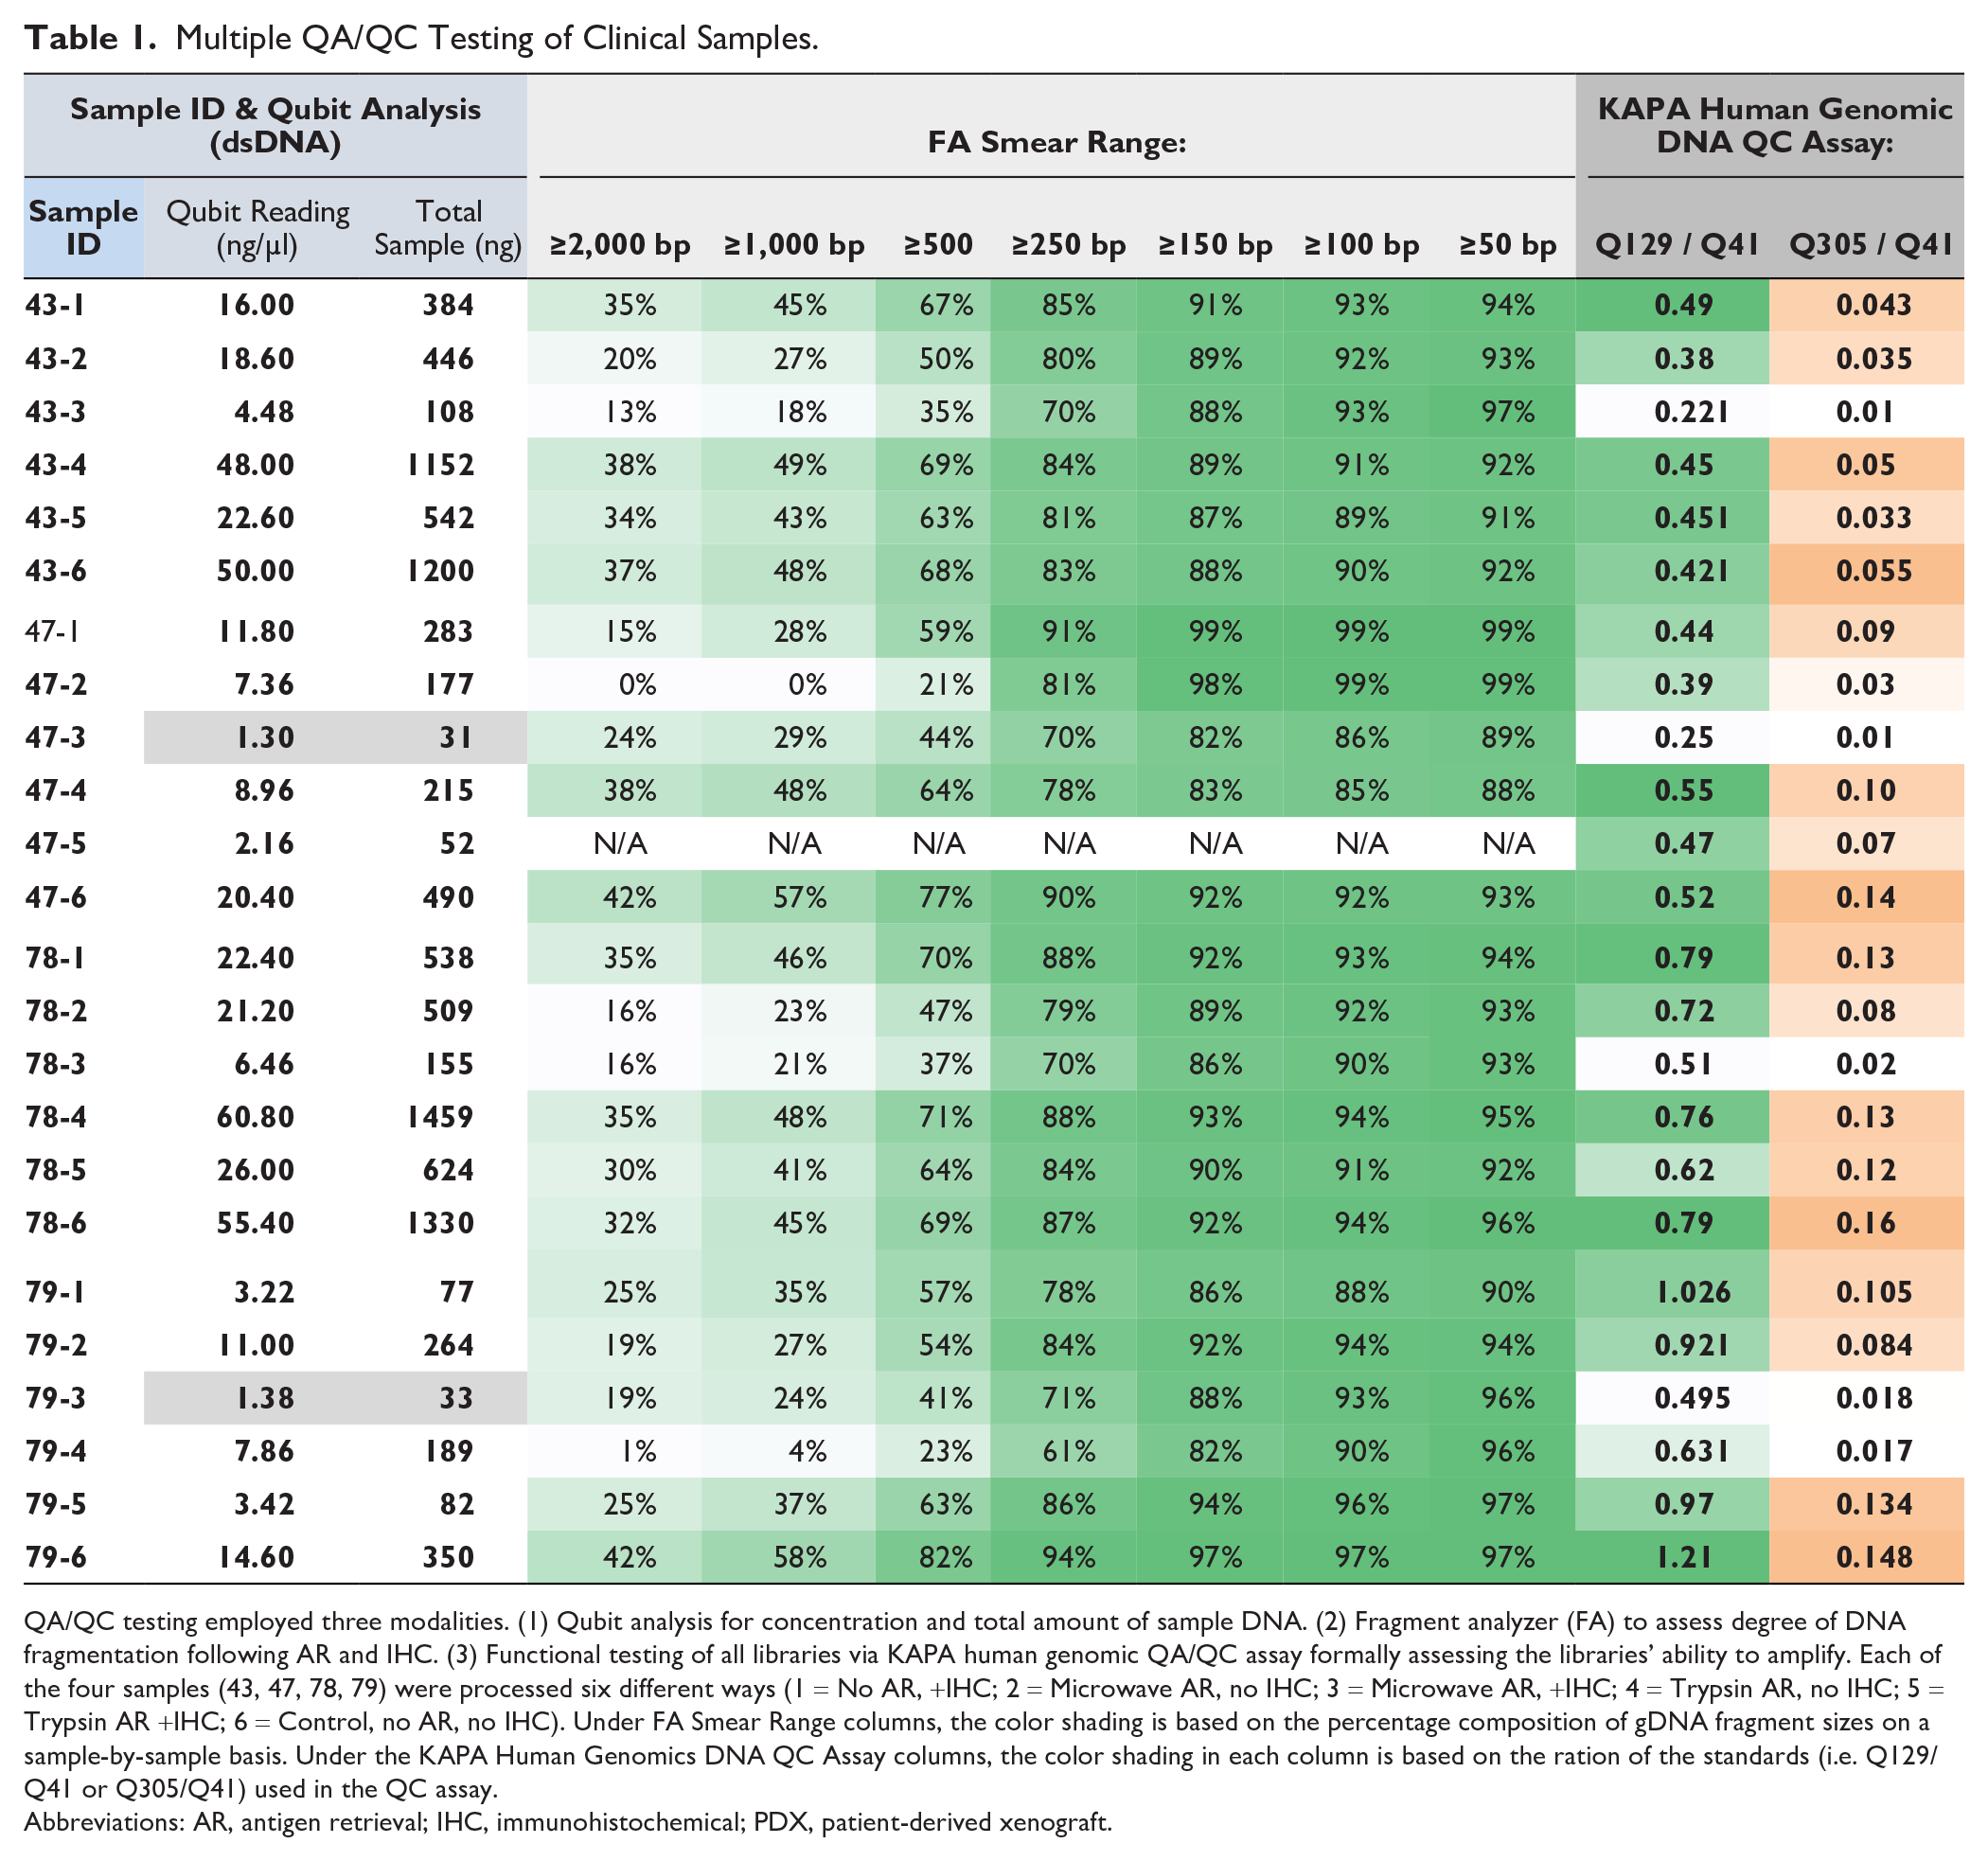
QA/QC testing employed three modalities. (1) Qubit analysis for concentration and total amount of sample DNA. (2) Fragment analyzer (FA) to assess degree of DNA fragmentation following AR and IHC. (3) Functional testing of all libraries via KAPA human genomic QA/QC assay formally assessing the libraries’ ability to amplify. Each of the four samples (43, 47, 78, 79) were processed six different ways (1 = No AR, +IHC; 2 = Microwave AR, no IHC; 3 = Microwave AR, +IHC; 4 = Trypsin AR, no IHC; 5 = Trypsin AR +IHC; 6 = Control, no AR, no IHC). Under FA Smear Range columns, the color shading is based on the percentage composition of gDNA fragment sizes on a sample-by-sample basis. Under the KAPA Human Genomics DNA QC Assay columns, the color shading in each column is based on the ration of the standards (i.e. Q129/Q41 or Q305/Q41) used in the QC assay.
Abbreviations: AR, antigen retrieval; IHC, immunohistochemical; PDX, patient-derived xenograft.
The main findings across the cases were that DNA quantity and quality were decreased by both the HIER and protease AR protocols, and yields were further decreased by IHC staining. For example, the Qubit results showed that DNA yields were decreased by both the HIER AR process and protease pre-treatment, although less so by proteases, as indicated by the three columns on the left of Table 1, showing sample number, DNA concentration, and total DNA amount, respectively.
DNA quality was then determined using fragment analyzer measurements to assess the degree of DNA fragmentation, along with the KAPA functional assay, to evaluate the ability of the DNA to amplify by measuring a specific PCR product size ratio. The data on the right side of Table 1 shows that significant fragmentation was induced by both AR protocols with a decrease in large DNA fragments compared to control samples. A similar trend was observed with KAPA analysis and relates to the fact that DNA fragment size was decreased by both HIER and protease AR treatments.
Next, detection of KRAS gene mutations were examined by ddPCR in two of the patient cases (#43, 47) after AR and IHC processing, along with cell lines for control DNA having known KRAS gene mutation status. As is evident in both the table and the graphs in Fig. 2 successful detection of mutant KRAS occurred in all samples under all conditions, indicating that the loss of DNA quality and quantity that occurs with AR and IHC does not preclude the proper detection of mutation status by ddPCR.
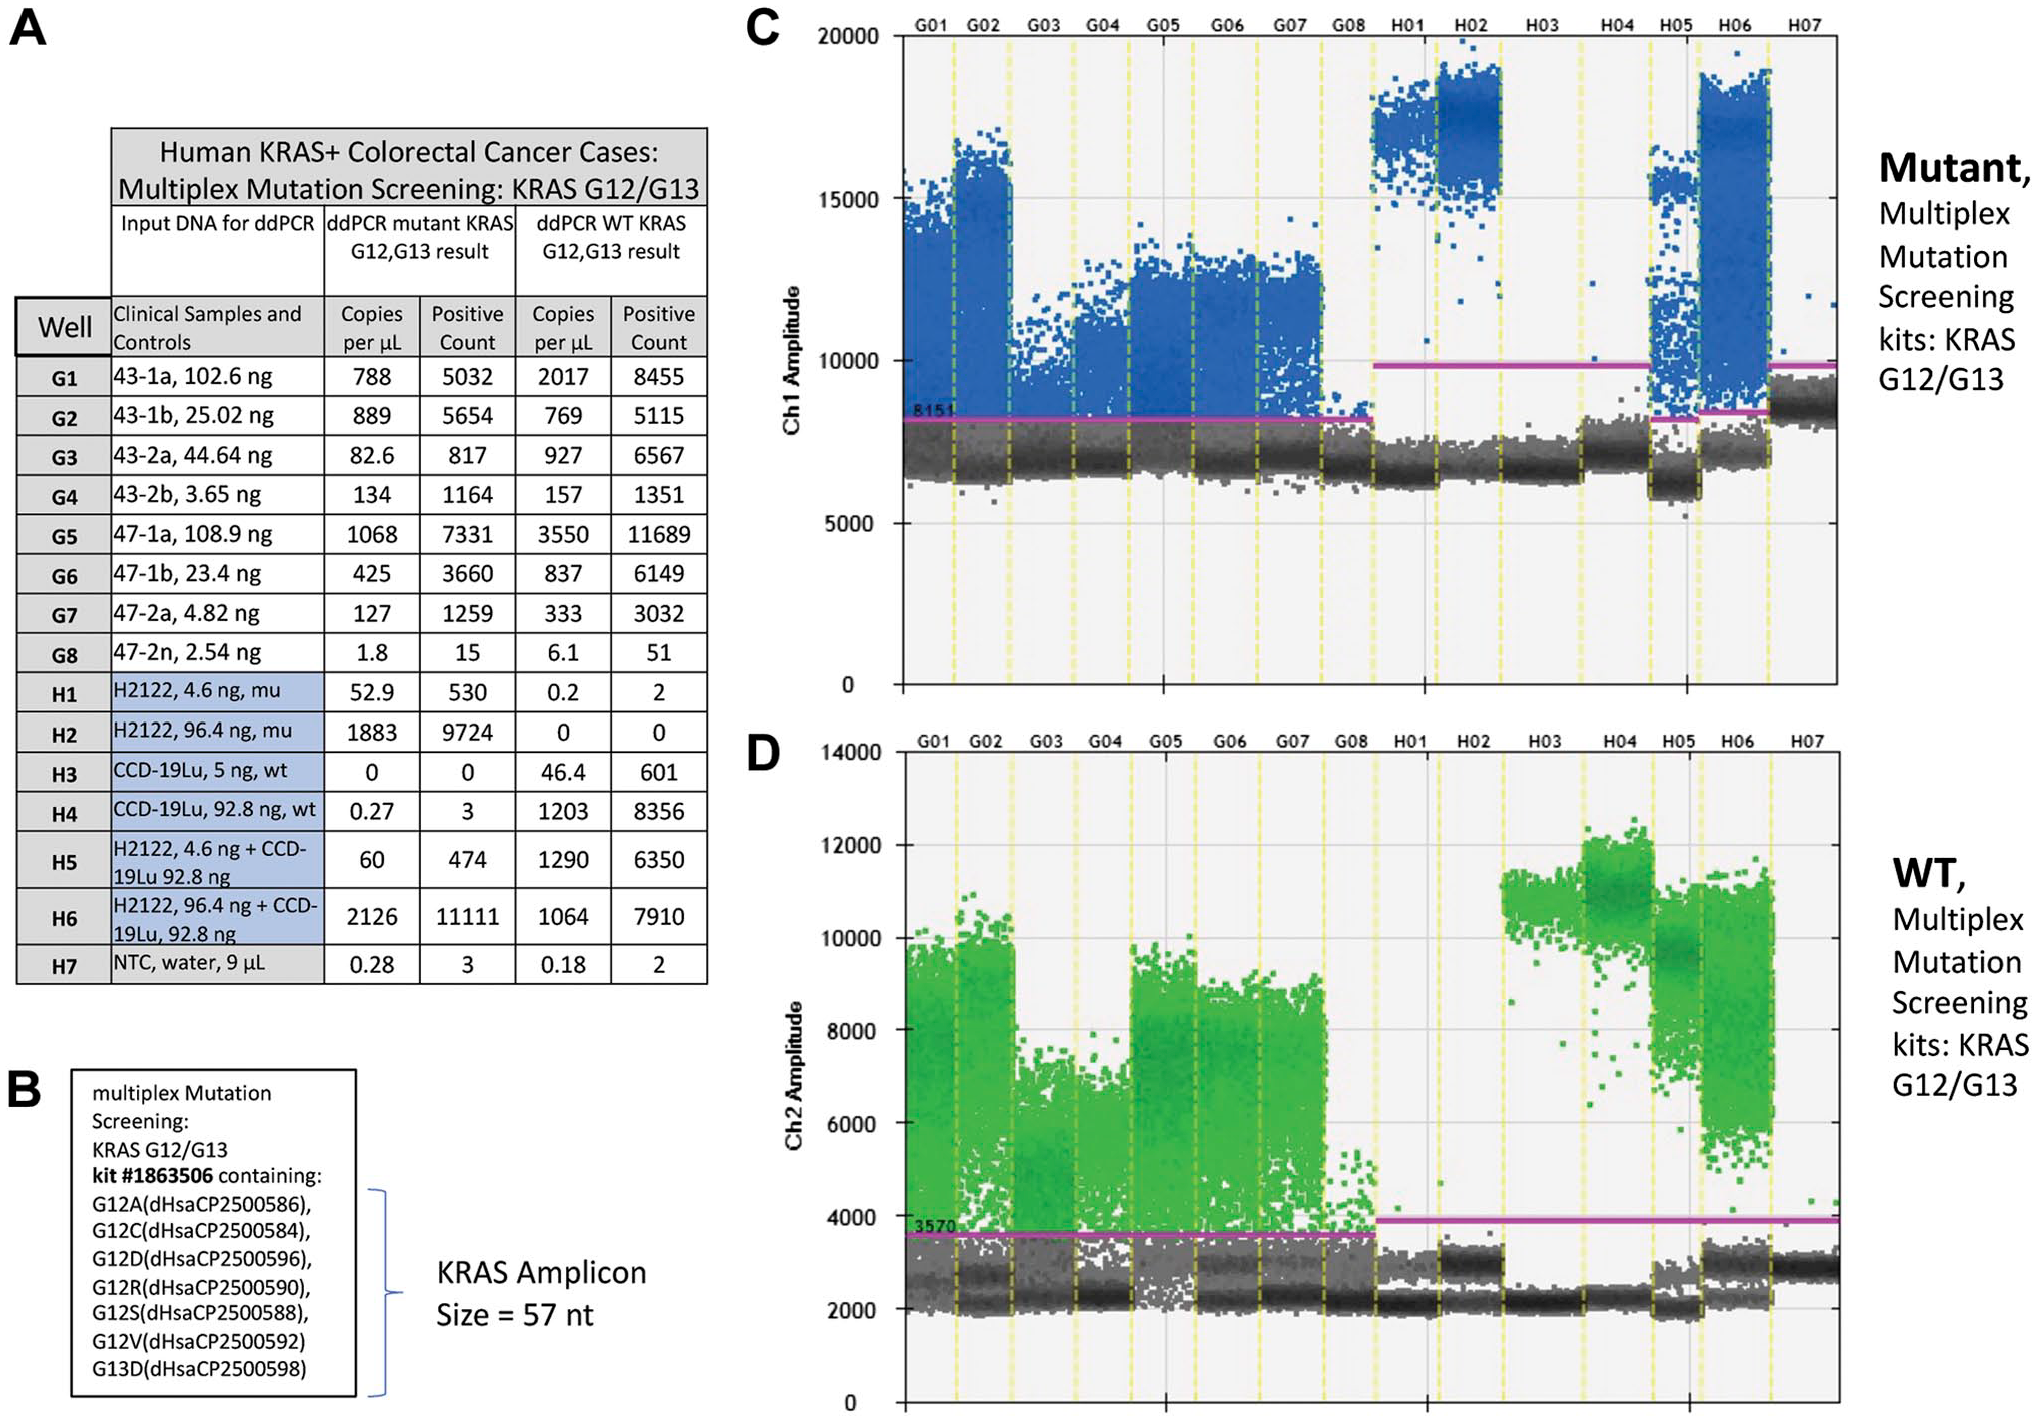
Results from ddPCR analysis of human KRAS positive colorectal cases, ±AR and IHC for cytokeratin. (A) Tabular format of ddPCR results with correspondence to: the multiplex screening assay for KRAS G12/G13 (B), the 1-D graphical outputs for KRAS G12/G13 events detected (C), and KRAS wild type (D). Table column definitions follow: Well, contains the unique designation for each sample and, this same designation is included on the graphical data for the identification of mutant KRAS (C) and, wild type detected events (D). The column Clinical Samples and Controls list the clinical samples run in this assay (i.e., 43-1a through 47-2n) and, the cell lines used for positive (H2122) and negative (CCD-19u) controls. Water is utilized as a No Template Control (NTC). Columns Copies per µL and Positive Count report the absolute quantitative events detected for mutant and wild type (WT) KRAS respectively. (B) Listing of targets included in the multiplex mutation screening for KRAS G12/G13. (C) KRAS mutant event data is viewed as a 1-D plot with each droplet from a sample plotted on the graph of droplet number vs fluorescence intensity. All positive droplets (above the magenta threshold line) are scored positive, assigned a value of one and tallied. All negative droplets (below the magenta threshold line) are scored as negative and assigned a zero value. (D) KRAS WT events are processed and reported on the 1-D plot identically as in C. Abbreviations: AR, antigen retrieval; IHC, immunohistochemical.
DNA Quantity and Quality in PDX Animal Model Specimens
Analysis of DNA from the PDX model system tissues was performed and mirrored the findings from the clinical cases to a large extent. The Qubit results showed that recovery of DNA was seen in all cases examined; however, there was a significant decrease in the HIER samples (Table 2). Apart from the AR procedure, the IHC process itself also resulted in a decreased yield of DNA. Fragment analysis of DNA size showed substantial damage to DNA, with extensive fragmentation and decreased yields. Variations in the HIER protocol by pH and replacement of the decloaker by boiling did not eliminate the negative effects. KAPA analysis further confirmed the Qubit and fragment analyzer data showing the size of the DNA was decreased; however, the DNA could be successfully amplified by PCR even after AR and IHC (Table 2).
Multiple QA/QC Testing on PDX Samples.
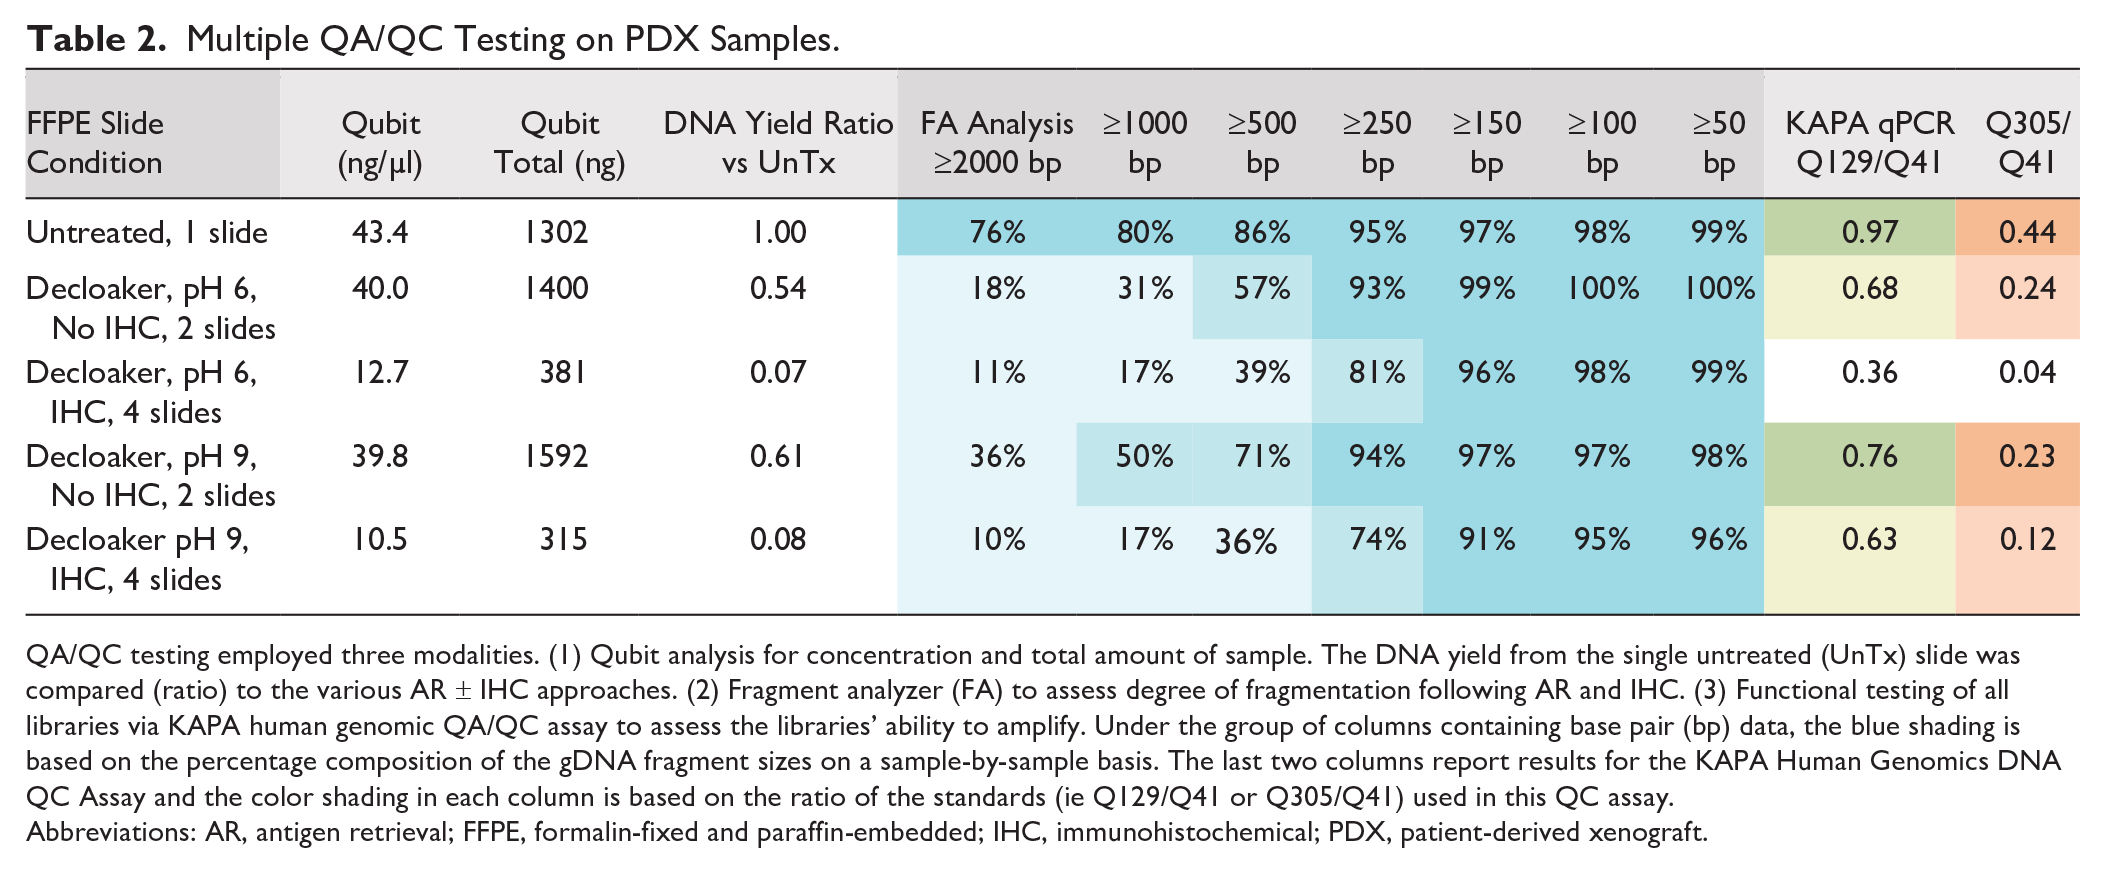
QA/QC testing employed three modalities. (1) Qubit analysis for concentration and total amount of sample. The DNA yield from the single untreated (UnTx) slide was compared (ratio) to the various AR ± IHC approaches. (2) Fragment analyzer (FA) to assess degree of fragmentation following AR and IHC. (3) Functional testing of all libraries via KAPA human genomic QA/QC assay to assess the libraries’ ability to amplify. Under the group of columns containing base pair (bp) data, the blue shading is based on the percentage composition of the gDNA fragment sizes on a sample-by-sample basis. The last two columns report results for the KAPA Human Genomics DNA QC Assay and the color shading in each column is based on the ratio of the standards (ie Q129/Q41 or Q305/Q41) used in this QC assay.
Abbreviations: AR, antigen retrieval; FFPE, formalin-fixed and paraffin-embedded; IHC, immunohistochemical; PDX, patient-derived xenograft.
Similarly, in spite of the observed deleterious effects on DNA, AR combined with IHC did not prevent PCR amplification of small amplicons for specific gene testing. As shown in the table and graphs of Figs. 3–5, CDKN2A gene deletion, and PIK3CA and KRAS gene mutations were successfully identified in the PDX specimens under all AR conditions. Figure 3 shows CDKN2A gene measurements using copy number variation analysis relative to the control gene RPP30. The presence of CDKN2A is observed in the control samples but is not seen in any of the PDX tissue samples, which are expected to be null. Figures 4 and 5 show successful detection of PIK3CA and KRAS gene mutations, respectively.
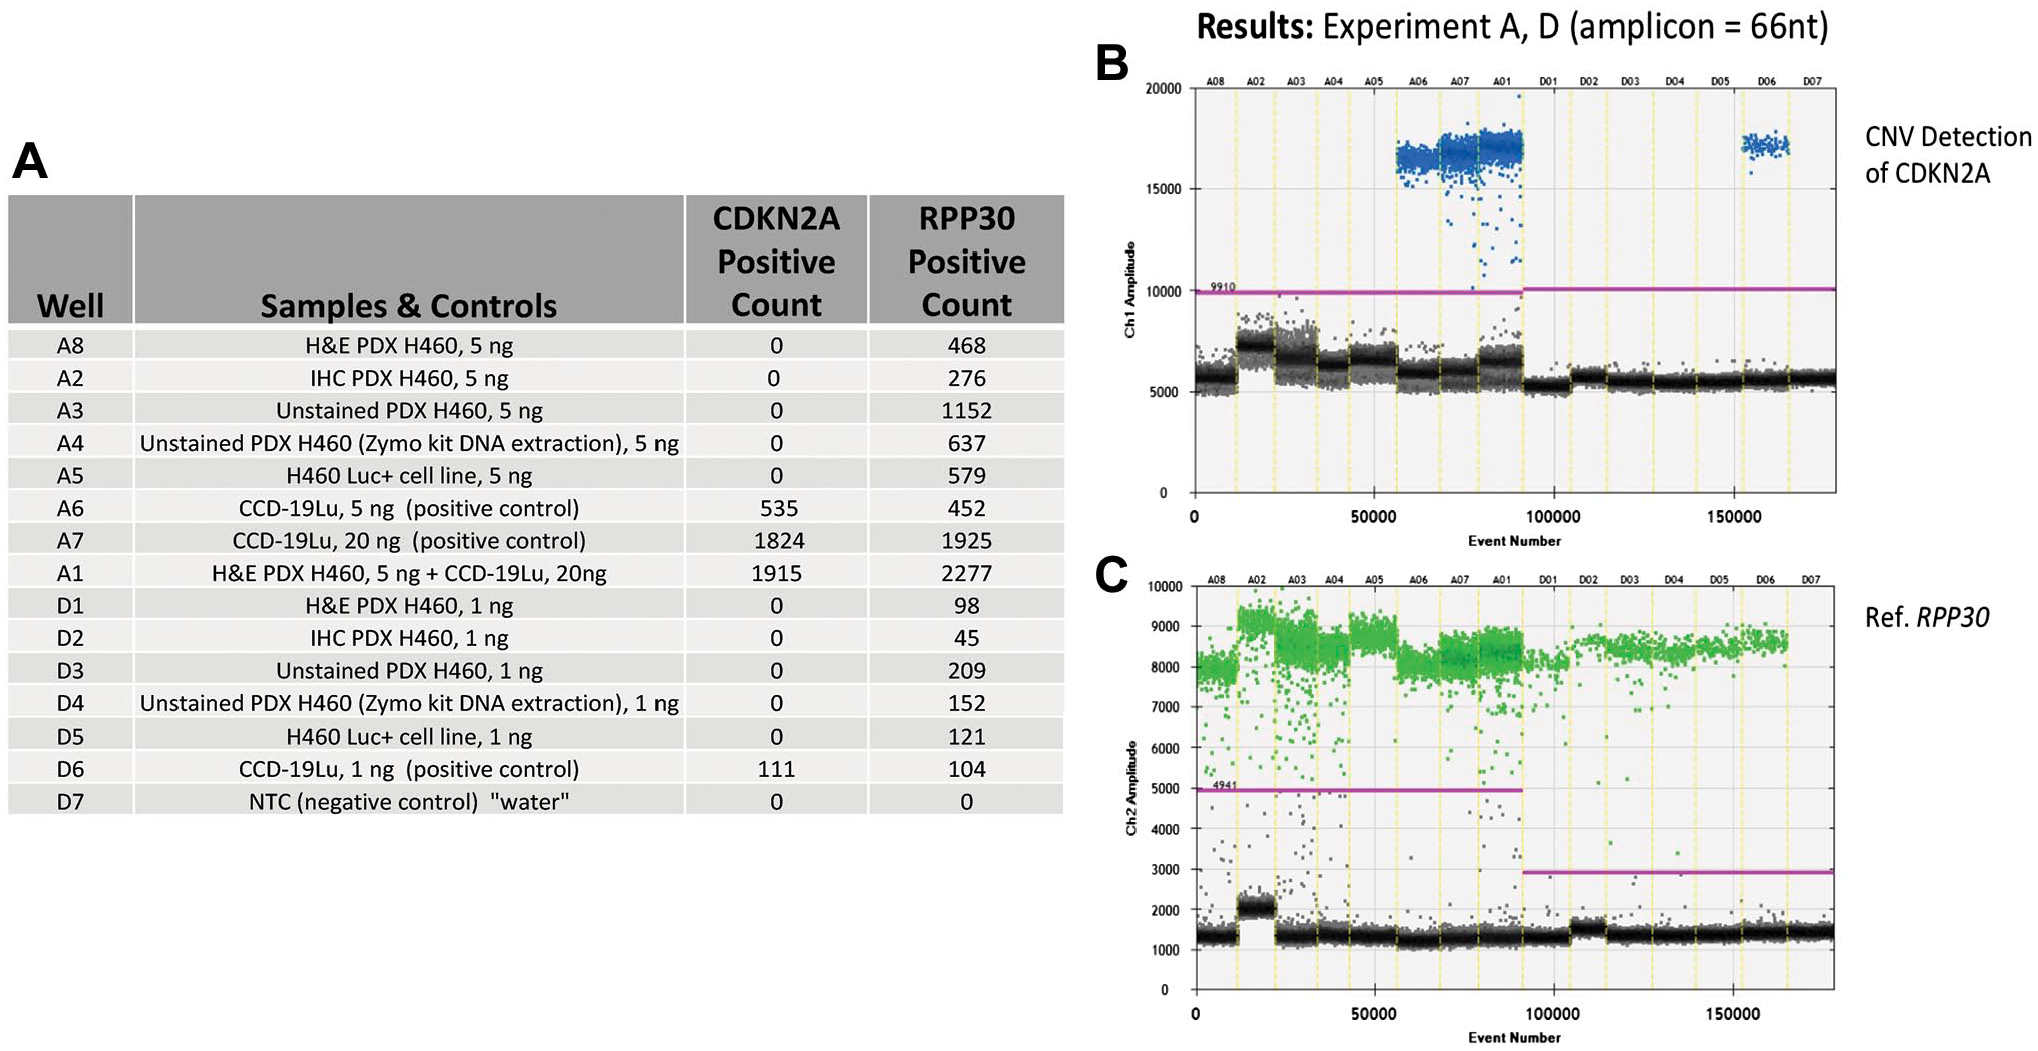
Results from ddPCR analysis for CDKN2A copy number events from a PDX transfected with cell line NCI-H460, ±AR and IHC for cytokeratin. (A) Tabular format of ddPCR results with correspondence to the 1-D graphical outputs for CDKN2A detected copy number events (B), and reference gene RPP30 copy number events (C). Table column definitions: Well, contains the unique designation for each sample, and this same designation is included on the graphical data for the identification of CDKN2A (B) and, RPP30 (reference) detected copy number events (C). The column Samples and Controls list the samples with respective input amounts run in this assay and, the cell lines used for negative (H460) and positive (CCD-19u) controls. Water is utilized as a No Template Control (NTC). Columns containing the term Positive Count report the absolute quantitative events corresponding to copy number detection events for CDKN2A and RPP30 respectively. (B) CDKN2A copy number event data is viewed as a 1-D plot with each droplet from a sample plotted on the graph of droplet number vs fluorescence intensity. All positive droplets (above the magenta threshold line) are scored positive, assigned a value of one and tallied. All negative droplets (below the magenta threshold line) are scored as negative and assigned a zero value. (C) RPP30 copy number events are processed and reported on the 1-D plot identically as in B. Abbreviations: AR, antigen retrieval; IHC, immunohistochemical; PDX, patient-derived xenograft.
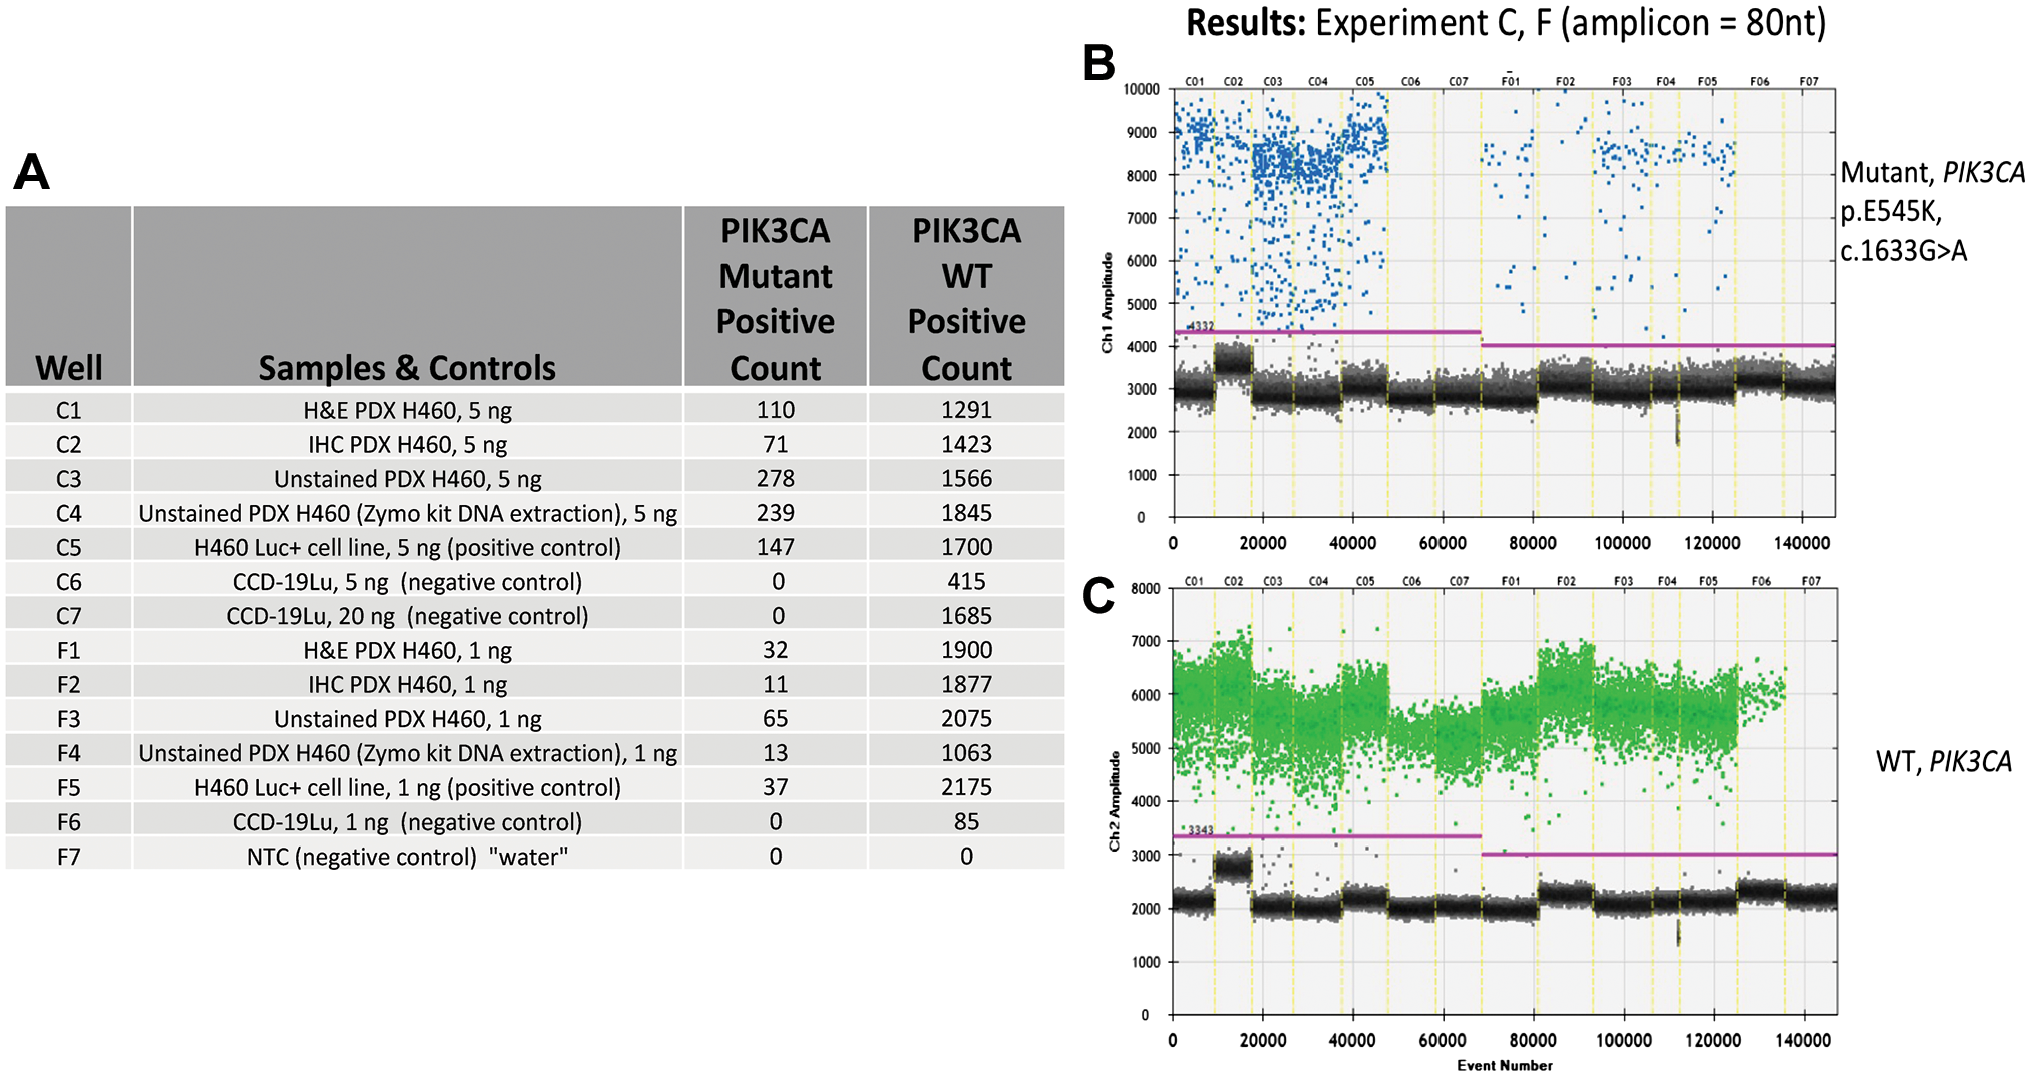
Results from ddPCR analysis for PIK3CA heterozygous point mutations and WT events from a PDX transfected with cell line NCI-H460, ±AR and IHC for cytokeratin. (A) Tabular format of ddPCR results with correspondence to the 1-D graphical outputs for PIK3CA mutational events (B), and PIK3CA WT (C). Table column definitions: Well, contains the unique designation for each sample, and this same designation is included on the graphical data for the identification of PIK3CA mutations (B) and, WT events (C). The column Samples and Controls list the samples with respective input amounts run in this assay and, the cell lines used for positive (H460) and negative (CCD-19u) controls. Water is utilized as a No Template Control (NTC). Columns containing the term Positive Count report the absolute quantitative events detected corresponding to PIK3CA point mutation and WT respectively. (B) PIK3CA mutation event data is viewed as a 1-D plot with each droplet from a sample plotted on the graph of droplet number vs fluorescence intensity. All positive droplets (above the magenta threshold line) are scored positive, assigned a value of one and tallied. All negative droplets (below the magenta threshold line) are scored as negative and assigned a zero value. (C) PIK3CA WT events are processed and reported on the 1-D plot identically as in B. Abbreviations: AR, antigen retrieval; IHC, immunohistochemical; PDX, patient-derived xenograft.
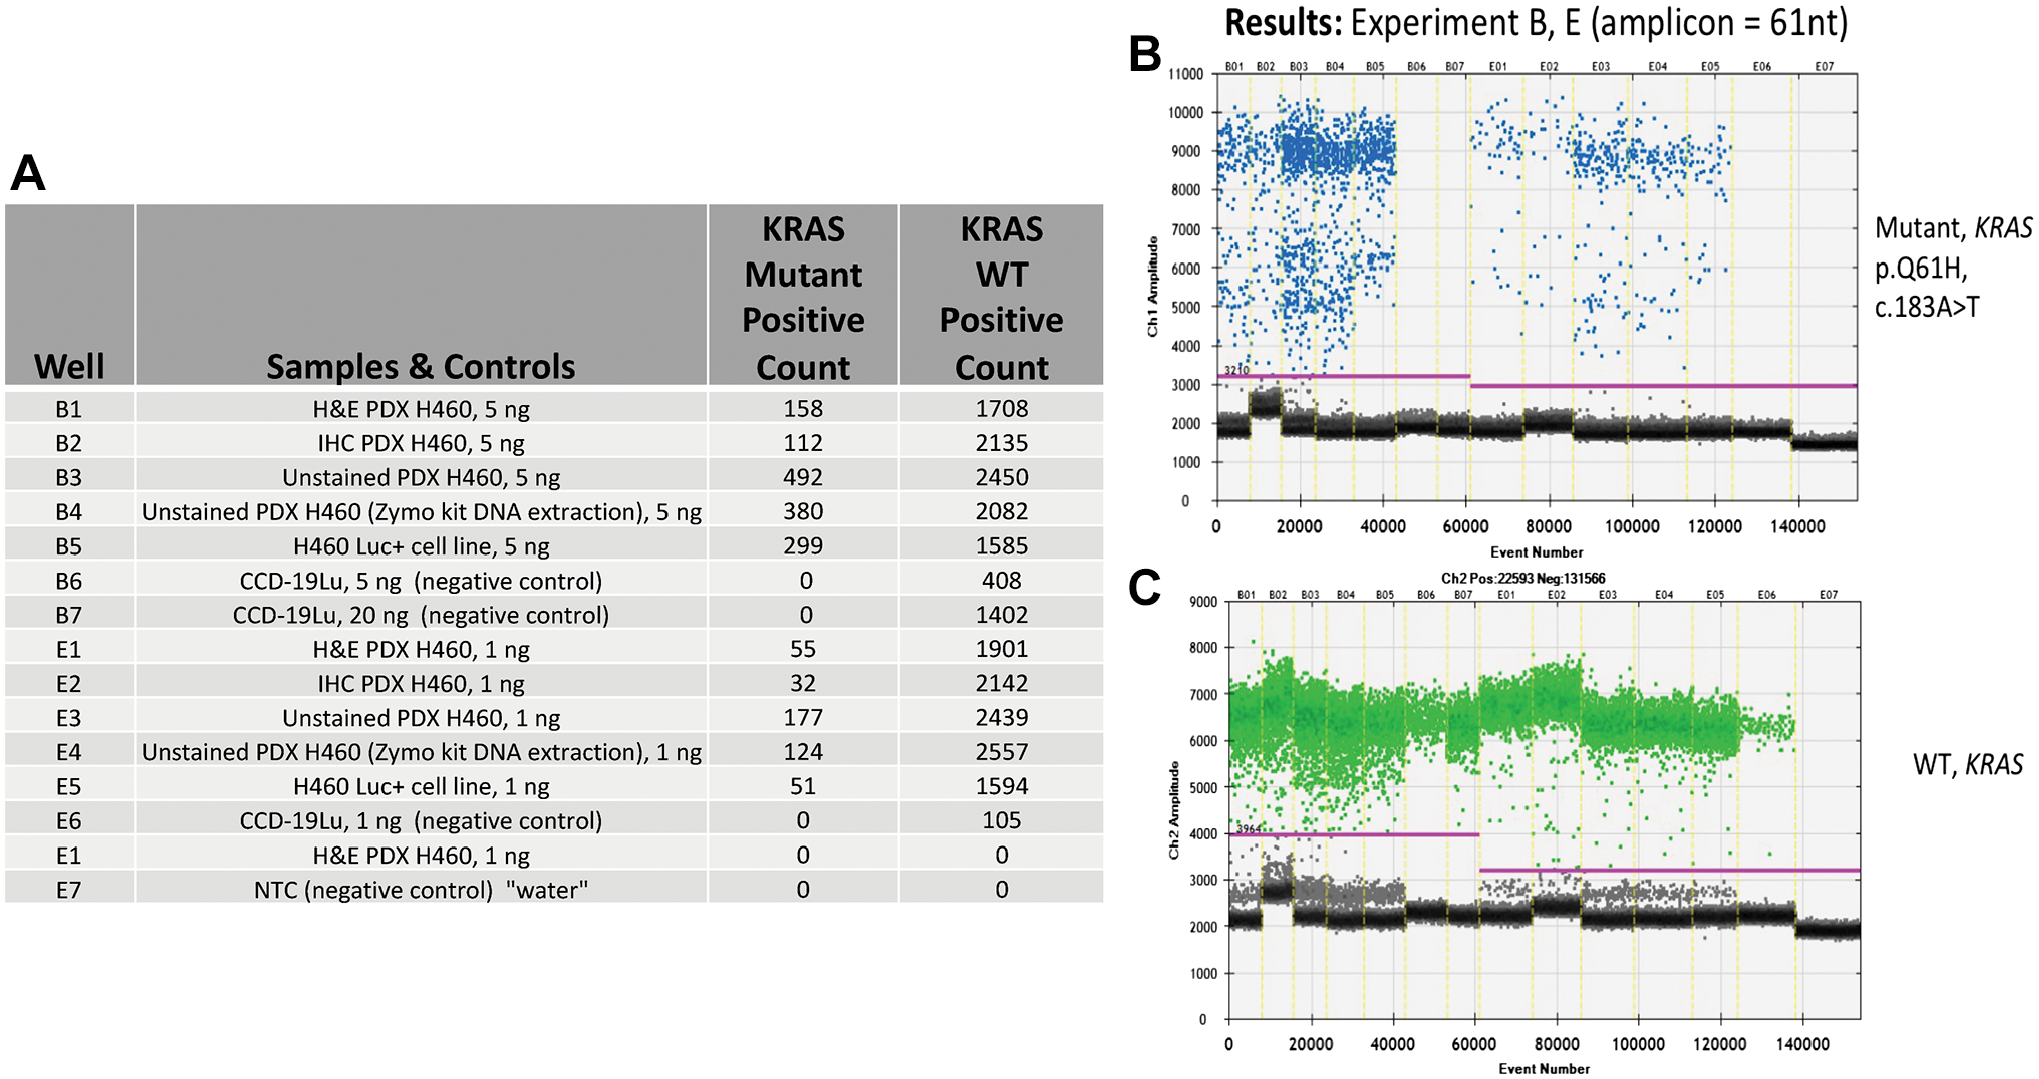
Results from ddPCR analysis focused on the detection of a KRAS homozygous point mutation and associated WT events from a PDX transfected with cell line NCI-H460, ±AR and IHC for cytokeratin. (A) Tabular format of ddPCR results with correspondence to the 1-D graphical outputs for KRAS mutational events (B), and KRAS WT (C). Table column definitions: Well, contains the unique designation for each sample, and this same designation is included on the graphical data for the identification of KRAS mutations (B) and, WT events (C). The column Samples and Controls list the samples with respective input amounts run in this assay and, the cell lines used for positive (H460) and negative (CCD-19u) controls. Water is utilized as a No Template Control (NTC). Columns containing the term Positive Count report the absolute quantitative events detected corresponding to KRAS point mutations and WT respectively. (B) KRAS mutation event data is viewed as a 1-D plot with each droplet from a sample plotted on the graph of droplet number vs fluorescence intensity. All positive droplets (above the magenta threshold line) are scored positive, assigned a value of one and tallied. All negative droplets (below the magenta threshold line) are scored as negative and assigned a zero value. (C) KRAS WT events are processed and reported on the 1-D plot identically as in B. Abbreviations: AR, antigen retrieval; IHC, immunohistochemical; PDX, patient-derived xenograft.
Samples from the PDX model were further as-sessed by targeted NGS. Similar to the ddPCR-based analysis, targeted NGS also showed successful detection of KRAS and PIK3CA gene mutations in all samples under all AR conditions (Table 3). The specific gene mutations from KRAS and PIK3CA are reported, along with NGS metrics for this assay approach employing Unique Molecular Identifier (UMI), which further enhance bioinformatic error correction.
Summary of Targeted Next Generation Sequencing (NGS) Performed on Lung Tissue Obtained From PDX Transfected With Cell Line NCI-H460.
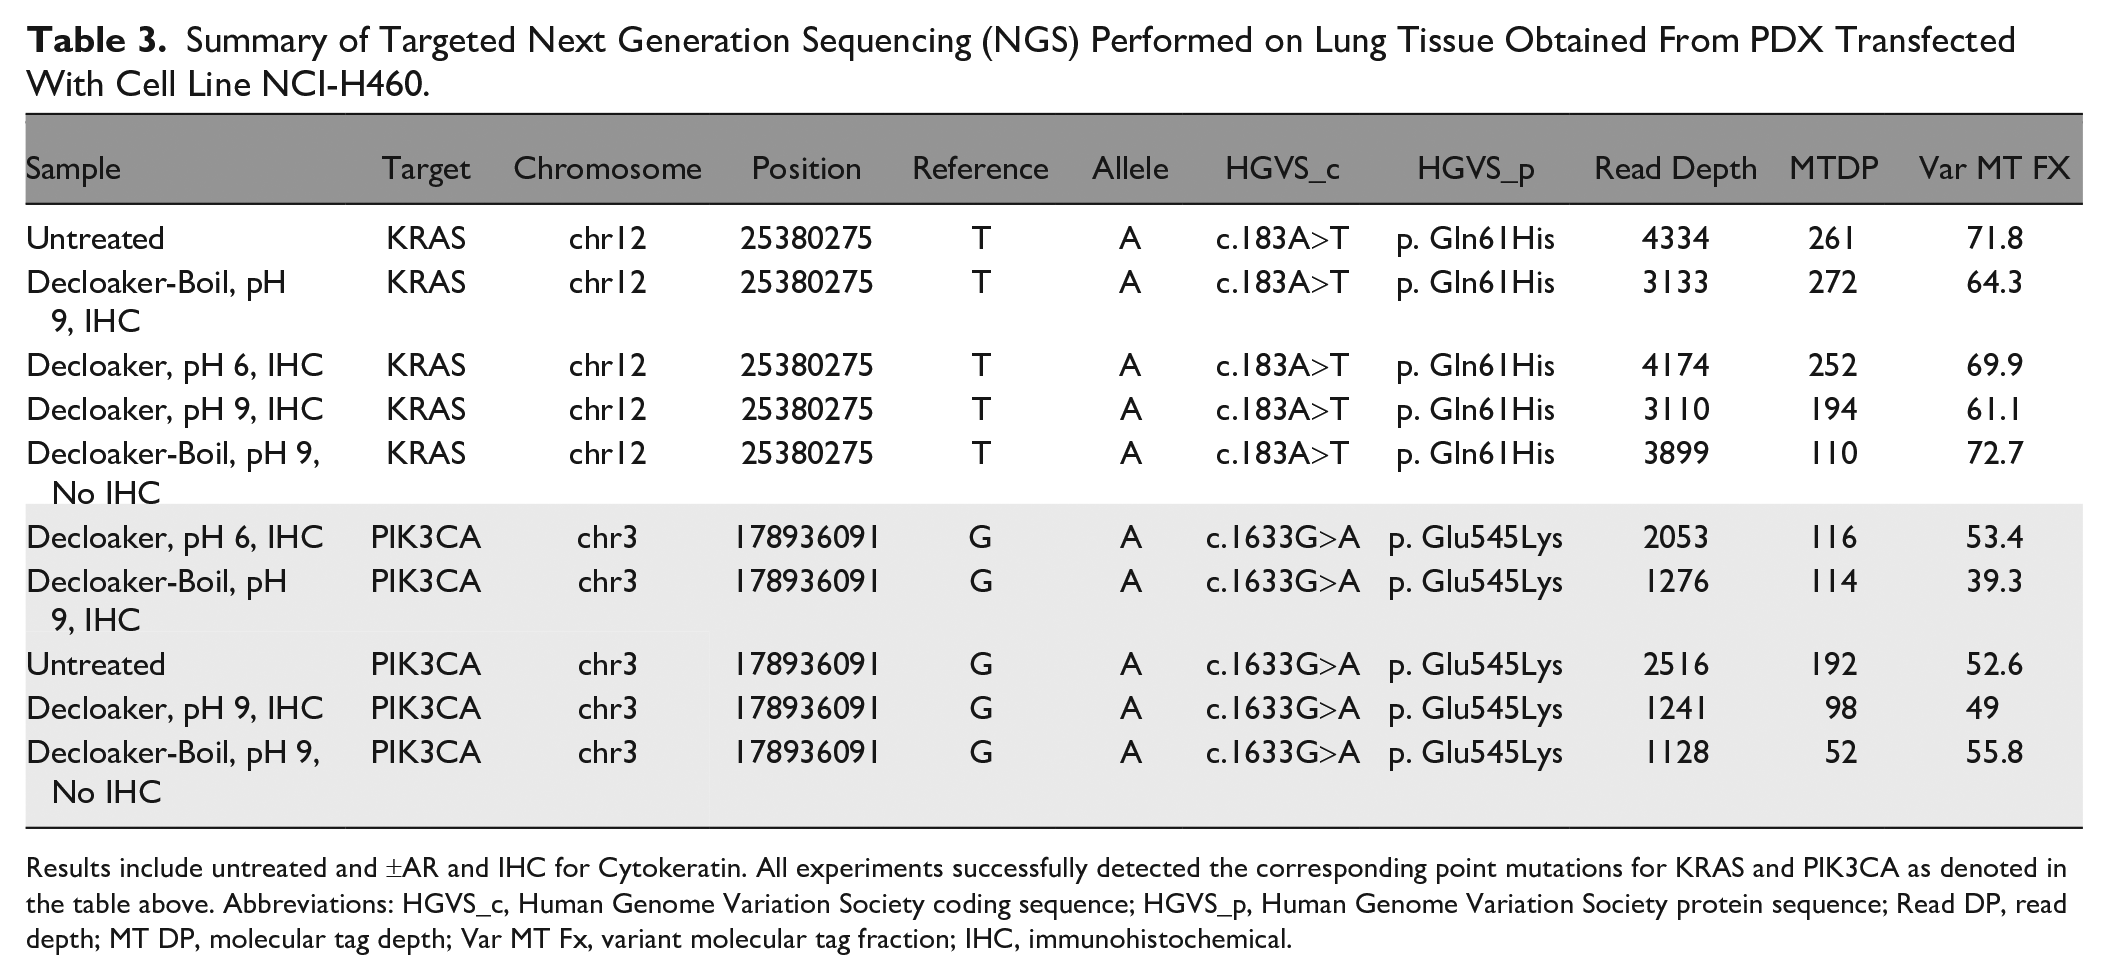
Results include untreated and ±AR and IHC for Cytokeratin. All experiments successfully detected the corresponding point mutations for KRAS and PIK3CA as denoted in the table above. Abbreviations: HGVS_c, Human Genome Variation Society coding sequence; HGVS_p, Human Genome Variation Society protein sequence; Read DP, read depth; MT DP, molecular tag depth; Var MT Fx, variant molecular tag fraction; IHC, immunohistochemical.
Immunodissection-Based Analysis
Many of the downstream molecular analysis methods in the precision medicine workflow are well established. However, the current upstream tools used to isolate cells from histological sections are often inadequate to meet the needs of investigators, being either too laborious or imprecise. For example, laser-based microdissection, razor blade scrapes of slides, and flow cytometry are useful in many instances but can be impractical for some studies due to instrument cost, requirement for extensive operator time, and low-throughput, or lack of precision. 53
Ideally, a range of new cell procurement and targeting tools, including imaging and molecular target-based methods, will become available for molecular profiling efforts in the future such that the right technology can be used for the right question at the right time. Due to the large number of cell types, organelles, physiological functions, and pathologies of interest, it is unlikely that a one-size-fits-all technological approach will be sufficient.
Therefore, to specifically examine populations of immunostained targets, dissected cells were recovered for molecular analysis using immunodissection. A representative image of the immunostained tissue before (panels A and B) and after laser dissection (panel C) is shown in Fig. 6. Panels A and B on the left side of the figure show the immunostained tissue prior to dissection at 50X and 100X magnification, respectively. Panel C on the right is an image of the LCM cap containing the immunostained cells after dissection. (Note the images were taken during the immunodissection process thus the quality of the images is lower than usual.)
Immunodissection of human colorectal cancer tissue. Microscopic images of cytokeratin-stained tissue prior to microdissection (A) 50X magnification and (B) 100X magnification. (C) Image of microdissection cap with dissected immunohistochemically stained epithelium.
The molecular data from the procured immunostained cells were similar overall to the whole slide scrape samples, although the DNA did show increased fragmentation and decreased yields after AR. Nonetheless, both wild type and mutated KRAS were accurately detected in all clinical samples, with representative cases shown in Figs. 7 and 8. Table A of Fig. 7 lists the raw ddPCR results for case 47, and the data are also represented in the graphs in Panels B (mutant KRAS) and C (wild type KRAS). Similar data are shown for Case 78 in Fig. 8.
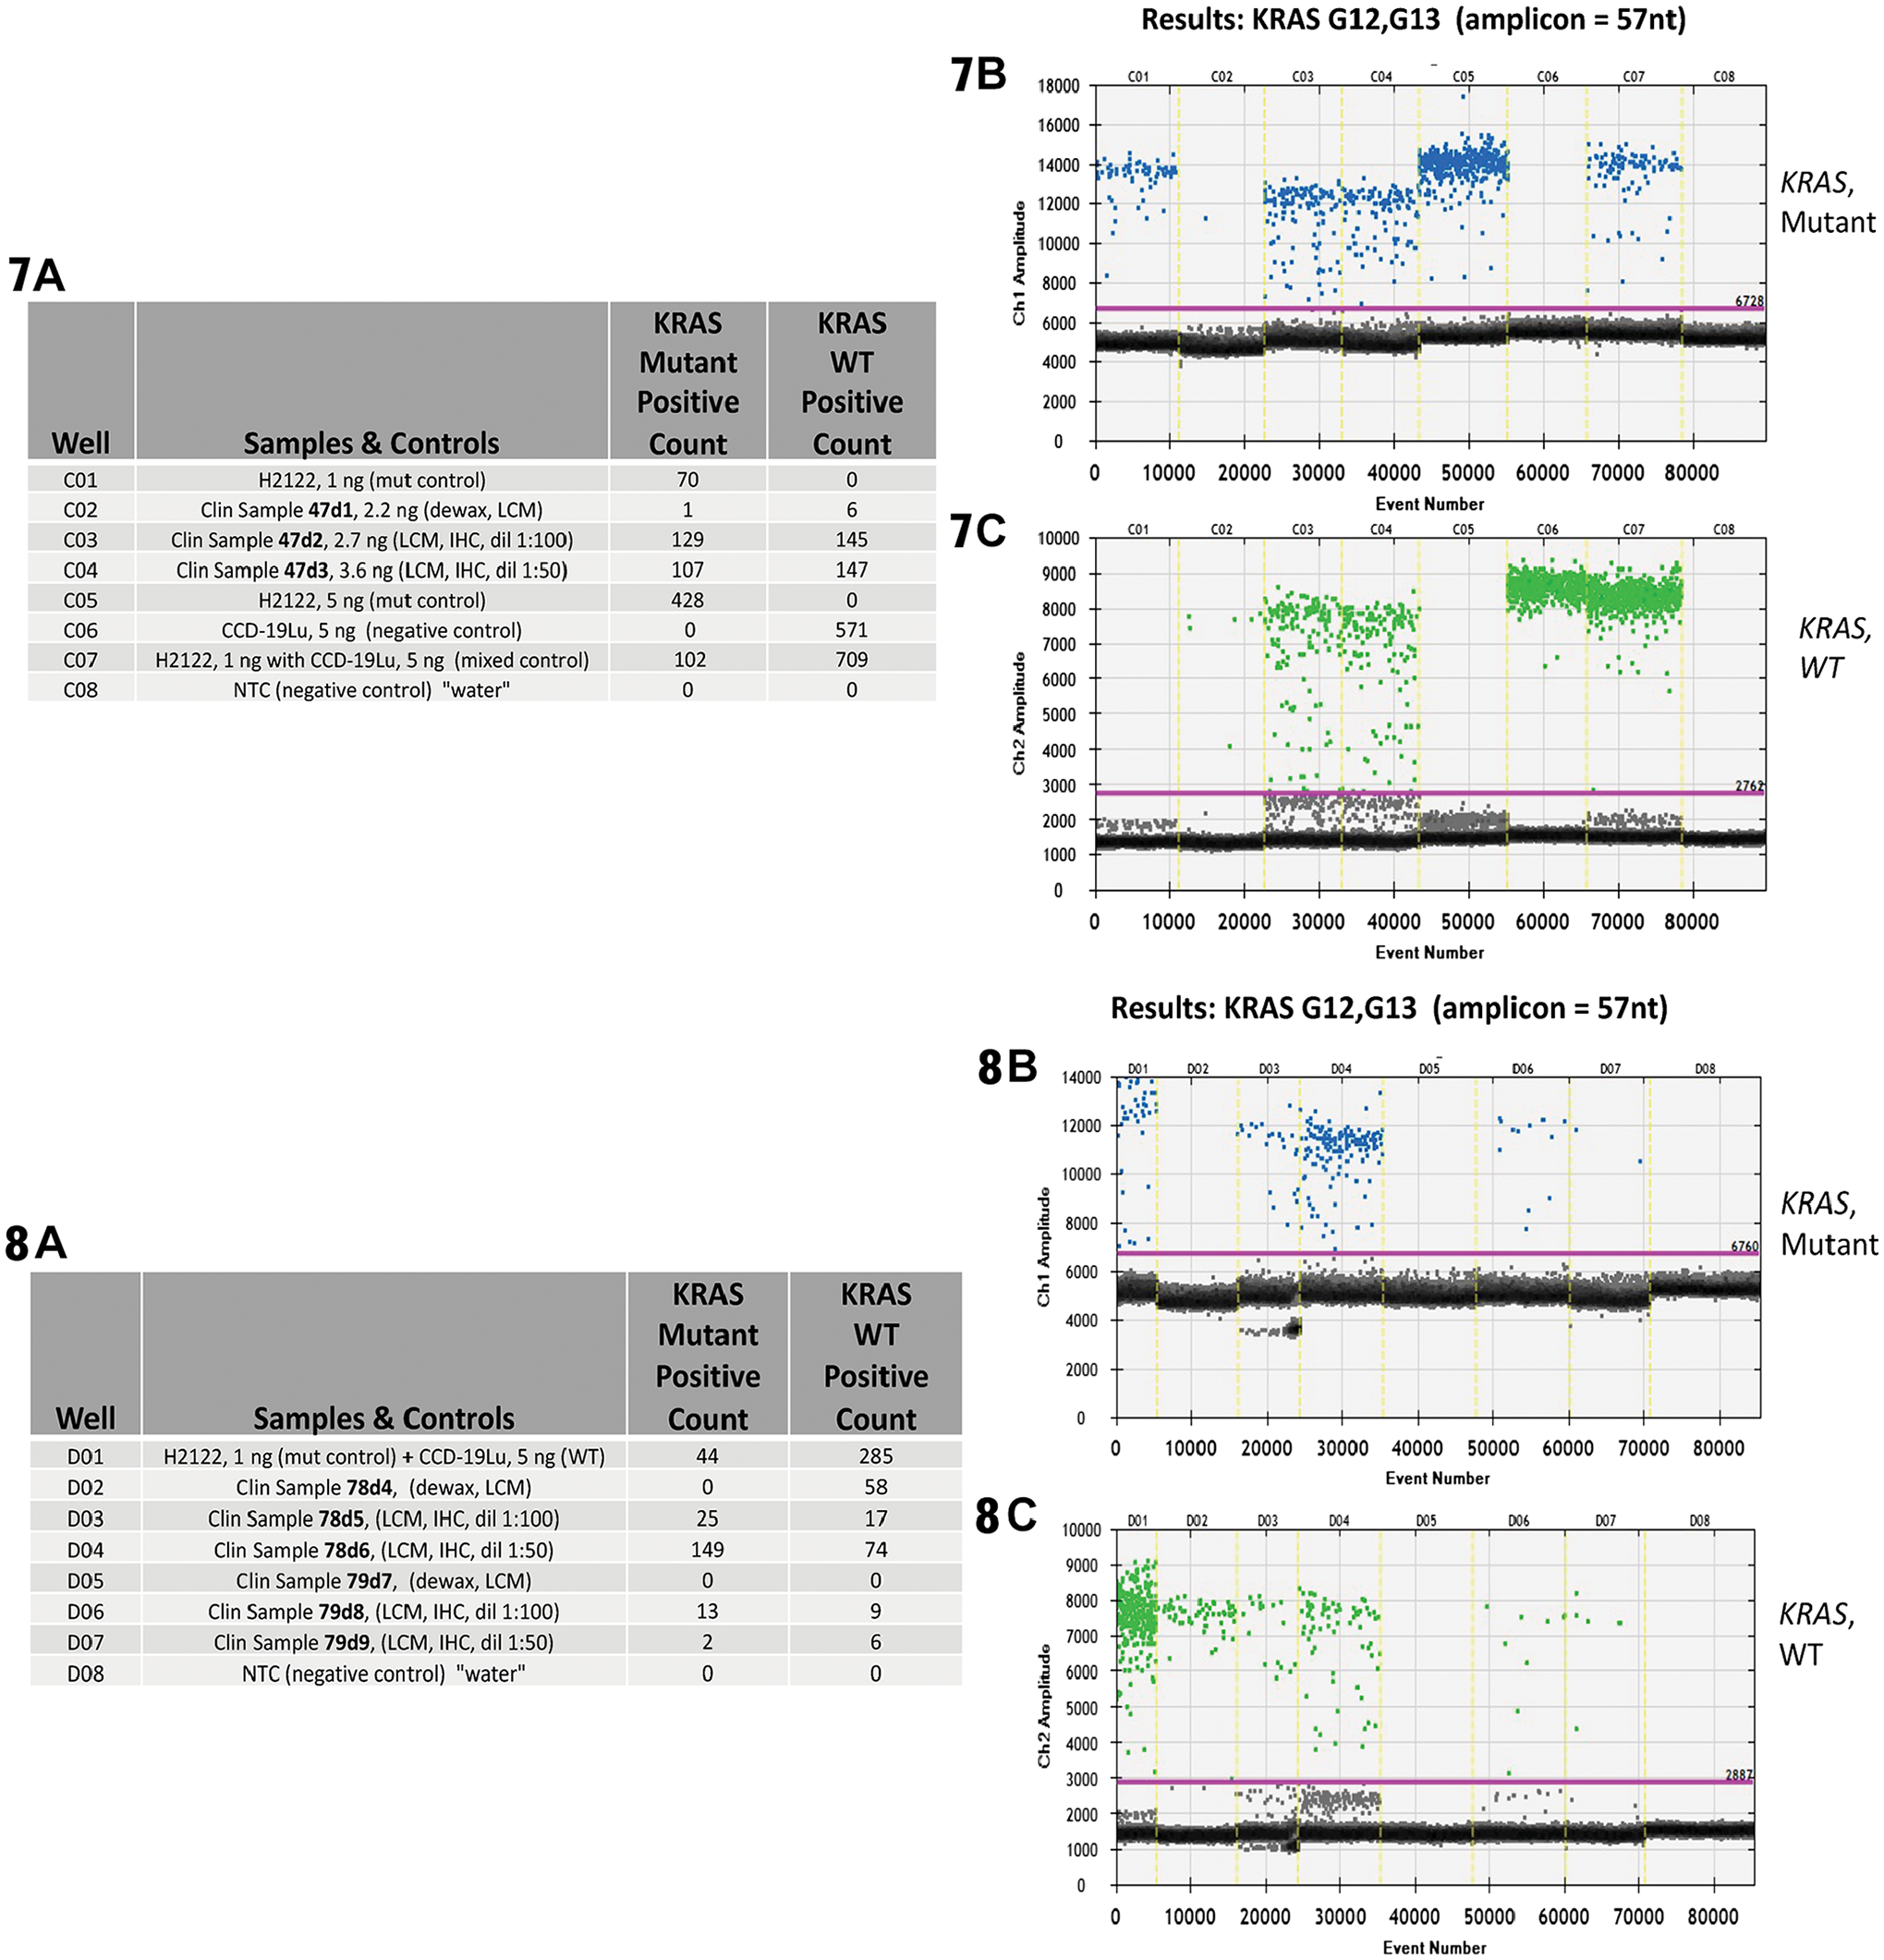
Results from ddPCR analysis focused on the detection of a KRAS point mutations and associated WT events from known KRAS positive colorectal carcinoma clinical samples. These clinical samples have undergone immunodissection along with ±AR and IHC for cytokeratin. A positive control is provided by cell line H2122 (known KRAS G12C mutation) and, negative controls by cell line CCD-19Lu (no KRAS mutations) and water.
To summarize the molecular impact of HIER with respect to immunodissected samples, we found that all tested methods resulted in the detection of short-read DNA sequences via both ddPCR and NGS. Despite significant DNA fragmentation from the combination of AR and IHC, known mutations were identified. Investigators can use the HIER method of choice when studying immunodissected samples.
Discussion
Precision medicine builds on many decades of outstanding laboratory- and clinic-based studies to benefit patients. Today, identifying changes in DNA using NGS and other genomic methods is primarily fueling this evolution. Tomorrow, DNA sequence information will be increasingly enhanced by mRNA expression measurements, proteomic profiling, and other, omics data, providing a complete molecular fingerprint of patient specimens, toward improvement of diagnosis, prognosis, and treatment.
To this end, several new dissection technologies are under development, including those that rely on investigators to identify target cells, methods that incorporate digital pathology and computer algorithms for automated cell selection, increasingly advanced flow cytometry-based protocols, and approaches that use molecular targeting for operator-independent cell identification and selection. Specific examples include immunodissection, xMD, DepArray, and Spatially Invariant Vector Quantization (SIVQ)-IHC LCM.
As a baseline method, standard LCM procures specific targets from histological sections based on light microscope visualization and cell-by-cell targeting by an operator and is a platform on which many other advanced technologies are being developed. Currently, there are several instruments and related microgenomics kits that are commercially available in the marketplace. Laser-based dissection technology has advanced the biology and molecular pathology fields, with over 4000 publications to date. LCM is utilized to study molecular changes in a wide range of normal functions and pathologies, including neoplastic progression, cellular physiology, embryonic development, growth and differentiation, and aging.
The morphological assessment step in the LCM procedure is often time consuming, thus computer-aided and molecular target-based cell identification methods can reduce the effort and resources needed for cell selection. Technologies that employ image segmentation and feature extraction of histopathological images, for example, SIVQ, 20 can improve the LCM workflow by shifting the role of the pathologist to a supervisory position to expedite the process. In contrast to computer-based dissection, immuno-LCM allows investigators to target specific cell types by visually aiming the dissection laser at IHC or immunofluorescence (IF)-stained cells. Investigators can also combine different techniques together (e.g., computer-aided and immuno-guided), for example, applying SIVQ analysis to an immunostained slide.
For all of the methods or combination of methods that include molecular targeting for cell identification, investigators must consider the effect of upfront processing steps on the resultant molecular data. Previously, we have shown that snap-frozen tissue maintains biomolecular quality superior to FFPE processing. 34 Upfront formalin fixation results in DNA fragmentation as the crosslinker binds the DNA with other biomolecules in the specimen and the nucleic acids are damaged during the extraction process. However, DNA is the least sensitive biomolecule to the effects of formalin fixation. Both RNA and protein are greatly damaged during the fixation and extraction process. Interestingly, small RNA, such as microRNA, avoid extensive damage and can be successfully sequenced following IHC and xMD. 30
To date, the ability to use modern genomic techniques such as ddPCR or NGS to detect tumor mutations in immunodissected samples has not been well established. The current article summarizes a comprehensive analysis of the effect of AR on DNA status and molecular analysis. The data show that the two main protocols for AR, protease treatment and HIER, both induce damage to DNA. Nonetheless, both AR methods produced accurate and similar results using standard PCR assays that are routinely employed in the research lab and clinic, primarily since the DNA fragments remain large enough for most amplification protocols. One caveat to this conclusion, though, is the effect of AR on long-read sequencing, which is likely to be more problematic.
In the clinic, automated immunostainers and protease digestion are generally used for AR and the DNA quality from these slides after IHC is good enough for all assay types, including long-read sequencing. The number of primary antibodies used for patient care is relatively small compared to the research laboratory and most of these antibodies are established, high-quality reagents that perform well for IHC. Although the HIER protocol significantly improves the intensity of IHC staining it is not necessary for most antibodies used for diagnostic and prognostic purposes. In contrast, in both the clinical research arena and in the laboratory, it is common to utilize a much wider range of antibodies, for example, to study levels of a new protein isoform or phosphorylation status of a signaling molecule. Oftentimes the antibodies are not useful for IHC without HIER or they produce borderline staining results that can be significantly improved by HIER. Thus, there is an important trade-off for investigators to consider between the quality of IHC staining and the need for intact DNA for downstream assays.
This study focused specifically on the effects of AR on DNA status. We observed a drop-off in DNA quantity due specifically to the IHC staining process and the deposition of DAB chromogen precipitate on the target cells. This effect has been observed previously in published studies of non-immunodissected samples. Additional evaluation of this issue specifically in immunodissected samples and development of best IHC staining practices and AR methods will be important tasks for the molecular pathology community to continue in the future.
Footnotes
Author Contributions
DJJ designed experiments, performed data analysis and drafted the manuscript, IJS performed laboratory experiments, AR performed laboratory experiments, SL performed laboratory experiments and data analysis, EAP carried out data analysis, ML performed laboratory experiments, MAS coordinated laboratory experiments; JM coordinated laboratory experiments, MREB designed experiments, performed data analysis and drafted the manuscript, MAT designed experiments, performed data analysis and drafted the manuscript. All authors have read and approved the final manuscript.
Competing Interests
The author(s) declared the following potential conflicts of interest with respect to the research, authorship, and/or publication of this article: MREB and MAT are shareholders of xMD Diagnostics, Inc. and receive royalty payments through the NIH Technology Transfer Program.
Funding
The author(s) disclosed receipt of the following financial support for the research, authorship, and/or publication of this article: NIH/NCI Innovative Molecular Analysis Technologies (IMAT), R33CA202811. We would also like to thank the Kahlert Foundation for their support.
Supplemental Material
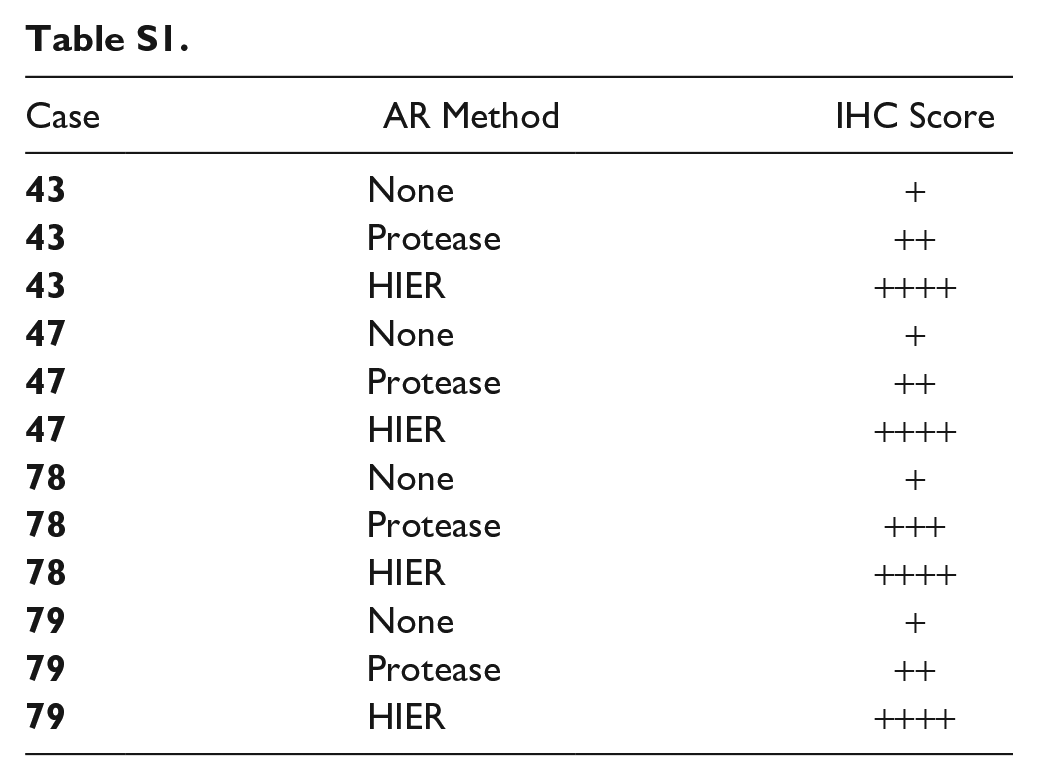
| Case | AR Method | IHC Score |
|---|---|---|
|
|
None | + |
|
|
Protease | ++ |
|
|
HIER | ++++ |
|
|
None | + |
|
|
Protease | ++ |
|
|
HIER | ++++ |
|
|
None | + |
|
|
Protease | +++ |
|
|
HIER | ++++ |
|
|
None | + |
|
|
Protease | ++ |
|
|
HIER | ++++ |
References
Supplementary Material
Please find the following supplemental material available below.
For Open Access articles published under a Creative Commons License, all supplemental material carries the same license as the article it is associated with.
For non-Open Access articles published, all supplemental material carries a non-exclusive license, and permission requests for re-use of supplemental material or any part of supplemental material shall be sent directly to the copyright owner as specified in the copyright notice associated with the article.