
Abstract
Microscopic examination of biopsied and resected prostatic specimens is the mainstay in the diagnosis of prostate cancer. However, conventional analysis of hematoxylin and eosin (H&E)-stained tissue is time-consuming and offers limited two-dimensional (2D) information. In the current study, we devised a method—termed
Introduction
Globally, prostate cancer (PCa) is the second most common cancer among men and the fifth leading cause of death. 1 Although prostate malignancies have a high chance of cure if they are detected at an early stage, diagnostic delays adversely affect prognosis.2 –4 Therefore, expedited and reliable diagnostic procedures—including rapid histological assessment of tissue specimens—have the potential to improve both turnaround time and clinical management. 5 Microscopic examination of biopsied and resected prostatic specimens is the mainstay in the diagnosis and grading of PCa. However, the traditional two-dimensional (2D) approach has a destructive nature during the slicing step, ultimately limiting the amount of information that can be extracted from valid tissue samples. For example, it is difficult to establish the architectural organization of a glandular structure (i.e., solid vs empty) on analyzing a 2D thin slide. Recent technical advances in tissue clearing process have furthered the exploration of three-dimensional (3D) relationships among cells6,7 to overcome the limitations of conventional hematoxylin and eosin (H&E) staining.
Although the Gleason grading system—commonly used to describe prostate adenocarcinoma growth patterns—is an established prognostic indicator,8 –12 several drawbacks have been reported. For example, sampling effects and significant interobserver variability13 –15 can have a serious negative impact on subsequent clinical management. 16 As 2D histological information for Gleason grading can lead to prognostic misclassification, optical tissue clearing and fluorescent imaging have been applied to extend conventional histological examination by a third dimension. 17 However, these approaches are labor-intensive and time-consuming. Alternative techniques, including micro-computed tomography (microCT), 18 are also limited by the exposure to high radiation doses.
In the current study, we devised a method—termed
Materials and Methods
Specimen Preparation
After obtaining ethical approval from the Institutional Review Board of the Taipei Veterans General Hospital (reference number: 2020-05-015AC), 15 cores (size: 15 × 2 × 2 mm) produced by slicing of radical fresh prostatectomy specimens (n=5) were analyzed. The study specimens were obtained from five consecutive patients referred for clinical evaluation during August 2020. Sampling was performed on the fourth tissue slice starting from the apex. The core size was selected to simulate the dimensions of a standard sample obtained by needle biopsy. Figure 1A illustrates the workflow used for specimen preparation. After a separate fixation step in 10% buffered formalin for 18−24 hr, a vibratome (VT1200; Leica Biosystems, Nußloch, Germany) was used to obtain serial slices from three 100-µm-thick tissue sections.
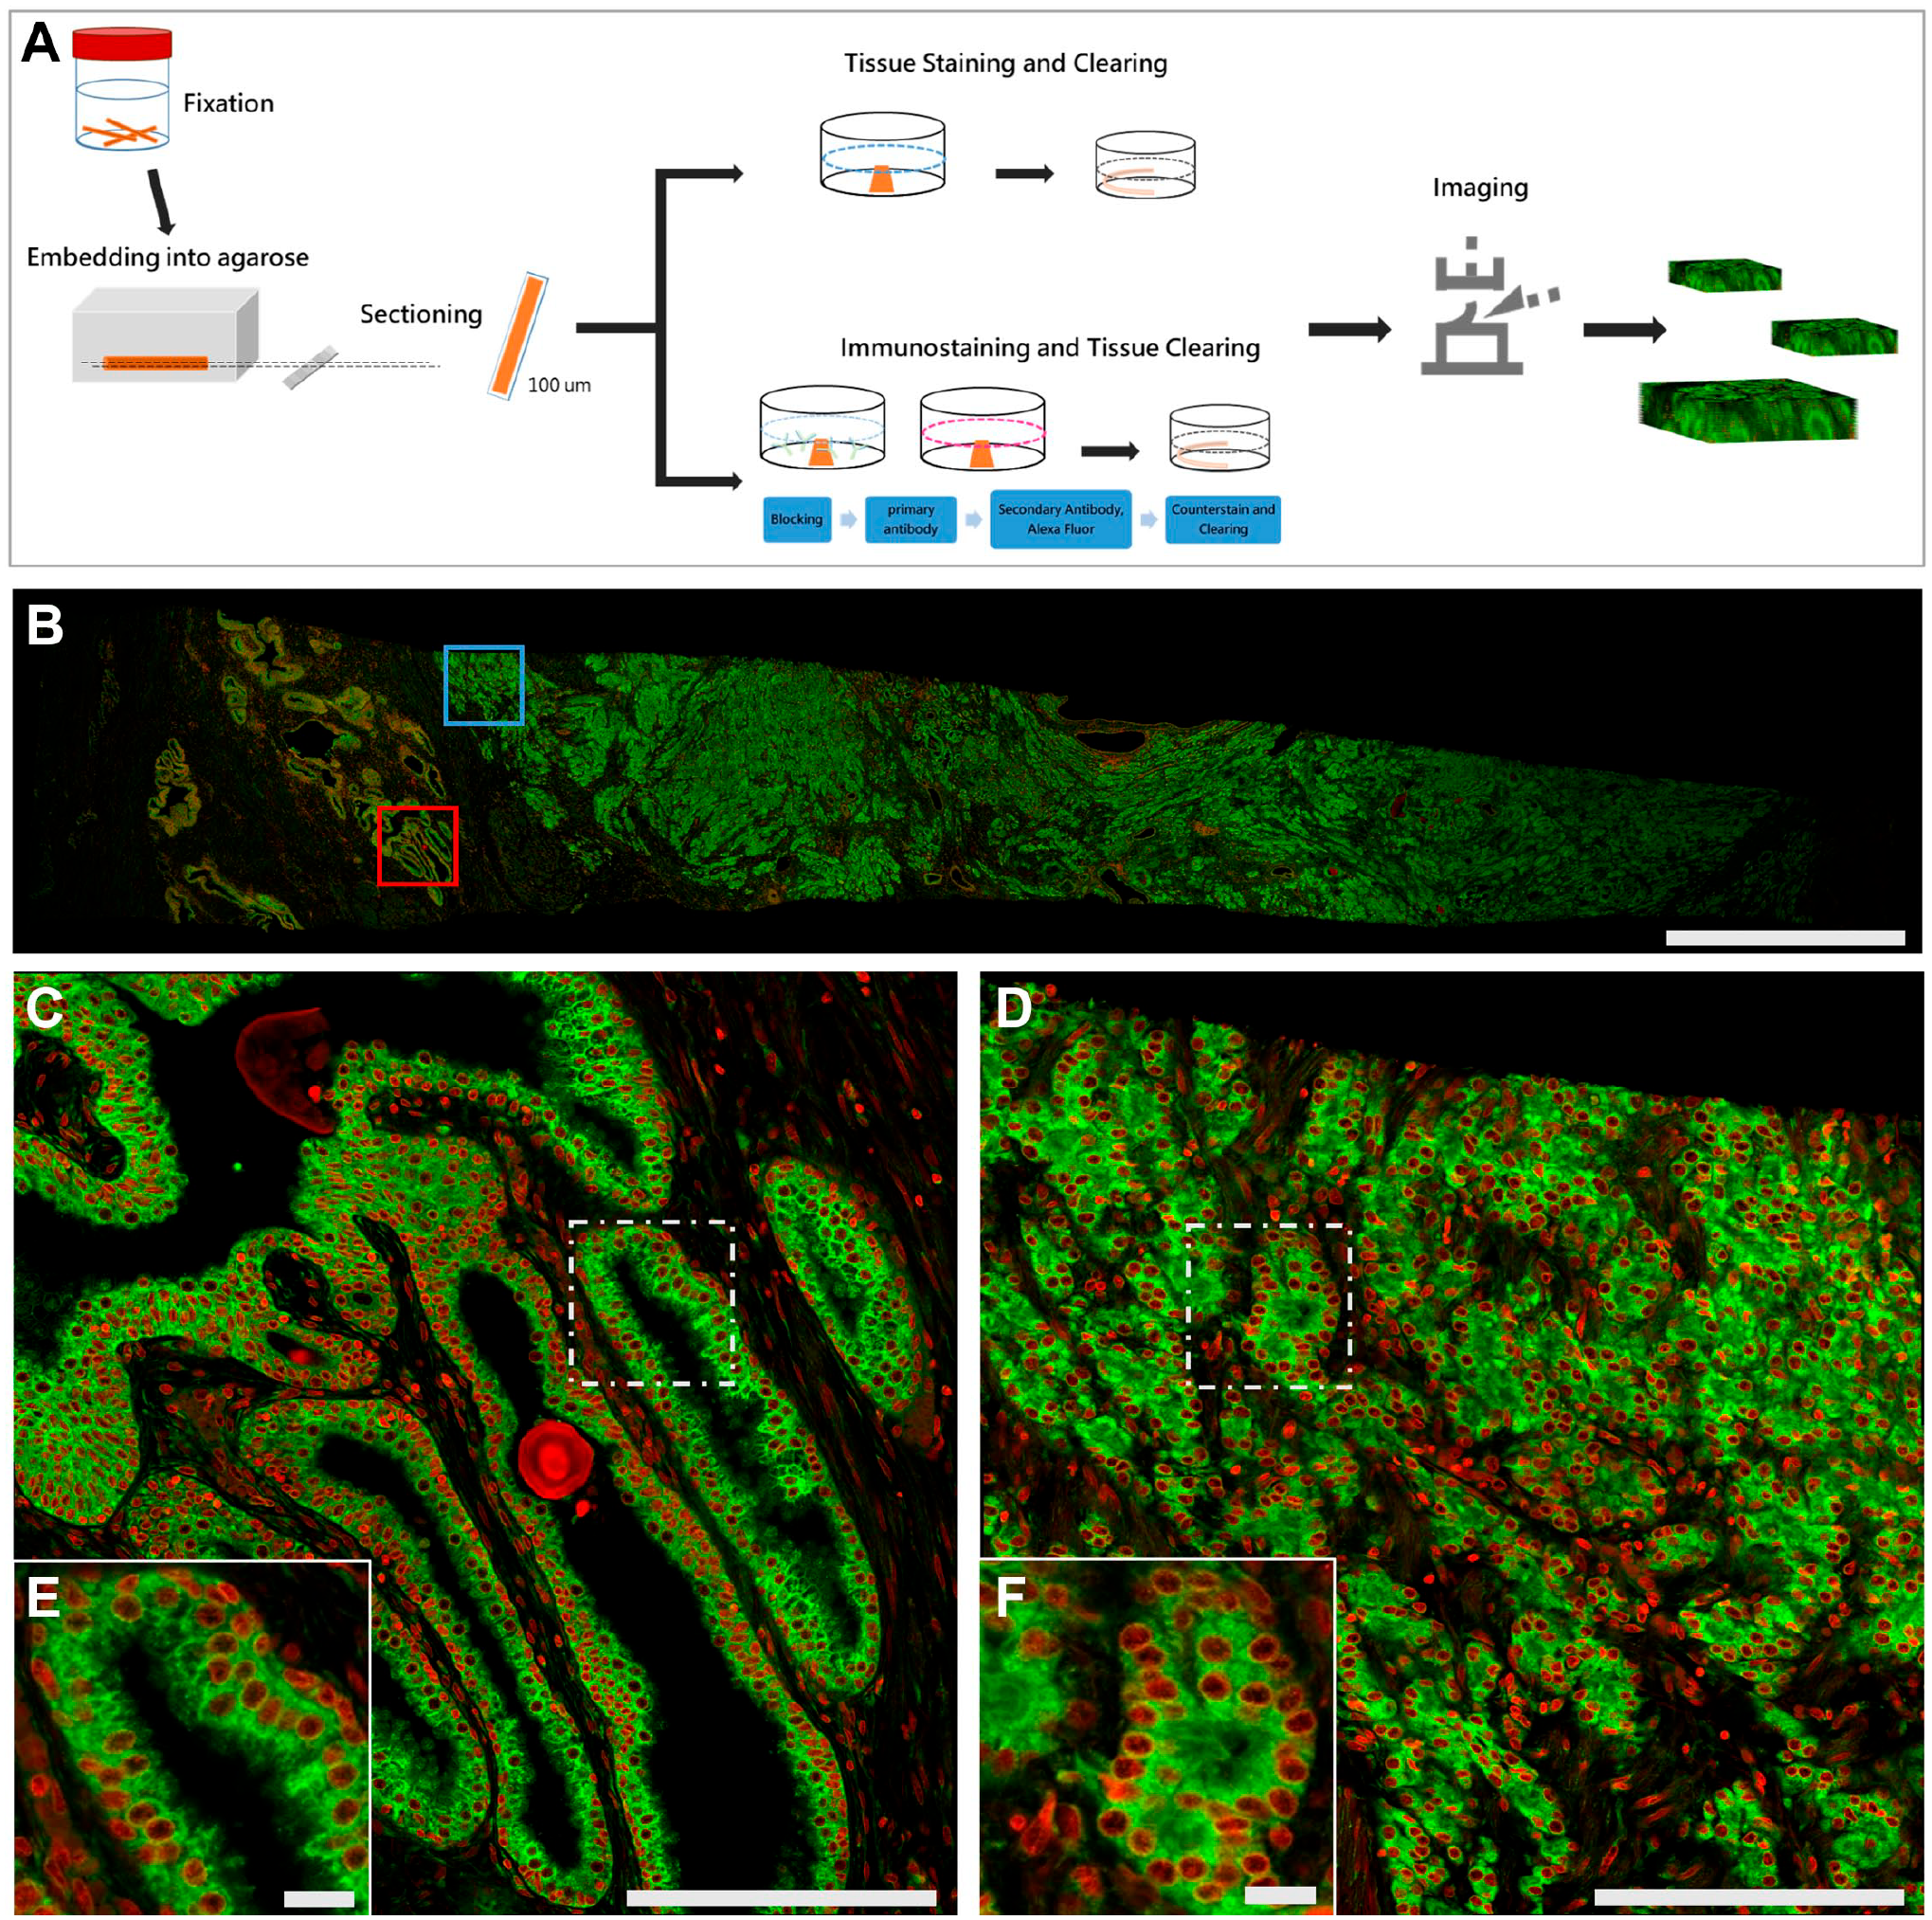
Workflow of the proSTAT method and illustrative examples of images obtained. (A) Procedural workflow from sample fixation to image output; (B) whole-slide image generated using the proSTAT approach; (C) histology-level zoomed-in image of the red-boxed area in Fig. 1B; (D) histology-level zoomed-in image of the blue-boxed area in Fig. 1B; (E) cellular-level zoomed-in image of the boxed area in Fig. 1C; (F) cellular-level zoomed-in image of the boxed area in Fig. 1D. Green: plasma membrane. Red: nuclei. Scale bar: (B) 2000 µm; (C) and (D) 200 µm; (E) and (F) 20 µm. Abbreviation: proSTAT,
Development of proSTAT Method and Immunohistochemistry
After sectioning, samples were washed in PBS buffer for 5 min and subsequently treated with Triton X-100 (2%) for 10 min. Cell membrane staining was performed by immersion into the carbocyanine dye DiD (20 µg/ml; Molecular Probes Inc., Eugene, OR) for 3 hr, followed by a short rinse in PBS. Stained sections were subsequently treated with a mixture containing a proprietary clearing reagent (JelloX Biotech Inc.; Hsinchu, Taiwan) and the nucleic acid dye SYTO-16 (5 mM; Molecular Probes Inc.) for 1 hr to render samples optically transparent while performing nuclear staining. The total time required for tissue staining—including the cell membrane and the nucleus—and clearing was approximately 4.5 hr (Table 1). The development of the clearing reagent has been previously described.6,19–21 While performing immunofluorescence staining within the proSTAT workflow, the selected 100-µm-thick tissue section was subjected to a blocking step after being treated with Triton X-100 (2%) for 10 min. Tissue sections were protected against nonspecific antibody binding by immersion in a reagent containing PBS, 10% normal donkey serum, 0.5% Triton X-100, and 0.02% NaN3 for 30 min. After blocking, sections were transferred onto 2 ml microcentrifuge tubes containing 300 µl of a primary monoclonal antibody specific for p63 (clone 4A4; 1:100 dilution; Sigma, St. Louis, MO) and centrifuged at 700 × g for 2 hr. Stained sections were washed with 1% Triton X-100 in PBS for 30 min at room temperature. Bound primary antibodies were detected via Alexa Fluor 561–labeled polyclonal anti-mouse secondary antibodies (dilution 1:300; 300 µl; Thermo Fisher, Waltham, MA, USA) with centrifugation at 700 × g for 2 hr in microcentrifuge tubes. After a washing step with PBS for 30 min, cell membrane–specific and nuclei-specific staining was performed by subsequent immersion into the carbocyanine dye DiD (20 µg/ml) for 1 hr and a mixture reagent containing the proprietary clearing reagent and SYTO-16 (5 mM) for one additional hour. Residual specimens were paraffin-embedded and cut into 4-µm-thick pieces and stained with H&E and immunohistochemistry (IHC) for comparative analysis with the proSTAT method. IHC was performed manually using the Novolink Polymer Detection System Kit (Leica Microsystems Inc.; Newcastle Upon Tyne, UK). After deparaffinization, heat-induced epitope retrieval was performed for 15 min at 90C–100C, in Celsius units, using an antigen retrieval buffer (Tris-EDTA, pH 9.0). Slices were subsequently left at room temperature for 20 min and rinsed with PBS for 5 min. Following treatment with peroxidase blocking and protein blocking reagent, slices were incubated in primary antibody overnight at 4C, in Celsius units. In addition, p63 IHC was performed with the same antibody (clone 4A4; 1:100 dilution) used for immunofluorescence staining in combination with the chromogen 3,3′-diaminobenzidine (DAB).
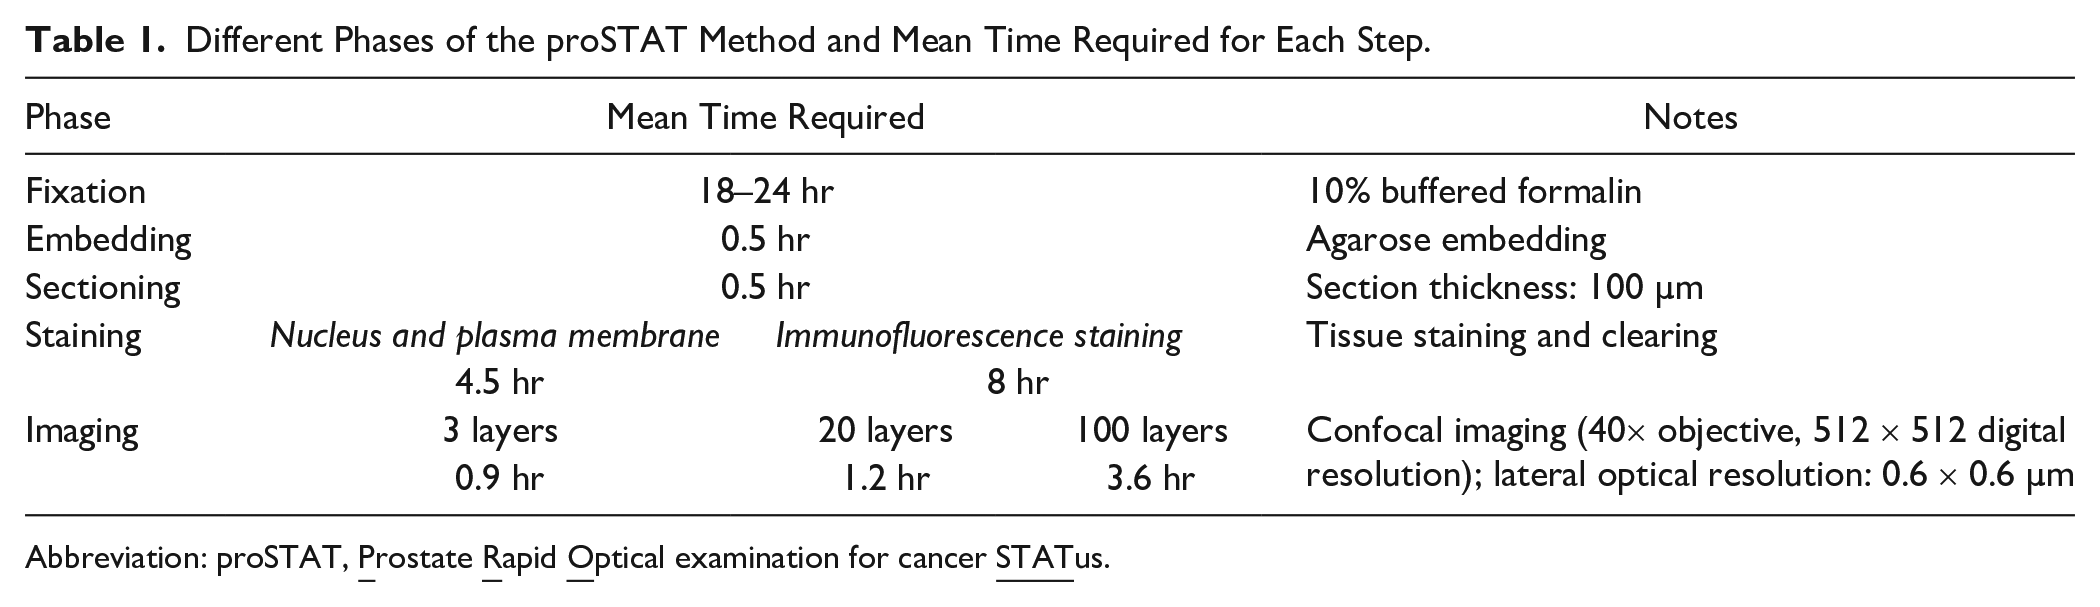
Different Phases of the proSTAT Method and Mean Time Required for Each Step.
Abbreviation: proSTAT,
Histopathology Imaging
Three-dimensional histopathology imaging was performed with a laser scanning confocal microscope (FV3000; Olympus, Tokyo, Japan) using a 40× air objective lens. Illustrative fluorescence images are shown in Fig. 1, panels B−F. The fluorescence images were acquired at a lateral resolution of 0.6 µm. The images were acquired using three different settings. First, three slices were imaged at 28-µm intervals to simulate the current 2D diagnosis practice (time required for imaging one specimen: 0.9 hr). Second, 20 slices were imaged at 5-µm intervals to mimic the thickness of thin slices used for H&E stains (time required: 1.2 hr). Finally, 100 slices were imaged at 1-µm intervals for 3D reconstruction (time required: 3.6 hr). Two-dimensional histopathology images of 4-µm-thick sections collected from the top of the residual specimens were used for quality control of the 3D reconstruction; this was motivated by their location in proximity to the 100-µm-thick sections. These images were obtained using a whole-slide imaging scanner (Aperio AT2; Leica Biosystems) with the same lateral resolution applied for 3D imaging.
Image Processing
Selected confocal images were processed and reconstructed using ImageJ (NIH; Bethesda, MD) and the Avizo software package (version 9.1; FEI, Burlington, MA). Images were initially processed with ImageJ to reduce background noise and subsequently segmented in Avizo using the “Label Field” function. The “Volume Rendering” and “Animation” functions in Avizo were used for 3D reconstruction/visualization and creation of Supplementary Videos, respectively.
Virtual H&E and IHC Transformation
Fluorescence images underwent virtual H&E and IHC processing to transform the color domain to make pathologists more familiar with fluorescence images; in addition, this process allowed comparison of the quality of fluorescence vs reference H&E and IHC images. First, we devised a color lookup table based on the RGB (red, green, and blue) model. The hex codes for hematoxylin, eosin, and DAB stains measured on conventional H&E and IHC images were set as #00008F, #E886F3, and #62281e, respectively. The background color was set to white (#FFFFFF). A 256-color map was subsequently obtained through linear interpolation and applied to map immunofluorescence channels to the corresponding colors—including virtual hematoxylin, eosin, and DAB stains. A blending matrix was also generated according to the energy ratio of each pixel within the two fluorescence channels. Subsequently, virtual colors were mixed at the ratio reported in the blending matrix to obtain the final virtual H&E and IHC images. The mixing ratio for virtual H&E images was 50% of the opacity level in each channel. Upon analysis of virtual IHC images, the opacity levels of virtual DAB and virtual hematoxylin for generating mixed virtual colors were adjusted to 70% and 30%, respectively.
Results
The proSTAT Method Allows Rapid Tissue Processing and Image Acquisition
The proSTAT method consists of the following six steps: fixation, embedding, sectioning (thickness per section: 100 µm), staining, clearing, and imaging (Fig. 1A). The fastest proSTAT protocol generated three optical levels with complete plasma membrane and nuclear counterstaining. The time elapsed from agarose embedding to imaging (6.4 hr) was substantially lower than that required for conventional H&E stains. An additional 3.5 hr was spent to complete the immunofluorescence staining (total time required for three optical levels: 9.9 hr). The acquisition of 20 and 100 optical levels added 0.3 hr and 2.7 hr to the workflow, respectively. Table 1 provides a summary of time required for each step. This approach allowing imaging multiple cores of prostate tissue simultaneously, mimicking a real-world scenario (i.e., ≥12 core biopsies per patient). Collectively, these data indicate that proSTAT can effectively provide rapid histological imaging. With an appropriate fixation process, 22 this method can allow obtaining a same-day diagnosis.
Tissue- and Cell-level Images Obtained With proSTAT Method Are Comparable to Those Obtained From Conventional H&E Stains
Fluorescence images of 15 cores of prostate tissue containing both benign and malignant elements were obtained. Table 2 and Supplementary Fig. 1 summarize image information and the histopathological features of each core. Conversion to virtual H&E was applied to obtain high-resolution images for diagnostic purposes. Areas of PCa were readily identifiable on virtual H&E images in a similar fashion compared with traditional H&E-stained tissue sections (Fig. 2). Histological images of PCa generated using the proSTAT method revealed an infiltrative pattern of gland crowding (Fig. 2G). Malignant cells showed enlarged nuclei with occasionally prominent nucleoli (Fig. 2H). Benign tissue elements were histologically characterized by a glandular architecture with irregular luminal borders (Fig. 2I) consisting of basal and luminal cells arranged to form a double layer (Fig. 2J). Collectively, these data suggest that the proSTAT method provides diagnostic-grade virtual H&E images that are comparable to those obtained from traditional H&E stains.
Pathological Data of Prostate Core Needle Biopsies.
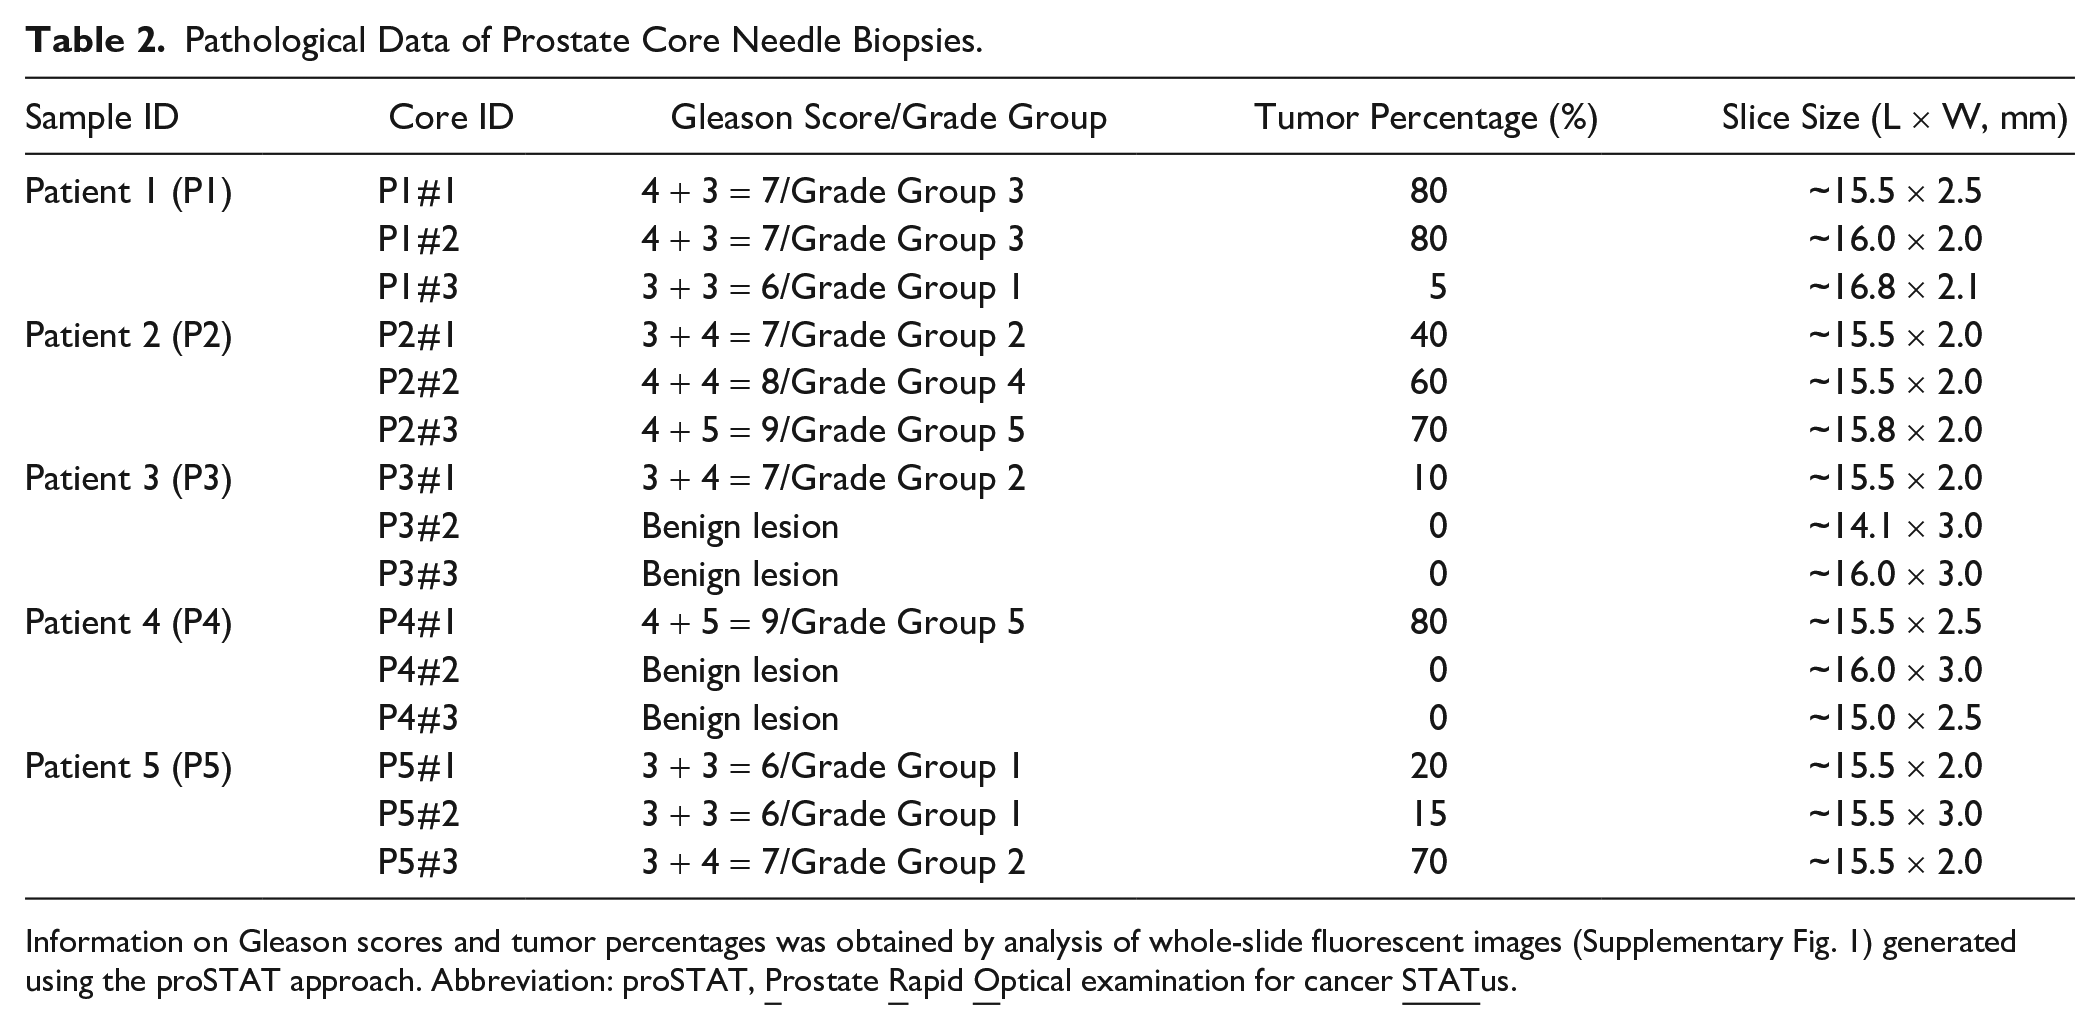
Information on Gleason scores and tumor percentages was obtained by analysis of whole-slide fluorescent images (Supplementary Fig. 1) generated using the proSTAT approach. Abbreviation: proSTAT,
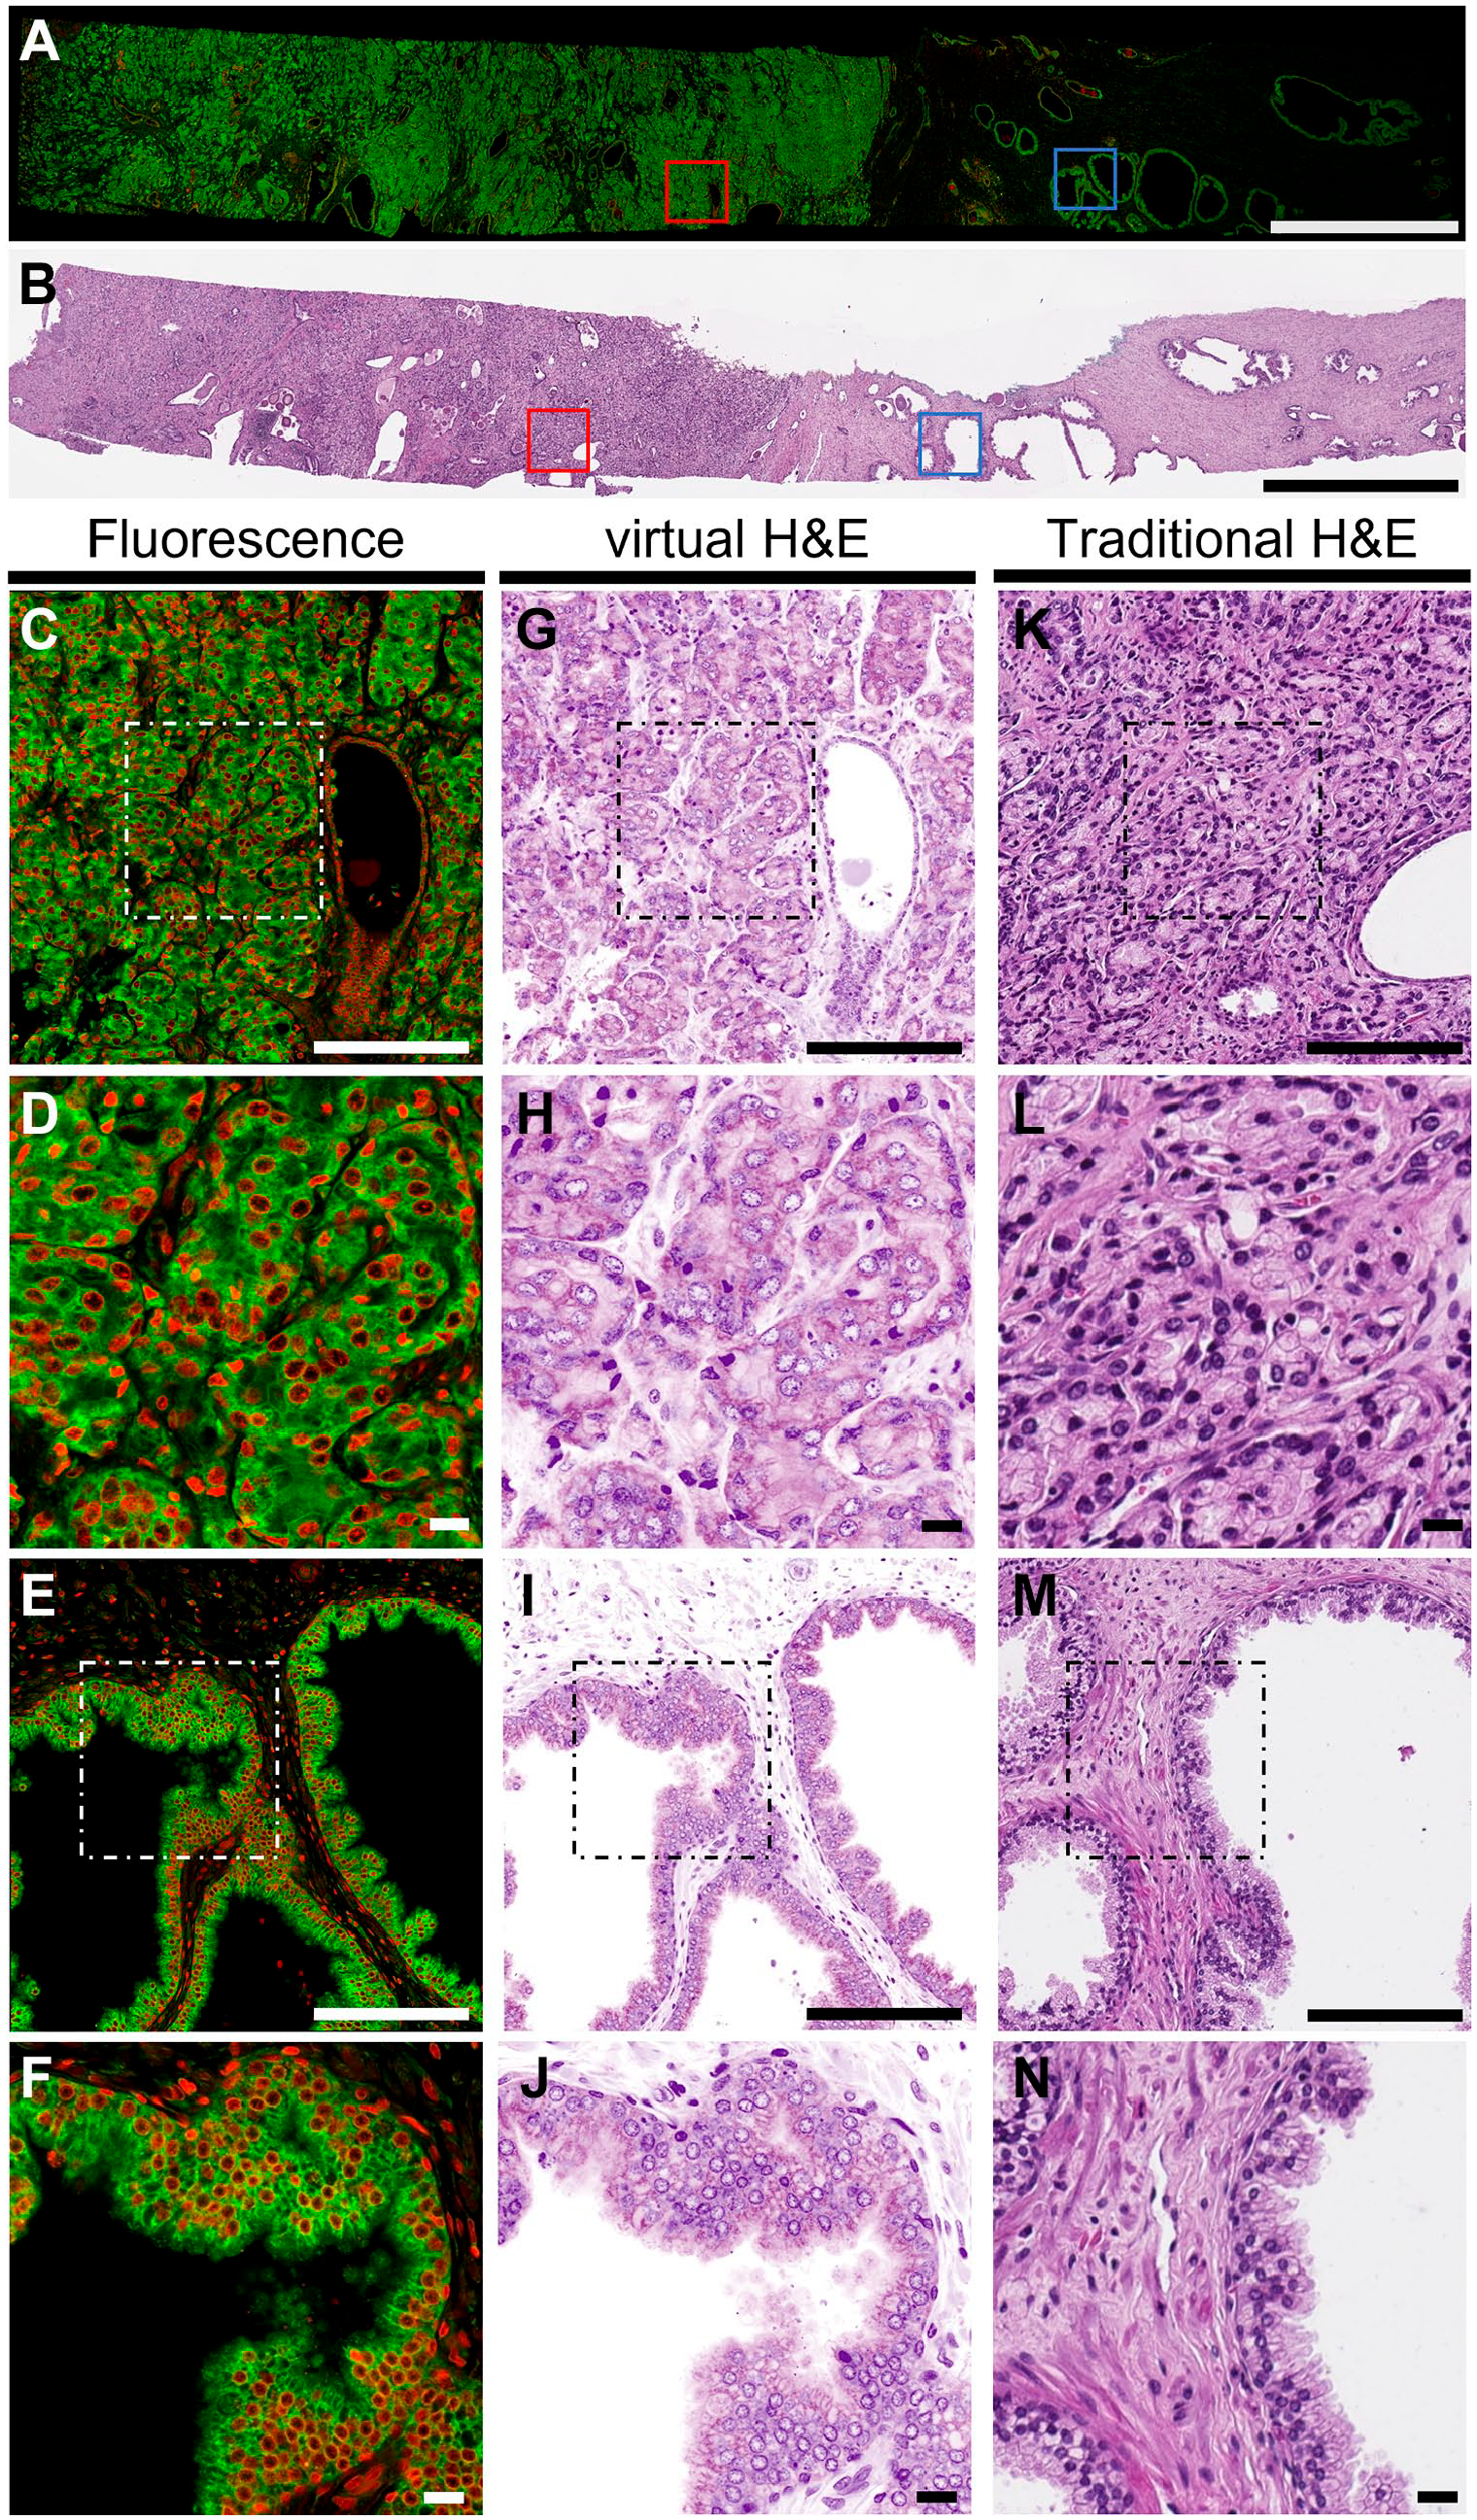
Comparison among proSTAT fluorescence images, virtual H&E images, and conventional H&E stains. (A) Whole-slide view of the proSTAT fluorescence image; (B) whole-slide view of the reference H&E image; (C) zoomed-in (10×) image of the red-boxed tumor area in Fig. 2A; (D) zoomed-in (25×) image of the white-boxed area in Fig. 2C; (E) zoomed-in (10×) image of the blue-boxed benign area in Fig. 2A; (F) zoomed-in (25×) image of the white-boxed area in Fig. 2E; (G–J) virtual H&E images of panels C–F; (K–N) reference H&E images of panels C–F obtained with conventional stains. Green: plasma membrane. Red: nuclei. Scale bar: (A) and (B) 2000 µm; (C), (G), (K), (E), (I), and (M) 200 µm; (D), (H), (L), (F), (J), and (N) 20 µm. Abbreviations: proSTAT,
Images Obtained With proSTAT Method Are Comparable to Those Obtained From Conventional Immunohistochemistry
Immunofluorescence images of p63 staining were generated through the proSTAT method (Fig. 3), subjected to virtual IHC transformation, and compared with traditional IHC stains. Virtual and traditional IHC images stained for p63—a marker that highlights an intact basal cell layer surrounding benign glands—were highly similar (Fig. 3). These observations indicate that the proSTAT method provides diagnostic-grade virtual images that are comparable to those obtained from traditional IHC stains.
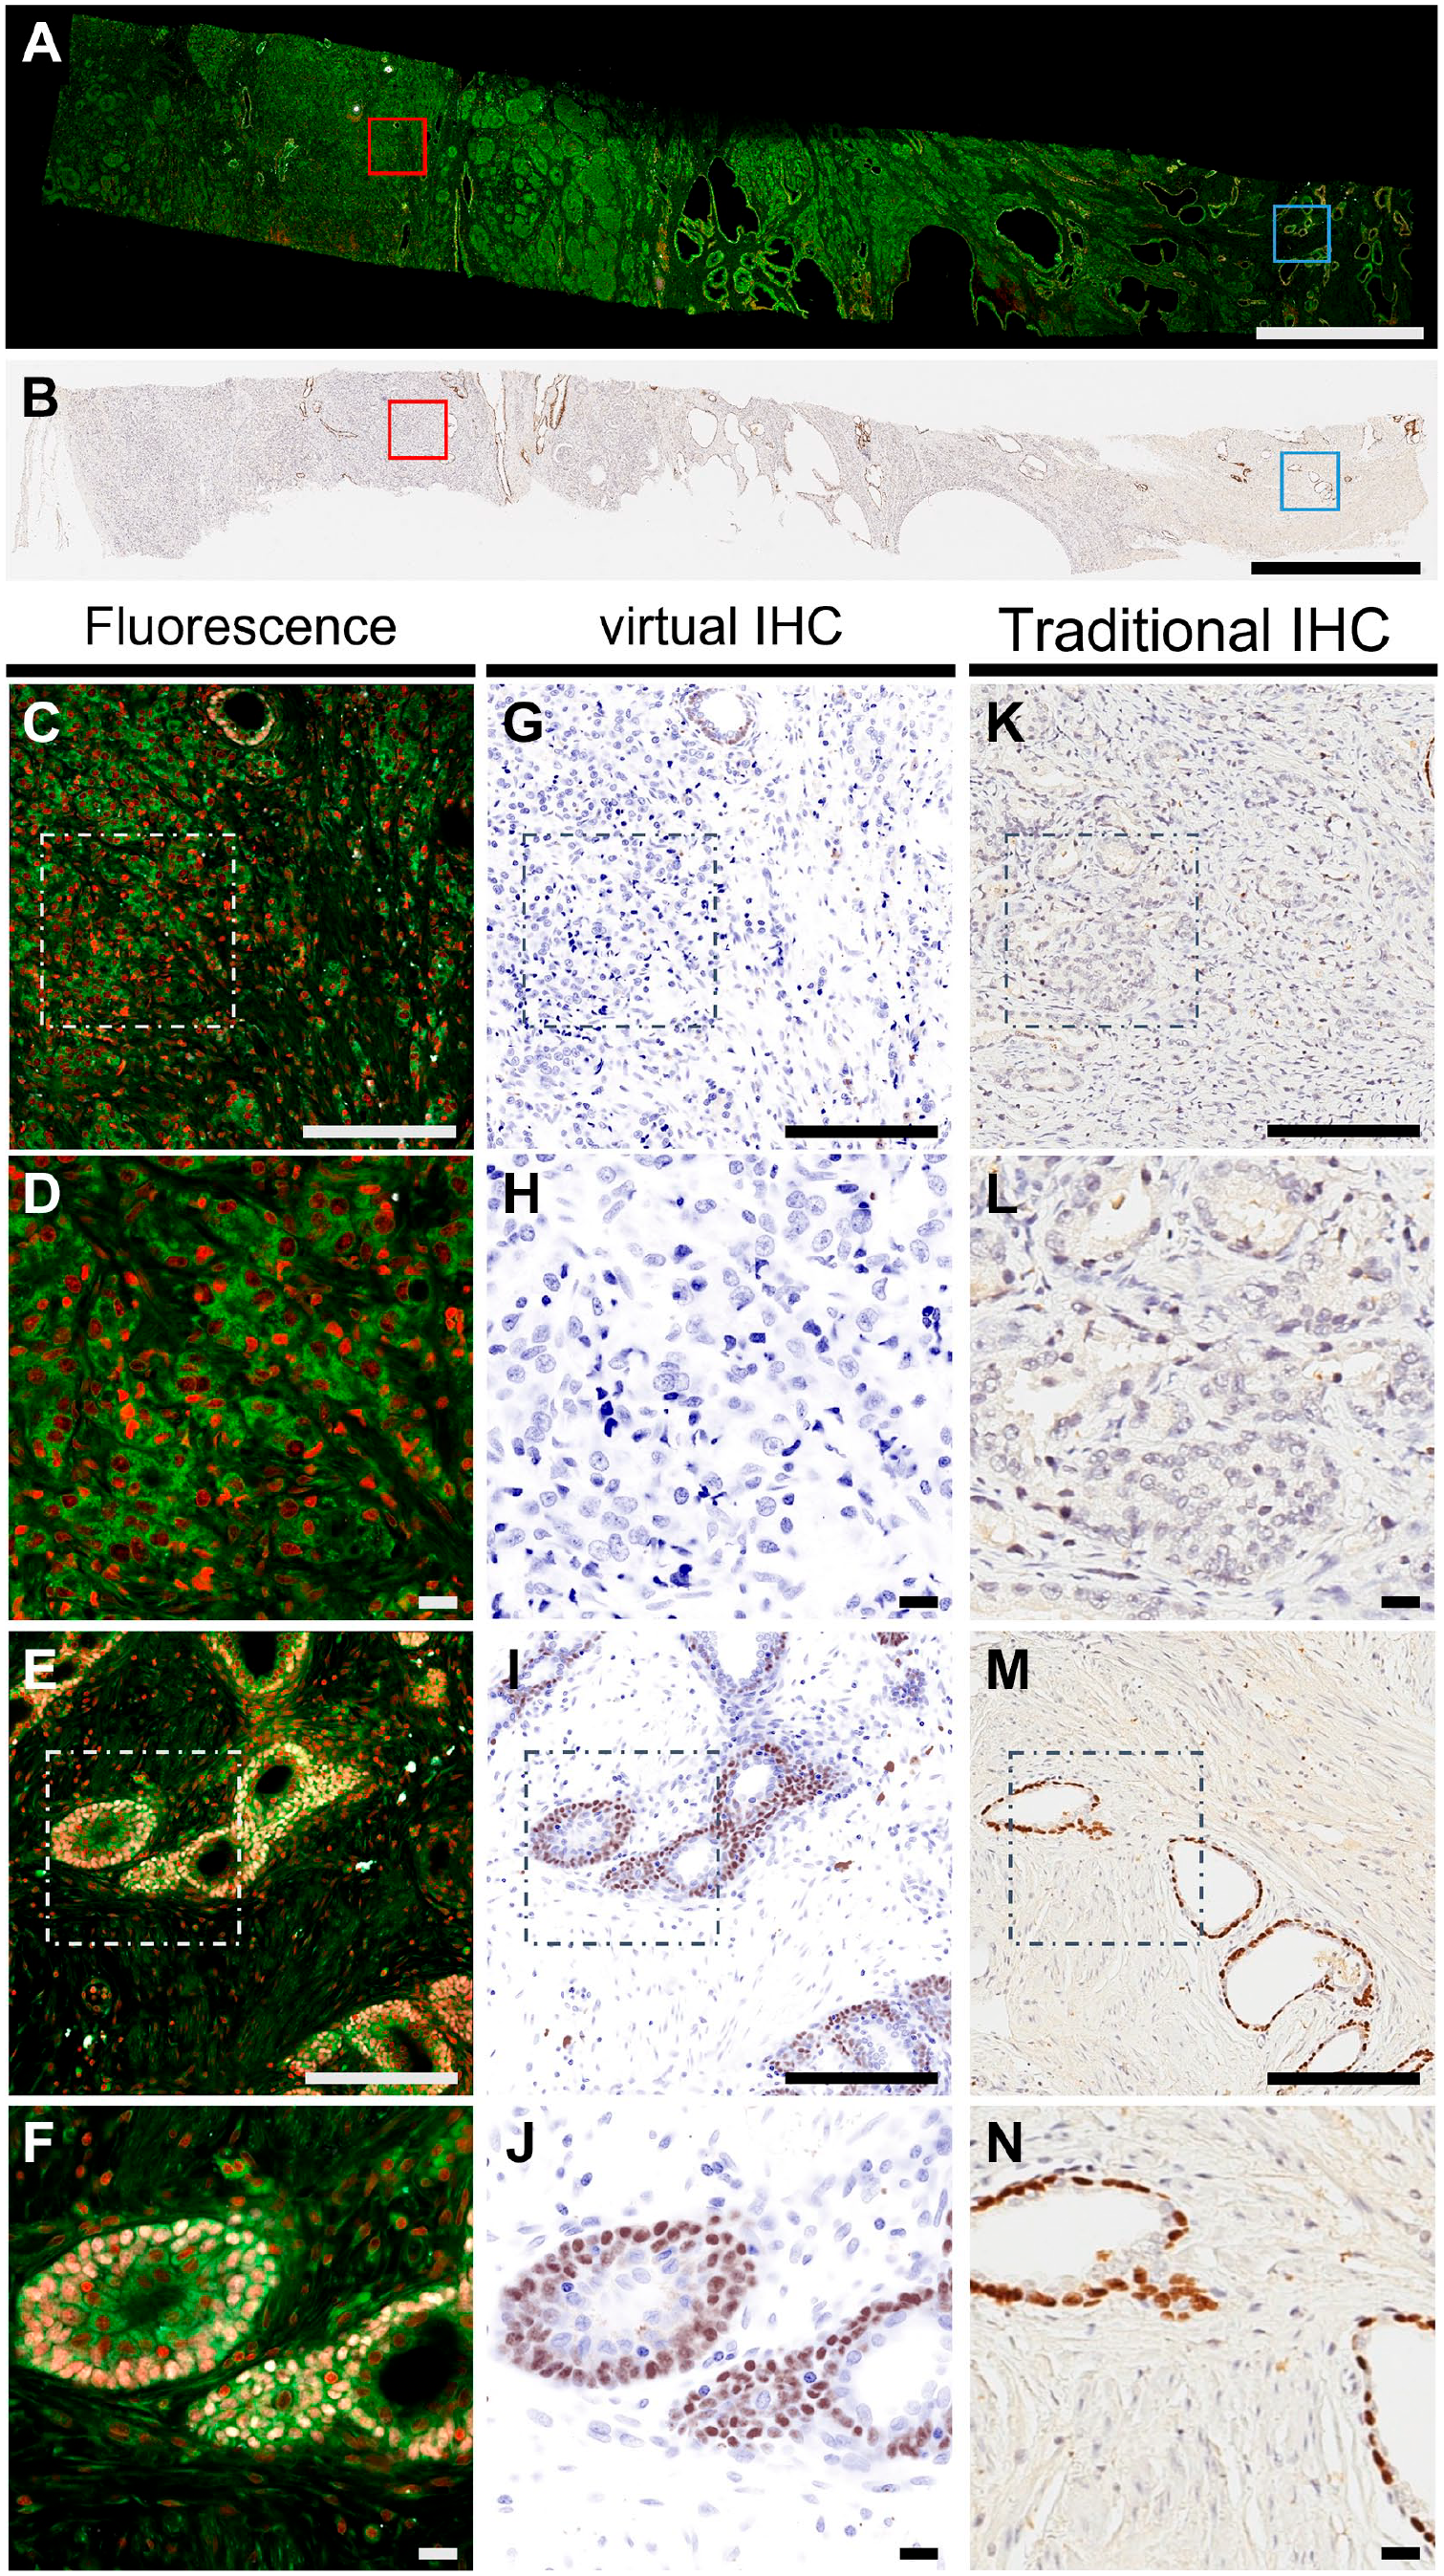
Comparison among proSTAT immunofluorescence images, virtual IHC images, and conventional IHC stains. (A) Whole-slide view of the proSTAT fluorescence image; (B) whole-slide view of the reference IHC image; (C) zoomed-in (10×) image of the red-boxed tumor area in Fig. 3A; (D) zoomed-in (25×) image of the white-boxed area in Fig. 3C, (E) zoomed-in (10×) image of the blue-boxed benign area in Fig. 3A, (F) zoomed-in (25×) image of the white-boxed area in Fig. 3E; (G–J) virtual IHC images of panels C–F; (K–N) reference IHC images of panels C–F obtained with conventional immunohistochemistry. Green: plasma membrane. Red: nuclei. White: p63. Scale bar: (A) and (B) 2000 µm; (C), (G), (K), (E), (I), and (M) 200 µm; (D), (H), (L), (F), (J), and (N) 20 µm. Abbreviations: proSTAT,
Reconstruction of Tumor Glands Through Multiple z-Stacks in proSTAT May Improve Gleason Score Reporting
We took advantage of the ability of the proSTAT method to generate multiple confocal images in the axial axis (interval: 5 µm) to reconstruct a single tumor gland through multiple z-stacks. Seemingly different growth patterns were observed at distinct optical levels (Fig. 4). A poorly formed gland was evident between 13 and 23 µm in depth (Fig. 4, panels A–C). However, a patent lumen was clearly identified starting from a depth of 28 µm downward (Fig. 4, panels D–I). These findings unequivocally supported a diagnosis of PCa of Gleason pattern 3. We also examined the Gleason score of this region of interest at different depths (Table 3). The score was found to vary from 4 + 3 to 3 + 4, indicating that a proportion of Gleason pattern 4 was present at each examined depth. Although the amount of this proportion changed according to depth, 3D analysis revealed that most glands at different depths showed a patent lumen. These results led to a change in the assignment of the Gleason score. Therefore, the reconstruction of tumor glands through multiple z-stacks in proSTAT is a valuable tool to reduce interobserver variability in Gleason score reporting.
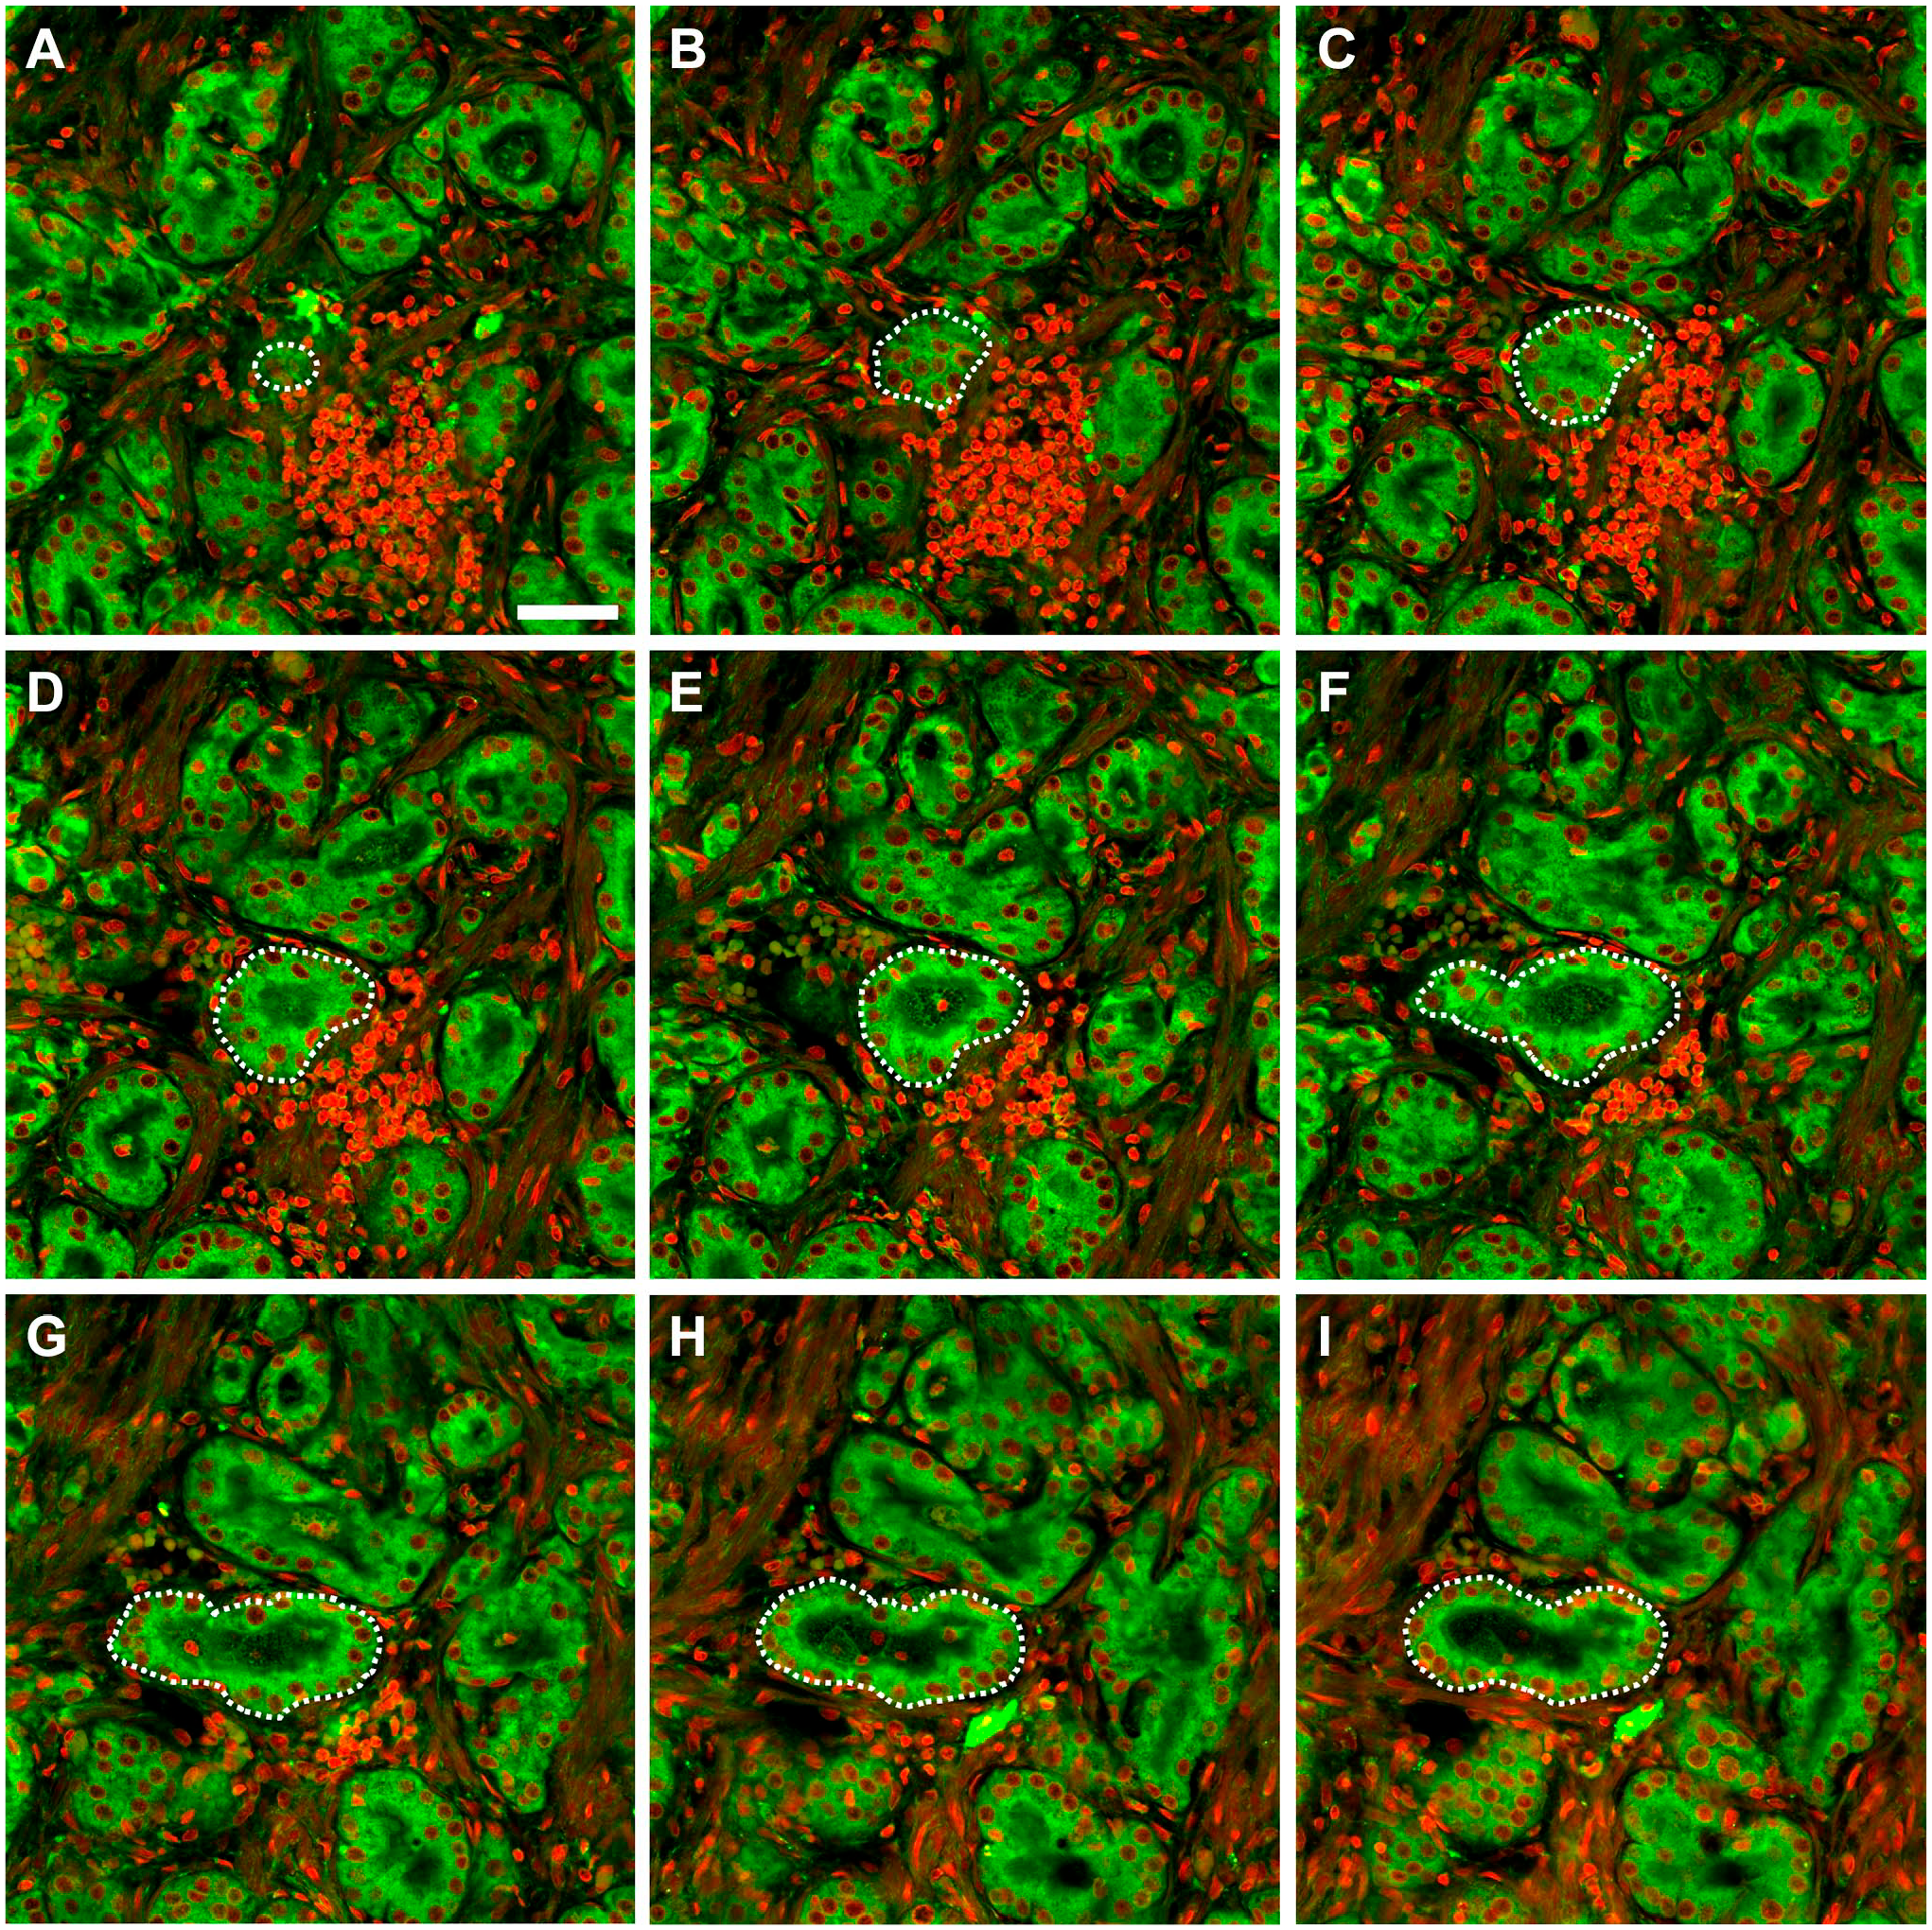
Prostate cancer sample sections at different depths (interval: 5 µm) along the axial axis. (A) Depth: 13 µm; (B) depth: 18 µm; (C) depth: 23 µm; (D) depth: 28 µm; (E) depth: 33 µm, (F) depth: 38 µm; (G) depth: 43 µm; (H) depth: 48 µm; (I) depth: 53 µm. Green: plasma membrane. Red: nuclei. Scale bar: 50 µm.
Changes of Growth Pattern Observed at Different Depths of Prostate Cancer Sample Sections.
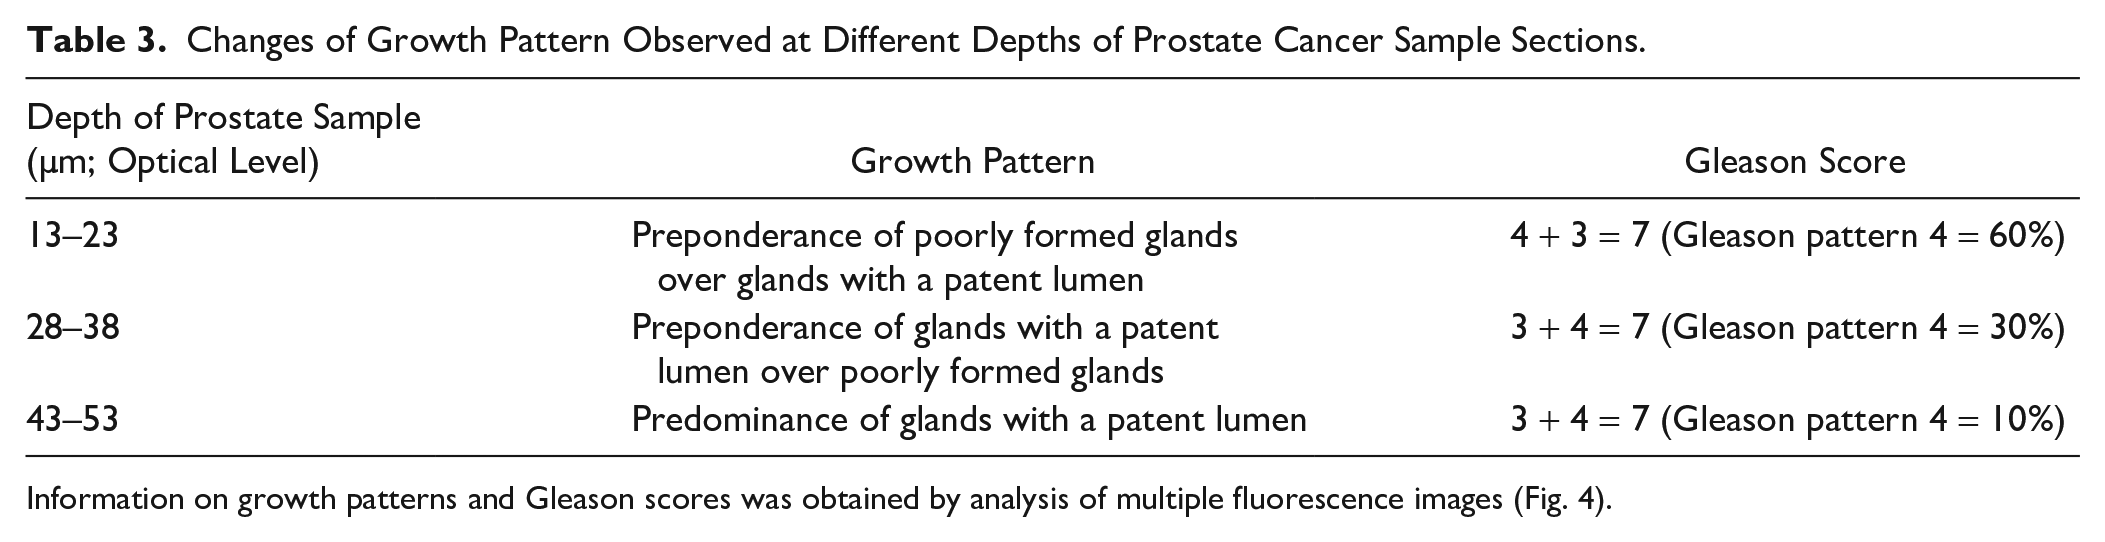
Information on growth patterns and Gleason scores was obtained by analysis of multiple fluorescence images (Fig. 4).
3D Rendering Offered by proSTAT Method Allows Capturing PCa Complexity
Using images obtained at 1-µm intervals, we were able to reconstruct the 3D structures formed by malignant prostate cells (Supplementary Videos 1 and 2). An illustrative example of the 3D architecture formed by invasive glands and the surrounding stromal cells is shown in Fig. 5A. In keeping with an existing description, 17 segmentation of cancer epithelial cells showed an interconnected tubular network with a complex burrow-like appearance (Fig. 5B and Supplementary Video 3). Changes in tube diameter across the network revealed 3D spatial heterogeneity where the lumen path may be partially or completely occluded. We further segmented a single gland to visualize its relationship with adjacent structures (Fig. 5C). Notably, we observed that a single Gleason pattern 3 gland dispersed in the stroma—a typical finding in traditional 2D H&E stains—was a segment of a patent duct connecting an intricate tubular network. These data indicate that 3D rendering offered by the proSTAT method allows capturing PCa complexity.
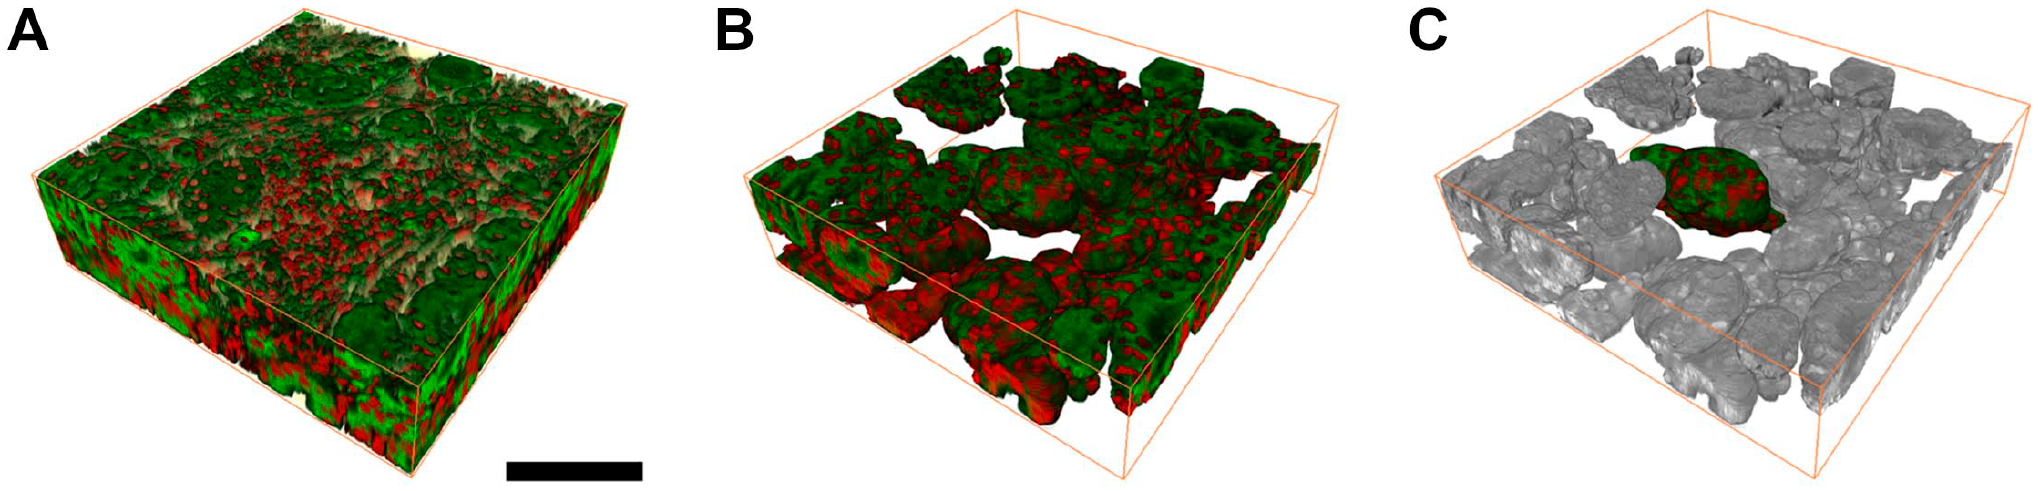
Images of prostate cancer after three-dimensional reconstruction. (A) Gross view of the tumor area; (B) epithelial segmentation of Fig. 5A; (C) single-gland segmentation of Fig. 5B. Green: plasma membrane. Red: nuclei. Scale bar: 100 µm.
Discussion
This proof-of-concept study demonstrates the potential utility of proSTAT for understanding how prostatic tissue architecture is organized from the tissue scale to the cellular level. Considerable advantages over traditional H&E stains were observed, particularly in terms of rapidity and ability to assign the Gleason score in an objective and unbiased manner. To overcome the limitations of confocal microscopy for high-resolution imaging of thick pieces of prostate tissue, the proSTAT approach combines hydrophilic tissue clearing, nuclear and plasma membrane fluorescence staining, and 3D segmentation. The resulting virtual images were found to be compatible with those obtained with standard histological methods while being less prone to misclassification of the Gleason score.
By taking advantage of fluorescence counterstaining, we were able to acquire strong fluorescence signals with an emission spectrum distinct from that achievable with immunofluorescence. Although several fluorescence microscopy techniques based on the use of nucleic acid staining dyes have been described for assessing prostate needle biopsies,23,24 the proSTAT workflow met the requirements for a complete analysis of the specimen with membrane staining and IHC. Specifically, the integration of a lipophilic tracer and p63 immunostaining was of great benefit not only for the distinction between malignant and benign lesions but also for avoiding alternative radiation-based techniques (e.g., microCT). 18
Remarkably, the proSTAT approach allowed imaging of prostate tissue specimens through multiple z-stacks without requiring physical sectioning. Therefore, we were able to obtain a 3D investigation of an entire volume without information loss that may lead to misdiagnosis (e.g., as a result of block trimming or sampling errors in the presence of small malignant foci). Currently, the histological features of atypical small acinar proliferation (ASAP) and atypical foci suspicious but not diagnostic of malignancy denote insufficient data to make an unequivocal diagnosis of PCa.19,20 Although deeper sections may not invariably avoid this problem if the area of interest is no longer available due to block trimming, the proSTAT method allowed glands to be traced out across several sections using multiple z-stacks. This can be achieved without destroying the tissue, thereby increasing the amount of data availability for the following immunostaining. On analyzing high-grade prostatic intraepithelial neoplasia with adjacent small atypical glands (PINATYP) using conventional H&E sections, it is difficult to ascertain whether small glands are outpouchings from high-grade prostatic intraepithelial neoplasia or whether they truly represent infiltrating adenocarcinoma. By tracing the boundaries between the epithelium and the stroma, the 3D method provided by proSTAT has the potential to offer a solution to this conundrum. Another issue that may be addressed by using proSTAT is clarifying whether the lesions observed in intraductal carcinoma represent a pure intraductal proliferation of tumor cells vs an adjacent invasive carcinoma that spreads within the nearby ducts.
Upon analysis of 3D reconstruction of an entire gland volume, pathologists are enabled to directly identify transitions through different growth patterns. This cannot be accomplished while relying solely on 2D histological information. Several approaches are possible to achieve this goal, including reconstruction by sequentially aligning consecutive sections.25 –27 However, it is a labor-intensive process impractical for daily routine diagnostics. Moreover, it is prone to misalignments and registration artifacts. Verhoef et al. 17 have recently developed a novel method to produce 3D images from formalin-fixed, paraffin-embedded prostate tissue sections using immunofluorescence staining, tissue clearing, and confocal laser scanning microscopy. However, the total time required to prepare a stained, tissue-cleared specimen was as long as 15–30 days, depending on the number of labeling biomarkers. Different from their technique, the proSTAT method allows a rapid staining and clearing protocol for fresh specimens, ultimately reducing the tissue processing time within a single day. In addition, fluorescence counterstaining can be applied to assess the spatial locations of cells within their local environment with a potential to distinguish prostatic intraepithelial neoplasia from small foci of PCa. To facilitate the implementation of digital pathology in the field of PCa, image digitalization in proSTAT is accomplished during data acquisition. Digital pathology has been gaining momentum throughout the COVID-19 pandemic, and continuing technological innovation is going on to boost transformation in this field. 28 However, digitizing an entire glass slide requires a complex multistep procedure. 29 The use of noninvasive imaging techniques in proSTAT means that the need for conventional 2D tissue slide preparation is not required. Therefore, the spatial and molecular information obtainable from the proSTAT method is potentially amenable to fulfill digitalization and automation. Some limitations of the proSTAT method merit comment, especially with respect to its translation into routine practice. In this regard, the equipment required for its implementation (e.g., confocal microscope, vibratome, and 3D image viewer) is not invariably present in diagnostic pathology laboratories outside of academic and research settings. Additional work—including comparison with the gold standard—is also necessary before routine application of the proposed technique. Our findings should be considered as hypothesis-generating data. Independent validation of the proSTAT method in large clinical cohorts, including an analysis of score variability and accuracy, will be paramount to confirm and expand our current findings.
In summary, this proof-of-concept study suggests that the spatial and molecular information obtained from the proSTAT approach may increase the amount of data availability for evaluating prostate tissue morphology and assigning Gleason scores. By not exhausting the sample, it can also reduce the risk of diagnostic misclassification—especially in the presence of limited tumor foci within small biopsies. Our approach is amenable to automation and—subject to independent validation in larger clinical cohorts—has the potential to find a wide spectrum of clinical and research applications.
Supplemental Material
sj-pdf-1-jhc-10.1369_00221554221116936 – Supplemental material for Rapid Histological Assessment of Prostate Specimens in the Three-dimensional Space by Hydrophilic Tissue Clearing and Confocal Microscopy
Supplemental material, sj-pdf-1-jhc-10.1369_00221554221116936 for Rapid Histological Assessment of Prostate Specimens in the Three-dimensional Space by Hydrophilic Tissue Clearing and Confocal Microscopy by Yu-Ching Peng, Yu-Chieh Lin, Yu-Ling Hung, Chien-Chung Fu, Margaret Dah-Tsyr Chang, Yen-Yin Lin and Teh-Ying Chou in Journal of Histochemistry & Cytochemistry
Footnotes
Acknowledgements
We thank Fang-Ting Chang for technical advice on 3D image reconstruction. We also wish to acknowledge Yu-Han Hsieh for providing valuable suggestions on immunofluorescence staining.
Competing Interests
The author(s) declared the following potential conflicts of interest with respect to the research, authorship, and/or publication of this article: Y.-C.L., Y.-L.H., M. D.-T.C., and Y.-Y.L. are employees of JelloX Biotech Inc. All other authors have no conflicts of interest to declare.
Author Contributions
Y-CP, Y-CL, and Y-LH designed the study. Y-CP and Y-LH collected the experimental data. Y-CP and Y-CL analyzed the histological and fluorescence image data and drafted the manuscript. T-YC, Y-YL, MD-TC and C-CF contributed to manuscript perfection. T-YC and Y-YL organized the progress of this investigation. All authors have read and approved the final manuscript.
Funding
The author(s) disclosed receipt of the following financial support for the research, authorship, and/or publication of this article: This work was financially supported by a grant (R1900500) from JelloX Biotech Inc. (Hsinchu, Taiwan) through an industry–academia partnership. This project also received funding from the Brain Research Center (Featured Areas Research Center Program within the Higher Education Sprout Project framework), Taiwan Ministry of Education (MOE), and the Taiwan Ministry of Science and Technology (MOST), and the “Cancer Progression Research Center, National Yang-Ming University” from The Featured Areas Research Center Program within the framework of the Higher Education Sprout Project by the Ministry of Education (MOE).
References
Supplementary Material
Please find the following supplemental material available below.
For Open Access articles published under a Creative Commons License, all supplemental material carries the same license as the article it is associated with.
For non-Open Access articles published, all supplemental material carries a non-exclusive license, and permission requests for re-use of supplemental material or any part of supplemental material shall be sent directly to the copyright owner as specified in the copyright notice associated with the article.