
Abstract
Multiplex immunofluorescence (mIF) is an effective technique for the maximal visualization of multiple target proteins in situ. This powerful tool is mainly limited by the spectral overlap of the currently available synthetic fluorescent dyes. The fluorescence excitation wavelengths ranging between 405 and 488 nm are rarely used in mIF imaging and serve as a logical additional slot for a fluorescent probe. In the present study, we demonstrate that the addition of 2,3,4,5,6-pentafluoroaniline to Atto 465 NHS ester, creating Atto 465-pentafluoroaniline (Atto 465-p), generates a bright nuclear stain in the violet-blue region of the visible spectrum. This allows the 405 nm excitation and emission, classically used for nuclear counterstains, to be used for the detection of another target protein. This increases the flexibility of the mIF panel and, with appropriate staining and microscopy, enables the quantitative analysis of at least six targets in one tissue section.
Keywords
Introduction
Recent advances in multiplex immunofluorescence (mIF) technology allow the simultaneous detection of multiple target proteins on a single tissue sample. This helps to provide an accurate characterization of different cellular types and states in the context of their spatial relationship within the local environment. Diagnosis, treatment, and a better understanding of complex diseases, such as cancer1–3 and neurogenerative diseases,4,5 are made possible via mIF. The versatility of this sensitive technique can be affected by many factors, including cross-reactivity of secondary antibodies and the spectral overlap of fluorophores. Several methods were recently developed to circumvent these limitations and achieve accurate mIF staining.6,7 However, some require expensive, specialized kits and equipment.7,8
The tyramide signal amplification (TSA) system is based on a horseradish peroxidase (HRP)-catalyzed deposition of fluorophore-tagged tyramide on the primary antibody target.9,10 This straightforward technique (1) is highly sensitive and specific, (2) enables detection of low-abundance proteins, (3) allows the use of same-species antibodies,11,12 and (4) is cost-effective. Although a variety of target species and fluorophores are commercially available, 12 it is rare for researchers to make use of the functional excitation wavelengths between 405 and 488 nm, even though commercially available dyes and cyan fluorescent proteins do fall within this range.
Atto 465 NHS ester, hereafter referred to as Atto 465, is structurally similar to proflavine. 13 During the course of our work using Atto 465 to label antibodies for mIF panels, we found nucleophilic substitution of 2,3,4,5,6-pentafluoroaniline generated a photostable and effective nuclear counterstain (Atto 465-p). We demonstrate that Atto 465-p stains nuclei and can be imaged in combination with and spectrally separated from both blue and green fluorophores when using a confocal microscope with tunable excitation and emission. We also demonstrate the utility of Atto 465-p by using it as a nuclear probe in a 6-plex IF assay and discussion of its possible use as a photoconvertible fluorophore.
Materials and Methods
Animals
BALB/cJ female mice (8–12 weeks old) were purchased from The Jackson Laboratory (Bar Harbor, ME). All animal procedures were approved by the Institutional Animal Care and Use Committee of National Institute of Dental and Craniofacial Research under an approved animal protocol and were performed according to the guidelines of the institute.
Human Tissues
Human minor salivary gland, exocrine glands extracted from oral submucosa, and oral mucosa were obtained from healthy volunteers enrolled on registered, Institutional Review Board–approved protocol NCT03602599 in accordance with the Declaration of Helsinki. Formalin-fixed paraffin-embedded (FFPE) tonsils, kidney, and skin blocks were obtained from a commercial tissue bank. All tissues were fixed in formalin, embedded in paraffin, and serially cut into 5 µm thick sections onto charged slides. Human karyotype slides were donated from the National Human Genome Research Institute Cytogenetics and Microscopy Core.
Zinc and Formalin-Fixed Tissue Staining
Tissues from BALB/cJ mice and humans were harvested and fixed for 48 hr at room temperature in 10% neutral buffered formalin (Sigma-Aldrich; St. Louis, MO) or zinc-fixation buffer (pH 6.5–7), prepared as described. 14 Tissues were processed, embedded in paraffin, and serially cut at 5 µm thick sections. For staining, sections were deparaffinized in xylene substitute (Sigma-Aldrich), and rehydrated in a decreasing ethanol series. Tissues were then stained with Atto 465-p (4 µM), Hoechst 33342 (16.2 µM; Invitrogen, Eugene, OR), and/or ToPro-3-3 (1 µM; Thermo Fisher Scientific, Waltham, MA) for 10 min at room temperature, protected from light, followed by washes in phosphate-buffered saline (PBS; Corning, Manassas, VA).
Frozen Section Immunohistochemistry (IHC)
Mice lymph nodes were dissected, embedded in Optimum Cutting Temperature compound (Sakura; Torrance, CA), and flash-frozen in cooled 2-methylbutane (Sigma-Aldrich). Five µm thick cryosections were cut onto charged slides (cat. no. 22-042-929; Fisher Scientific, Hanover Park, IL) and stored at −80C until use. For staining, sections were air-dried, rehydrated in PBS, and fixed at −20C for 5 min in 1:1 mixture of methanol and acetone. After washing with PBS, tissues were stained with Atto 465-p (4 µM), Hoechst 33342 (16.2 µM), and/or ToPro-3-3, (1 µM) for 10 min at room temperature, protected from light, followed by serial washes with PBS.
Mouse Peritoneal Exudate Cell Staining
BALB/cJ mice were euthanized, and cells were collected by peritoneal lavage with 5 ml ice-cold DMEM medium (Gibco, Life Technologies; Grand Island, NY). Peritoneal exudate cells were centrifuged at 200 × g and 4C for 10 min. Total cell numbers were determined using an automated cell counter (Countess II FL; Thermo Fisher Scientific). Cells were plated onto eight-well chamber slides (Nunc; Rochester, NY) after resuspension in DMEM supplemented with 50 IU/ml penicillin G, 50 µg/ml streptomycin, and 10% fetal calf serum at a density of 1 × 10⁶ cells/ml. Cells were kept in an incubator at 37C and 5% CO2 for 3 hr, washed with Hank’s Balanced Salt Solution, and fixed in 4% paraformaldehyde (PFA) for 30 min at room temperature. After washing with PBS, cells were stained with Atto 465-p (4, 2, 1, or 0.5 µM), Hoechst 33342 (16.2 µM), and/or ToPro-3-3 (1 µM) for 10 min at room temperature, protected from light, followed by washes with PBS.
Atto 465—Crosslinking Reaction
Atto 465 [Sigma-Aldrich, PubChem Substance ID 329757879, purity ≥90% (HPLC)] was suspended in DMSO, aliquoted, and lyophilized. After suspension in 1% triethylamine DMSO, 2,3,4,5,6-pentafluoroaniline (Sigma-Aldrich) was added to the lyophilized dye in a 10% molar excess. The reaction was brought to a 16 mM concentration of Atto 465 and shaken at room temperature overnight on a vibrating plate protected from light. The reaction was brought up to a volume of 50 µl with DMSO, aliquoted, and stored at −20C.
Steady-state Absorption and Fluorescence Measurements
Absorption measurements were performed on a Nanophotometer N60 (Implen; Westlake Village, CA). Fluorescence emission spectra were measured on a SpectraMax i3 (Molecular Devices; San Jose, CA). The dye was diluted to a calculated concentration of 160 µM and a blank with equal moles of reactants (minus the dye) was used. Samples were excited at 430 nm and the fluorescent intensity was measured from 300 to 650 nm.
Photobleaching and Photoconversion
For photobleaching experiments, tissue sections were imaged using a Nikon A1R HD confocal microscope using a 40× Plan oil objective (NA 1.3) controlled by NIS Elements imaging software (Nikon Instruments Inc.; Melville, NY). Photobleaching was achieved through repetitive, continuous scanning for 2.66 hr using a 486 nm laser set at 60% power, where the pixel dwell time was 8.8 µsec (1.1 µsec dwell time and line averaging of 8). Laser energy varies between microscopes, so the microscope settings were converted into energy density to ensure results could be reproduced by other microscopes. The energy density was calculated by measuring the 486 nm laser output power in Watts (W) at the back focal plane of the objective using a photometer (Thorlabs Newton, NJ). Pixel dwell time (µsec/pixel) was converted and multiplied by Watts to generate the total amount of Joules (J) per pixel of each scan. We divided the area per pixel (µm2/pixel) to get the final energy density per scan (J/µm2). This was previously performed by Doyle et al. 15 To visualize the photoconversion process, 2 × 2 tile scans were captured around the photobleached area before, immediately after, and every 20-min for 12 hr using the 405 nm laser (2%) and 486 nm (3%) laser with the appropriate emission filters.
mIF Staining
mIF was performed as described previously 10 using TSA and repeated removal of sequentially applied antibodies (leaving the fluorochrome-labeled water insoluble tyramide behind) before the next staining. Briefly, FFPE tonsil specimens were deparaffinized with xylene substitute (Sigma-Aldrich) and rehydrated with decreasing concentrations of ethanol (100%, 95%, and 70% v/v; Sigma-Aldrich). Antigen retrieval in 10 mM citrate buffer (pH 6) was performed by placing the slides into an 800-watt household microwave and heating for 2.5 min at 70% power followed by 5 additional minutes at 30% power. Endogenous peroxidase (HRP) activity was blocked using Bloxall (Vector Labs; Burlingame, CA). Primary antibodies, appropriate HRP-conjugated secondary antibodies (R&D Systems, Minneapolis, MN), and tyramide-conjugated fluorophores (provided in Table 1) were serially added to tissue sections. Microwave treatment and blocking steps were performed after each cycle. Nuclei were counterstained with 4 µM Atto 465-p for 10 min at room temperature. Slides were mounted with coverslips using Fluoro-Gel (Electron Microscopy Sciences; Hatfield, PA).
List of Antibodies Used for mIF.
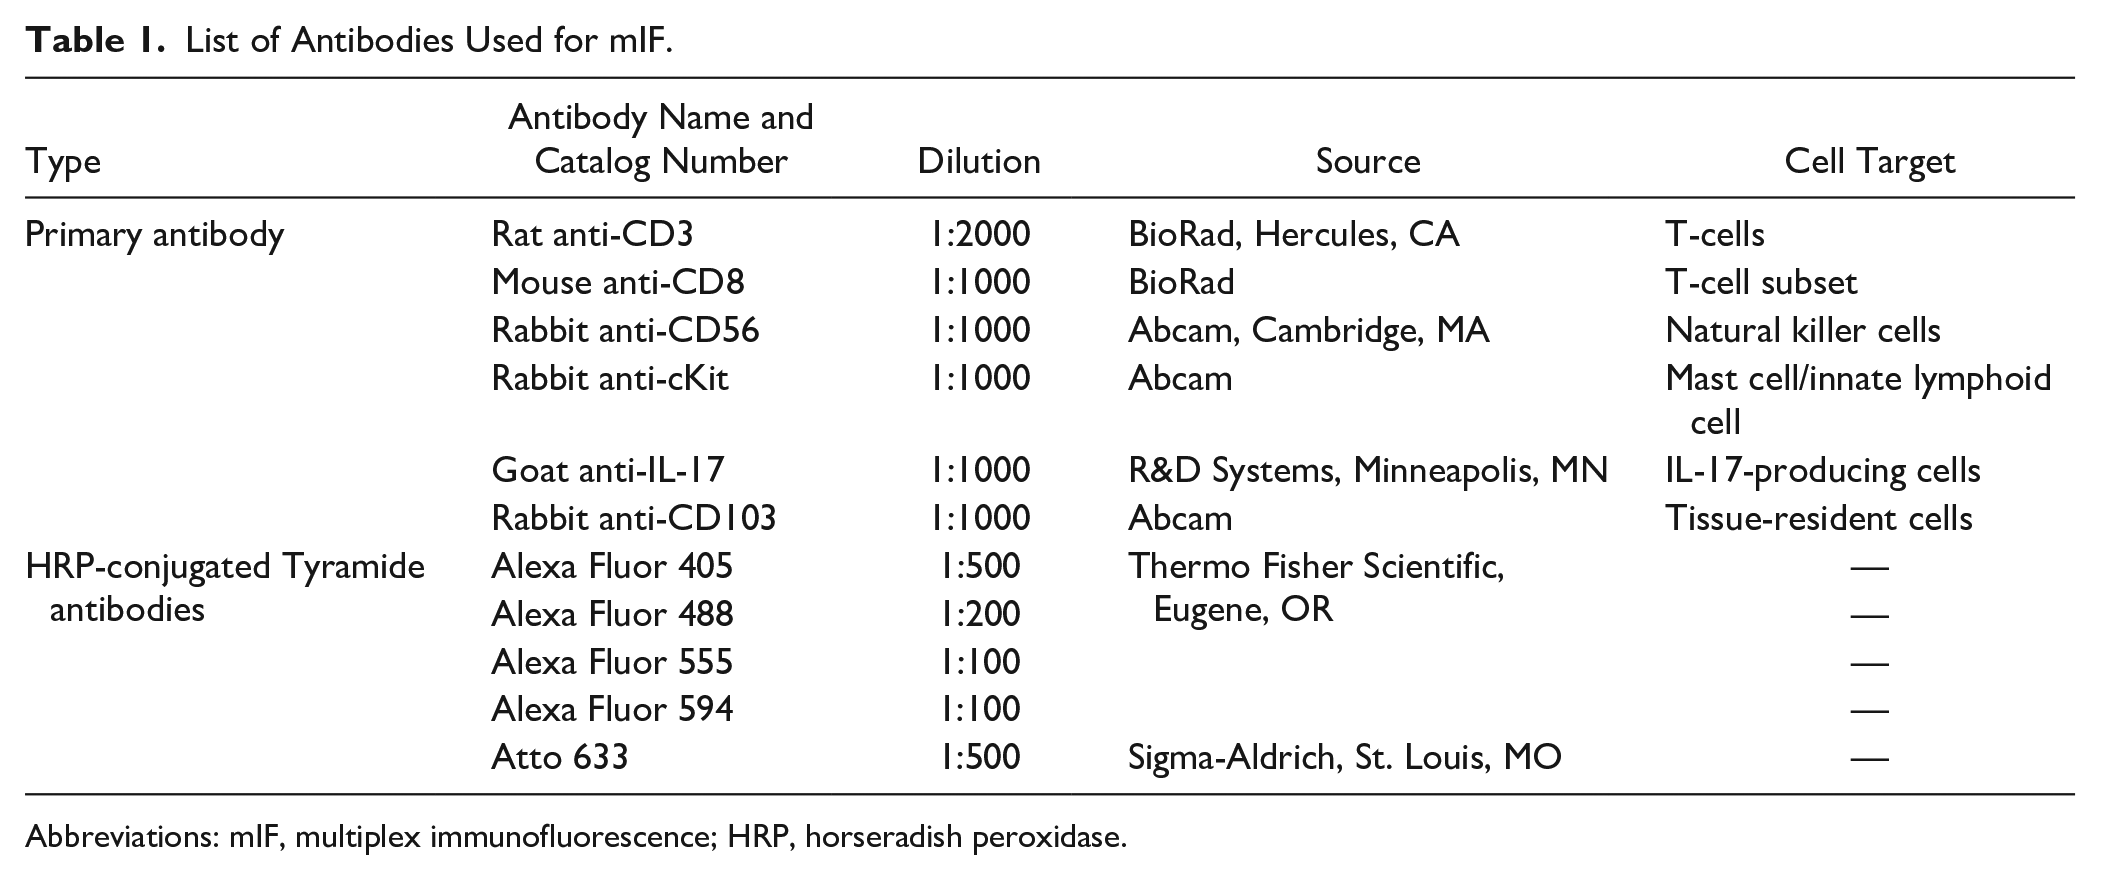
Abbreviations: mIF, multiplex immunofluorescence; HRP, horseradish peroxidase.
Image Acquisition and Analysis
For protein localization studies, tissues or cells were imaged using a Nikon A1R confocal microscope (fitted with a Plan Fluor 40×/1.30 oil objective) using NIS Elements imaging software (Nikon Instruments Inc.). The 405, 486, 561, and 640 nm lasers with standard emission filters were used.
The mIF staining was imaged with a Leica SP8 white light laser confocal microscope using a HC APO CS2 40× objective (NA 1.30) and was controlled by Leica Application Suite X (LAS X) software (Leica; Wetzlar, Germany). The SP8 uses a prism-based spectral detection system for emission collection. To set the emission, highly reflective barriers are used to narrow the emission band width. To accurately separate each fluorophore, the excitation (EX) and emission band width (EM) were set as follows for each fluorophore: AF 405: EX 405 nm, EM 415 to 440 nm; Atto 465: EX 470 nm, EM 480 to 503 nm; AF 488: EX 498 nm, EM 520 to 551 nm; AF 555: EX 555 nm, EM 565 to 580 nm; AF594: EX 594 nm, EM 604 to 625 nm; Atto 633: EX 647 nm, EM 583–657 nm. Sequential scanning was used for all mIF panels. Full microscope configuration is available upon request.
Images acquired from both Nikon and Leica microscopes were processed using the FIJI distribution of ImageJ (Bethesda, MD, USA). 16 Image colocalization was quantified using Volocity 3.6 software (Perkin Elmer; Waltham, MA). Threshold for each image was determined automatically according to the Costes et al. 17 method. Mander’s overlap coefficient was then created for each image, comparing Hoechst 33342 staining with both Atto 465 and ToPro-3-3.
Statistical Analysis
Statistical analysis was performed using GraphPad Prism 8.4.1 software (GraphPad). All values are expressed as mean ± standard error of the mean (SEM). Data were compared using repeated-measures one-way ANOVA. A p value < 0.05 is considered statistically significant.
Results
Synthesis and Characterization of Atto 465-p
In the present work, we tested Atto 465-p, a derivative of the fluorescent dye Atto 465, as a nuclear probe. A schematic representation of the nucleophilic substitution reaction of Atto 465 with 2,3,4,5,6-pentafluoroaniline is detailed in Fig. 1A. 18 Atto 465-p absorption (left side) and fluorescence spectra (right side) in PBS are depicted in Fig. 1B with an absorbance maximum of 455 nm and an extended fluorescence emission from 465 to beyond 600 nm.
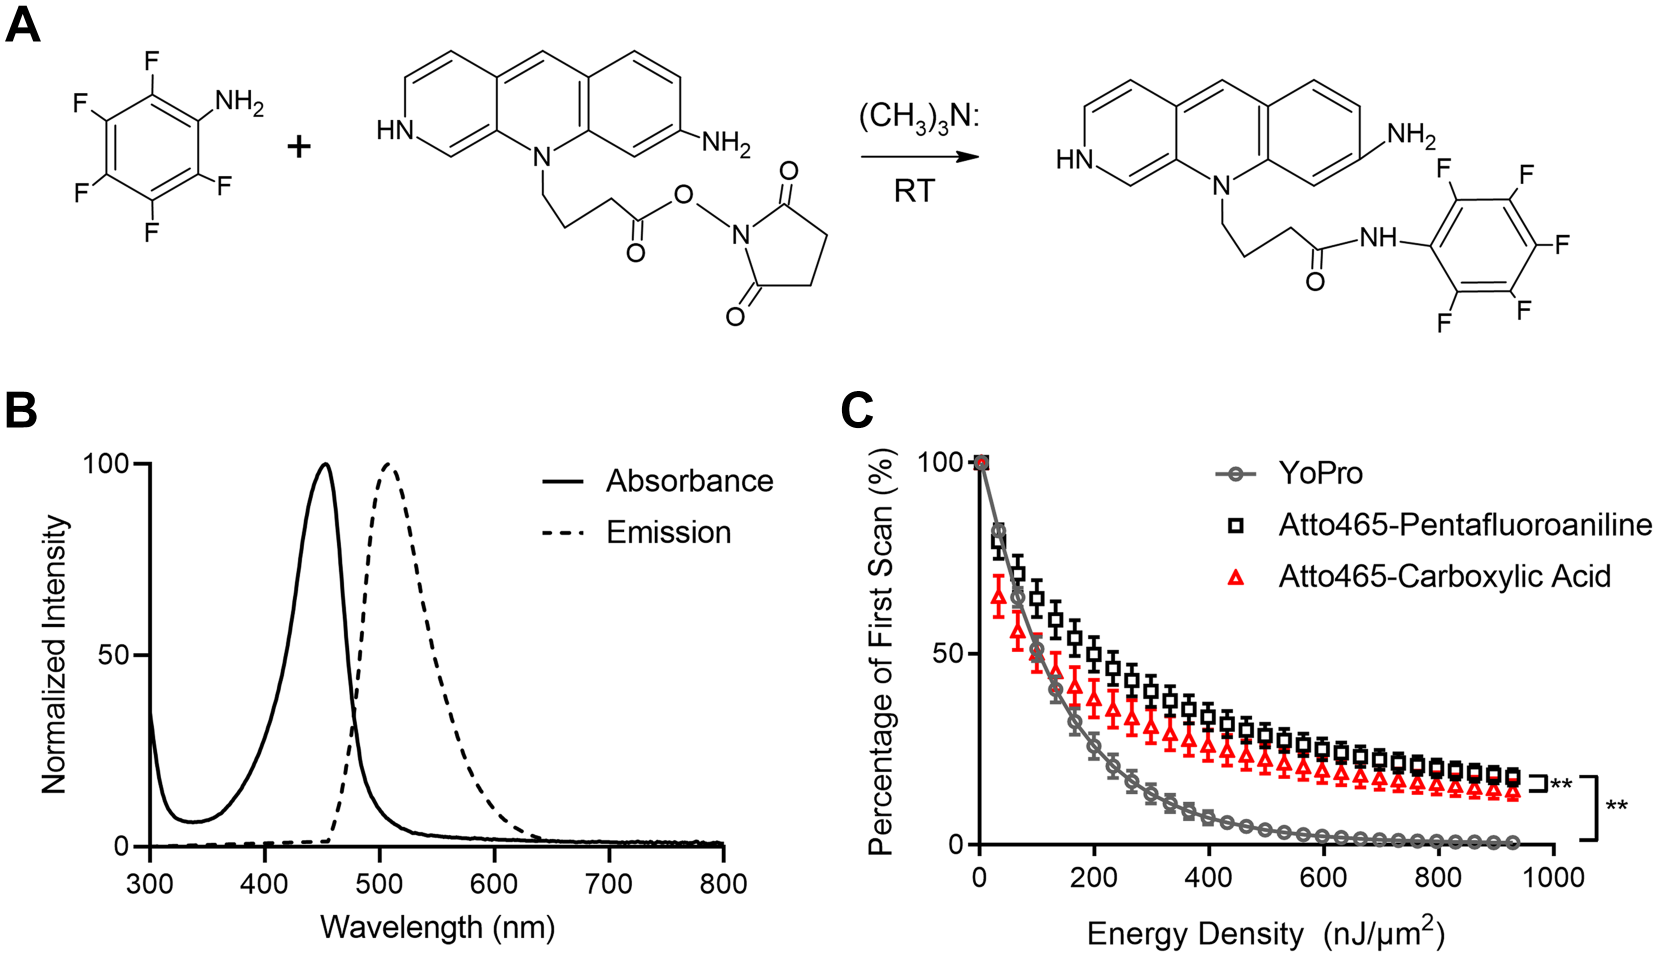
Characterization and photostability of Atto 465-p. (A) Scheme illustrating presumed chemical structure and proposed nucleophilic substitution reaction between Atto 465 NHS ester and 2,3,4,5,6-pentafluoroaniline to synthetize Atto 465-p. (B) Absorption (solid line) and fluorescence emission (dashed line) spectra of 8 µM Atto 465-p in phosphate-buffered saline peaking at 450 and 508 nm, respectively. (C) Photobleaching kinetics of YoPro-1, Atto 465-p, and Atto 465 upon continuous irradiation by 486 nm laser. **p<0.0001. RT, room temperature.
To compare the photostability of Atto 465 free dye (carboxylic acid) and Atto 465-p with the stable green nuclear dye YoPro-1, 19 human FFPE tonsil sections were stained. Under continuous excitation at 486 nm, Atto 465-p demonstrated slower bleaching kinetics compared with YoPro-1 and Atto 465 free dye (carboxylic acid) (Fig. 1C) demonstrating that Atto 465-p has greater photostability. Further characterization revealed that with exposure to high energy density light, Atto 465-p undergoes photoconversion and emits blue light between 415 and 445 nm in a dosage-dependent manner when excited by a 405 nm laser (Fig. 2A and B). Over several hours, Atto 465-p regains green fluorescence emission (480–511 nm) while still maintaining the blue, fluorescent emission (Fig. 2C and D). However, Atto 465-p still shows distinct staining of nuclei (Fig. 2E).
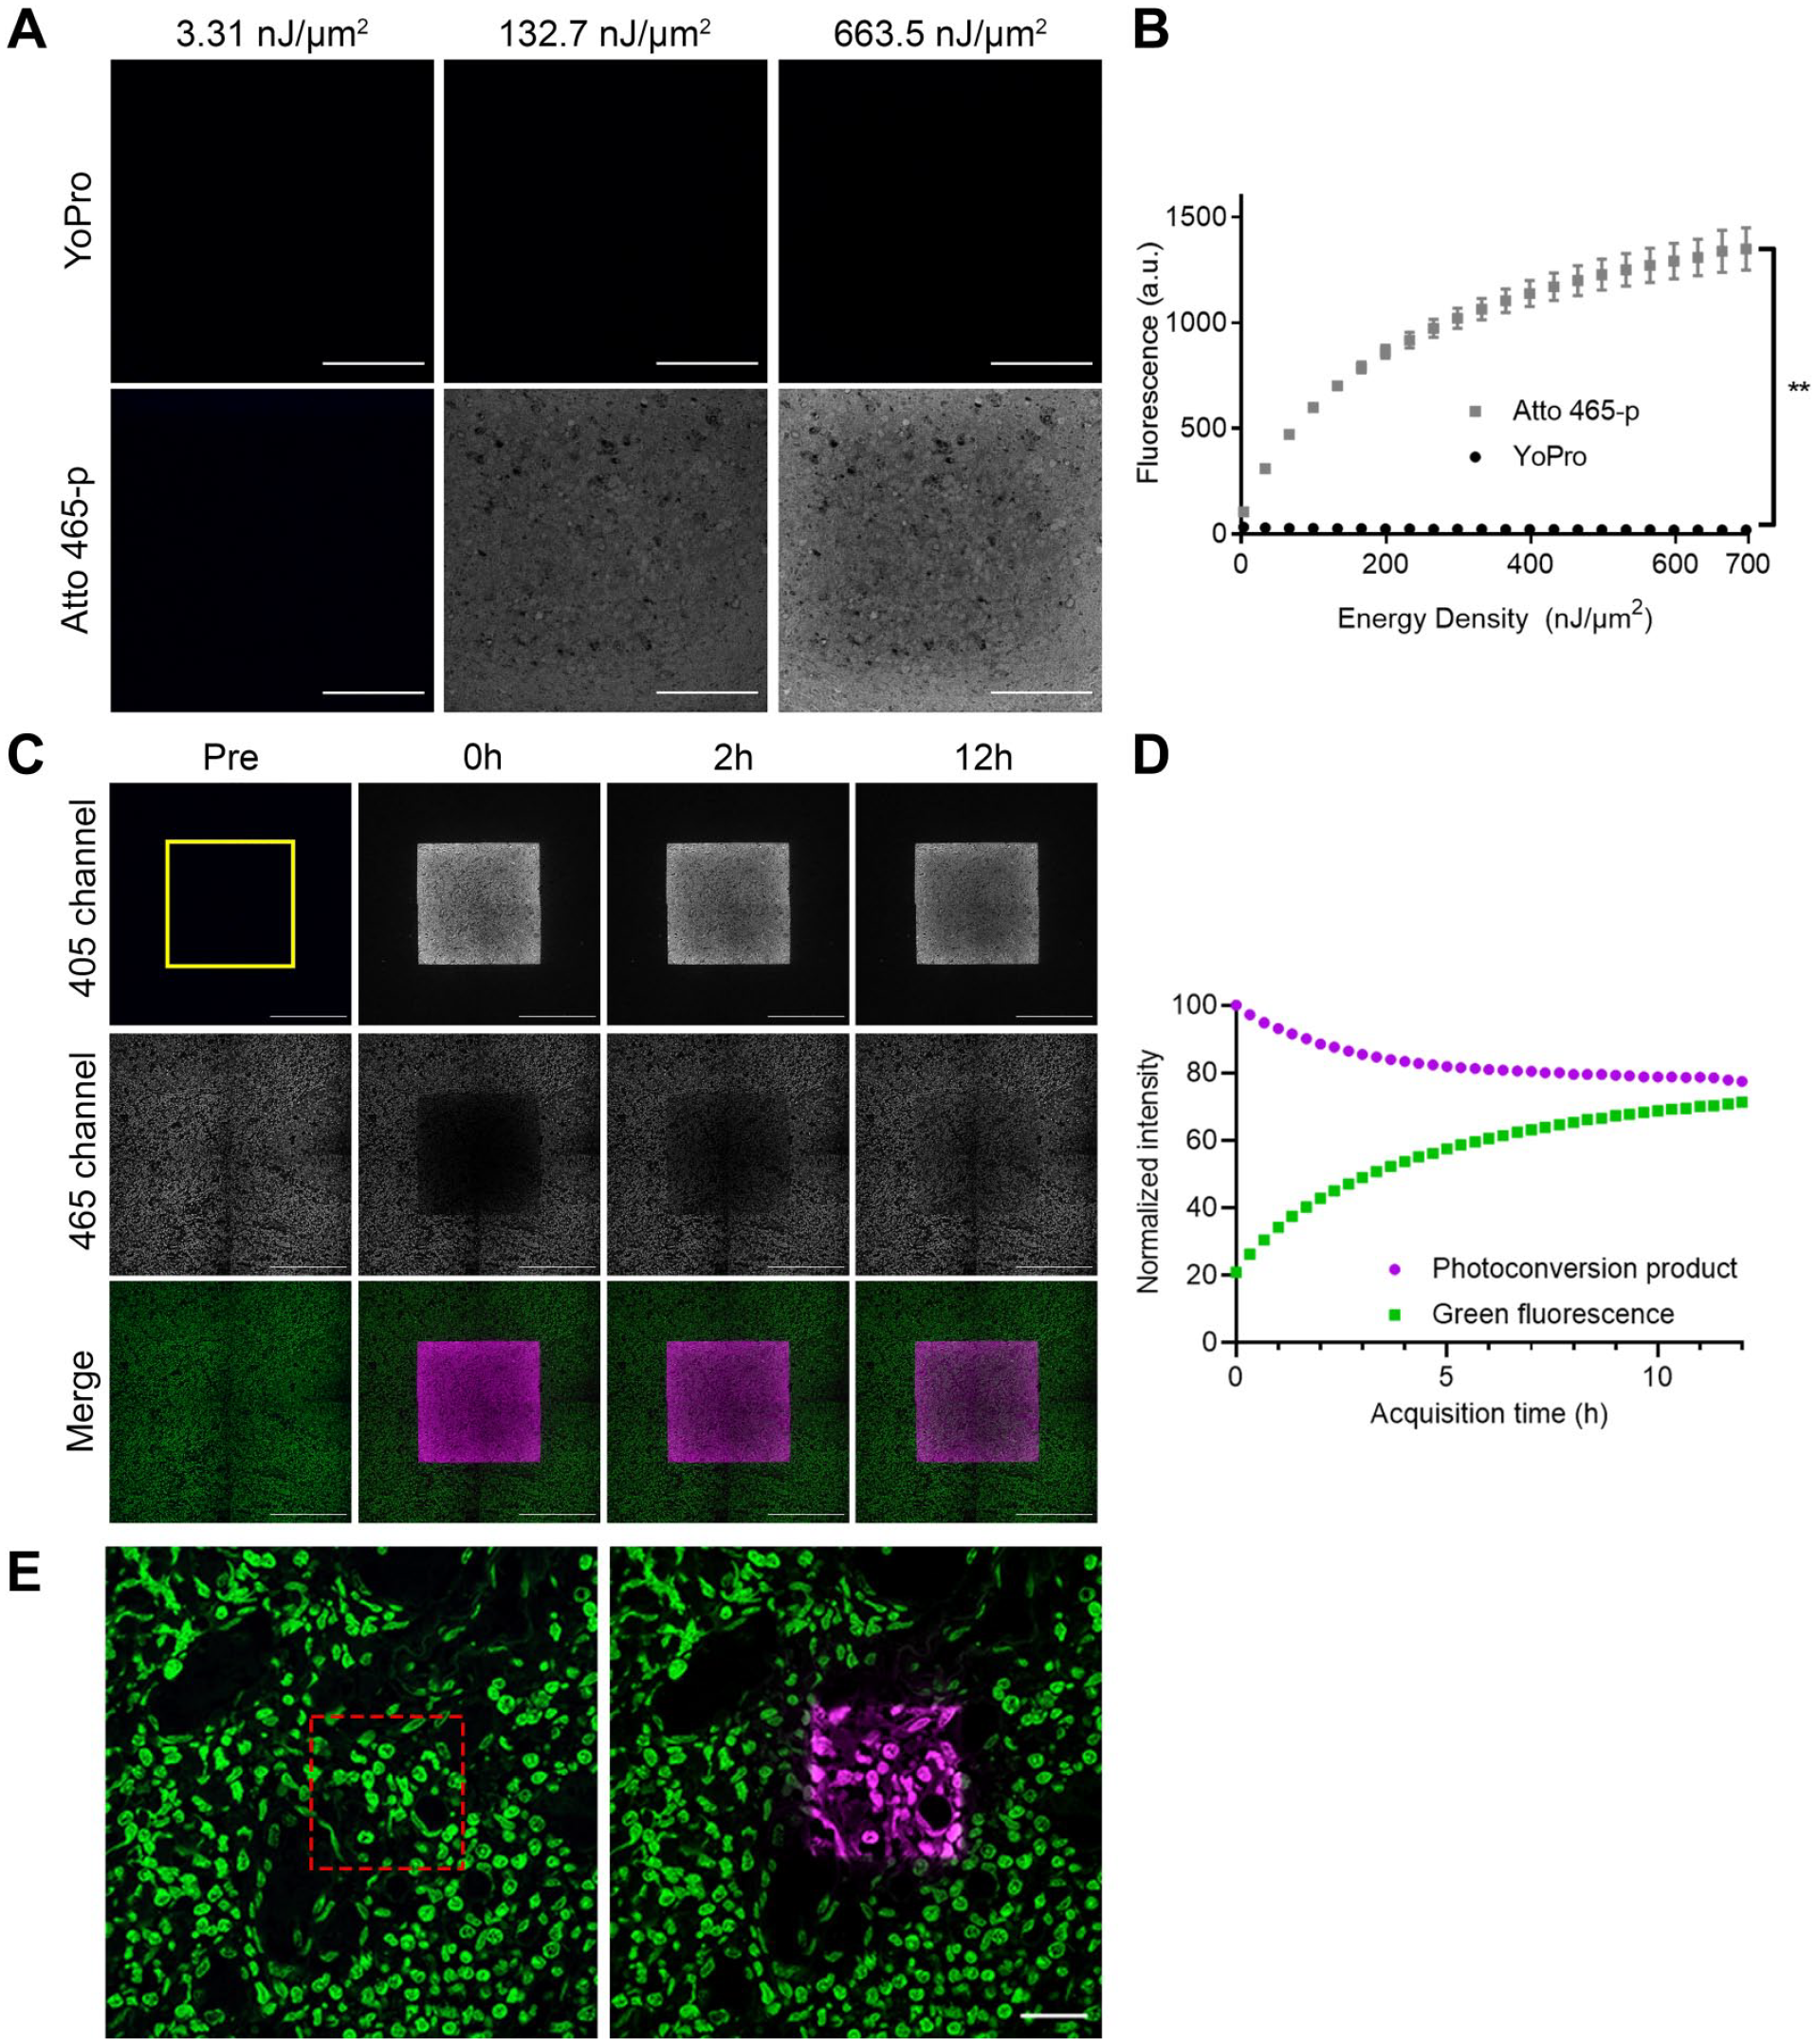
Characterization of Atto 465-p photoconversion. (A) Representative images of human FFPE tonsil stained with YoPro-1 (top; 0.125 µM) or Atto 465-p (bottom; 8 µM) and subjected to high energy density. After illumination, the photoconversion product of Atto 465-p was detectable using 405 nm excitation and emission wavelengths, but not YoPro. Scale: 100 µm. (B) Plot illustrates the correlation between photoconverted product fluorescence quantification and the energy density delivered to the tissue for both Atto 465-p (gray squares) and YoPro-1 (black circles). (C) Representative time series of human FFPE tonsil stained with Atto 465-p (8 µM). The first column shows images taken prior to the delivery of 929 nJ/µm2 of energy density (Pre); immediately after (second column, 0h), 2 hr (third column, 2h), and 12 hr (fourth column, 12h) after (see “Materials and Methods”). Scale: 200 µm. (D) Graph shows the kinetic analysis of the average fluorescence intensities in the region of interest (yellow box in C) excited in the 405 channel (magenta dots) and the 465 channel (green squares) immediately after the high energy density delivery (Time 0h) and every 20 min for 12 hr. (E) High-resolution images of human FFPE tonsil stained with Atto-465-p (green) showing pre and post photoconversion (magenta) using high energy density light to the area depicted by the red box. Nuclei are easily visible after photoconversion. Scale: 20 µm. Abbreviation: FFPE, formalin-fixed paraffin-embedded. **p<0.0001, paired t-test.
Atto 465-p Is a Nuclei-specific Fluorescent Dye
We next evaluated the nuclear localization performance of Atto 465-p in multiple cell and tissue types. We determined an optimal working concentration of Atto 465-p from four different dilutions (0.5–4 µM) for fixed peritoneal exudate cells with 10-min incubation. An efficient fluorescence signal was achieved at 4 µM as demonstrated in Fig. 3A. We next compared Atto 465-p staining with the commonly used nuclear counterstains ToPro-3 and Hoechst 33342. These dyes were selected because they differ in fluorescent spectrum, allowing them to be stained together on the same tissue. The resultant staining shows a similar pattern for Atto 465-p, Hoechst 33342, and ToPro-3 (Fig. 3B). Single-color slides were stained to rule out fluorescent bleed through between channels (Fig. 3B).
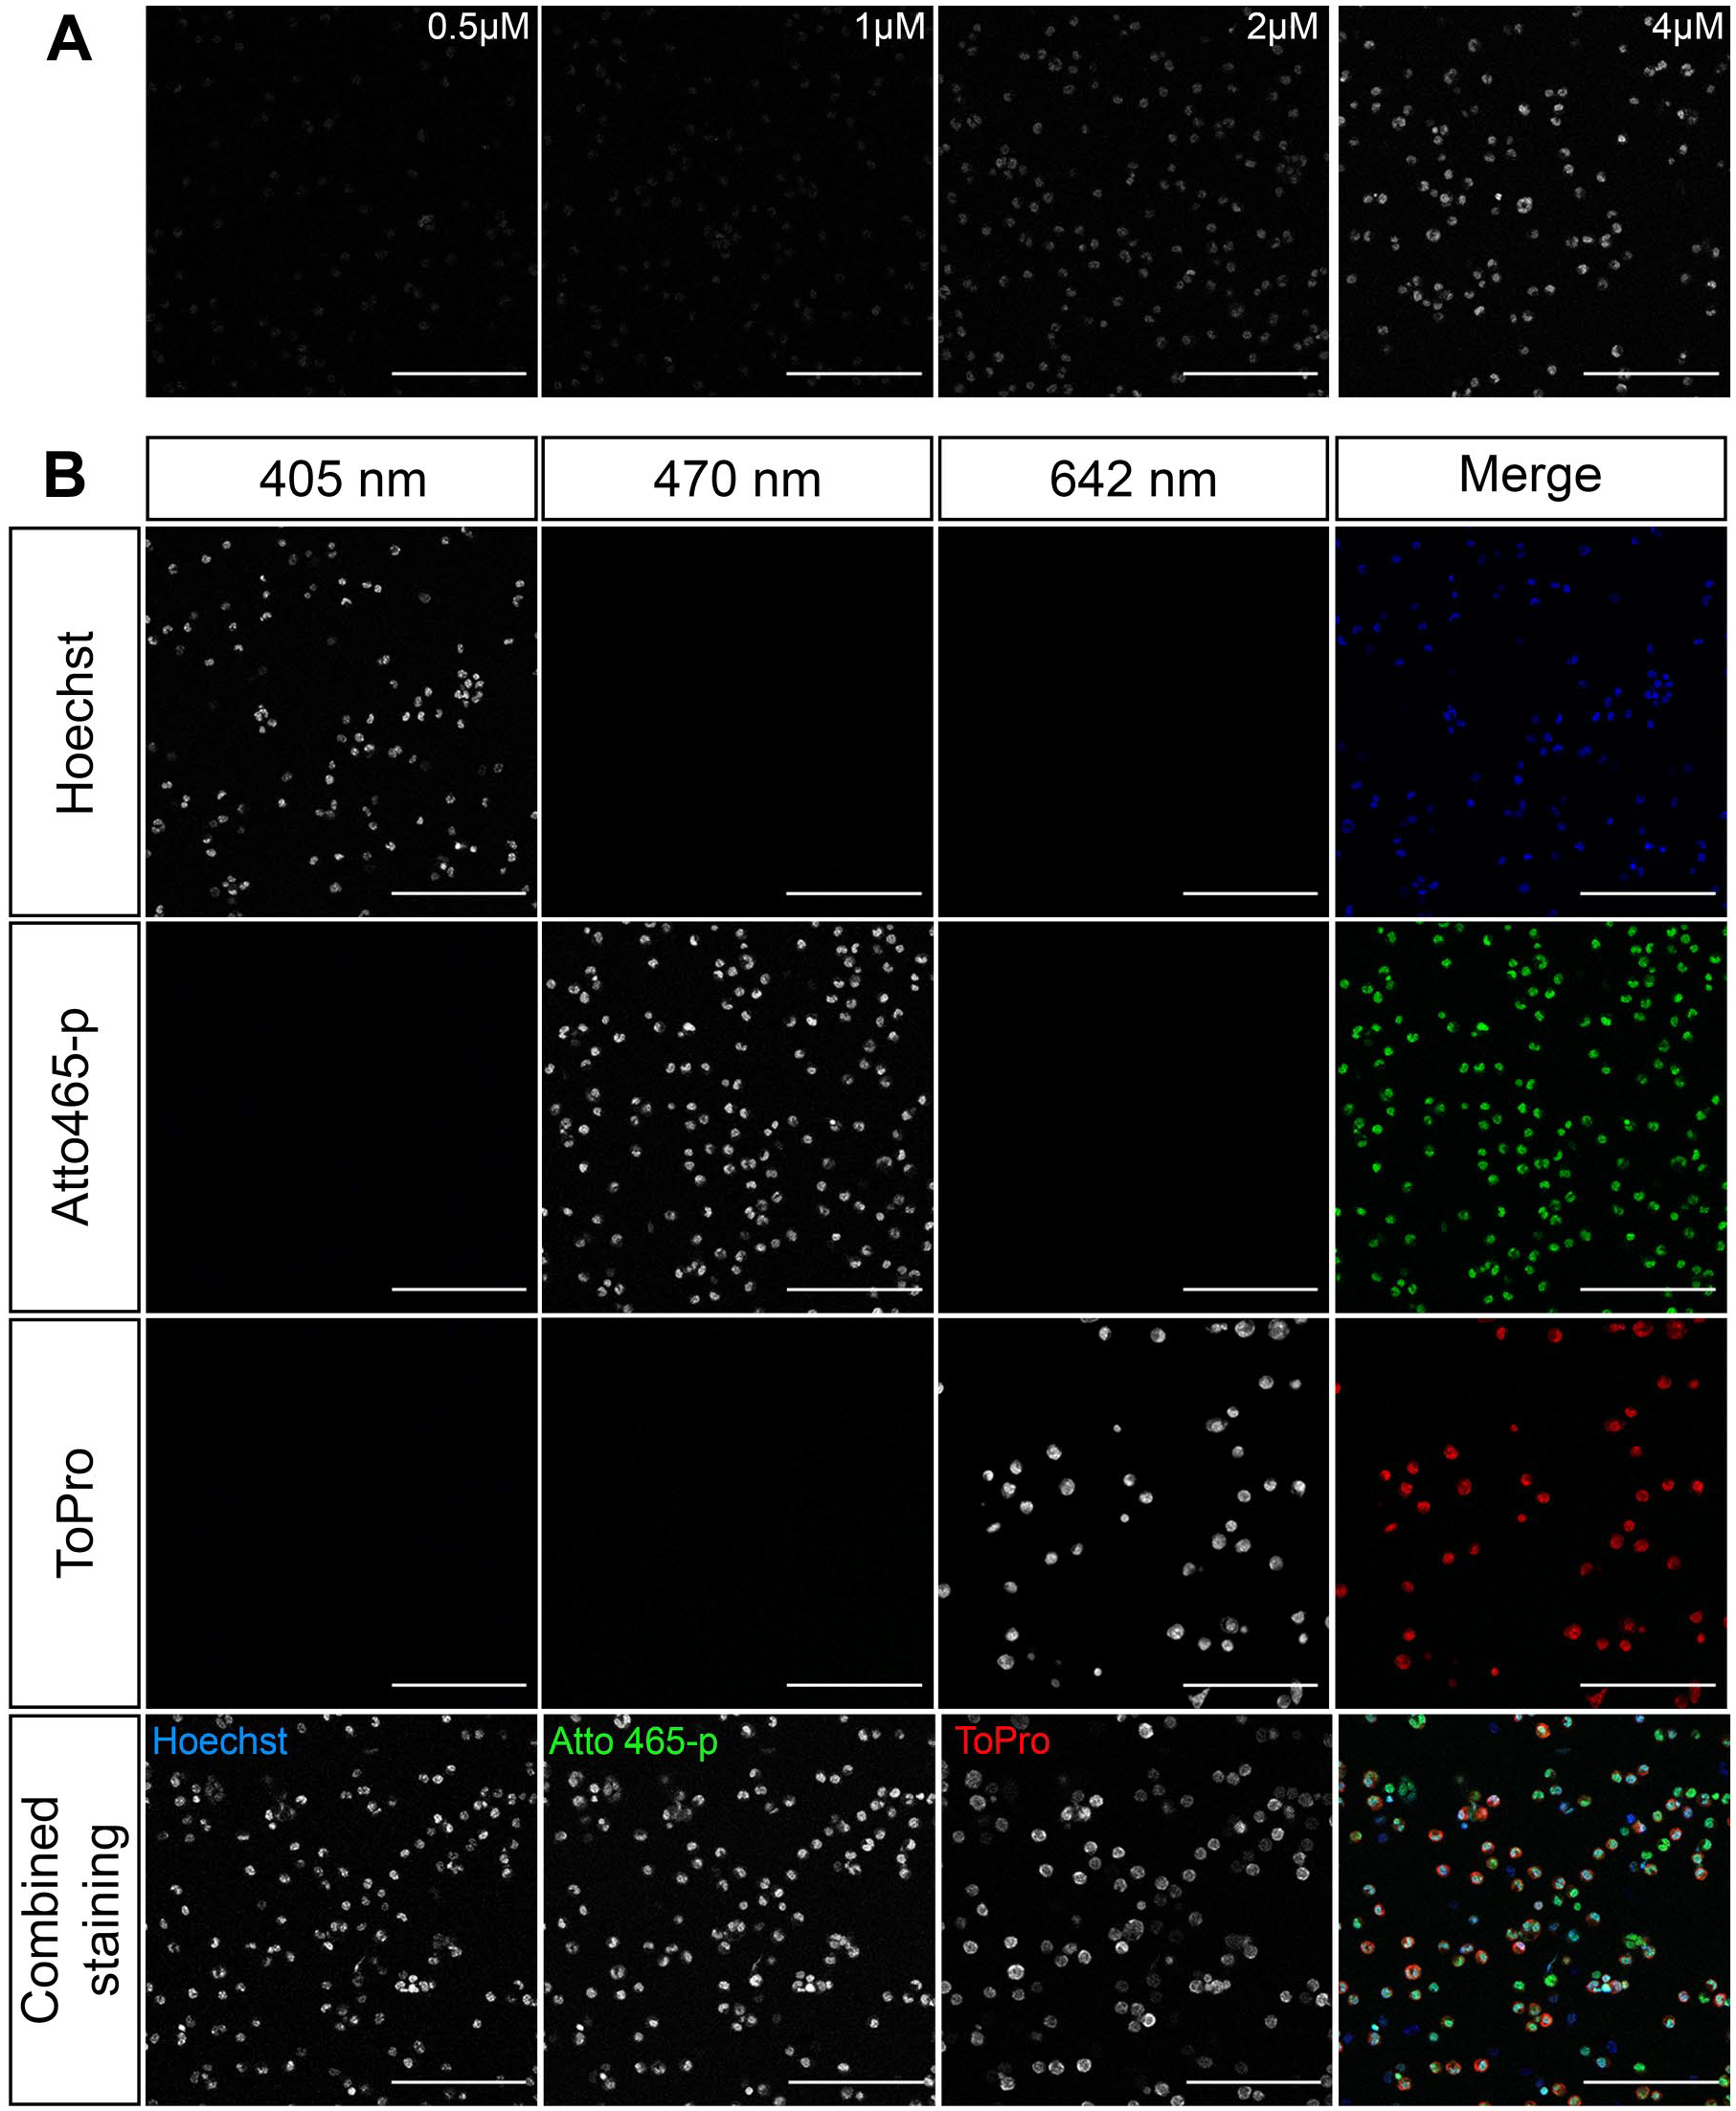
(A) Serial dilution staining was done on 4% paraformaldehyde fixed mouse peritoneal cells to determine optimal concentration for Atto 465-p. (B) Mouse cells stained with either Hoechst 33342 (blue), Atto 465-p (green), ToPro-3 (red), or a combination of all dyes were imaged on Leica microscope with the following settings: Hoechst 33342 (EX: 405 nm, EM: 415–445 nm), Atto 465-p (EX: 470 nm, EM: 480–511 nm), ToPro-3 (EX: 642 nm, EM: 652–700 nm). Scale: 50 µm. Abbreviations: EX, excitation; EM, emission.
To further confirm Atto 465-p affinity and specificity for nuclei, we conducted chromosomal staining using Hoechst 33342 as the positive control. Here, Atto 465-p demonstrated similar staining patterns with Hoechst 33342, suggesting that Atto 465-p stains chromatin (Fig. 4).
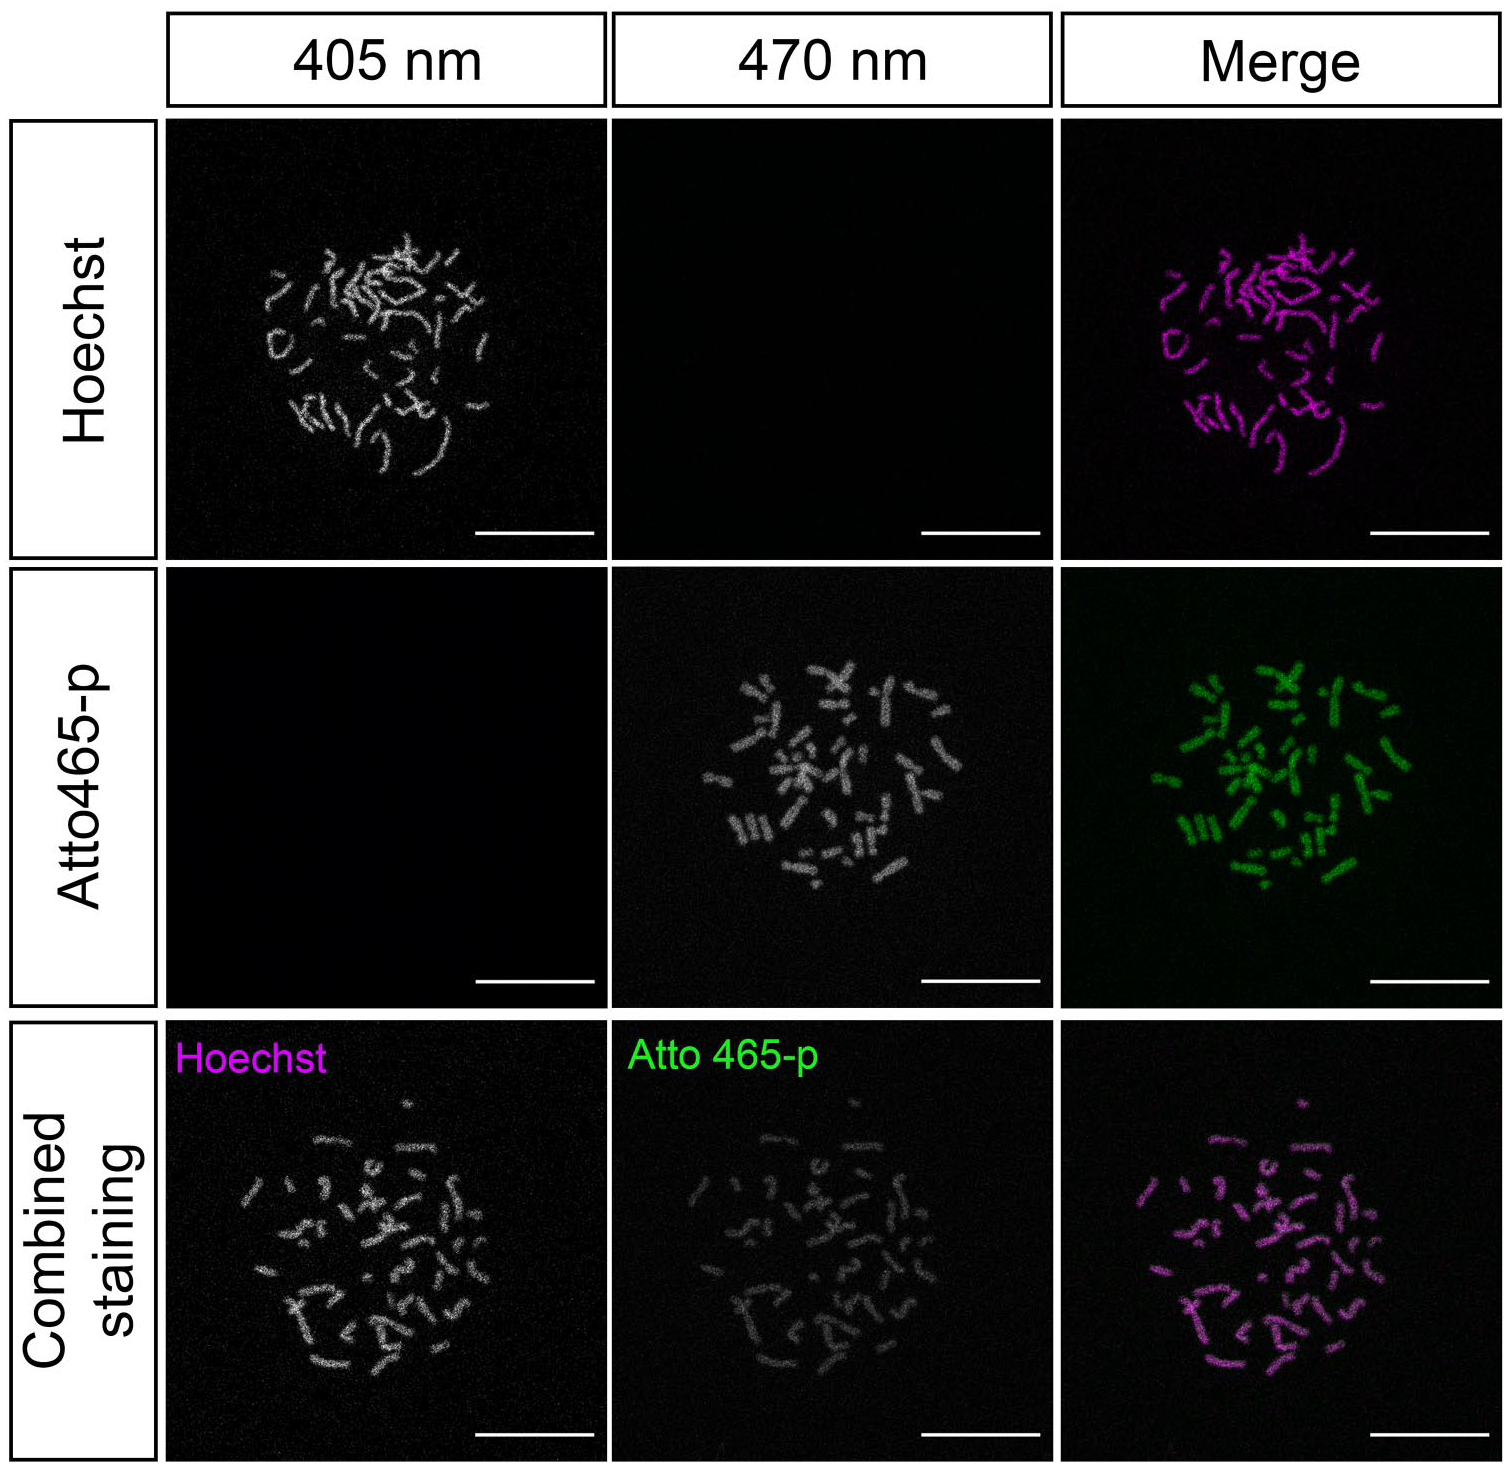
Immunofluorescence staining of human karyotype shows patterning of Hoechst 33342 (magenta) and Atto 465-p (green) with colocalization in the bottom row suggesting that Atto 465-p and Hoechst 33342 label chromatin similarly. Scale: 25 µm.
Atto 465-p Stains Nuclei in Various Cell Types and Conditions, Making Available a Novel Fluorescent Channel for mIF Protocols
To further assess potential applications for Atto 465-p as a nuclear dye, several mouse (Fig. 5A) and human (Fig. 6) tissue sections were fixed with three distinct processing protocols and stained with Atto 465-p, Hoechst 33342, or ToPro-3. Figures 5A and 6 show a nearly identical staining pattern of Atto 465-p, Hoechst 33342, and ToPro-3 in all tissues, independent of tissue fixation protocol. Quantitative colocalization analysis (Fig. 5B and Table 2) demonstrated higher degree of colocalization between Hoechst 33342 and Atto 465-p (R = 0.8043 ± 0.022) than Hoechst 33342 and ToPro-3 (R = 0.7242 ± 0.022).
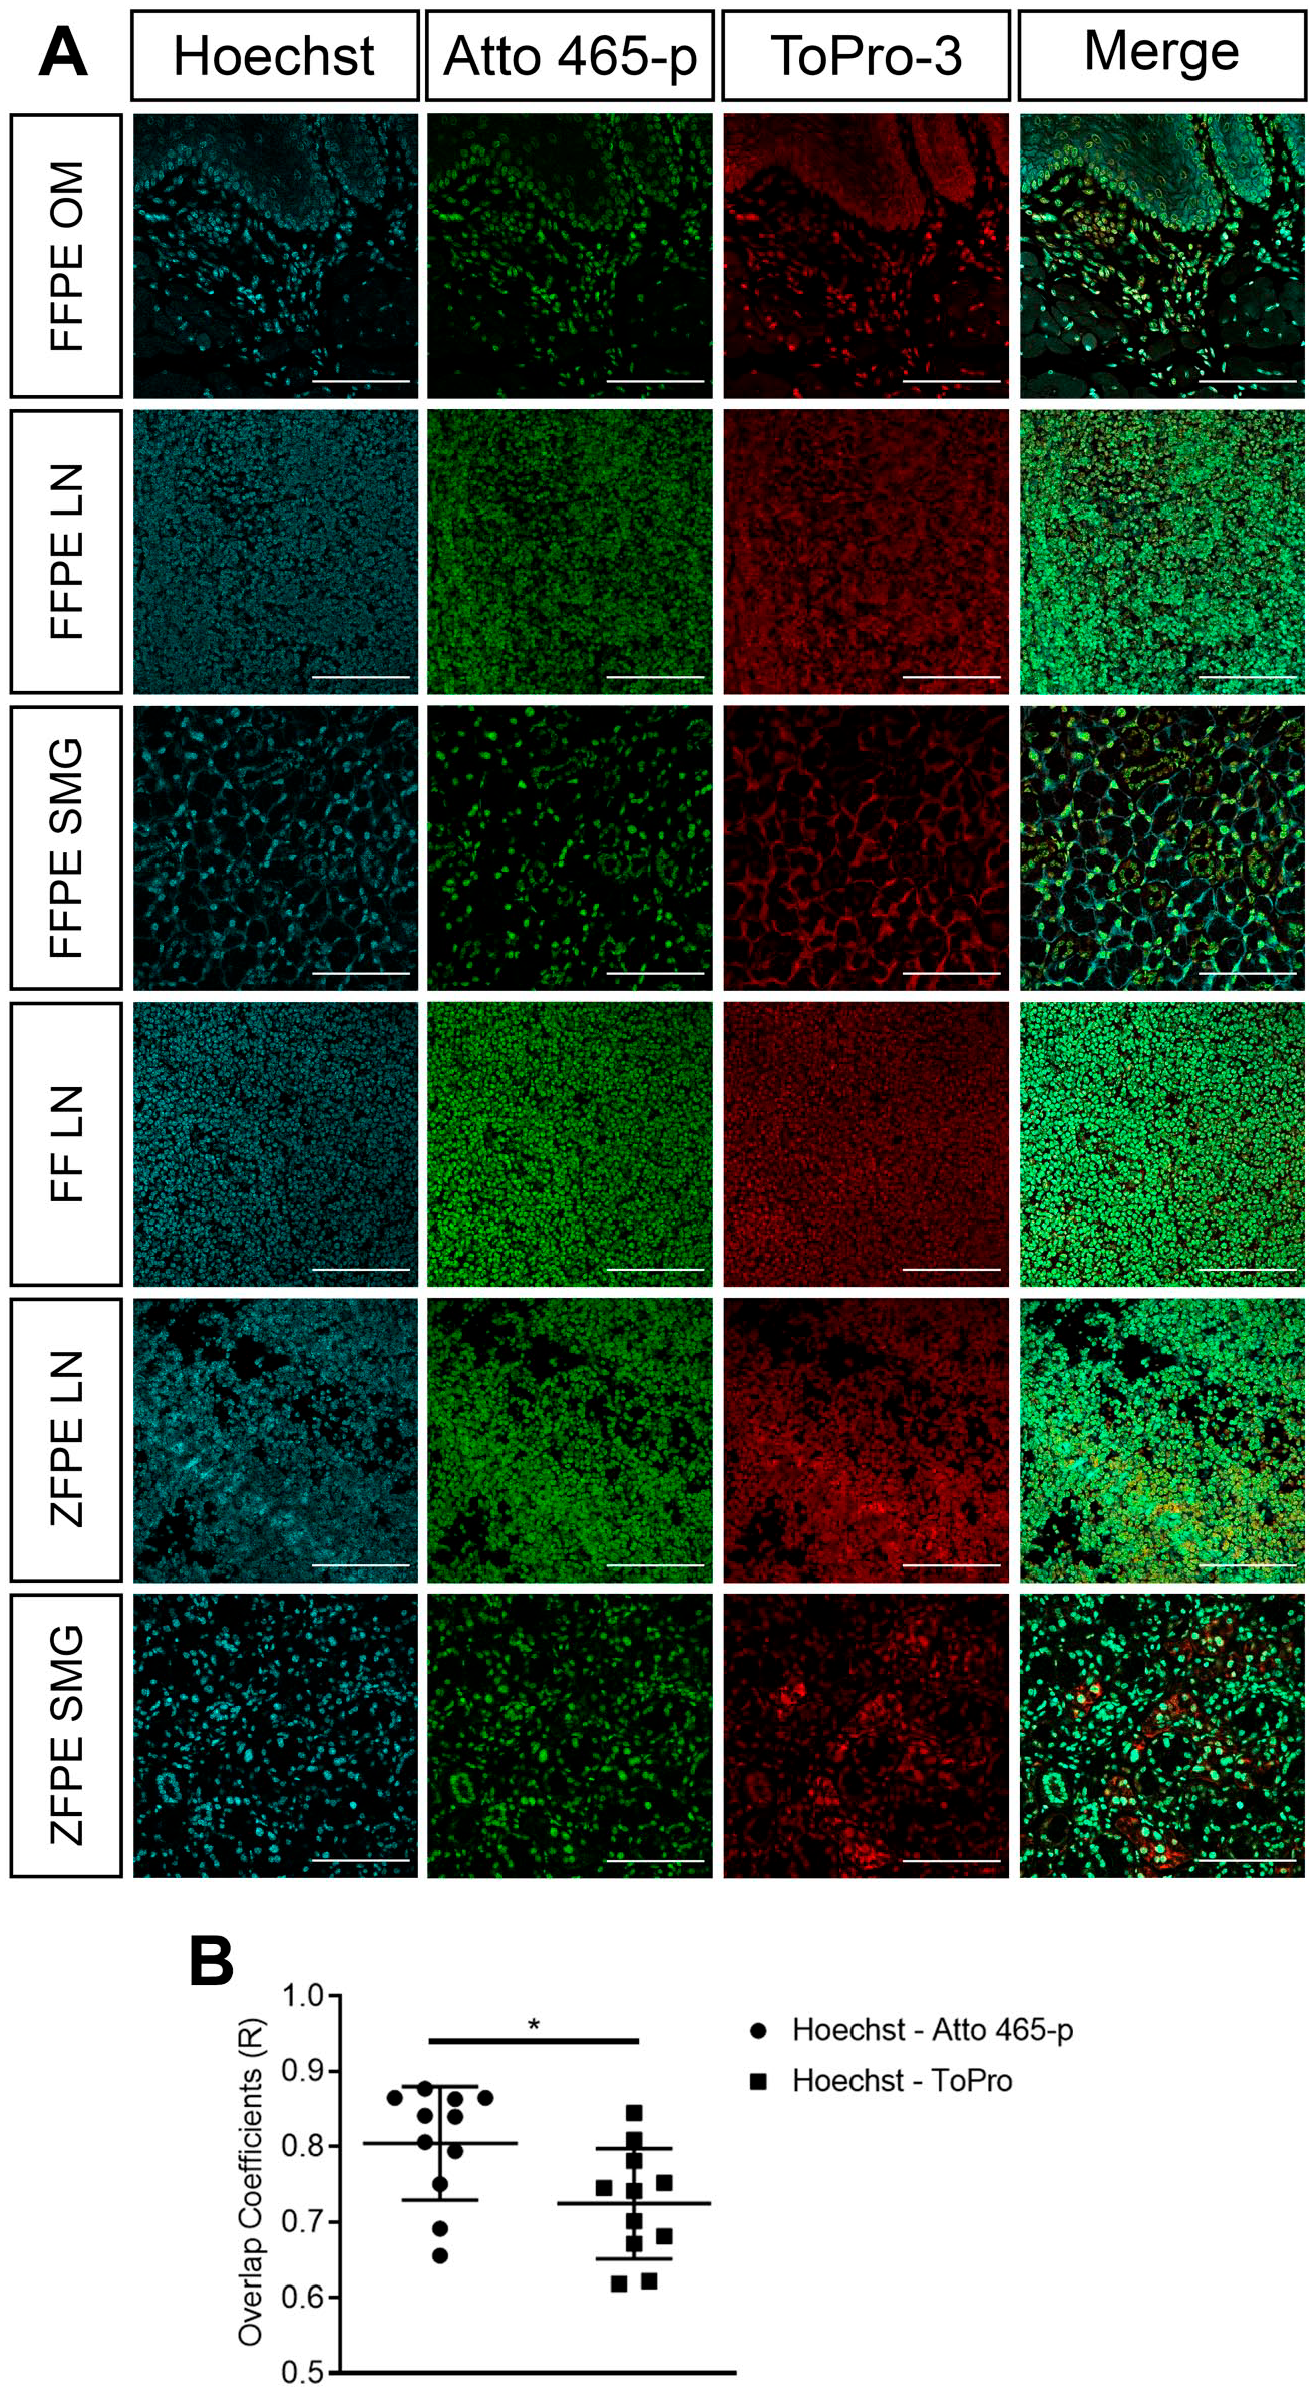
(A) Mouse tissues following different fixation protocols to compare nuclear specificity of Atto 465-p (green) with Hoechst 33342 (cyan) and ToPro-3 (red) were imaged on a Nikon confocal microscope. Scale: 100 µm. (B) Quantification of the overlap coefficient demonstrated higher similarity between Hoechst 33342 and Atto 465-p than Hoechst 33342 and ToPro-3. Values represent mean ± SEM. Abbreviations: SEM, standard error of the mean; OM, oral mucosa; FFPE, formalin-fixed paraffin-embedded; LN, lymph nodes; SMG, submandibular gland; ZFPE, zinc-fixed paraffin-embedded; FF, flash-frozen. *p<0.001, paired t-test.
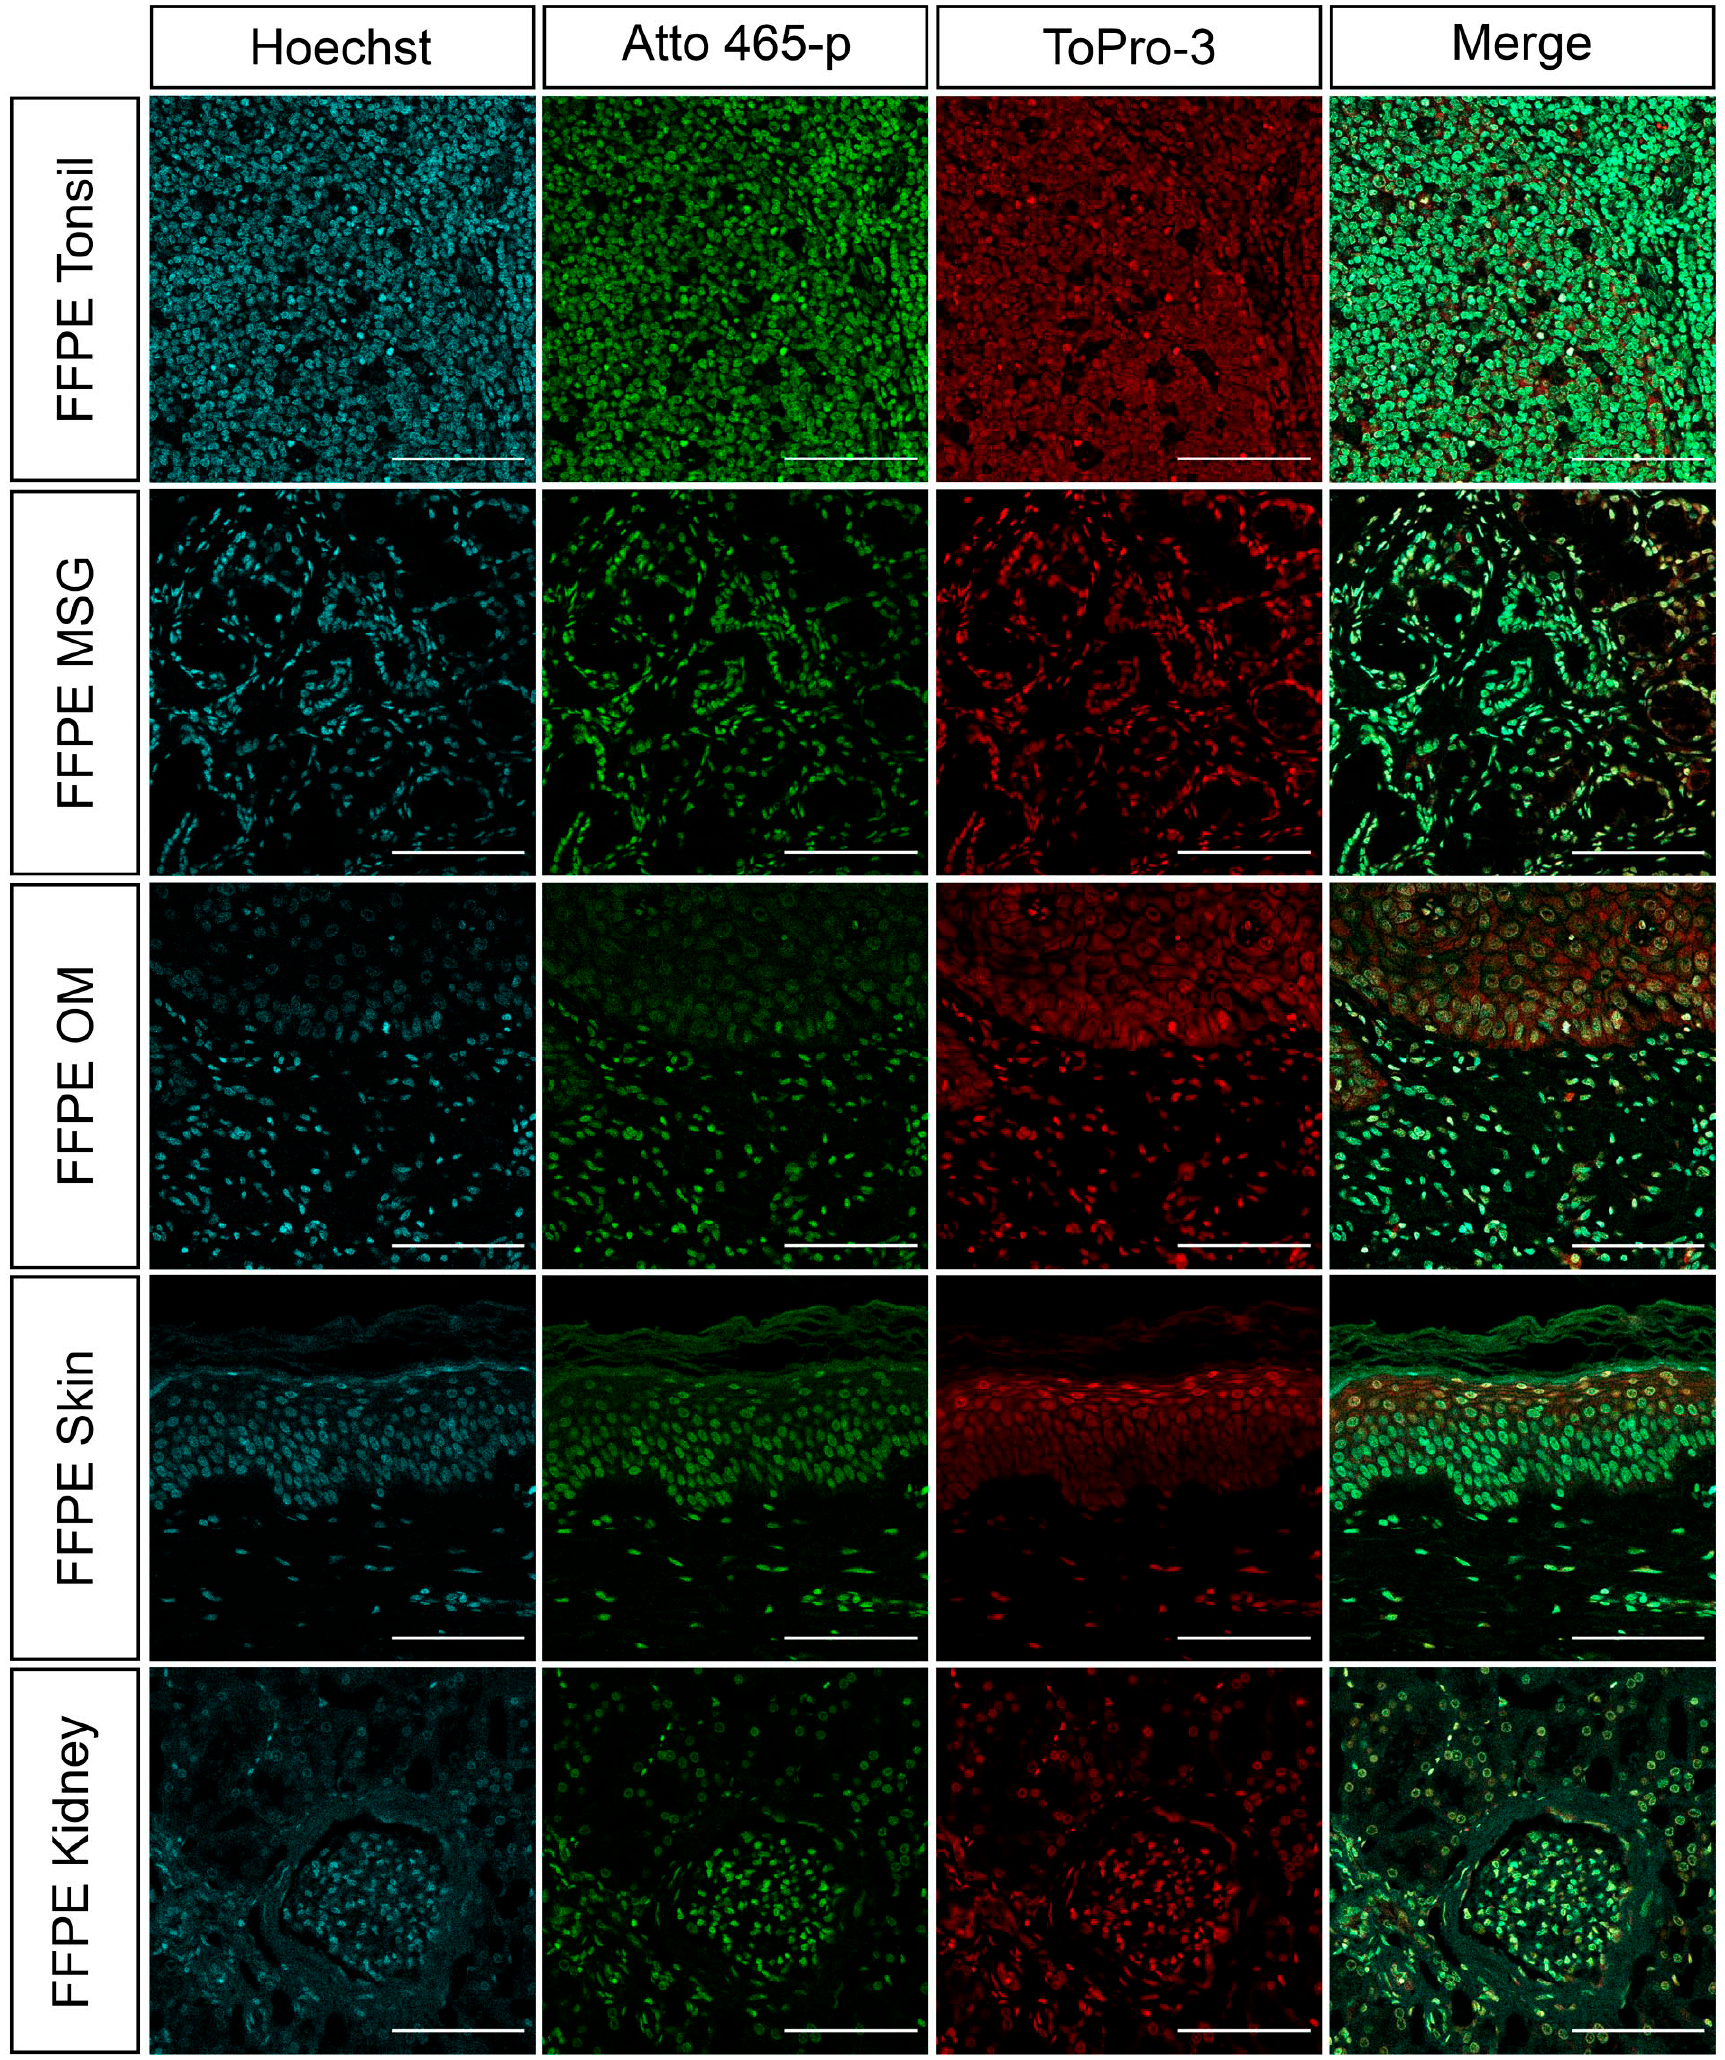
Human FFPE tonsil, MSG, OM, skin, and kidney were stained with Hoechst (16.2 µM; cyan) and ToPro (1 µM; red) and imaged on a Nikon confocal microscope to demonstrate similar nuclear specificity of Atto 465-p (4 µM; green). Scale: 100 µm. Abbreviations: FFPE, formalin-fixed paraffin-embedded; MSG, minor salivary gland; OM, oral mucosa.
Overlap Coefficient: Figure 5.
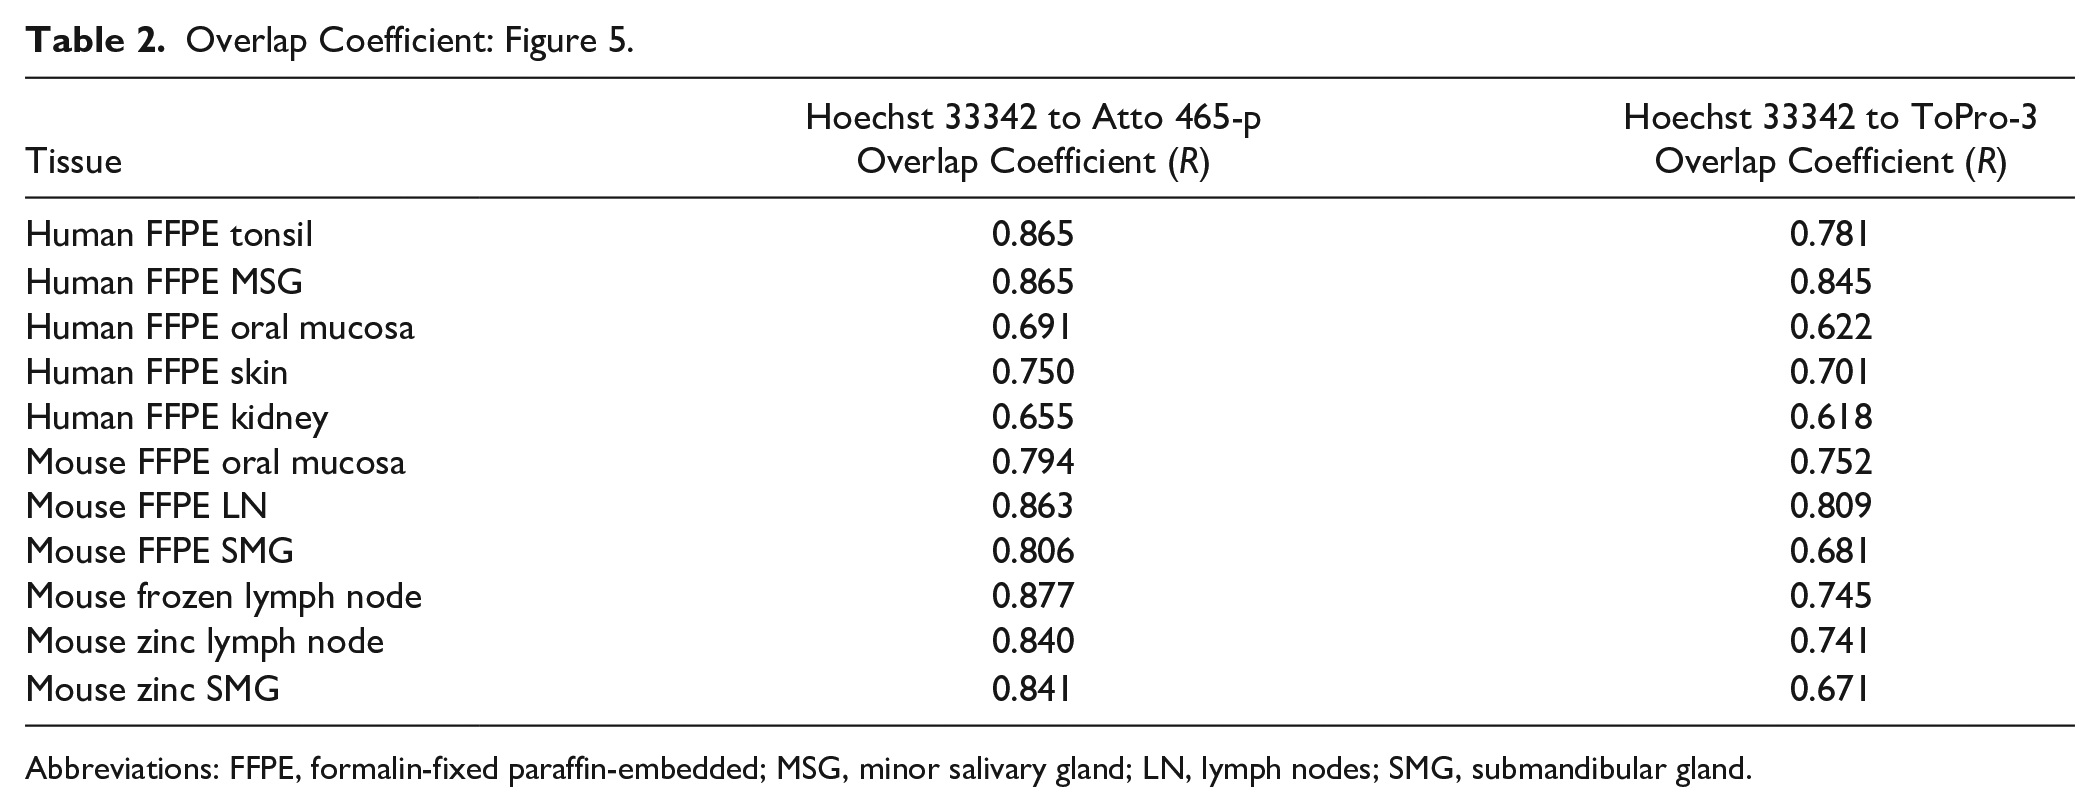
Abbreviations: FFPE, formalin-fixed paraffin-embedded; MSG, minor salivary gland; LN, lymph nodes; SMG, submandibular gland.
To test if Atto 465-p is suitable for mIF, we developed a 6-plex TSA panel using Atto 465-p as a nuclear probe. Human tonsil was stained for known surface markers CD3 (T-cells), CD8 (T-cell subset), cKit (mast/innate lymphoid cells), and CD56 (NK cells) as well as an intracellular cytokine, interleukin-17 (IL)-17, and visualized by confocal microscopy (Fig. 7). Atto 465-p staining (shown in blue) highlights each nucleus, revealing the marginal zone and germinal center of a follicle. CD3, CD8, and cKit showed membranous staining, residing primarily extrafollicularly, whereas CD56 expression was membranous but present both in the extra- and intrafollicular space. Moreover, IL-17 cytoplasmic staining was localized primarily outside the germinal center. To address the critical question of crosstalk between Atto 465-p and Alexa 488, single color plus nuclear stain (Atto 465-p) controls were used to stain adjacent sections and are shown in Fig. 8. The top row of Fig. 9 demonstrates that strong signal from Atto 465-p can be fluorescently separated from the Alexa 405 (IL-17 green) emission and does not bleed through into the adjacent 488 nm (CD8 yellow) emission under sequential scanning conditions and appropriate narrow band pass settings (Fig. 9). However, it is important to adjust excitation wavelengths and use narrow emission band pass settings to spectrally separate Atto 465-p signal and Alexa 488 when on the same slide (Fig. 9, bottom row).
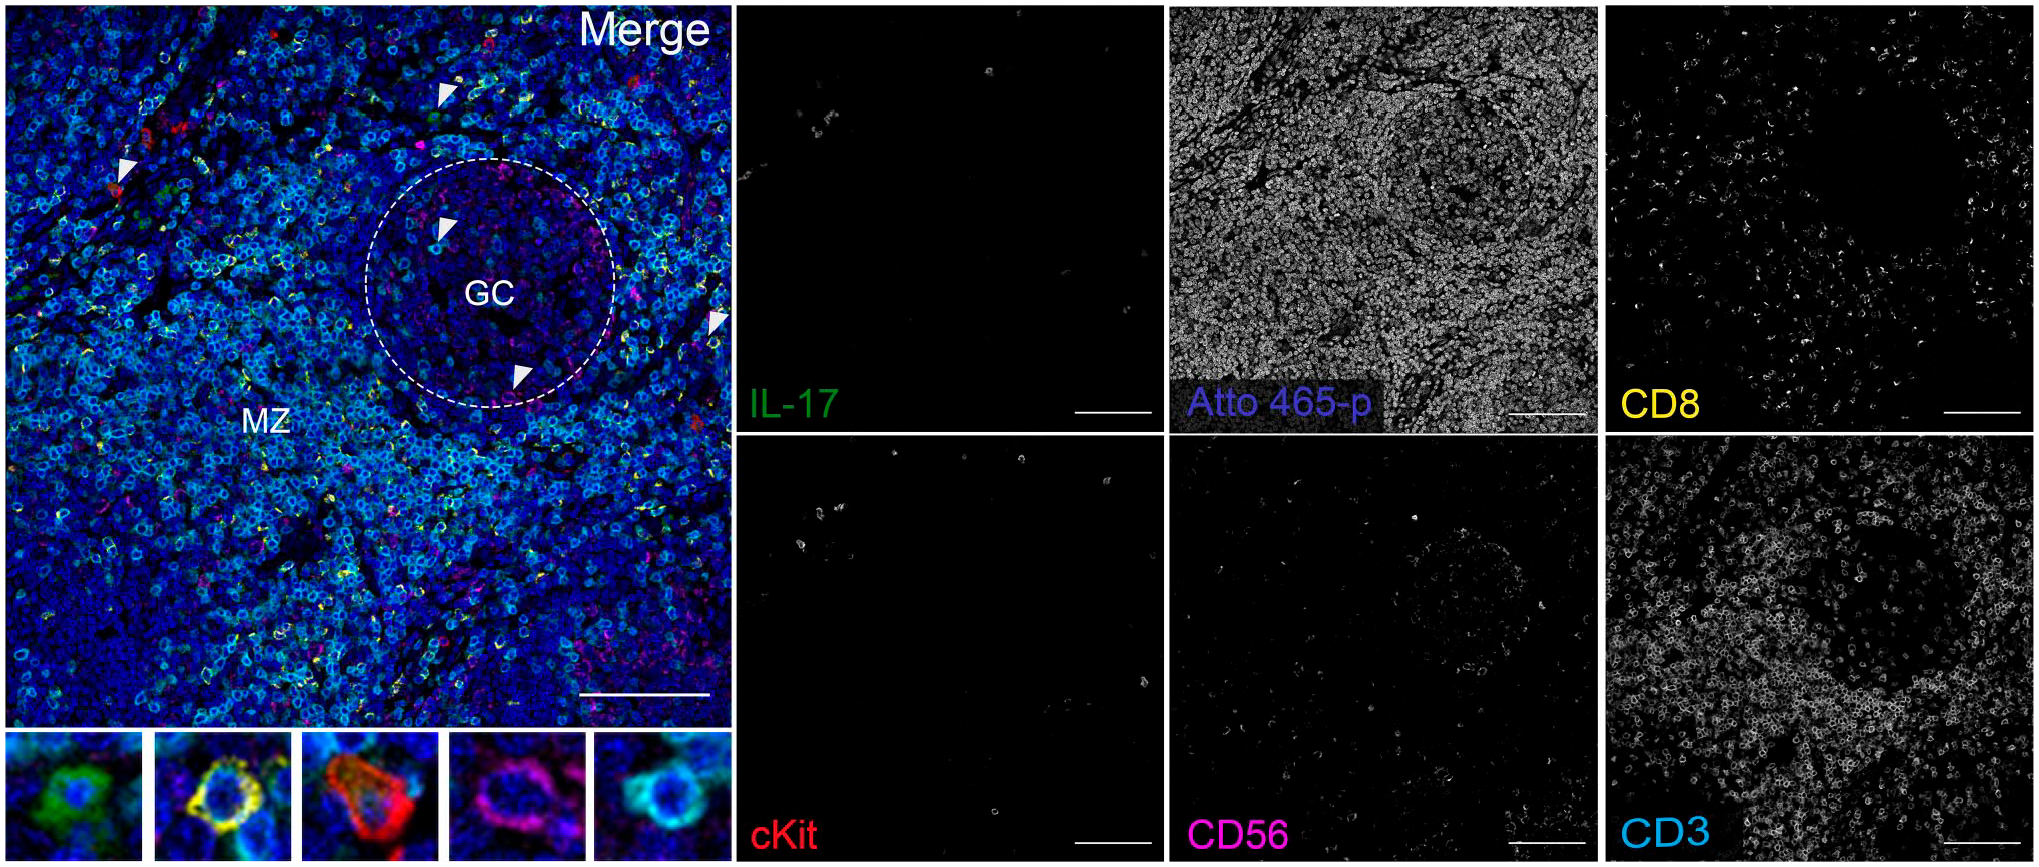
mIF microscopy of IL-17 (green), CD8 (yellow), cKit (red), CD56 (magenta), and CD3 (cyan) in FFPE human tonsil. Atto 465-p (blue) was used as a nuclear probe. Magnified images of selected cells (arrowheads) are shown in the insets to highlight that specific cytoplasmic (IL-17) and surface (CD8, cKit, CD56, and CD3) staining is distinguishable from nuclei (Atto 465-p). Area inside the white dashed line denotes GC. Scale: 100 µm. Abbreviations: GC, germinal center; MZ, marginal zone.
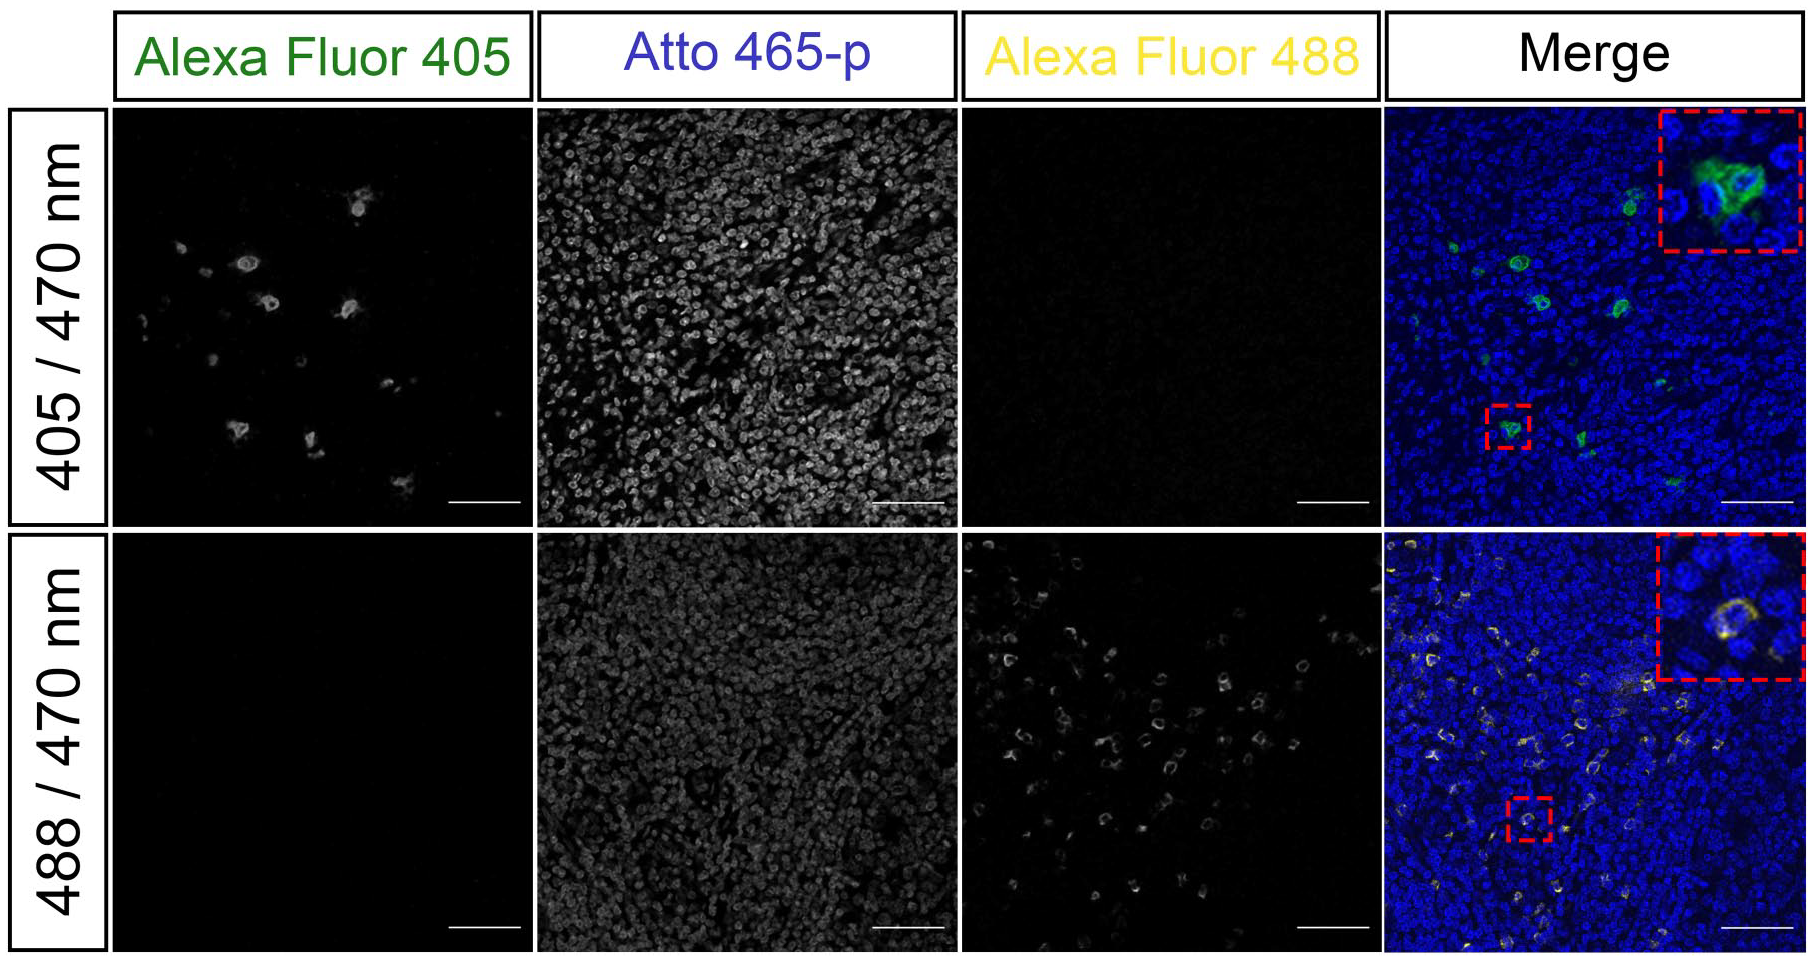
Fluorescence single plex controls were used to validate the absence of signal crosstalk between 405 and 465 nm channels (top) and 465 and 488 nm channels (bottom). Scale: 25 µm.
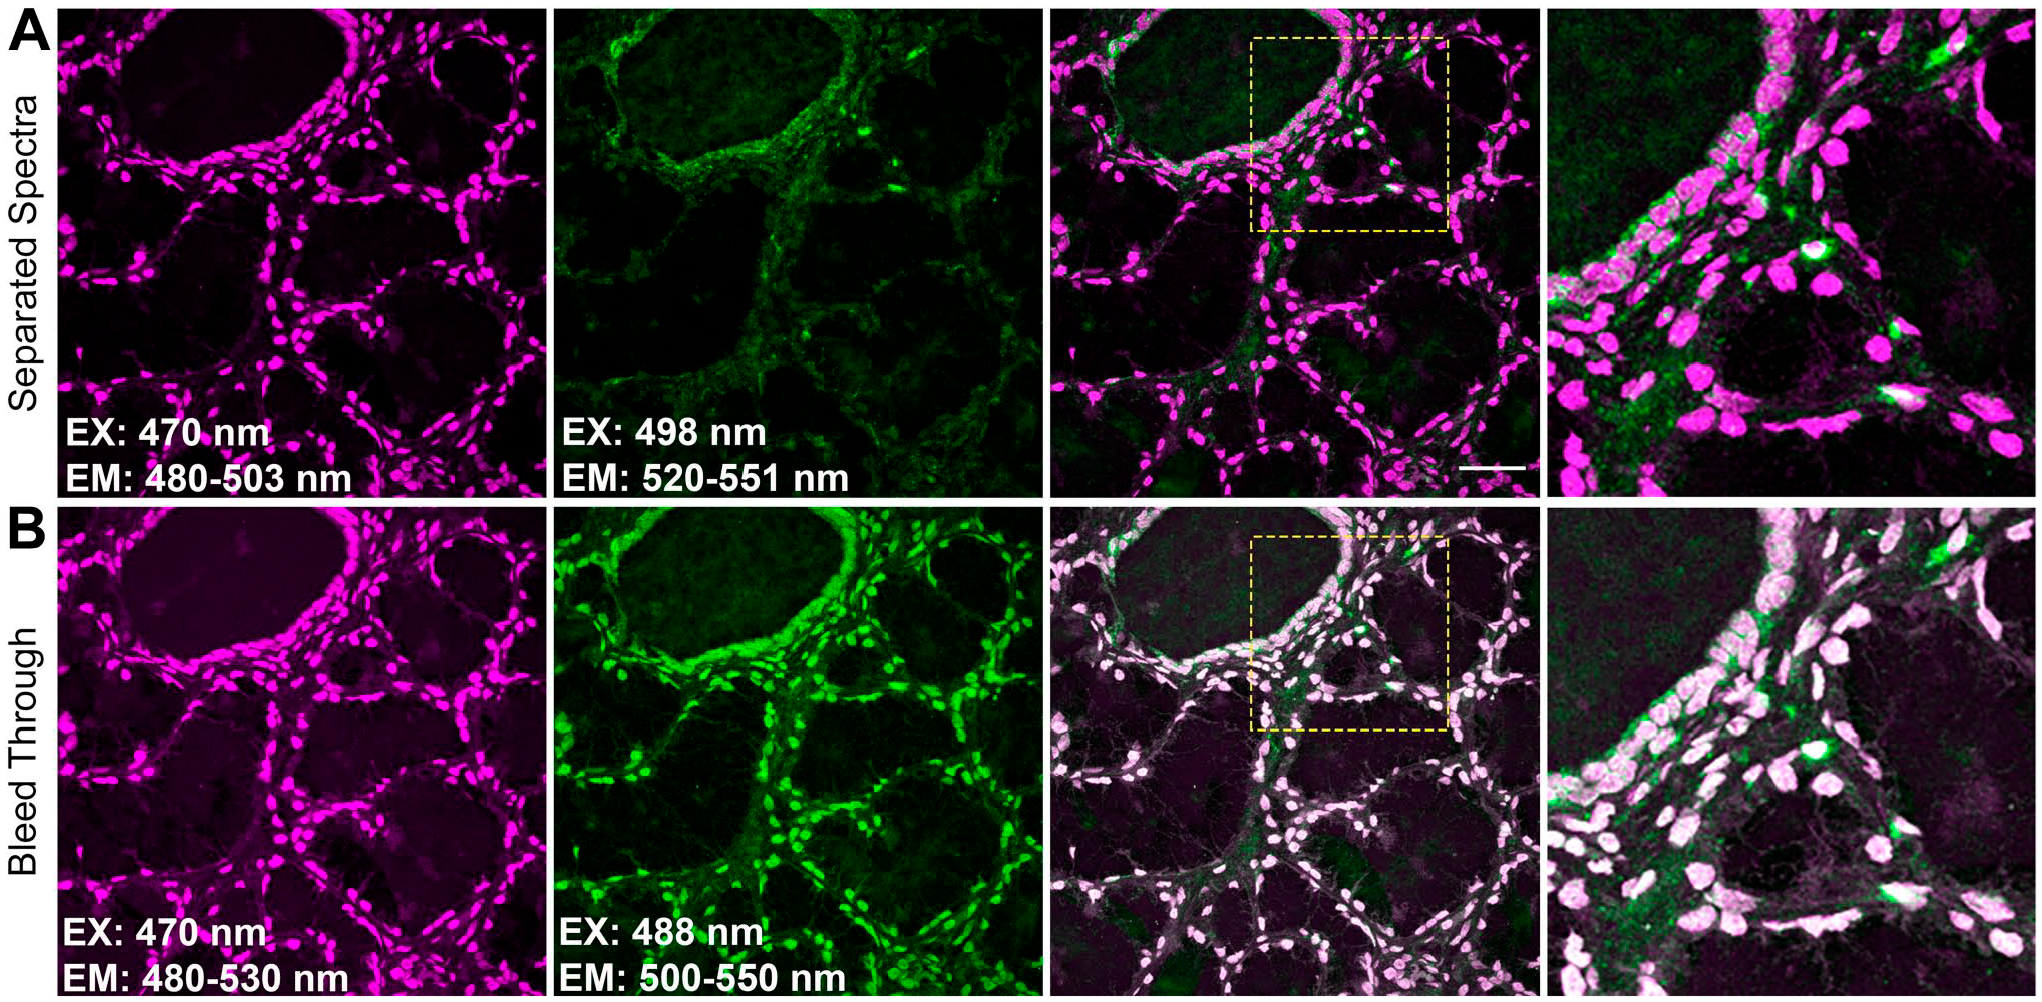
(A) Correct and (B) inappropriate excitation and emission settings for visualizing Atto 465-p together with Alexa fluor 488. Panels A and B show the same tyramide signal amplification staining of human tonsil with Atto 465-p (magenta, first column) and CD103 (green, second column). Due to spectral overlap of the fluorophores, the excitation for Alexa Fluor 488 is red shifted to 498 nm, whereas the emission spectra for both are narrow in panel A. In panel B, 488 nm excitation together with a wide emission for both fluorophores leads to inappropriate colocalization. In the inset (fourth column, dashed yellow box in third column), only four cells demonstrate colocalization in A, whereas all colocalize in B. Scale: 50 µm. Abbreviations: EX, excitation; EM, emission.
Together, these data suggest that Atto 465-p can be used as a nuclear counterstain for mIF protocols. This facilitates the use of the 405 nm wavelength for other protein targets.
Discussion
In the present work, we demonstrate that Atto 465-p is a specific and stable fluorescent dye for nuclear staining with excellent performance. It can be used as an alternative to 4′,6-diamidino-2-phenylindole (DAPI) in mIF assays in mouse and human cells and tissues. These data show comparable nuclear staining between Atto 465-p and other common nuclear dyes (Hoechst 33342 and ToPro-3).
Atto 465-p is a cyan fluorescent dye that absorbs light between 415 and 475 nm (Fig. 1). It is easily excited with an argon laser in instruments emitting 470 nm light, which is a more common imaging component than is the violet 405 nm laser. The spectral properties of Atto 465-p favor its color separation from both Alexa Fluor 405 and Alexa Fluor 488 (Figs. 6 and 7), providing a stable and specific alternative to leave the 405 nm channel open for additional protein targets when spectral imaging or a white light excitation source are available.
Importantly, near-UV (ultraviolet) or violet excitations are more toxic to cells than visible light, 20 which can hinder further applicability in live cell microscopy studies. Our results demonstrate that extended exposure to high-intensity blue light (470 nm) will prompt a photoconversion reaction whose byproduct absorbs 405 nm light and emits blue fluorescence. Photoconversion has been shown in other common nuclear dyes like DAPI and Hoechst 33342. 21 Under normal confocal use, a single image scan uses a significantly lower energy than our photobleaching and photoconverting experiments (0.23 nJ/µm2 vs greater than 132.7 nJ/µm2, Figs. 1 and 2). Although this photoconversion is a cautionary characteristic for IHC multiplexing, the same characteristic has been leveraged in experiments as a simple method to mark specific cells. 22 Further investigation into the potential of Atto 465-p for live imaging is warranted. Leveraging of Atto 465-p as a photoinducible cell marker would be advantageous to the field, given that photoinducible markers such as KikGR, 23 PS-CFP, 24 PA-GFP, 25 PA-mRFP1, 26 and others require UV light.
Taken together, Atto 465-p demonstrates specificity and photostability, and fulfills the requirements of a nuclear counterstain for immunocytochemistry and IHC applications. The use of Atto 465-p for nuclear staining increases the multiplex capacity in mIF assays by occupying an underutilized region in the fluorescent spectrum.
Footnotes
Acknowledgements
Human karyotype slides were kindly prepared and provided by National Human Genome Research Institute Cytogenetic and Microscopy Core. This research was supported by the NIDCR Imaging Core: ZIC DE000750.
Competing Interests
The author(s) declared no potential conflicts of interest with respect to the research, authorship, and/or publication of this article.
Author Contributions
JTD, ADD, and CTH performed the immunostaining and microscopy. ACCS did tissue culture. JTD, ADD, CTH, EM, and JWM designed the studies and JTD, ADD, ACCS, and JWM wrote the manuscript. All authors have read and approved the final manuscript.
Funding
The author(s) disclosed receipt of the following financial support for the research, authorship, and/or publication of this article: This work was funded by the intramural program of the National Institute of Dental and Craniofacial Research, National Institutes of Health [ZIA DE000747 (to J.W.M.) and ZIA DE000714 (E.M.)].