
Abstract
Non-alcoholic steatohepatitis (NASH) is a worldwide health problem. Alternate-day fasting (ADF), although thought to be aggressive, has proven safety and efficacy. We aimed to evaluate the effect of short-term ADF against already established high-fat-fructose (HFF)-induced NASH, independent of the amount of calorie intake, and to study the effect of ADF on lipogenesis, apoptosis, and hepatic inflammation. Male Sprague Dawley rats were divided into two groups: (1) negative control and (2) NASH group fed on HFF for 9 weeks, and then randomized into two subgroups of either HFF alone or with ADF protocol for 3 weeks. The ADF could improve HFF-related elevation in serum lactate dehydrogenase and could decrease the mRNA expression of lipogenesis genes; acetyl CoA carboxylase, peroxisome proliferator-activated receptor γ, and peroxisome proliferator-activated receptor α; apoptotic genes caspase-3, p53, and inflammatory cyclo-oxygenase 2; and immunohistochemical staining for their proteins in liver with upregulation of LC3 and downregulation of P62 immunoexpression. Moreover, ADF ameliorated HFF-induced steatosis, inflammation, ballooning, and fibrosis through hematoxylin and eosin, Oil Red O, and Sirius Red staining, confirmed by morphometric analysis, without significant weight loss. Significant correlation of morphometric parameters with levels of gene expression was found. These findings suggest ADF to be a safe effective therapeutic agent in the management of NASH
Introduction
Non-alcoholic fatty liver disease (NAFLD) is a major health problem, with increasing incidence due to the dominance of obesity among adults and children. 1 NAFLD is characterized by hepatic steatosis, which may be complicated by inflammation and non-alcoholic steatohepatitis (NASH) that may progress to fibrosis, liver cancer, or hepatic failure. Currently, there is no efficient therapy against NASH. 2
Alternate-day fasting (ADF) was studied as a nutritional interference for preventing disease progression and showed more efficiency in increasing adherence to dietary control than the classic calorie restriction. 3 Moreover, ADF was used as a therapeutic remedy for many diseases related to obesity, for example, hypertension and diabetes, through its effect on glucose levels, insulin sensitivity, atherogenic lipids, inflammation, and apoptosis and through induction of autophagy. 4
Although recognized as an aggressive intervention, ADF has long been used in many studies in rats with variable durations—even for 12 months in mice with proven safety and efficacy. 5 It is well known that the longer the duration of fasting, the stronger the induction of autophagy, so fasting for 24 hr induces autophagy more than shorter regimens. 6
Many reports have discussed the change in lipogenesis regulators, for example, acetyl CoA carboxylase (ACACA), peroxisome proliferator-activated receptor α (PPAR-α), and peroxisome proliferator-activated receptor γ (PPAR-γ); apoptosis regulators, for example, caspase-3, p53, B-cell lymphoma 2 (Bcl-2); inflammation regulators, for example, cyclo-oxygenase 2 (COX-2); and autophagy markers, for example, microtubule-associated protein 1 light chain 3α (LC3) and sequestrosome (SQSTM)1/p62 when challenged with a high-fat-fructose (HFF) diet.7,8 Others discussed the effect of different fasting regimens on those regulators with basal diet. 9 However, to date, there are few reports that studied the effect of intense short-term ADF on these regulators in the management of already established NASH with matched fed controls to exclude the role of decreased calorie intake.
Aim of the Study
This study aimed to assess the therapeutic effect of short-term ADF on HFF-induced NASH and tried to define the mechanisms of rat liver protection against HFF-induced chemical damage with matched fed controls to exclude the role of decreased calorie intake. For evaluation of the hepatoprotective mechanisms of ADF, alanine aminotransferase (ALT) and lactate dehydrogenase (LDH) levels in serum were measured by colorimetric assay. Liver expression of lipogenesis genes ACACA, PPAR-α, and PPAR-γ; apoptosis-related genes caspase-3, p53, and Bcl-2; and inflammation-related genes COX-2 genes was assessed by quantitative real-time PCR and immunohistochemistry for their proteins in liver with evaluation of immunoexpression of LC3 and P62—autophagy markers. Histopathological changes were evaluated by hematoxylin and eosin (H&E) with NAFLD activity scoring (NAS). Moreover, Oil Red O and Sirius-red staining were performed for liver sections to detect steatosis and fibrosis, respectively, with morphometric analysis of the results. Moreover, a study of the correlation of gene expression changes with histopathological changes was done.
Materials and Methods
Calculation of the Size of Sample
G*Power program was used to measure the size of the sample, following the procedure illustrated by Faul et al. 10 Built on previous studies,11 –16 we hypothesize that the means of the three groups were 0.45, 0.85, and 1.05 for Bcl-2; 1, 2.2, and 4.2 for COX-2; 0.52, 0.75, and 1 for PPAR-α; 1.15, 1.45, and 2 for PPAR-γ; 1.2, 1.8 and 2.2 for p53; 1.05, 1.7, and 2.3 for ACACA; 0.75, 0.82, and 1.25 for caspase-3; and 334, 894, and 1711 for LDH. Suppose the standard deviation was 0.18 for Bcl-2, 0.3 for COX-2, 0.1 for PPAR-α, 0.25 for PPAR-γ, 0.3 for p53, 0.25 for ACACA, 0.15 for caspase-3, and 213 for LDH, the effect size (f) would be 1.3858 for Bcl-2, 4.3998 for COX-2, 1.9602 for PPAR-α, 1.4079 for PPAR-γ, 1.3699 for p53, 2.0418 for ACACA, 1.4737 for caspase-3, and 2.6545 for LDH. Based on these assumptions, samples sizes of 12, 6, 9, 12, 12, 9, 12, and 9 for Bcl-2, COX-2, PPAR-α, PPAR-γ, p53, ACACA, caspase-3, and LDH, respectively, reach 95% power to identify the effect sizes at 5% alpha level, taking into consideration the least effect size (1.3699). One-way ANOVA with the three groups suggests sample sizes of the rats to be 4 per each group. A number of 12 reaches a power of 95% using the F-test to achieve a significance level of 0.050. We started the study with four rats as a negative control, whereas the NASH group had 12 rats. However, four rats from the NASH group were excluded at the ninth week due to death or extreme illness.
Animals, Diet, and Experimental Design
The study design is true experimental in vivo posttest-only control-group design. Sixteen adult male Sprague Dawley (SD) rats, 8–10 weeks old and weighing 250–300 g, were used. All rats were maintained under precise pathogen-free conditions in Medical Experimental Research Center (MERC) and housed in cages (animals were kept under the appropriate conditions of controlled humidity, temperature, and light) with accessible water and food ad libitum with 1 week of acclimatization. The experiments described in this study met the terms of Institutional Research Board (IRB) for animal use, Faculty of Medicine, Mansoura University, Egypt (approval code: R.20.12.1119.R1). Male rats were used because of their higher susceptibility to develop liver steatosis. 17 Rats were divided, in a randomized manner, into two groups: a negative control group with allowed free access to basal diet (10% fat) and water ad libitum (n=4) and the NASH group (n=12) fed on HFF: 40% fat, 40% carbohydrate, 18 and 10% fructose in drinking water for 9 weeks to induce NASH, and then randomized into two groups of either HFF only or HFF and ADF protocol (24-hr feeding and then 24-hr fasting) for the next 3 weeks. To exclude the role of decreased amount of calorie intake in the ADF subgroup, the HFF-alone subgroup was administered matched food intake similar to that measured in ADF rats. In the ADF group, food was removed on fasting days, whereas water intake was provided ad libitum. Weights were measured and recorded for the past 3 weeks. Regarding the safety of the ADF protocol on animals, it has long been used in many studies—even for 12 months in mice 5 —with proven safety and efficacy, so as a trial to limit the use of rats and limit the costs, we did not have to add a fasting control group, confirmed to be safe from these reports.
Blood Sampling
Samples of blood were taken under anesthesia from the retro-orbital sinus of rats at the end of the experiment in tubes with no EDTA. Blood samples were allowed to clot at room temperature, with consequent centrifugation and serum separation and storage at −20C until being examined.
Sacrification
Sacrification of rats was done through cervical dislocation, followed by excision and washing of livers by saline.
ALT and LDH Colorimetric Assays
To evaluate the condition of hepatocytes, serum ALT level and LDH activity were assessed using the ALT assay endpoint kit (MG; cat. no. MG264001) and LDH colorimetric kinetic assay (MG; cat. no. MG283001) and also using the Erba CHEM-7 device. The measurement of ALT was based on monitoring the concentration of pyruvate hydrazone formed through the reaction with 2,4-dinitrophenylhydrazine. The measurement of LDH was based on conversion of pyruvate to
mRNA Measurement by Real-time Reverse Transcription PCR
Liver samples were kept in RNAlater (500 µl was used for each 50 mg tissue sample) (Qiagen, Hilden, Germany), incubated overnight at 2–8C, and then removed from the reagent and transferred to −80C for storage until homogenization through the method described in our previous work. 20 The RNA yield was checked by Thermo Scientific NanoDrop 2000 (USA) for concentration using the absorbance of 260 nm and for purity using 260/280 and 260/230 ratios. Reverse transcription of 1 µg of RNA was performed using SensiFAST cDNA Synthesis Kit (Bioline, London, UK), with the following program (10 min at 25C for primer annealing, 15 min at 42C for reverse transcription, and 5 min at 85C for inactivation) on Applied Biosystems 2720 Thermal Cycler.
cDNA templates were amplified using a real-time PCR instrument (Applied Biosystems 7500). The amplification reaction contained a total reaction volume of 20μl (10μl of HERA SYBR green PCR Master Mix [Willowfort, UK], 2μl of cDNA template, 2μl [10 pmol/ μl] gene primer and 6μl of nuclease-free water), and in accordance with the following programme: 95C for 2 min, 40 cycles of 95C for 10 s, and 60C for 30 s. The primer sequences used are mentioned in Table 1. Glyceraldehyde-3-phosphate dehydrogenase (GAPDH) has been applied as a housekeeping gene. The primer sets were designated using Primer 3 software (v.4.1.0), 21 and primer specificity was determined using the Primer- BLAST program. 22 The specificity of the PCR products was also evaluated by melting curve analysis. Primer sets were synthesized by Vivantis (Vivantis Technologies, Shah Alam, Malaysia).
The Gene Sequence of Rat Primers.
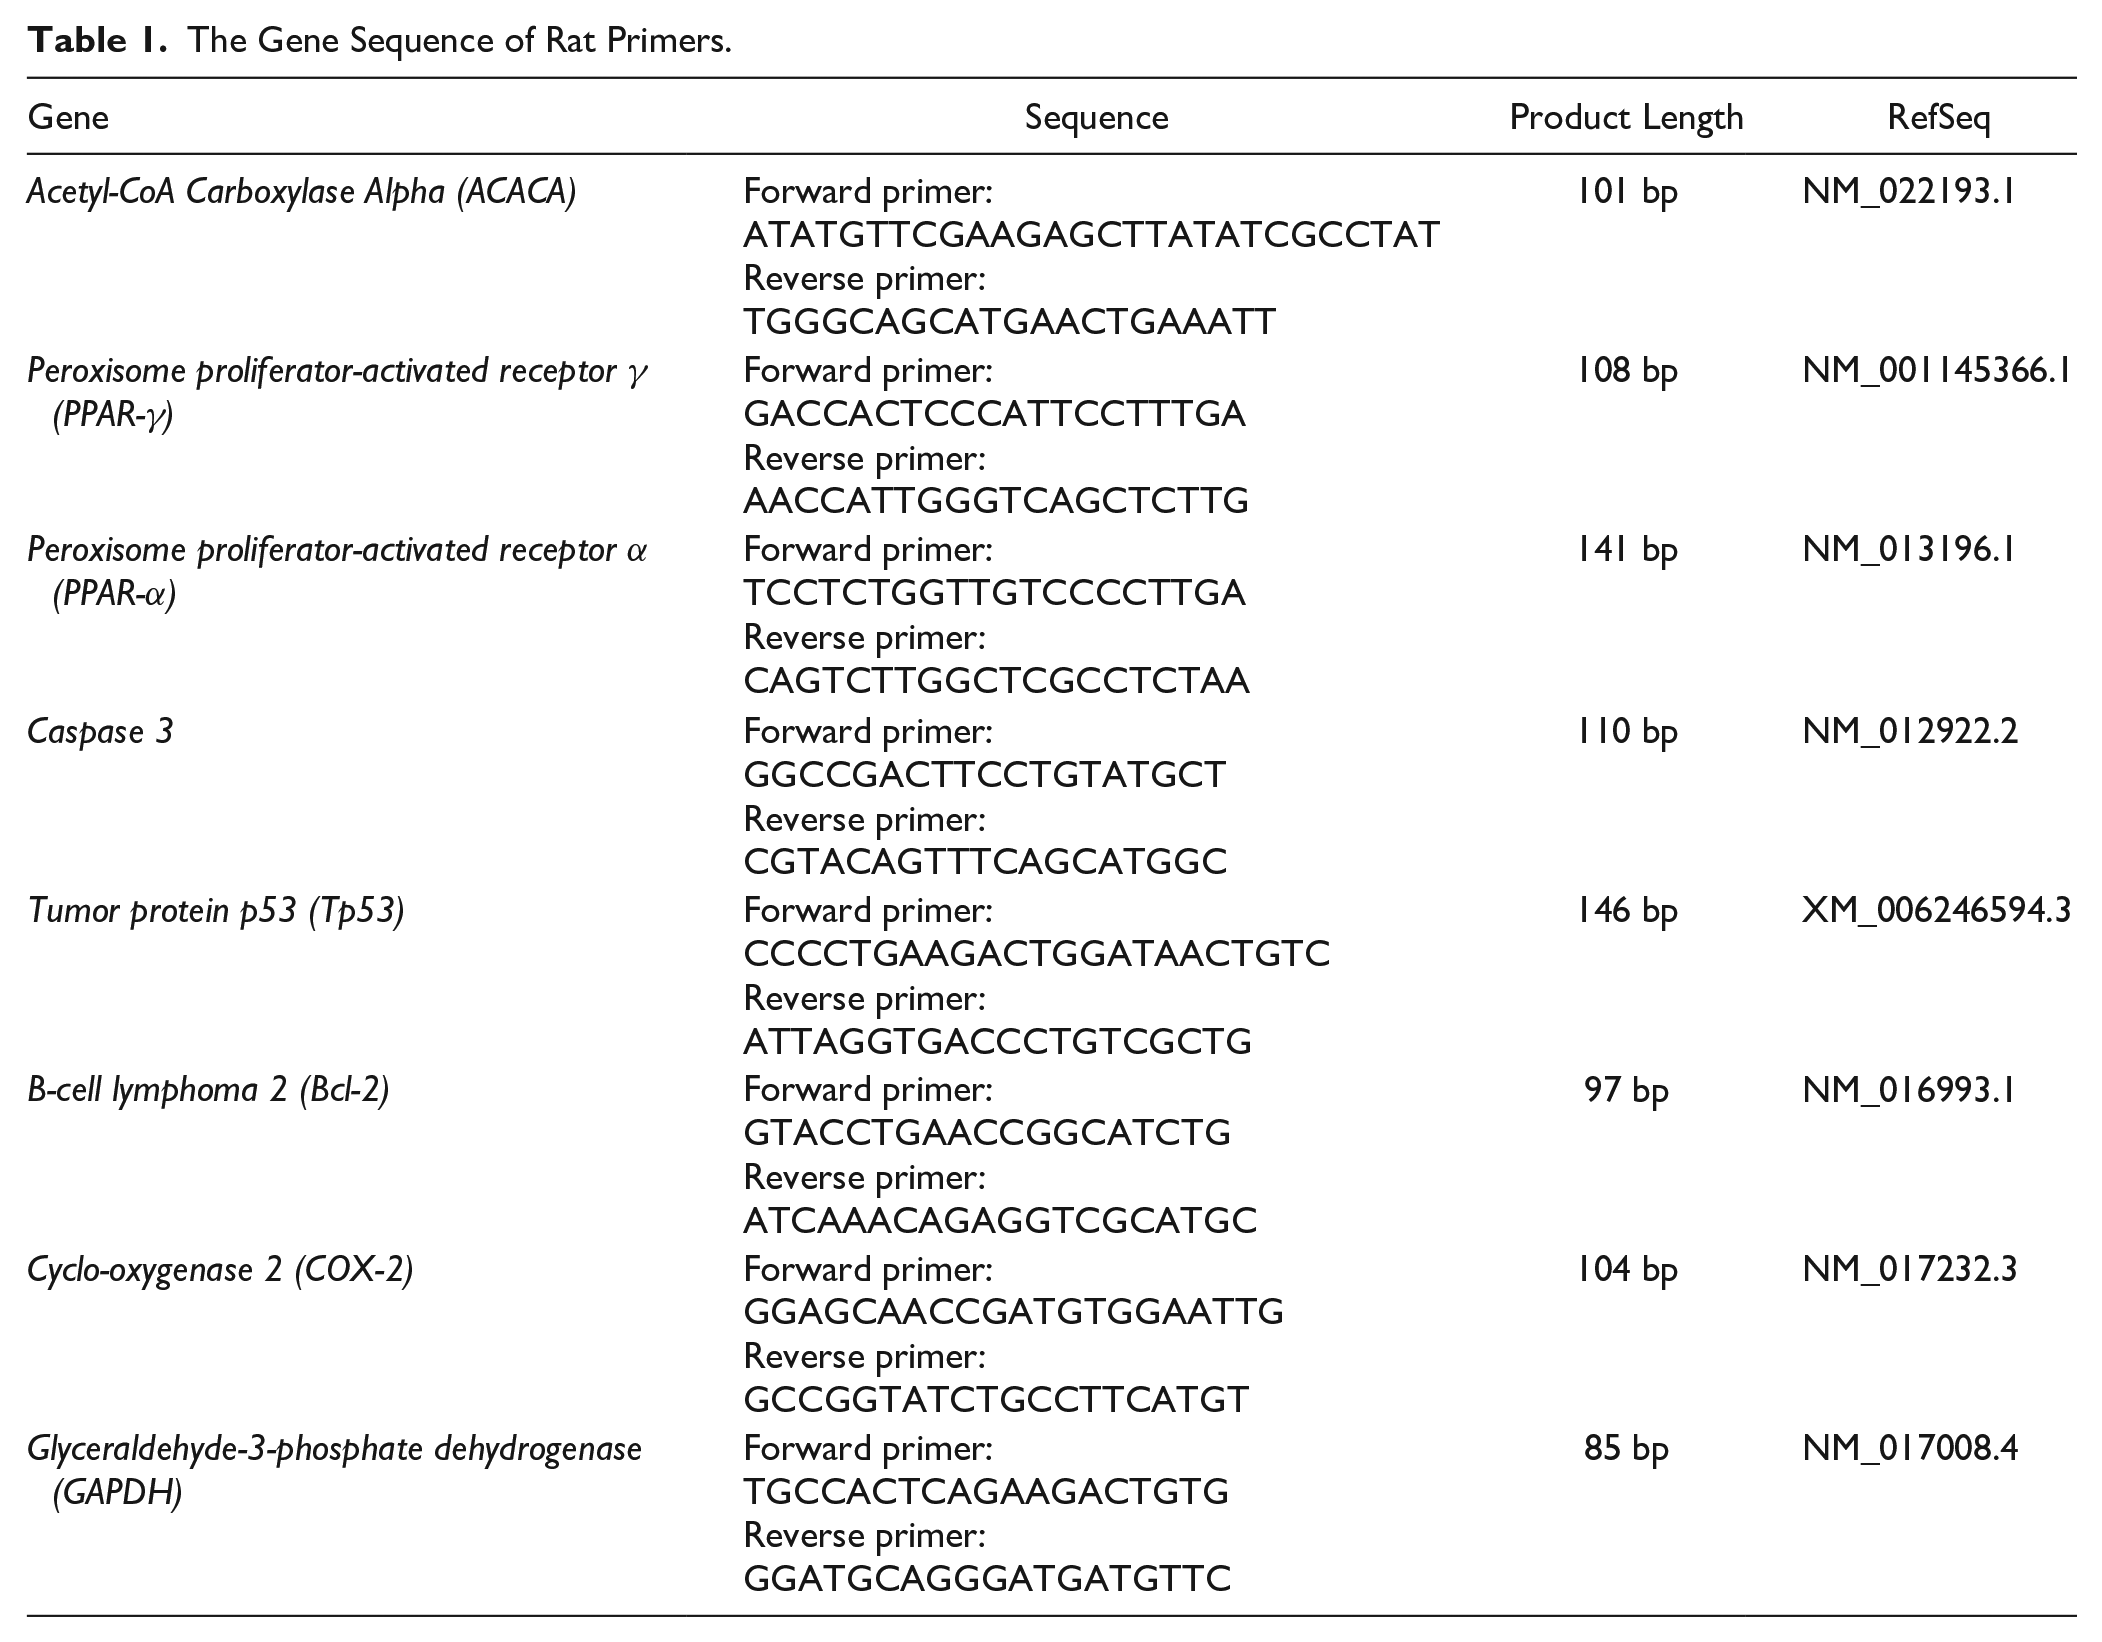
Relative gene expression levels were represented as ΔCt = Ct target gene – Ct housekeeping gene; fold change of gene expression was calculated using the 2−ΔΔCT method. 23 PCR products were run on 3% agarose gels with subsequent visualization and photographing (Figs. 3–6).
Histopathology
A part of each liver was cut and frozen to be used for Oil Red O stain as described by Layman et al. 24 Another part was fixed in 10% formaldehyde and then embedded in paraffin 25 for histopathological examination. Next, the paraffin sections were cut into 7- to 10-µm-thick sections. The sections were stained with H&E and mounted on slides for evaluation of histopathological changes and by Sirius Red to detect the extent of fibrosis; Oil Red O staining was done in fresh frozen sections for detection of lipid droplets. The results were recorded as photomicrographs using an Olympus Microscope with SC100 Color.
NAFLD Activity Scoring
A semi-quantitative NAS was used to assess the severity of NAFLD in 24 simple random non-overlapping fields per group, scattered in the preparations as a representative sample (three fields per each section of two sections per rat for each rat of the four rats per group). Scoring assesses three major histological features: steatosis, hepatocellular ballooning, and inflammation. The total score is defined as the unweighted sum of the scores for steatosis (0–3), lobular inflammation (0–3), and ballooning (0–2), thus ranging from 0 to 8. 26
Immunohistochemical Staining
Immunohistochemistry was performed on 3-μm-thick sections according to the immunoperoxidase technique described in our previous work. 27 Briefly, the tissue sections were submitted for deparaffinization, and to block the endogenous peroxidase, hydrogen peroxide with 0.3% methanol was added to the liver sections for 10 min at room temperature. This was followed by heating the liver sections at 95C in 10 mM citrate buffer for 10 min to stimulate antigen retrieval, and then the sections were left for 60 min to cool. After that, the sections were incubated with the primary antibodies for ACACA, PPAR-γ, PPAR-α, caspase-3, p53, Bcl-2, COX-2, LC3, and P62 overnight at 4C. Table 2 includes the details of the primary antibodies and the dilutions used. This was followed by maintaining the slides with secondary anti-mouse antibody (sc-516102; Santa Cruz, Dallas, USA) for half an hour. Finally, DAB was added for 4 min, and then the sections were counterstained by hematoxylin. For the reagent (no primary antibody) control, PBS was added as a substitute for the primary antibody. Finally, the sections were washed, dehydrated, and examined by light microscope. Dark brown areas in the cytoplasm or nucleus demonstrate positive staining, and the background is blue. Antigen localization was cytoplasmic for the expression of ACACA, caspase-3, Bcl-2, COX-2, LC3, and P62; nuclear for the expression of p53; and finally nuclear and cytoplasmic for the expression of PPAR-γ and PPAR-α.
The Primary Antibodies Applied for Immunohistochemistry.
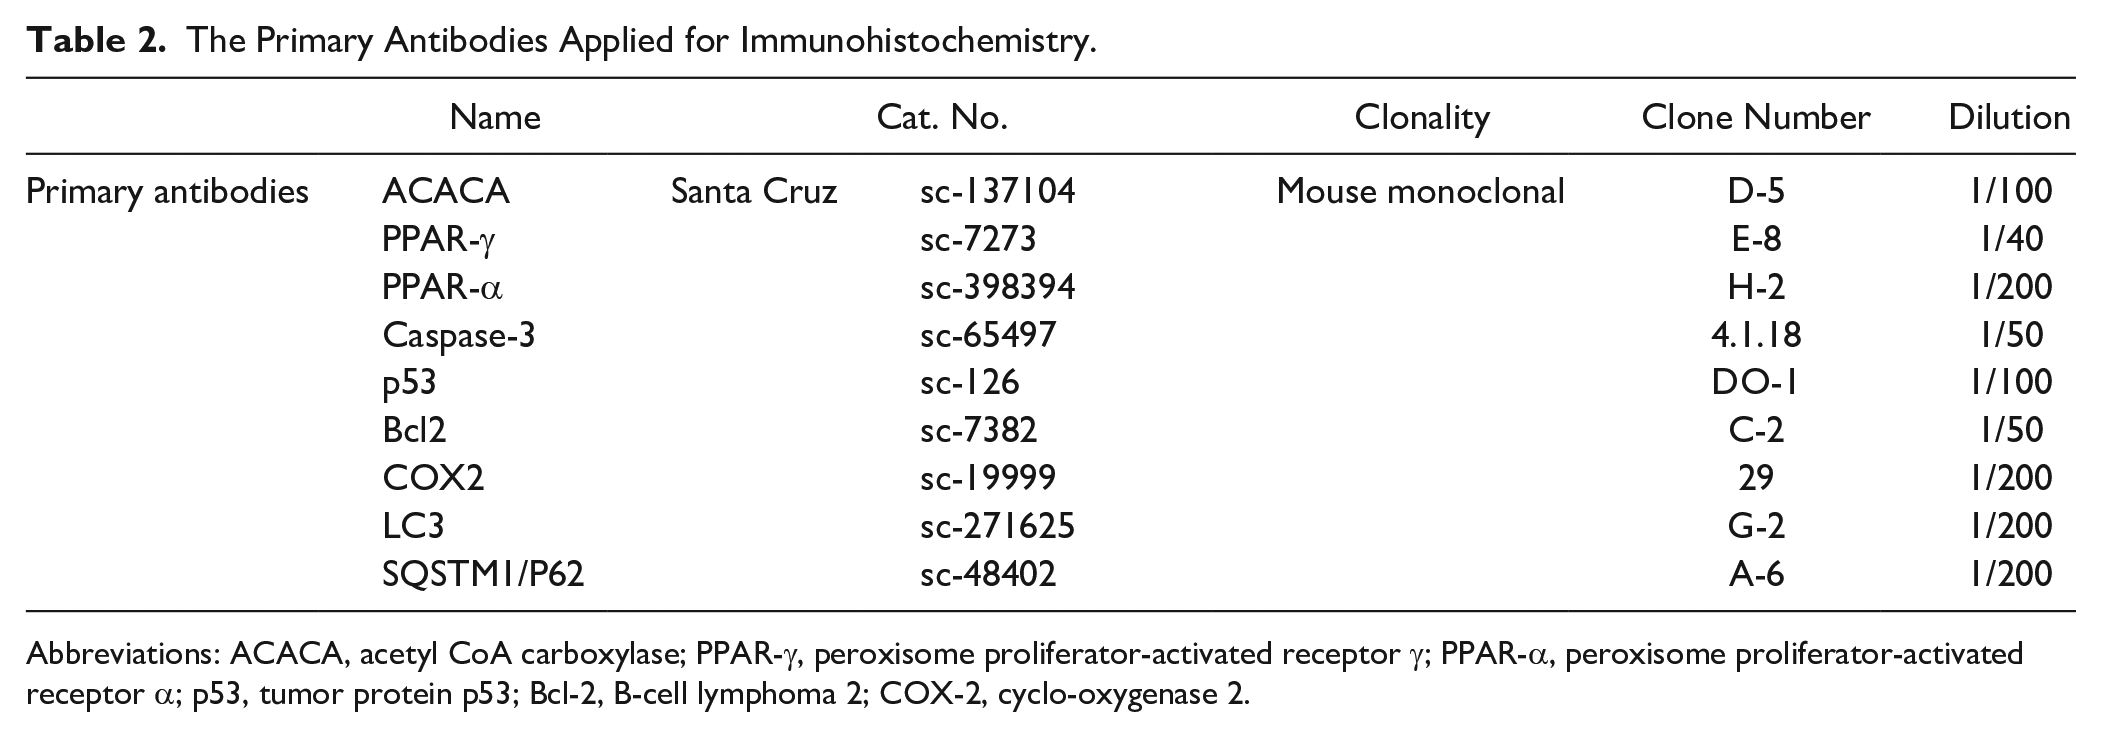
Abbreviations: ACACA, acetyl CoA carboxylase; PPAR-γ, peroxisome proliferator-activated receptor γ; PPAR-α, peroxisome proliferator-activated receptor α; p53, tumor protein p53; Bcl-2, B-cell lymphoma 2; COX-2, cyclo-oxygenase 2.
Morphometric Analysis
Morphometric analysis of area fraction of fat stained by Oil Red O and collagen stained by Sirius Red was performed using ImageJ software Version 1.52a 28 and Fiji ImageJ software. 29 In brief, to isolate red-stained collagen or fat, we changed the image type to RGB Stack that yields the gray-scale images of the channels (Image → Type → RGB Stack). In the Green channel, we set the threshold at 0–87 (Image → Adjust → Threshold). We recorded the area, area fraction, limit to threshold, and display label (Analyze → Measure). Moreover, the immunohistochemical results were assessed by counting the number of immunopositive cells (brown nuclei in PPARs and p53 and brown cytoplasm in other proteins) in the whole high-power field (×400) of a total of 24 simple random non-overlapping fields per group, scattered in the preparations as a representative sample (three fields per each section of two sections per rat for each rat of the four rats per group) and then measuring the percentage of number of positive cells to the total number of cells in the field.
Statistical Analysis
Data were entered and analyzed using SPSS (IBM Corp. Released 2017. IBM SPSS Statistics for Windows, Version 25.0. Armonk, NY: IBM Corp.). Quantitative data were initially tested for normality using Shapiro–Wilk’s test, with data being normally distributed if p>0.050. The presence of significant outliers was tested for by examining boxplots. Normally distributed quantitative data were expressed as mean ± standard error (SE), whereas quantitative non-normally distributed and ordinal data were expressed as median (range). To compare the quantitative data between the studied groups, one-way ANOVA was used. Post hoc assessment was applied for proper comparison between the data. Tukey adjustment was used to check the assumption of equal variances, whereas Games-Howell adjustment was used when assumption of equal variances was violated. Kruskal–Wallis H-test with pairwise comparisons was used to compare ordinal data between the three study groups. Pearson’s correlation was used to assess the strength and to evaluate the direction of a linear relationship between the continuous variables when having normally distributed values. Spearman’s correlation was applied to assess the strength and to evaluate the direction of a linear relationship between continuous and ordinal variables. The results were thought to be significant, for any test used, when p value was ≤0.050.
Results
Assessment of Weight Change
During the last 3 weeks of the experiment (after admitting for the ADF protocol), the NASH group exhibited the faster body weight gain and significant greater final body weights when compared with the negative control group (p=0.018). However, the ADF regimen caused insignificant change when compared with the NASH group (p=1.000). Moreover, the ADF group did not show a significant difference from the negative group (p=0.150) (Table 3).
Percentage of Weight Change in the Studied Groups.
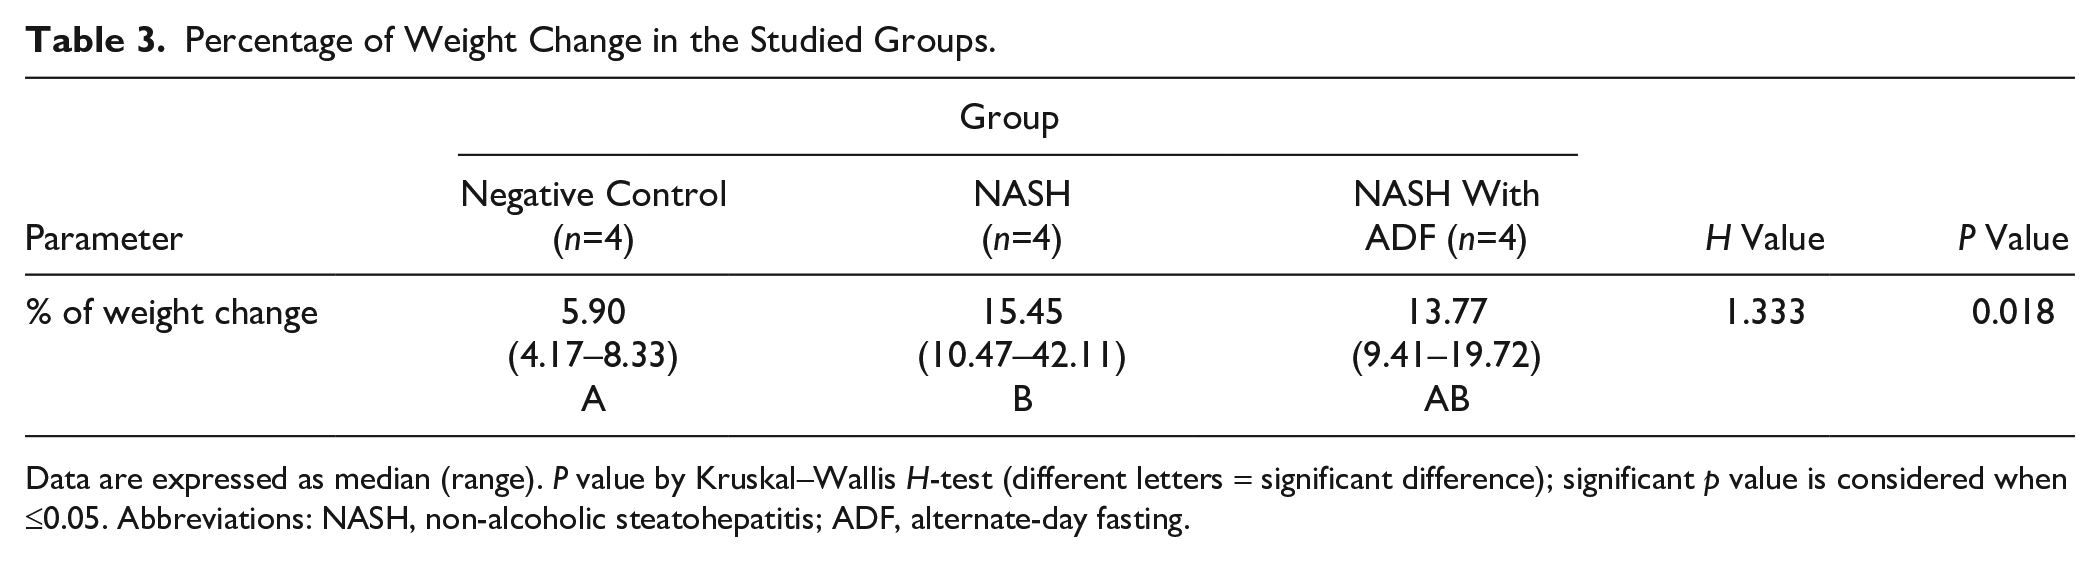
Data are expressed as median (range). P value by Kruskal–Wallis H-test (different letters = significant difference); significant p value is considered when ≤0.05. Abbreviations: NASH, non-alcoholic steatohepatitis; ADF, alternate-day fasting.
Effect of ADF on Serum ALT and LDH
The effect of ADF on HFF-related NASH in rats was evaluated by changes in serum ALT and LDH in Table 4. Regarding serum ALT, it showed a highly significant increase in the NASH group compared with the negative control group (p<0.0005) and showed another significant increase in the ADF group when compared with the NASH group (p=0.001). In addition, compared with the negative control group, serum ALT level in the ADF group showed a high significant increase (p<0.0005). Moreover, Games-Howell pairwise comparisons demonstrated that LDH showed a high significant increase in the NASH group compared with the negative control group (p<0.0005). This finding was inverted in the ADF group, displaying a significant decrease in serum LDH when compared with the NASH non-treated group (p<0.0005), but there was a non-significant difference between the ADF group and the negative control group (p=0.997).
Serum Levels of ALT and ADH in the Studied Groups.
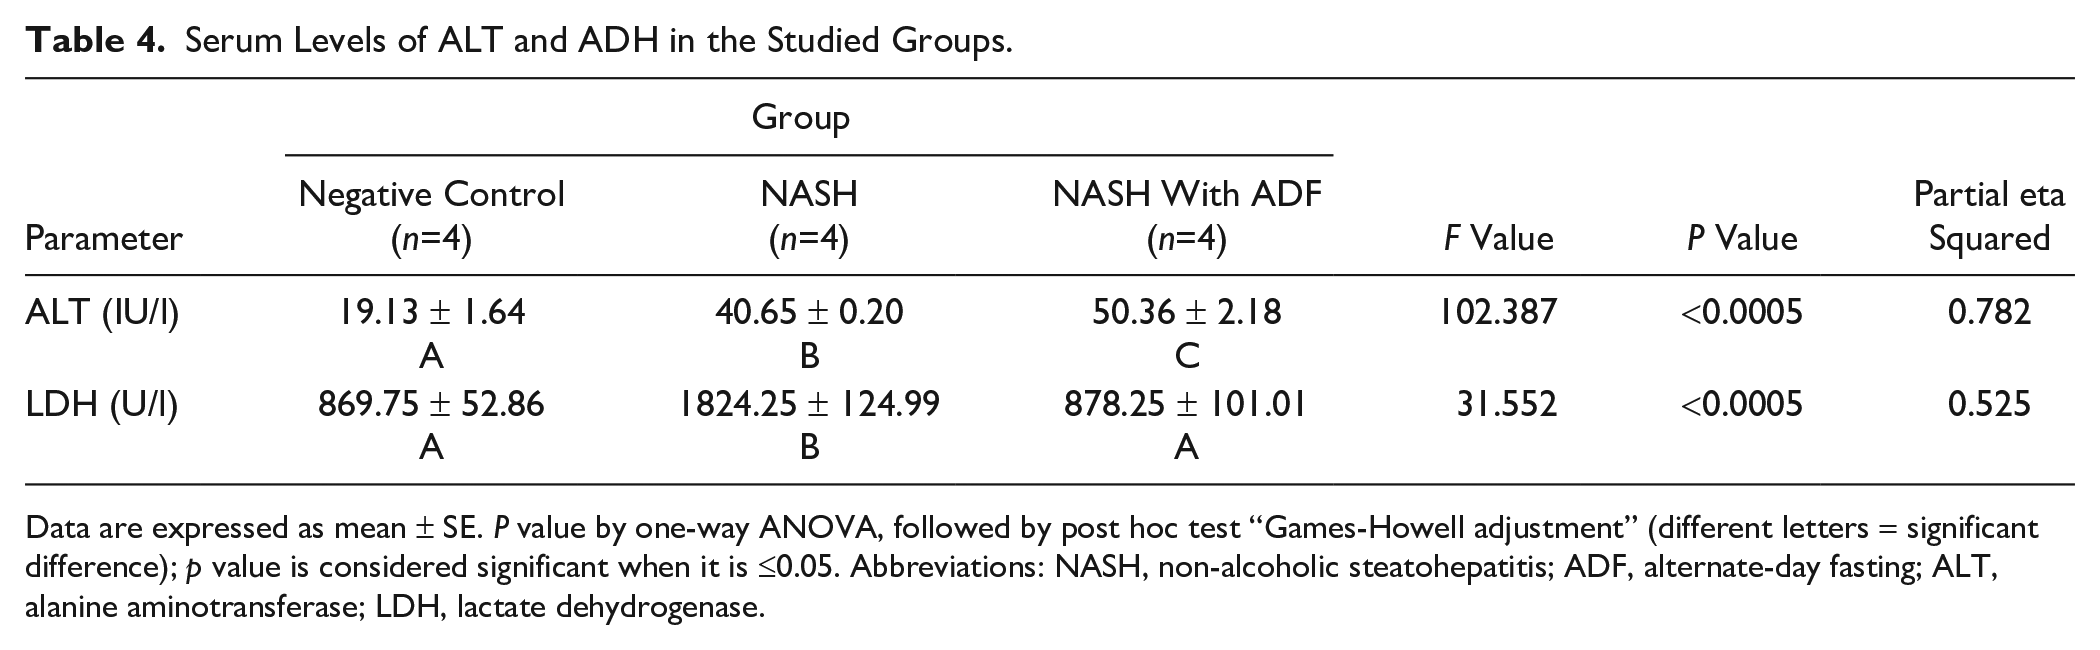
Data are expressed as mean ± SE. P value by one-way ANOVA, followed by post hoc test “Games-Howell adjustment” (different letters = significant difference); p value is considered significant when it is ≤0.05. Abbreviations: NASH, non-alcoholic steatohepatitis; ADF, alternate-day fasting; ALT, alanine aminotransferase; LDH, lactate dehydrogenase.
Establishment of NASH Model and Studying the Effect of ADF on Gross and Histopathological Changes
The livers of rats fed HFF diet established the pathological characters of NASH according to NAS, with variable grades of steatosis, hepatocellular ballooning, and inflammation. Livers of the NASH group are swollen with yellowish tinge, which is corrected by ADF. The negative control group shows the normal liver architecture, whereas the NASH group shows widespread macrovesicular and microvesicular steatosis with ballooning, as well as inflammatory cells that were more centrilobular. However, ADF reduced macrovesicular steatosis with less ballooning and microvesicular steatosis and inflammation (Fig. 1). Oil Red O staining showed extensive reaction for fat in the high-fat diet (HFD) group with moderate reaction in the ADF group. Sirius Red staining showed a strong staining for collagen fibers in the periportal and perivenous areas with multiple septa in the HFD group with moderate staining in the ADF group (Fig. 2).
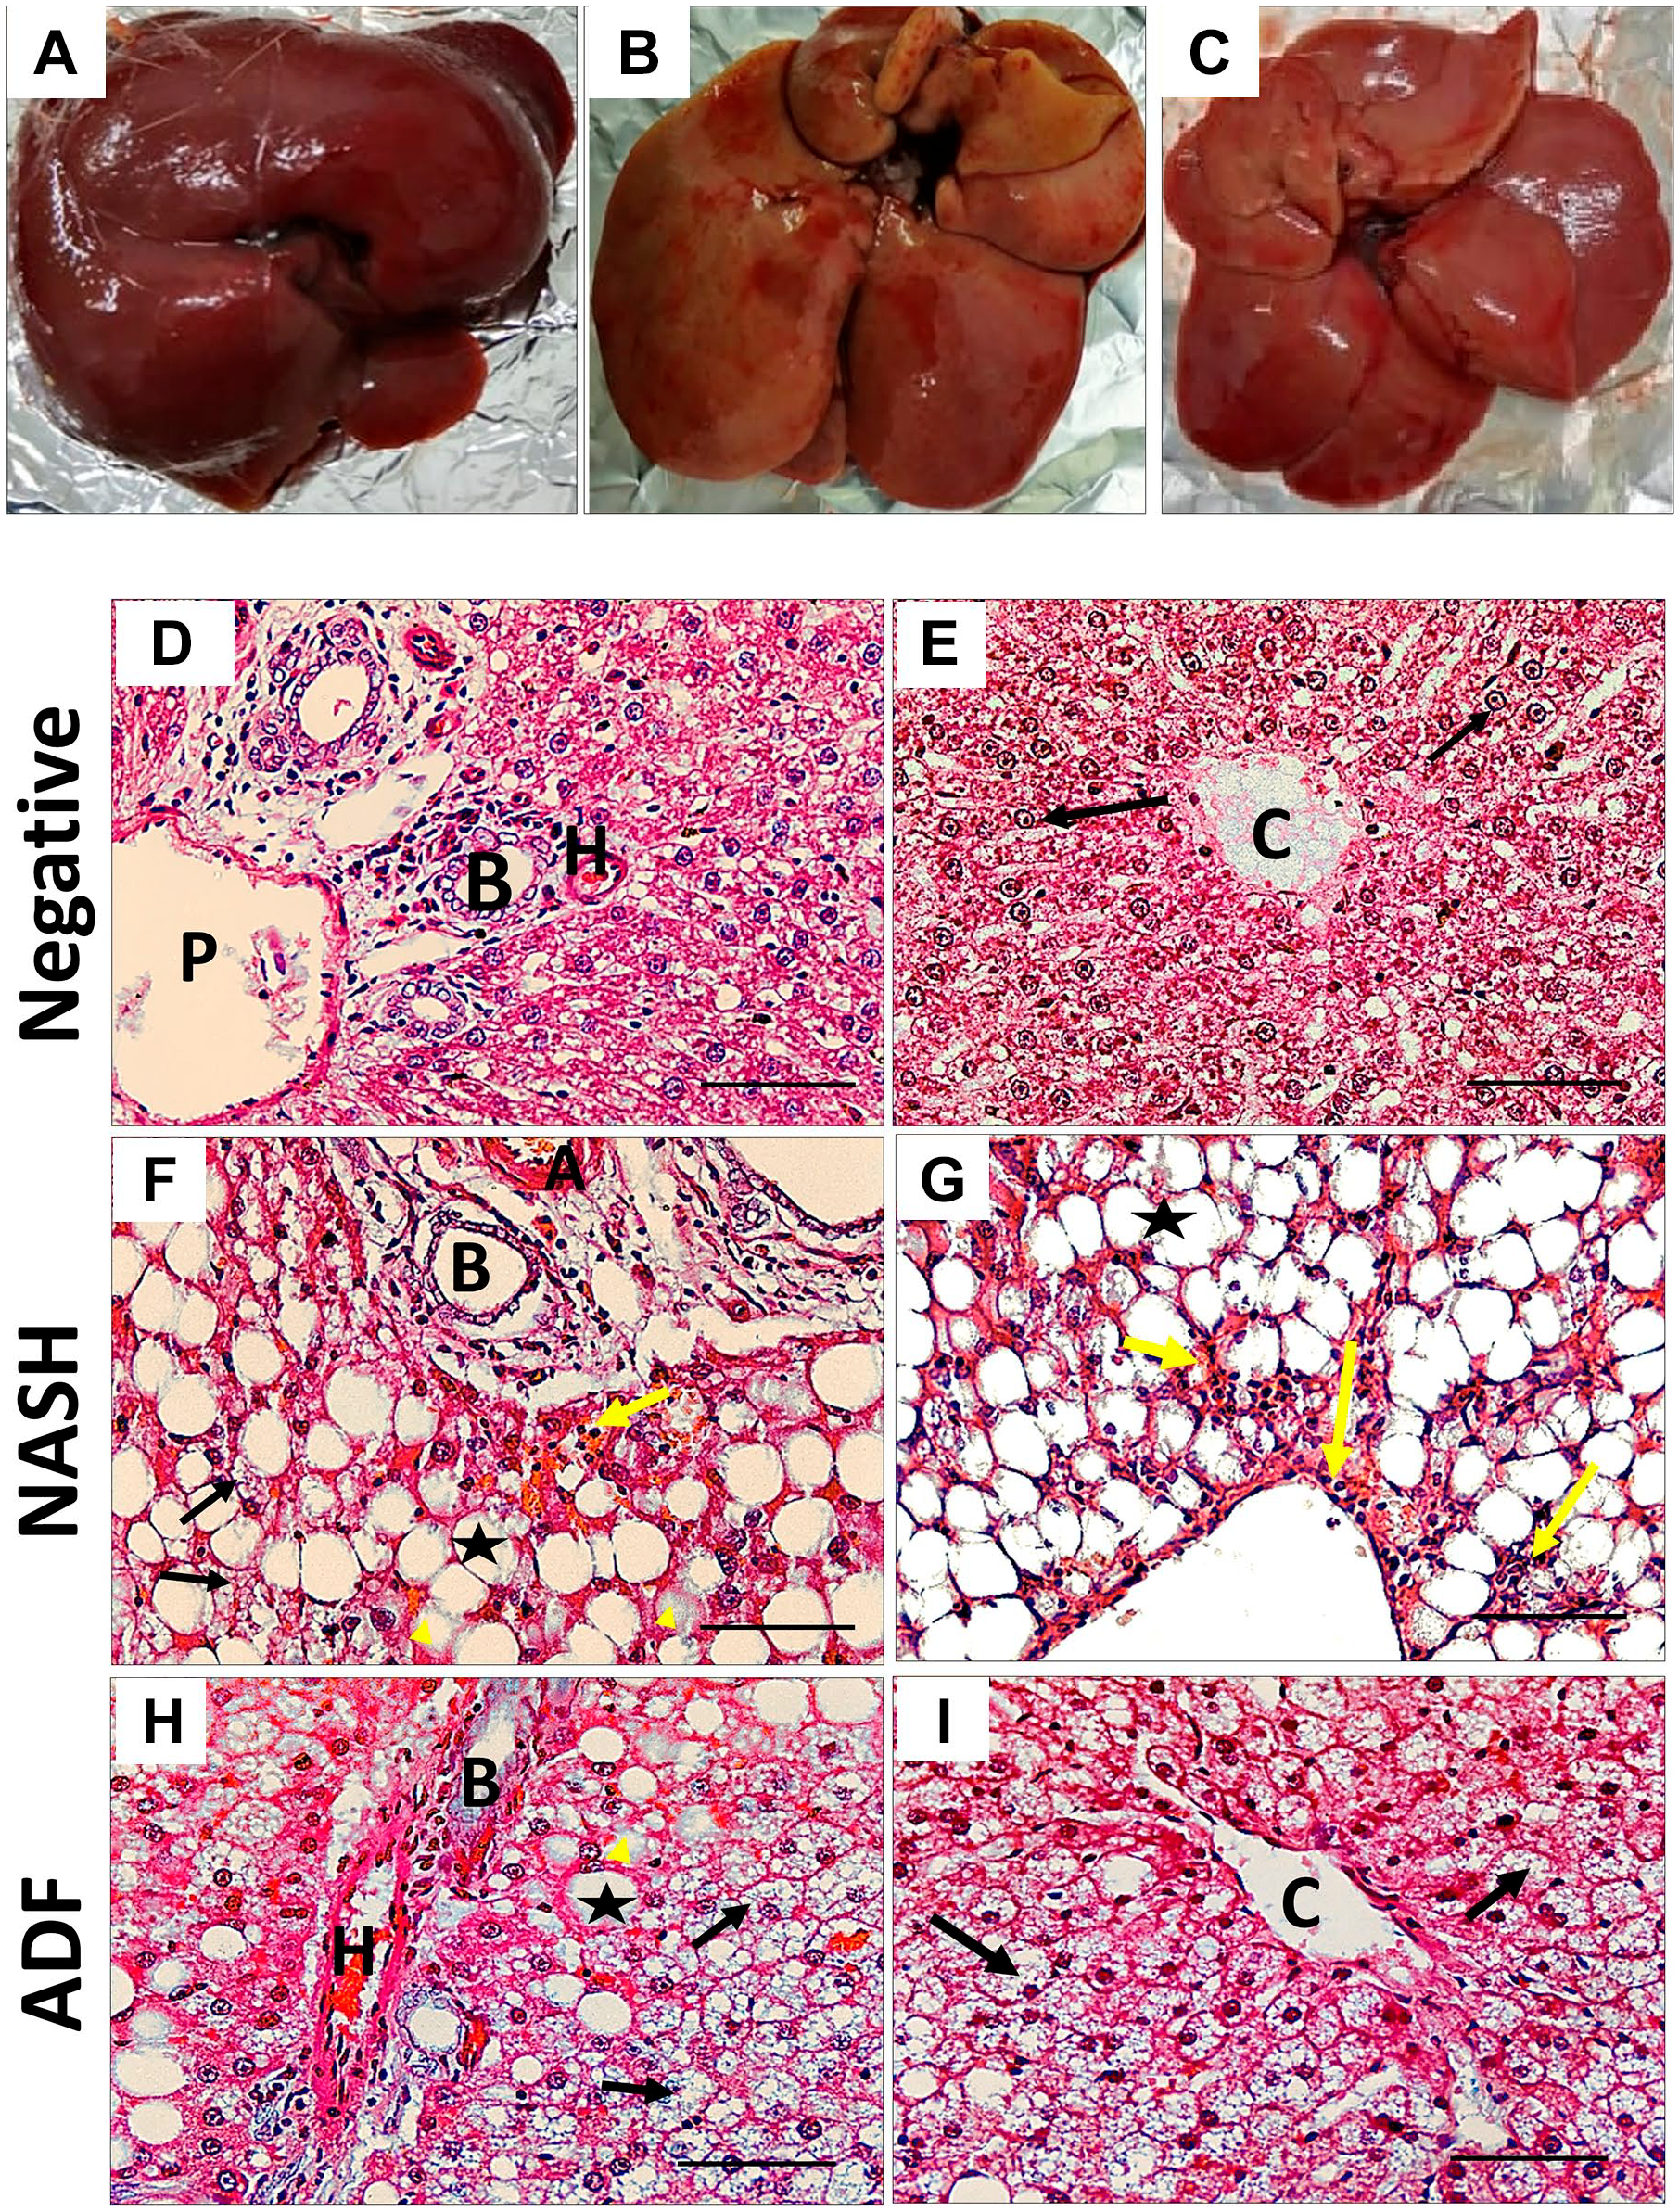
Representative photographs of liver gross appearance (A, B, and C). (A) Negative control rats, (B) HFF diet–induced NASH group, and (C) ADF group. NASH livers are swollen with yellowish tinge, which is corrected by ADF. Hematoxylin and eosin (H&E) staining (×400) in the periportal region (D, F, and H) and the centrilobular region (E, G, and I). Scale bar = 50 µm. H&E of the negative control group shows normal liver architecture (D and E) with cords of hepatocytes radiating from the central vein (black arrows), whereas the NASH group (F and G) demonstrates diffuse macrovesicular steatosis (asterisks), ballooned hepatocytes (yellow arrow head), microvesicular steatosis (black arrows), and inflammatory cells (yellow arrows) that were more centrilobular (G). However, ADF (H and I) reduced macrovesicular steatosis (asterisks), few ballooned hepatocytes (yellow arrow head), steatosis (black arrows), and inflammation. Abbreviations: HFF, high-fat-fructose; NASH, non-alcoholic steatohepatitis; ADF, alternate-day fasting; H, hepatic artery; P, portal vein; B, bile duct; C, central vein
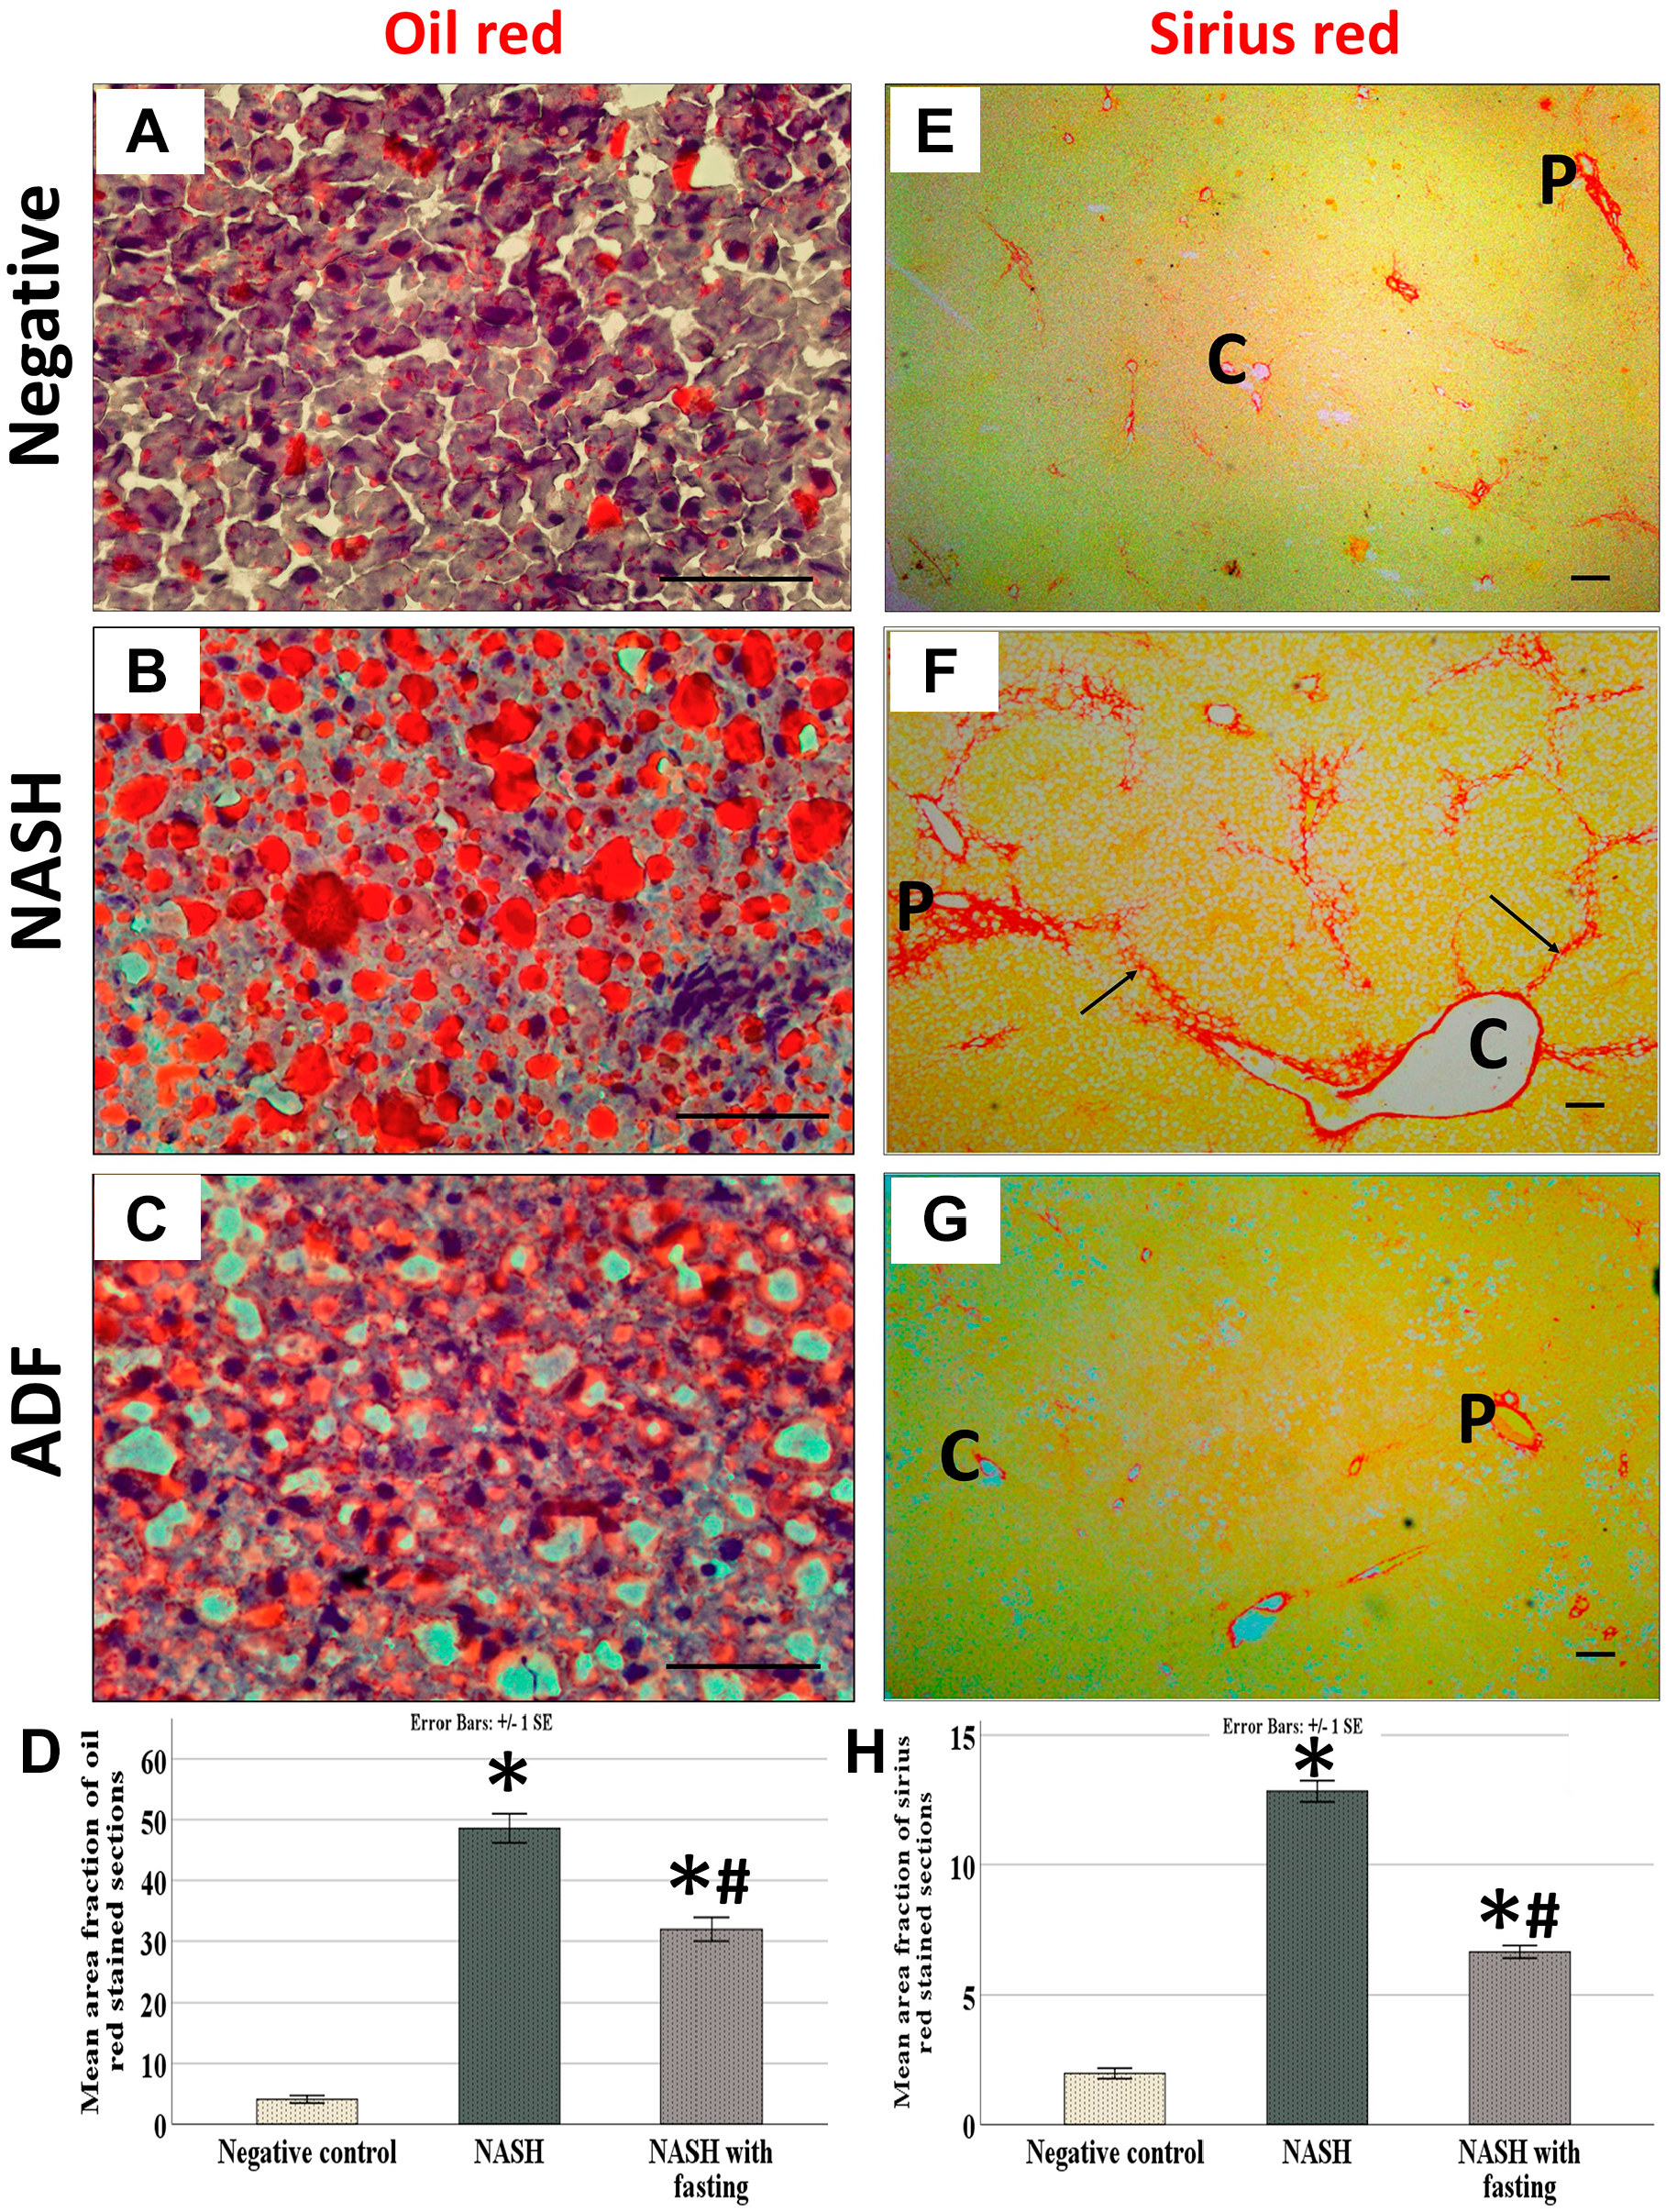
Oil Red O–stained section (×400) (A, B, and C) and Sirius Red–stained section (×100) magnification (E, F, and G). Scale bar = 50 µm. Negative control rats (A and E). HFF diet–induced NASH group (B and F) and ADF group (C and G). Note the mild reaction for fat in the negative control group (A) and strong reaction for fat in the NASH group (B) with moderate reaction in the ADF group (C). Note the mild reaction for collagen in periportal (P) and perivenous (C) areas (E), the strong reaction for collagen in the NASH group (F) around portal tract and central vein with multiple septa (black arrows), and the moderate staining in the ADF group (G). Area percentage of Oil Red O–stained sections (D) and area percentage of Sirius Red–stained sections (H). Data are expressed as mean ± SD (n=4/group). P value by one-way ANOVA, followed by post hoc test “Tukey adjustment” is presented (different letters = significant difference). P value is considered significant when it is ≤0.05. For Oil Red, p<0.0005, F = 151.824, and partial eta squared = 0.971, whereas for Sirius Red, p<0.0005, F = 328.789 and partial eta squared = 0.986. Abbreviations: HFF, high-fat-fructose; NASH, non-alcoholic steatohepatitis; ADF, alternate-day fasting.
Results of NAS and Morphometric Analysis for Sirius Red–stained and Oil Red O–stained Area
There was a statistically significant difference in NAS and morphometric analysis for Sirius Red–stained and Oil Red O–stained area between the three groups (p<0.0005). Games-Howell post hoc comparison for the NAFLD scoring results revealed significantly increased values in the NASH group (p=0.005), with significant decrease in the NASH group treated with ADF compared with the NASH group (p=0.043); moreover, comparing the ADF group with the negative control group showed a high significant difference (p<0.0005). The NASH group shows more steatosis (p<0.0005), ballooning (p<0.0005), and inflammatory cells (p<0.0005) compared with the negative control. However, ADF reduced the steatosis (p=0.002) with less ballooning (p=0.120) and inflammation (p=0.036) when compared with the NASH group (Table 5). Tukey post hoc comparison for the Oil Red and Sirius Red analysis showed a high significant increase in the NASH group when compared with the negative control group (p<0.0005 for both); also, there was a high significant decrease in the ADF group compared with the NASH group (p<0.0005 for both) and a high significant difference between the ADF group and the negative control group (p<0.0005 for both) (Fig. 2).
Results of NAS.
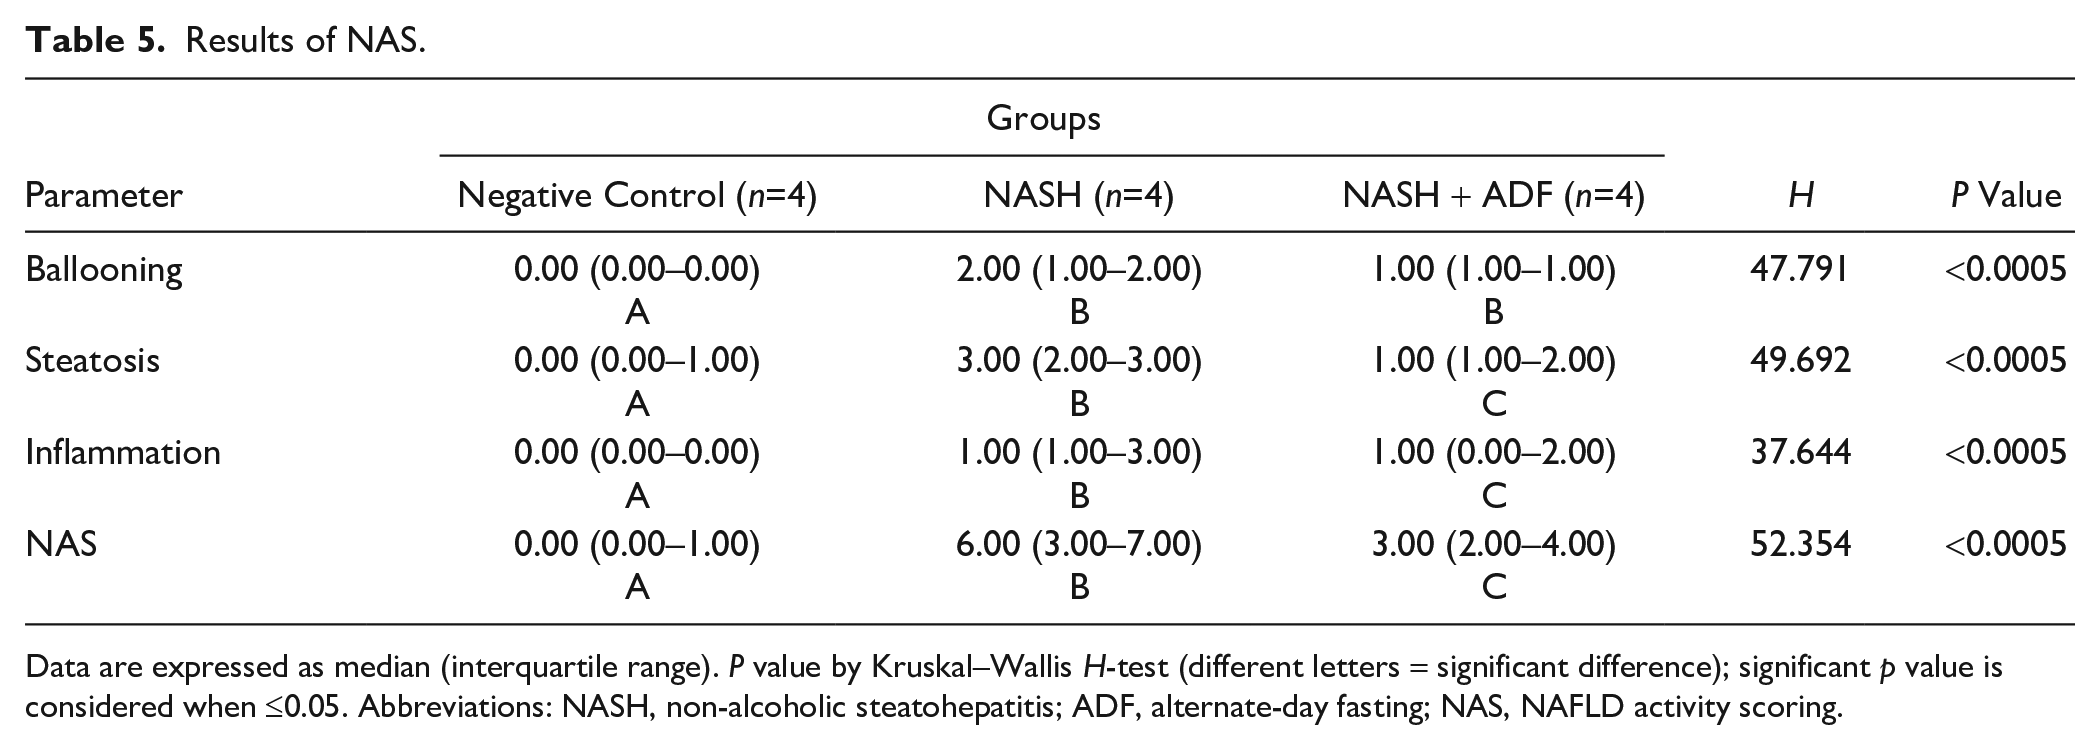
Data are expressed as median (interquartile range). P value by Kruskal–Wallis H-test (different letters = significant difference); significant p value is considered when ≤0.05. Abbreviations: NASH, non-alcoholic steatohepatitis; ADF, alternate-day fasting; NAS, NAFLD activity scoring.
Immunohistochemical Results
Immunohistochemical detection of lipogenesis proteins ACACA, PPAR-γ, and PPAR-α in the liver sections of the negative control group showed a weak immunoreactivity. Noticeable, hepatocytes of the NASH group showed an intense cytoplasmic expression of ACACA and nuclear and cytoplasmic expression of PPAR-γ and PPAR-α. In contrast, hepatocellular immunoreactivity was ameliorated in the ADF group (Figs. 3 and 4). Immunohistochemical detection of apoptosis-related proteins caspase-3, p53, Bcl-2, and inflammatory COX-2 in liver sections of the negative control group showed a weak immunoreactivity. Noticeable, livers of the NASH group showed an intense cytoplasmic expression for caspase-3, Bcl-2, and COX-2. Caspase-3- and COX-2-positive staining was seen in the ballooned hepatocytes and inflammatory cells, too, with positive p53 nuclear immunoreaction in the hepatocytes. In contrast, this immunoreactivity was ameliorated in the ADF group (Figs. 4–6). Immunohistochemical detection of autophagy markers LC3 and P62 in liver sections of the negative control group showed a weak immunoreactivity. Noticeable, hepatocytes of the NASH group showed a weak cytoplasmic expression for LC3 with an intense cytoplasmic expression for P62. In contrast, the ADF group showed a strong expression for LC3 with a weak expression for P62 (Fig. 7).
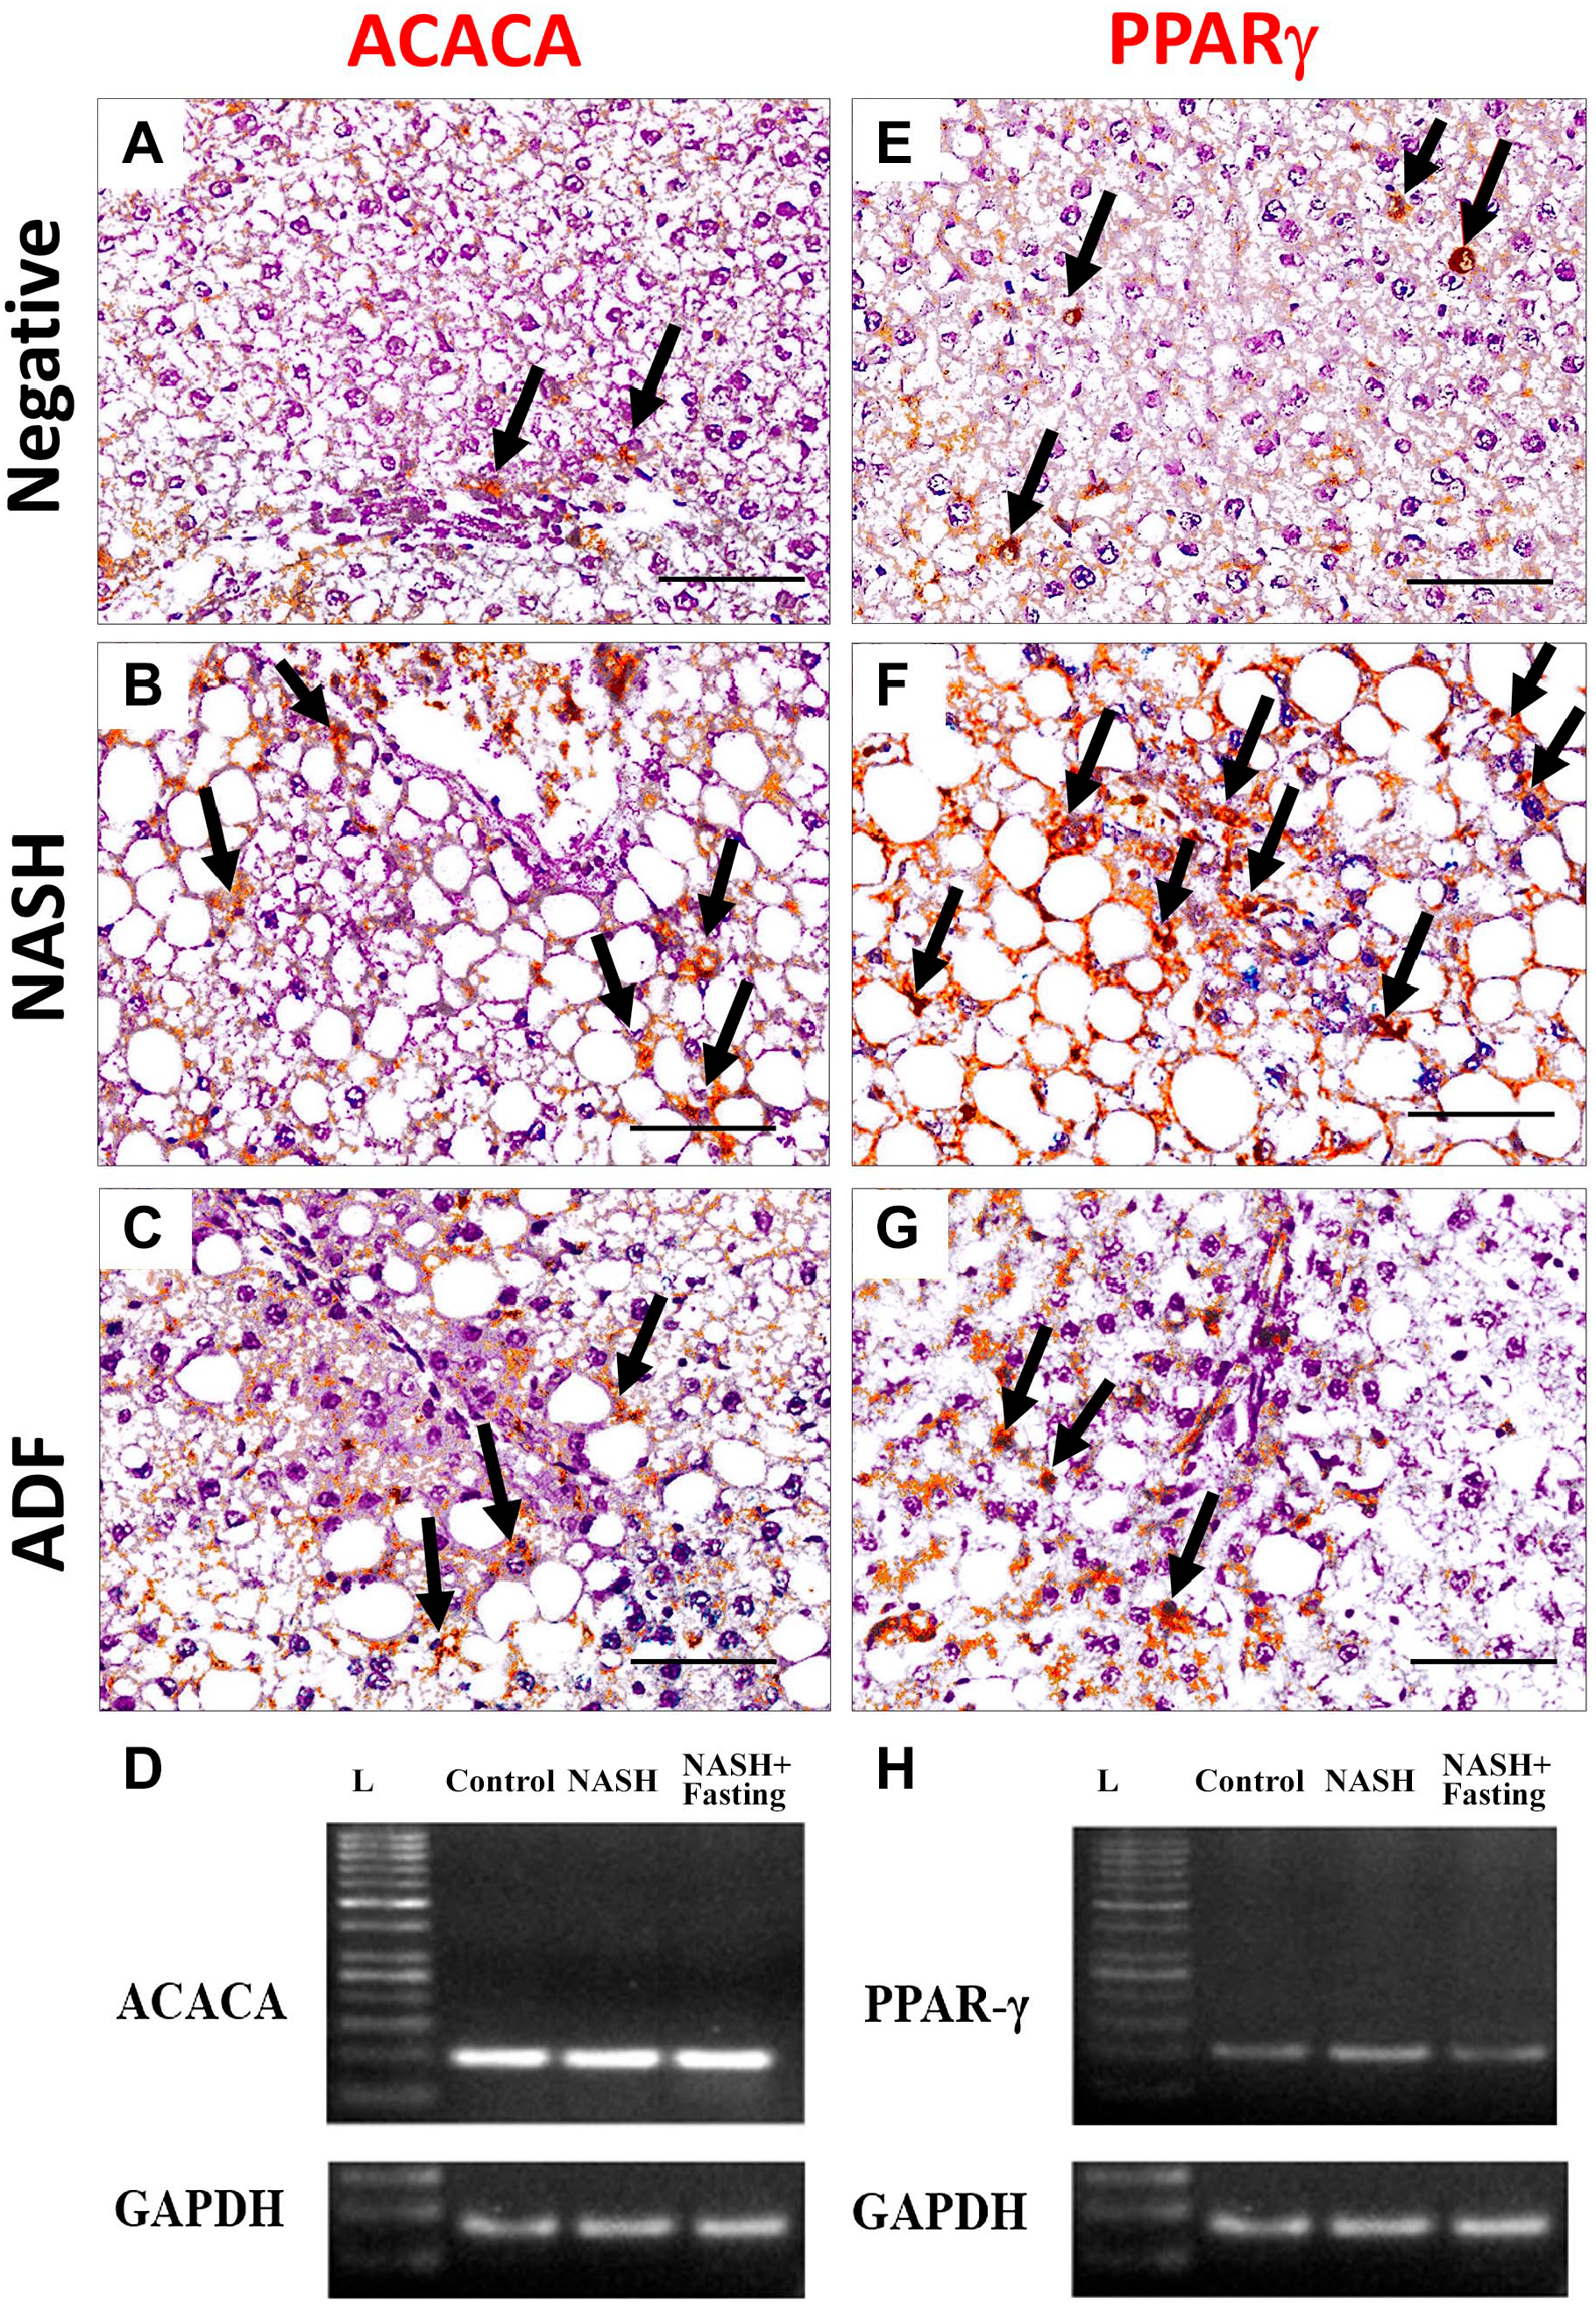
Immunohistochemical staining for lipogenesis markers ACACA (A, B, and C) and PPAR-γ (E, F and G) in liver tissues in negative, NASH, and ADF groups. Magnification, ×400. Scale bar = 50 µm. Arrows: immunopositive cells. Gel photographs of the studied genes ACACA (D) and PPAR-γ (H). ACACA qPCR product (101 bp), PPAR-γ (108 bp), and GAPDH (85 bp). N.B.: Image of GAPDH gel electrophoresis was repeated with images of other genes as it was used as a control gene. Abbreviations: L, ladder NASH, non-alcoholic steatohepatitis; ADF, alternate-day fasting; ACACA, acetyl CoA carboxylase; PPAR-γ, peroxisome proliferator-activated receptor γ; GAPDH, glyceraldehyde-3-phosphate dehydrogenase.
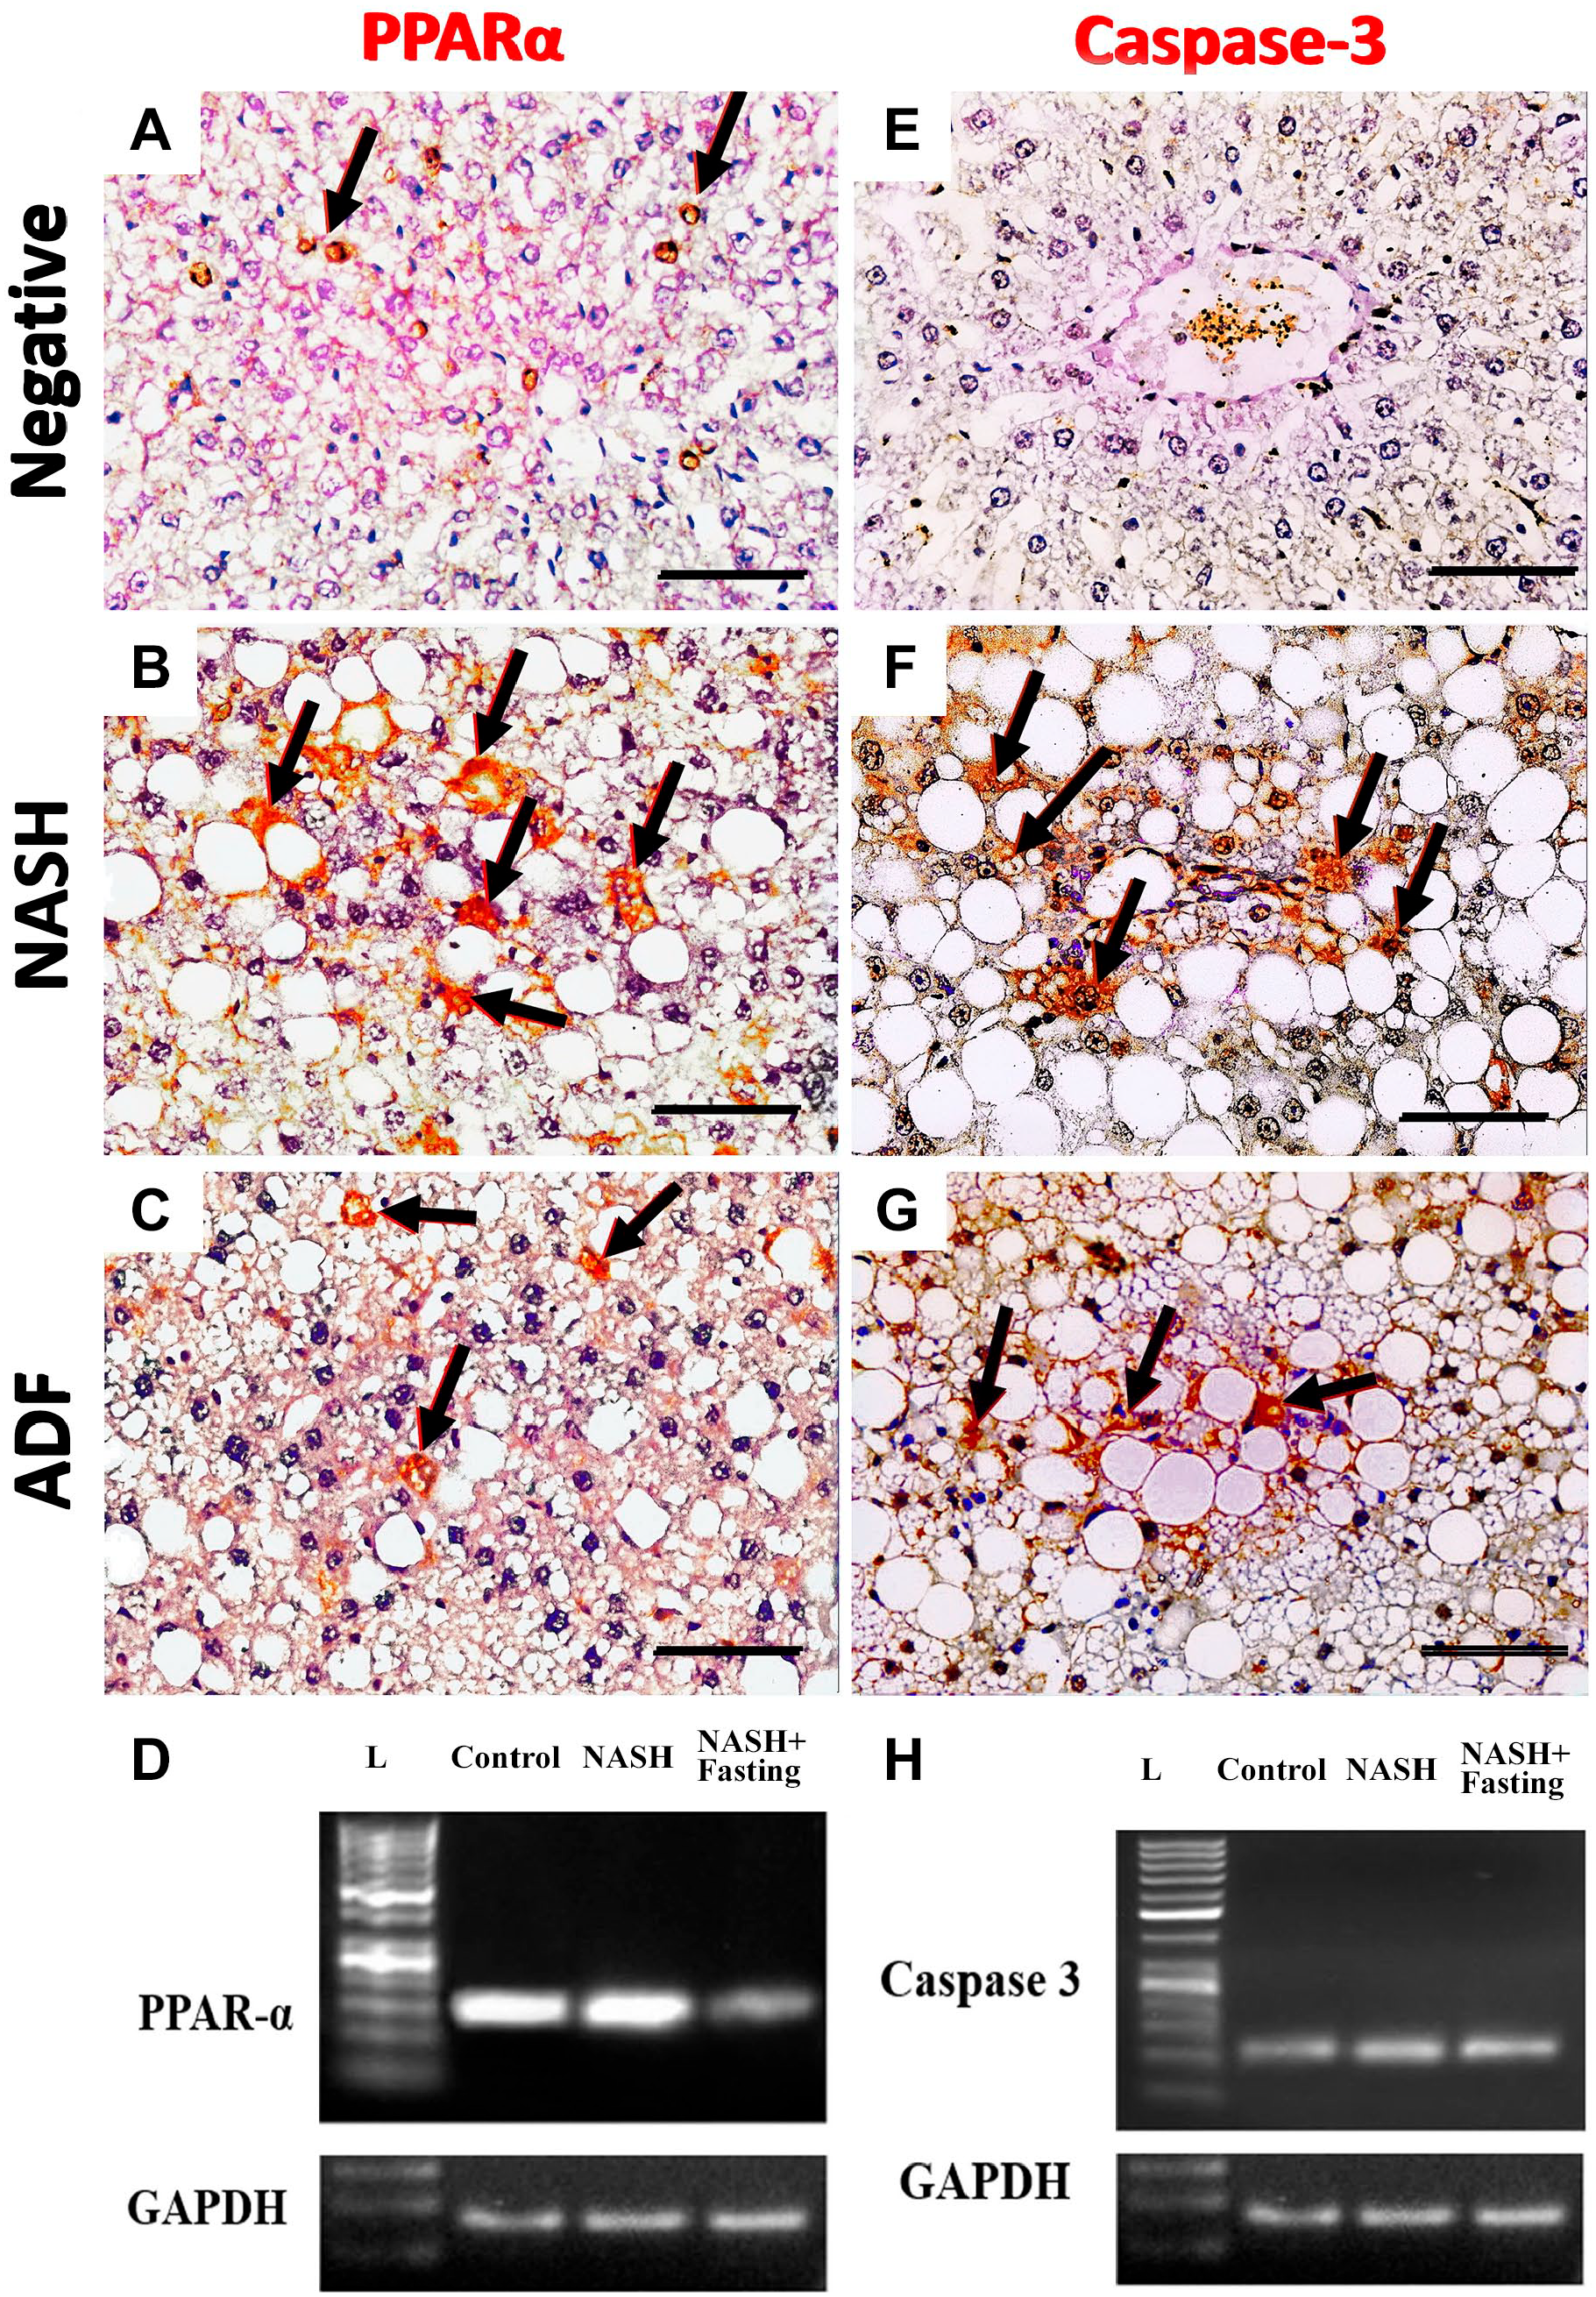
Immunohistochemical staining for lipogenesis marker PPAR-α (A, B, and C) and apoptotic marker caspase-3 (E, F, and G) in liver tissues in negative, NASH, and ADF groups. Magnification, ×400. Scale bar = 50 µm. Arrows: immunopositive cells. Gel photographs of the studied genes PPAR-α (D) and caspase-3 (H). PPAR-α qPCR product (141 bp), caspase-3 (110 bp), and GAPDH (85 bp). Image of GAPDH gel electrophoresis was repeated with images of other genes as it was used as a control gene. Abbreviations: L, ladder; NASH, non-alcoholic steatohepatitis; ADF, alternate-day fasting; PPAR-α, peroxisome proliferator-activated receptor-α; GAPDH, glyceraldehyde-3-phosphate dehydrogenase.
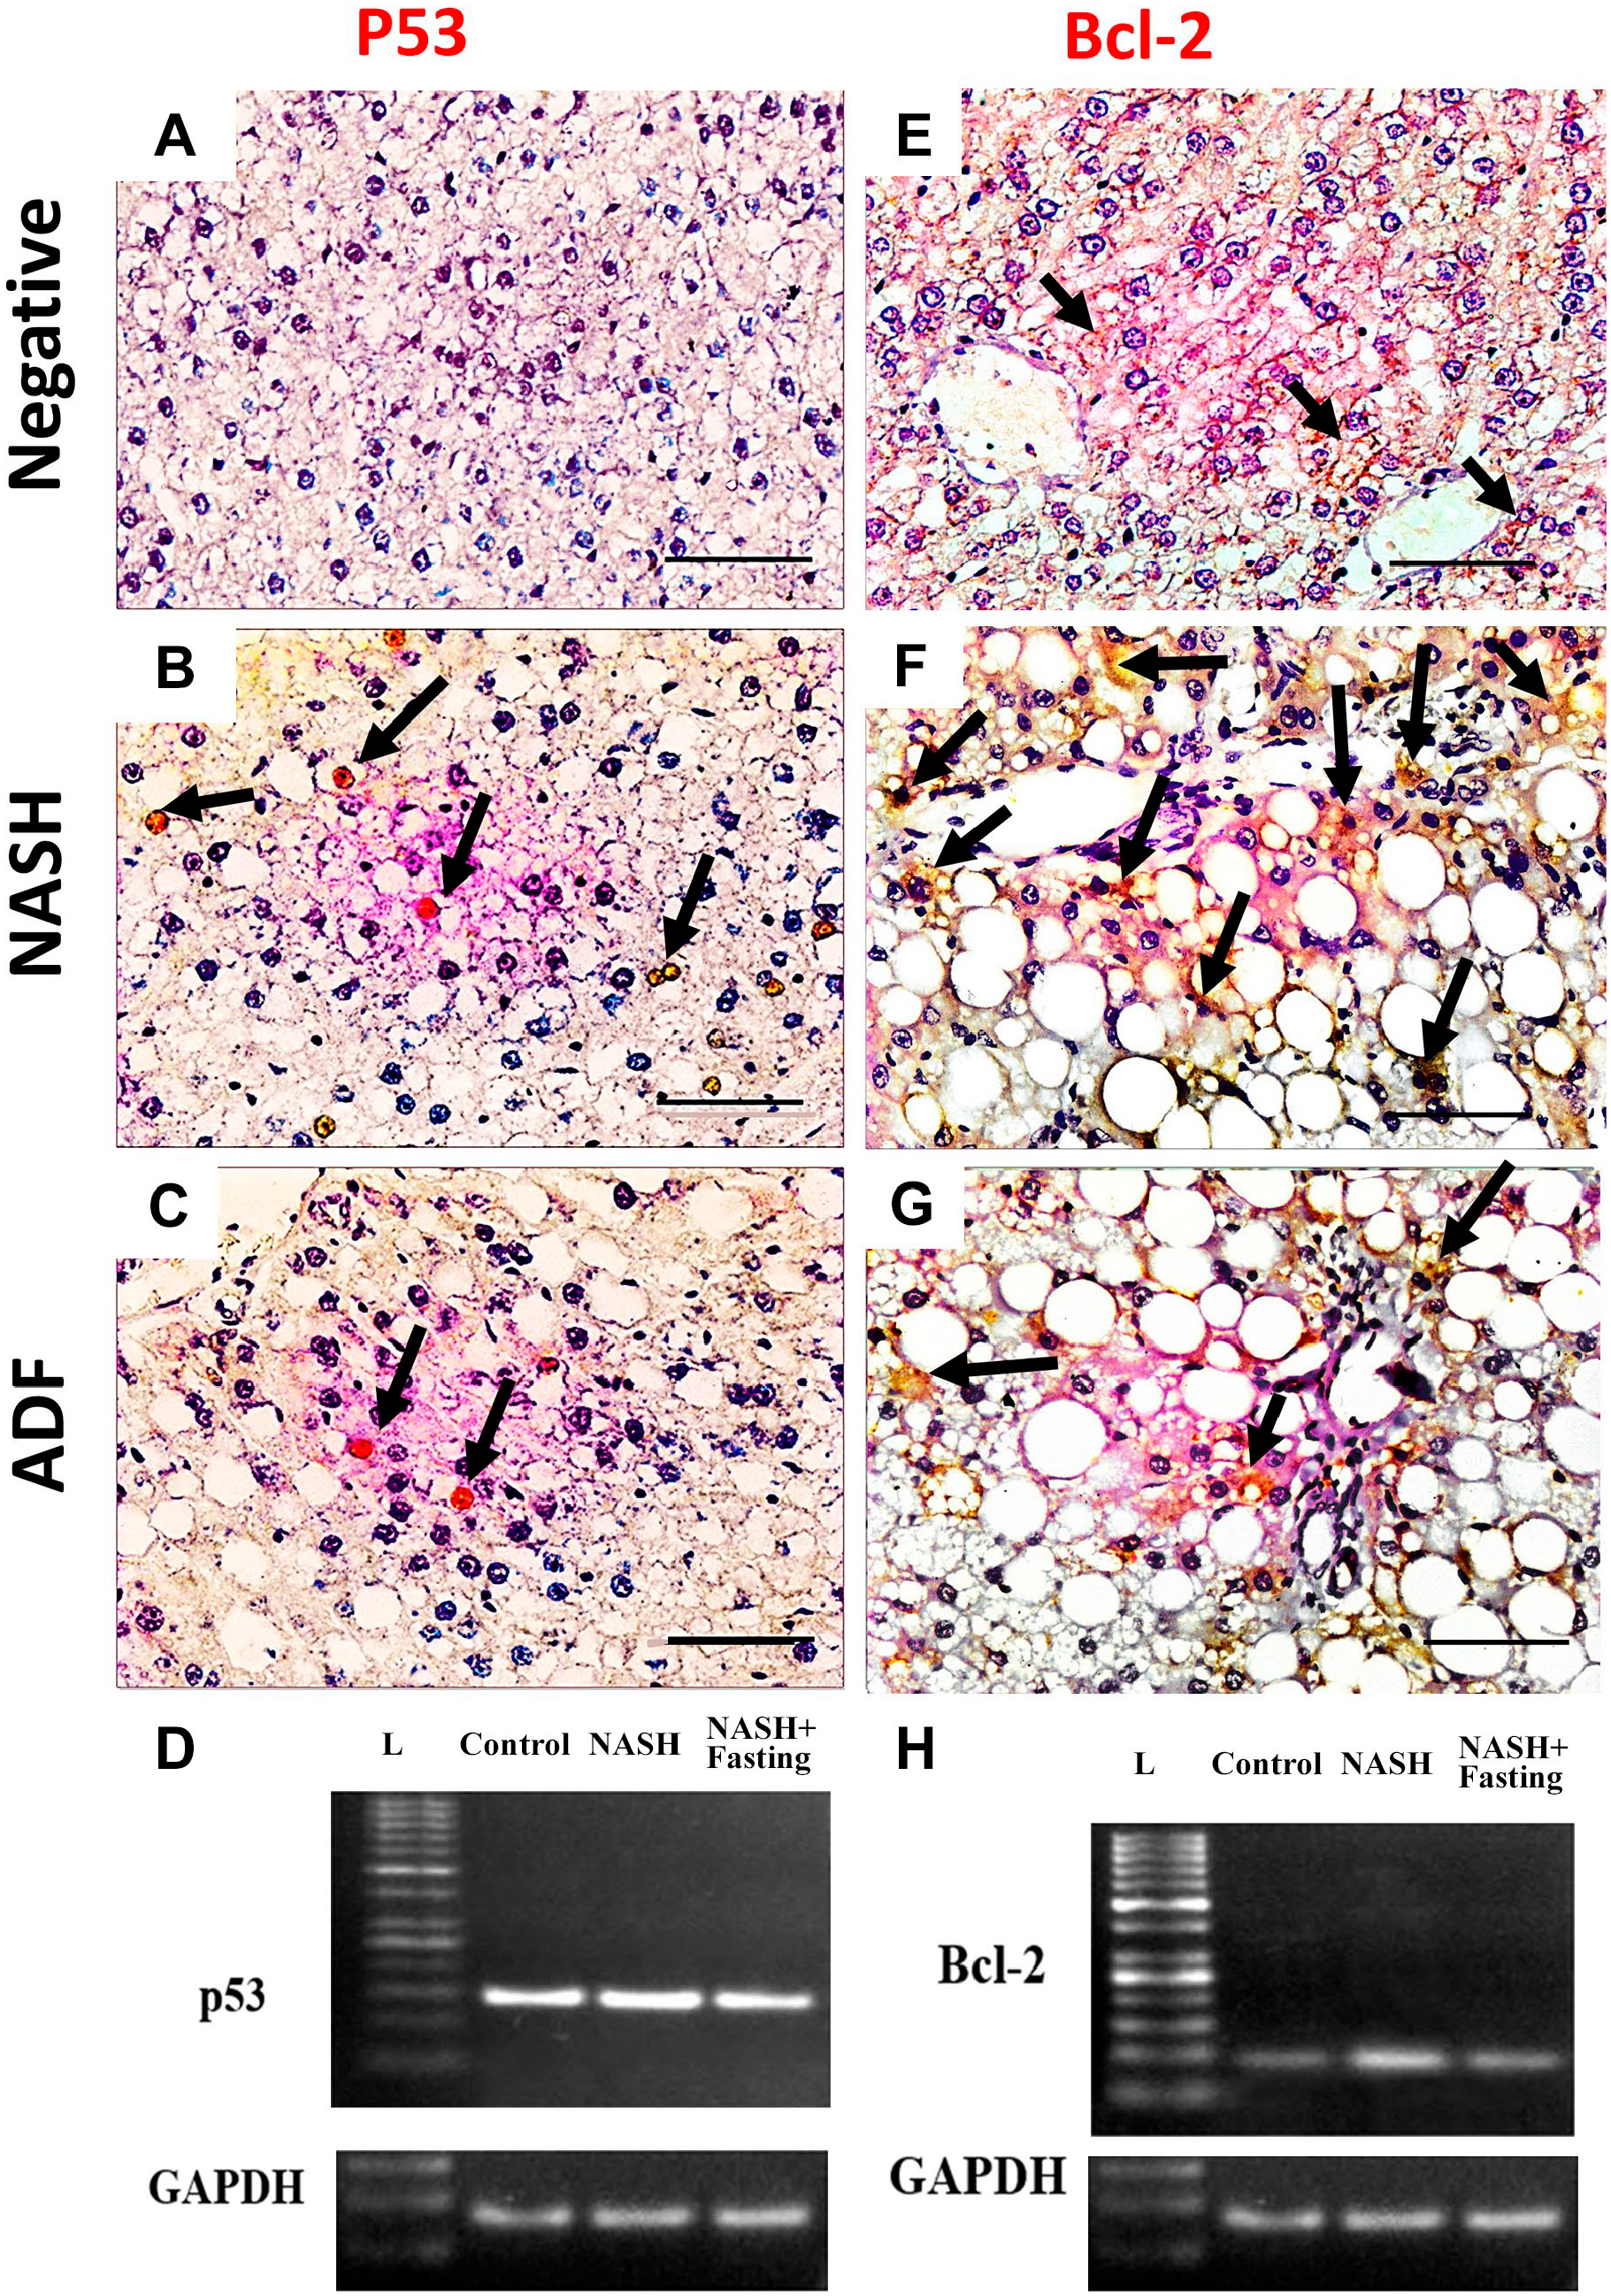
Immunohistochemical staining for apoptosis marker p53 (A, B, and C) and antiapoptotic marker Bcl-2 (E, F, and G) in liver tissues in negative, NASH, and ADF groups. Magnification, ×400. Scale bar = 50 µm. Arrows: immunopositive cells. Gel photographs of the studied genes p53 (D) and Bcl-2 (H). P53 qPCR product (146 bp), Bcl-2 (97 bp), and GAPDH (85 bp). Image of GAPDH gel electrophoresis was repeated with images of other genes as it was used as a control gene. Abbreviations: L, ladder; NASH, non-alcoholic steatohepatitis; ADF, alternate-day fasting; GAPDH, glyceraldehyde-3-phosphate dehydrogenase; p53, tumor protein p53; Bcl-2, B-cell lymphoma 2.
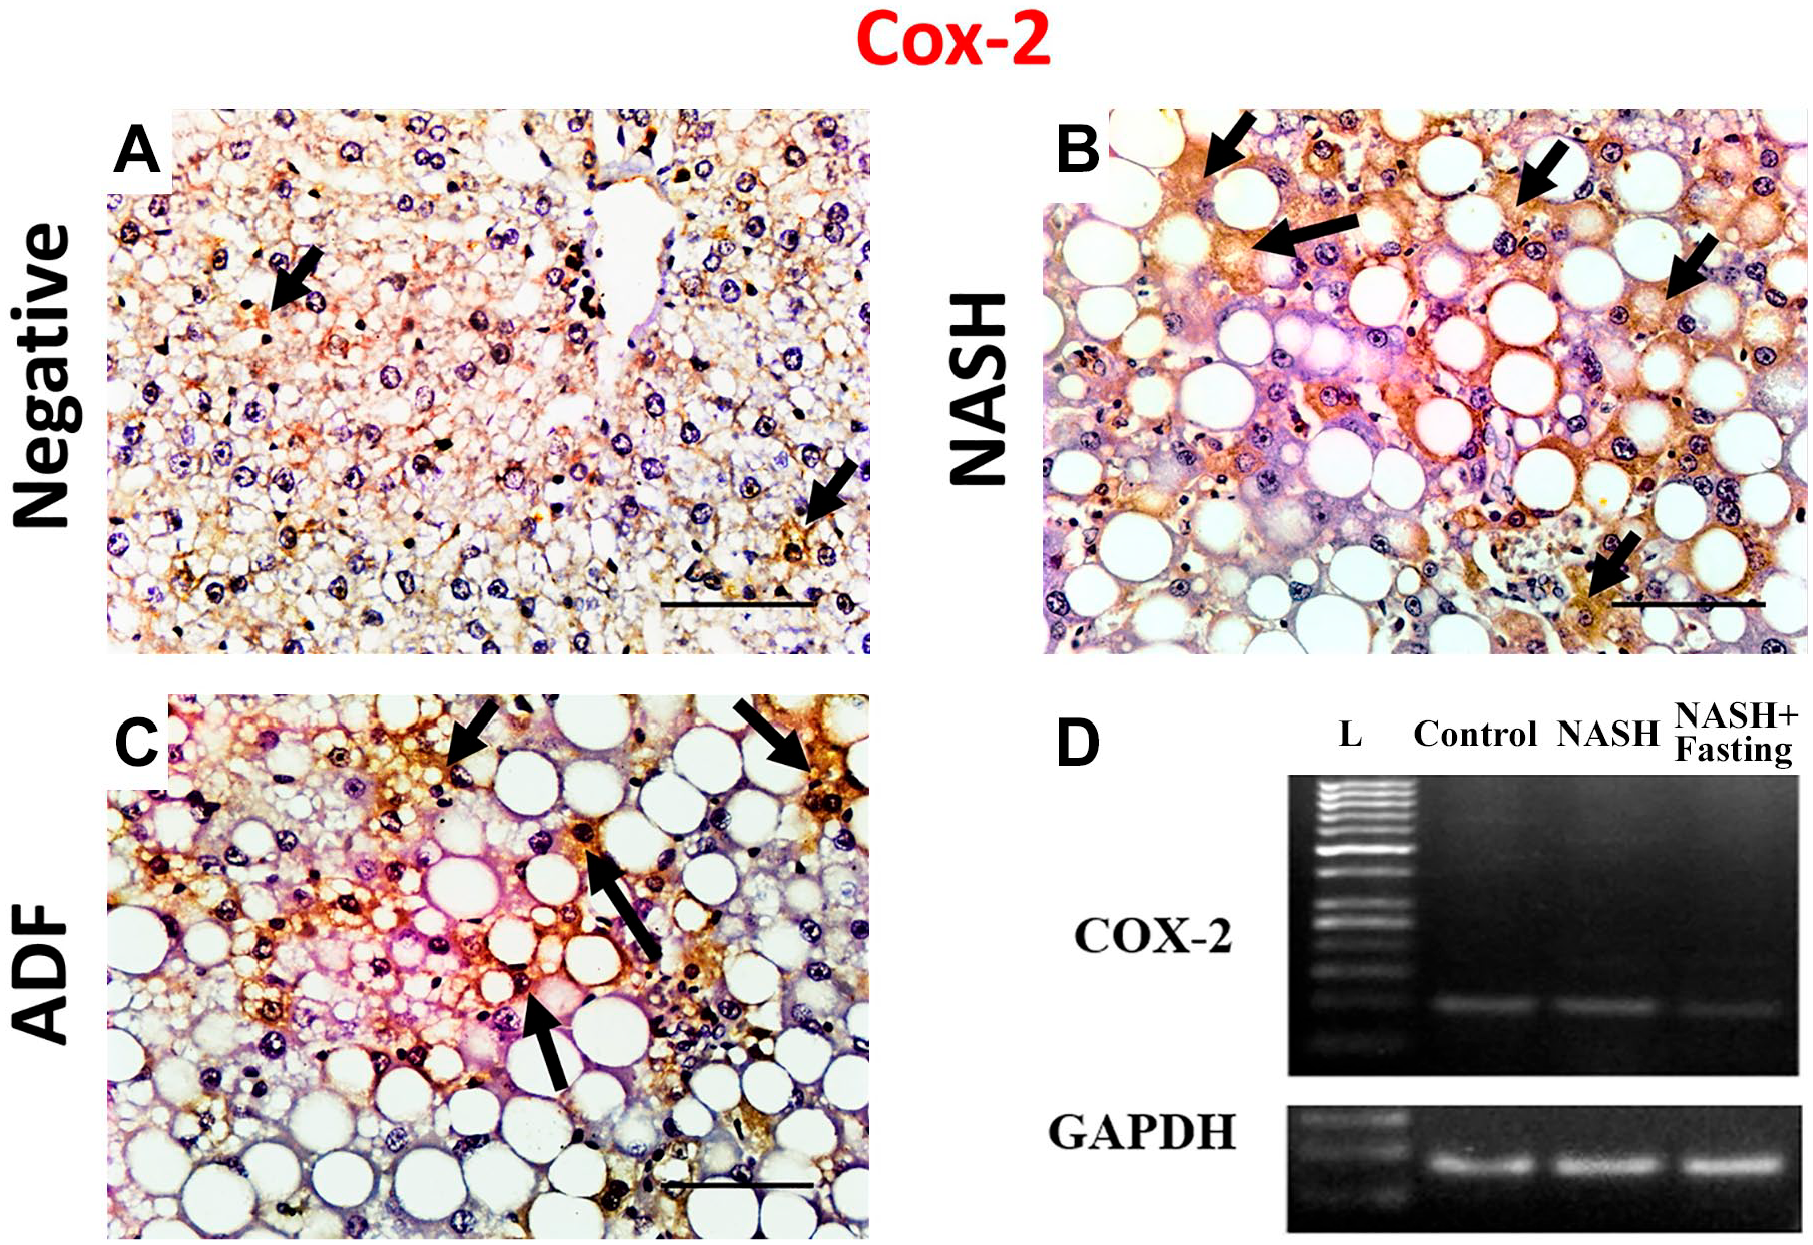
Immunohistochemical staining for Cox-2 in liver tissues in negative control, NASH, and ADF groups (A, B, and C). Magnification, ×400. Scale bar = 50 µm. Arrows: immunopositive cells. Gel photographs of COX-2 vs GADPH (D). COX2 (104 bp) and GAPDH (85 bp). Abbreviations: L, ladder; NASH, non-alcoholic steatohepatitis; ADF, alternate-day fasting; GAPDH, glyceraldehyde-3-phosphate dehydrogenase; COX-2, cyclo-oxygenase 2.
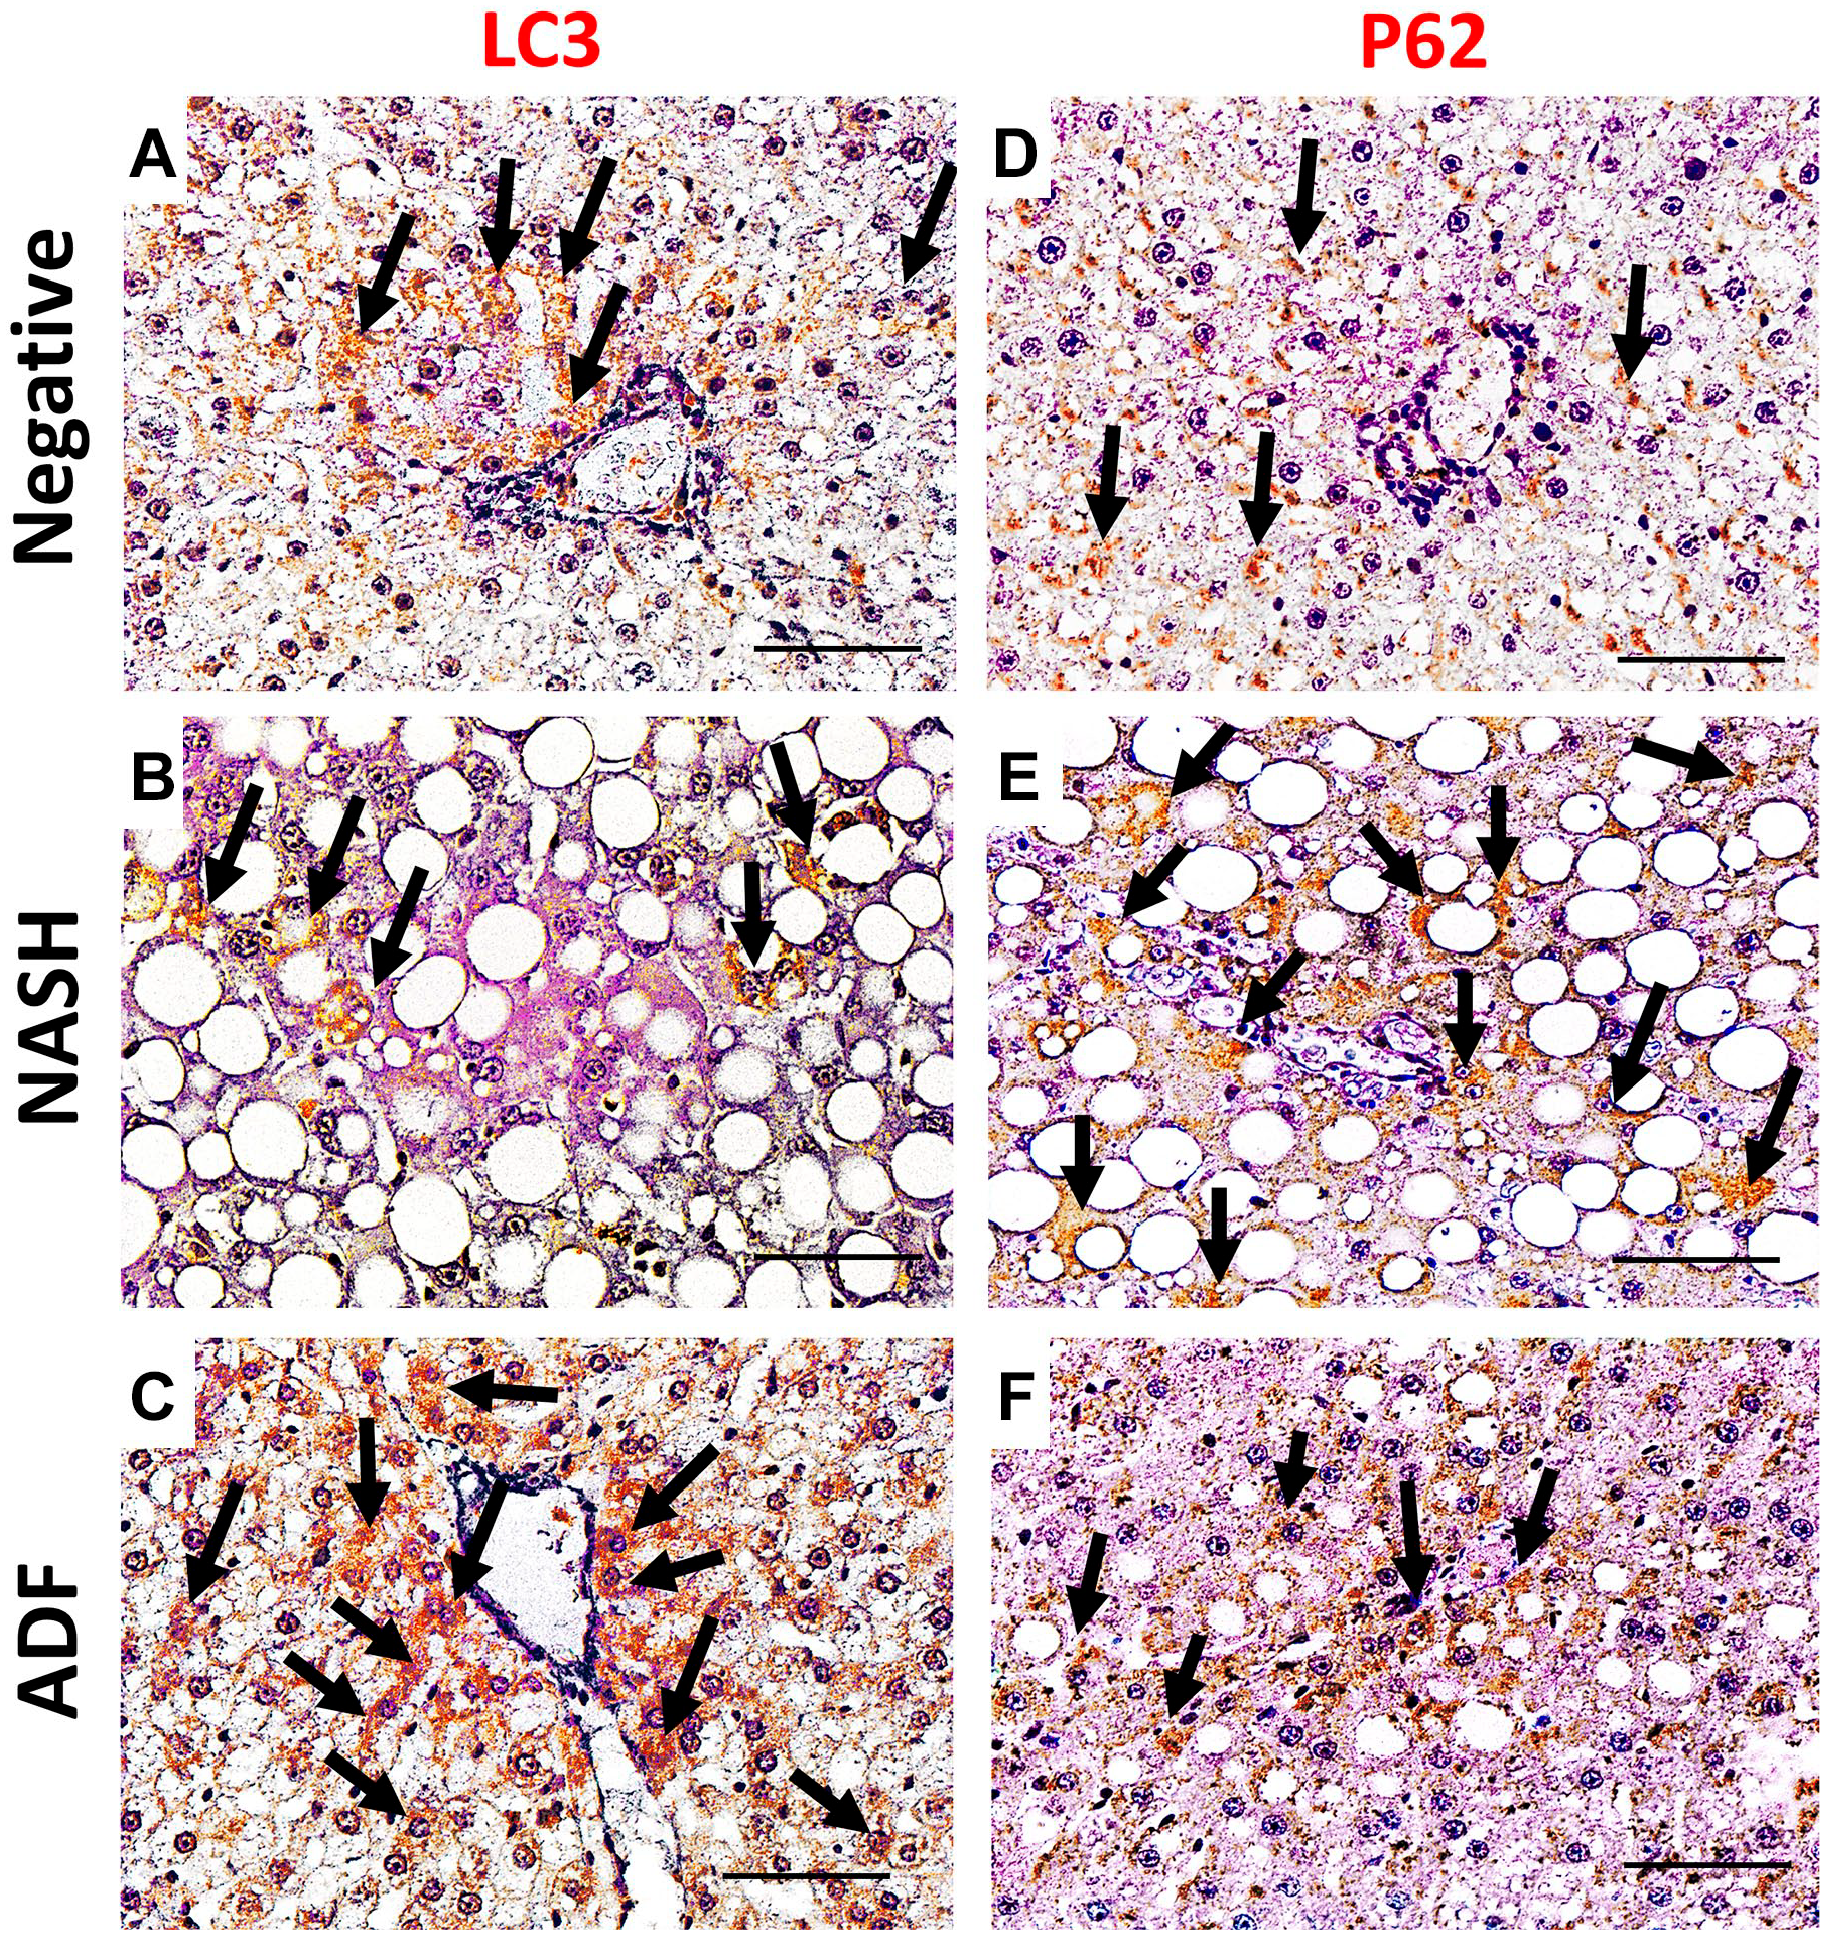
Immunohistochemical staining for autophagy markers LC3 (A, B, and C) and P62 (D, E, and F) in liver tissues in negative, NASH, and ADF groups. Magnification, ×400. Scale bar = 50 µm. Arrows: immunopositive cells. Abbreviations: NASH, non-alcoholic steatohepatitis; ADF, alternate-day fasting.
Morphometric Analysis of Immunohistochemical Results
Immunohistochemical results in the study groups were assessed by morphometric analysis for the mean and standard error of percentage of the number of immunopositive cells to the number of whole cells in the field (Table 6). There was a statistically significant difference in all morphometric parameters between the three groups (p<0.0005), except for Bcl-2 and PPAR-α (p=0.158 and 0.148, respectively) which showed insignificant increase in the NASH group. Games-Howell post hoc analysis for ACACA, PPAR-γ, caspase-3, p53, COX2, LC3, and P62 proteins revealed that the percentage of immunopositive cells was the highest in the NASH group (p<0.0005 for all parameters), with a significant decrease in the ADF group (p<0.0005 for all parameters).
Percentage of Protein-positive Cells in Rat Liver Tissues From the Three Studied Groups.
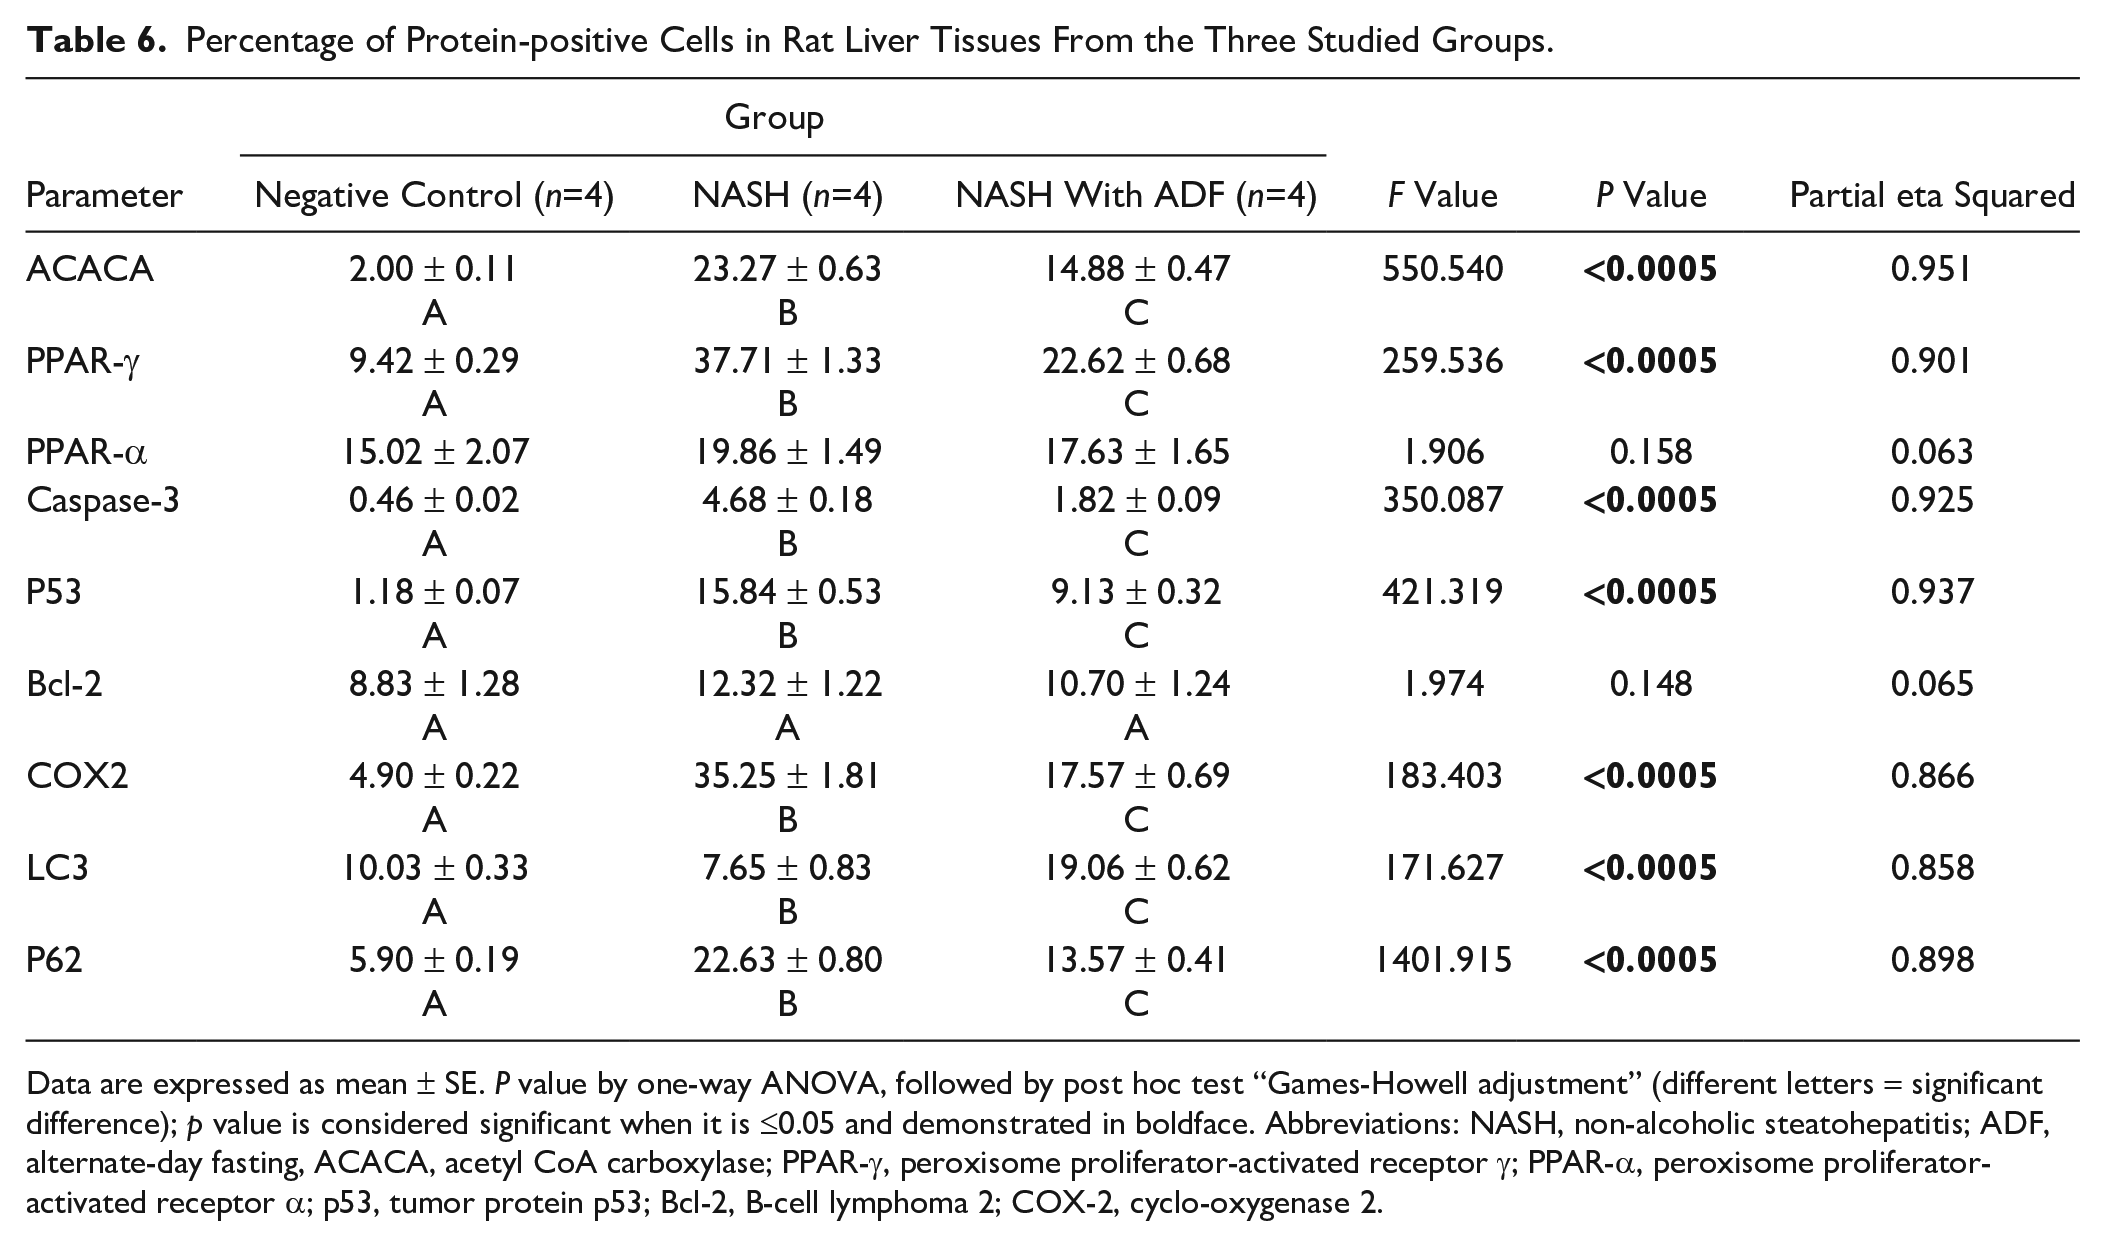
Data are expressed as mean ± SE. P value by one-way ANOVA, followed by post hoc test “Games-Howell adjustment” (different letters = significant difference); p value is considered significant when it is ≤0.05 and demonstrated in boldface. Abbreviations: NASH, non-alcoholic steatohepatitis; ADF, alternate-day fasting, ACACA, acetyl CoA carboxylase; PPAR-γ, peroxisome proliferator-activated receptor γ; PPAR-α, peroxisome proliferator-activated receptor α; p53, tumor protein p53; Bcl-2, B-cell lymphoma 2; COX-2, cyclo-oxygenase 2.
Effect of ADF on mRNA Gene Expression
There was a significant difference in the studied genes between the three groups (p values were 0.005, 0.021, <0.0005, 0.018, and 0.005 for ACACA, PPAR-γ, caspase-3, p53, and COX-2, respectively) except for Bcl-2 and PPAR-α (p=0.187 and 0.407, respectively) showing insignificant higher expression in the NASH group. Post hoc Tukey adjustment for the other genes showed a significant increase in all gene expressions in the NASH group when compared with the NASH + ADF and negative control groups (Figs. 3–6). Regarding ACACA mRNA expression, it showed a significant increase in the NASH group when compared with the negative control group (p=0.006) and a significant decrease in the ADF group when compared with the NASH group (p=0.015), but a non-significant difference between the ADF group and the negative control group (p=0.826). Regarding PPAR-γ mRNA expression, it showed a significant increase in the NASH group when compared with the negative control group (p=0.033) and a significant decrease in the ADF group when compared with the NASH group (p=0.036), but a non-significant difference between the ADF group and the negative control group (p=0.998). Regarding caspase-3 mRNA expression, it showed a significant increase in the NASH group when compared with the negative control group (p<0.0005) and a significant decrease in the ADF group when compared with the NASH group (p=0.001); also, there was a barely missed statistical significant difference between the ADF group and the negative control group (p=0.054). For the p53 mRNA expression, there was a significant increase in the NASH group when compared with the negative control group (p=0.037) and a significant decrease in the ADF group when compared with the NASH group (p=0.024), but a non-significant difference between the ADF group and the negative control group (p=0.956). For the COX2 mRNA expression, there was a significant increase in the NASH group when compared with the negative control group (p=0.009) and a significant decrease in the ADF group when compared with the NASH group (p=0.010), but a non-significant difference between the ADF group and the negative control group (p=0.992) (Table 7).
Relative Quantification of the Studied Genes in Rat Liver Tissues From the Three Studied Groups.
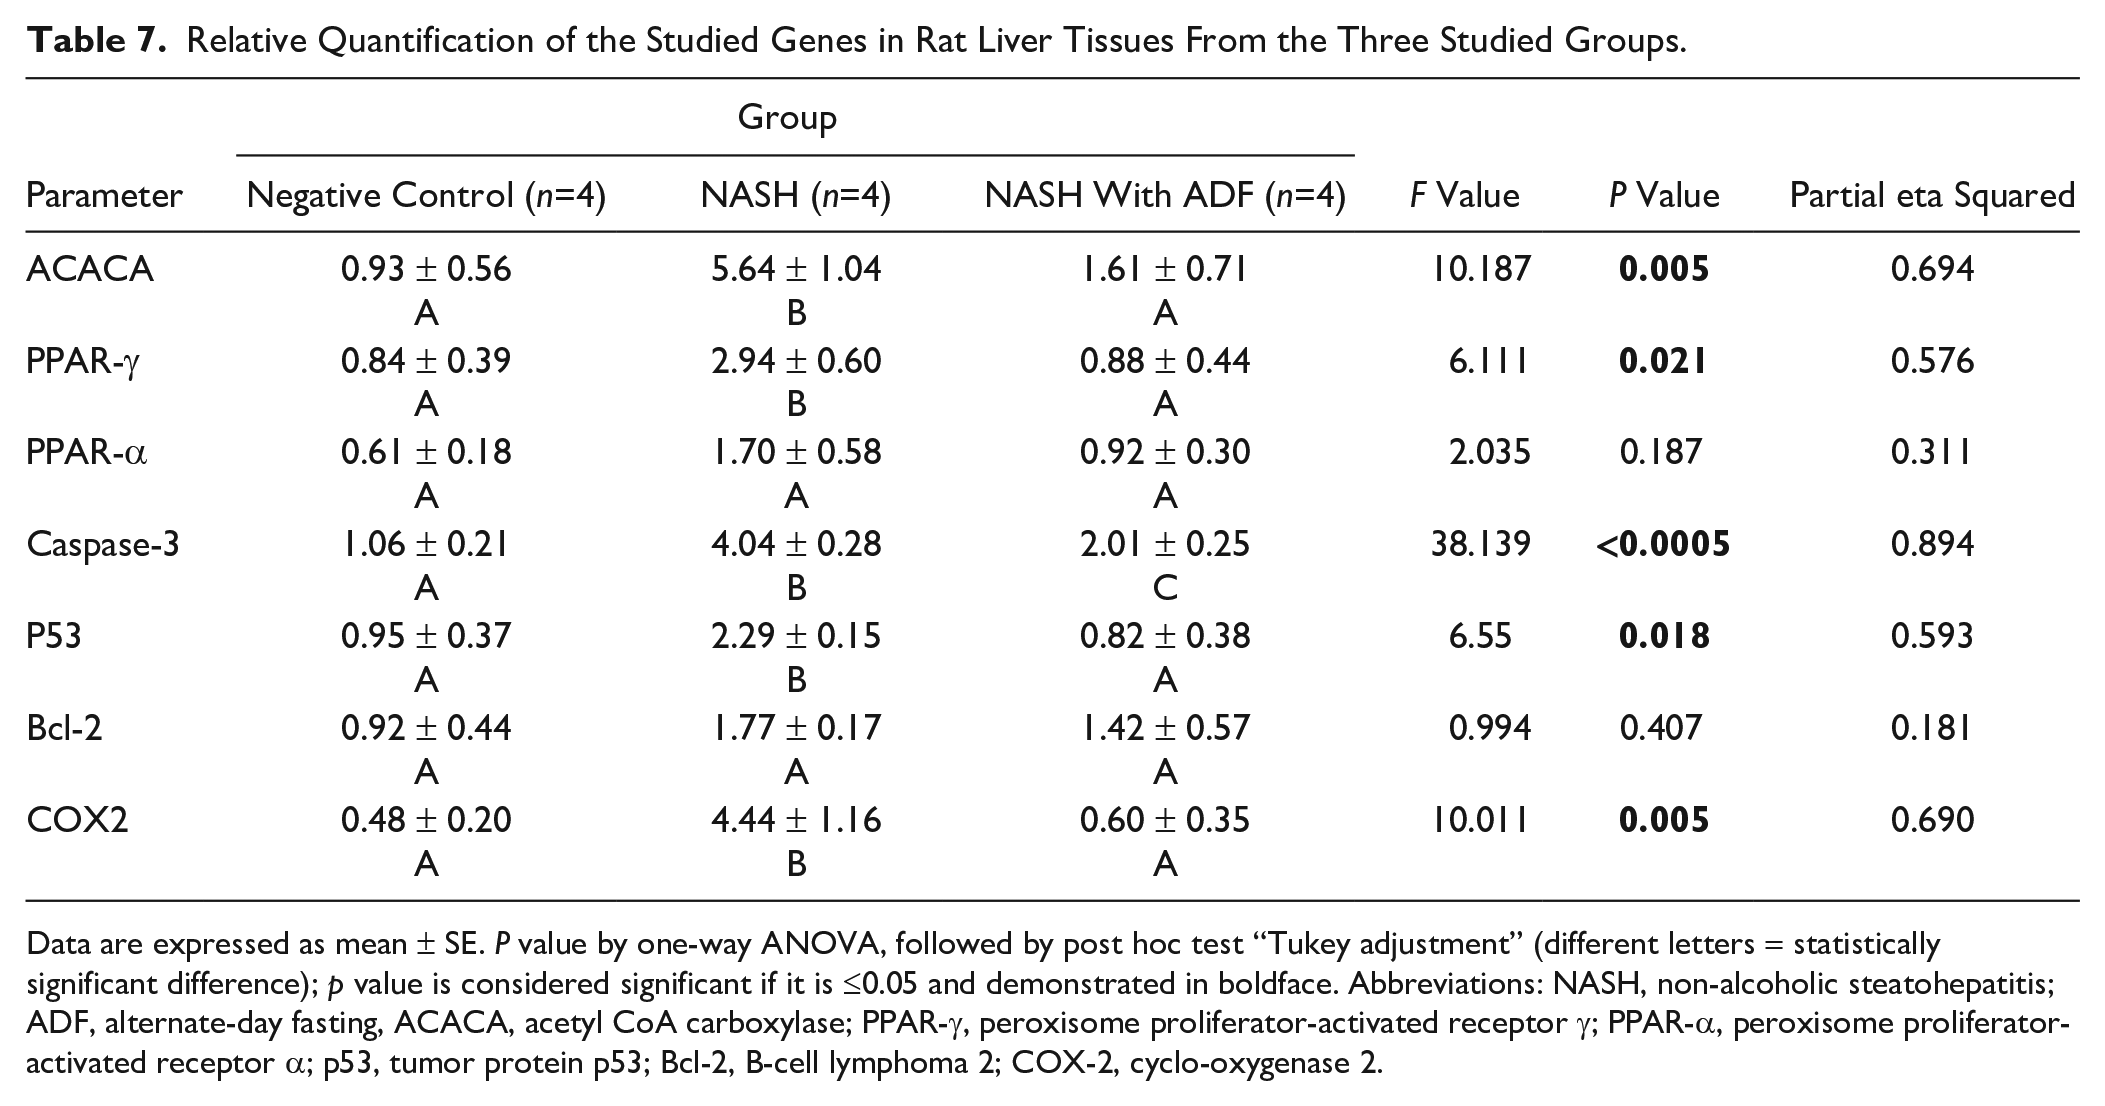
Data are expressed as mean ± SE. P value by one-way ANOVA, followed by post hoc test “Tukey adjustment” (different letters = statistically significant difference); p value is considered significant if it is ≤0.05 and demonstrated in boldface. Abbreviations: NASH, non-alcoholic steatohepatitis; ADF, alternate-day fasting, ACACA, acetyl CoA carboxylase; PPAR-γ, peroxisome proliferator-activated receptor γ; PPAR-α, peroxisome proliferator-activated receptor α; p53, tumor protein p53; Bcl-2, B-cell lymphoma 2; COX-2, cyclo-oxygenase 2.
Correlation of Morphometric Findings With Levels of Gene Expression
Study of the correlation of morphometric findings with levels of genes expression showed that all the three morphometric parameters that had a statistically significant positive correlation with ACACA, PPAR-α, caspase-3, p53, and COX-2 gene expression showed a significant negative correlation. Correlation was most strong with caspase-3. There was no statistically significant correlation between area fraction of Oil Red and PPAR-γ and Bcl-2. In addition, there was no statistically significant correlation between area fraction of Sirius Red and Bcl-2 (Table 8).
Correlation of the Morphometric Results With Gene Expression Profiles.
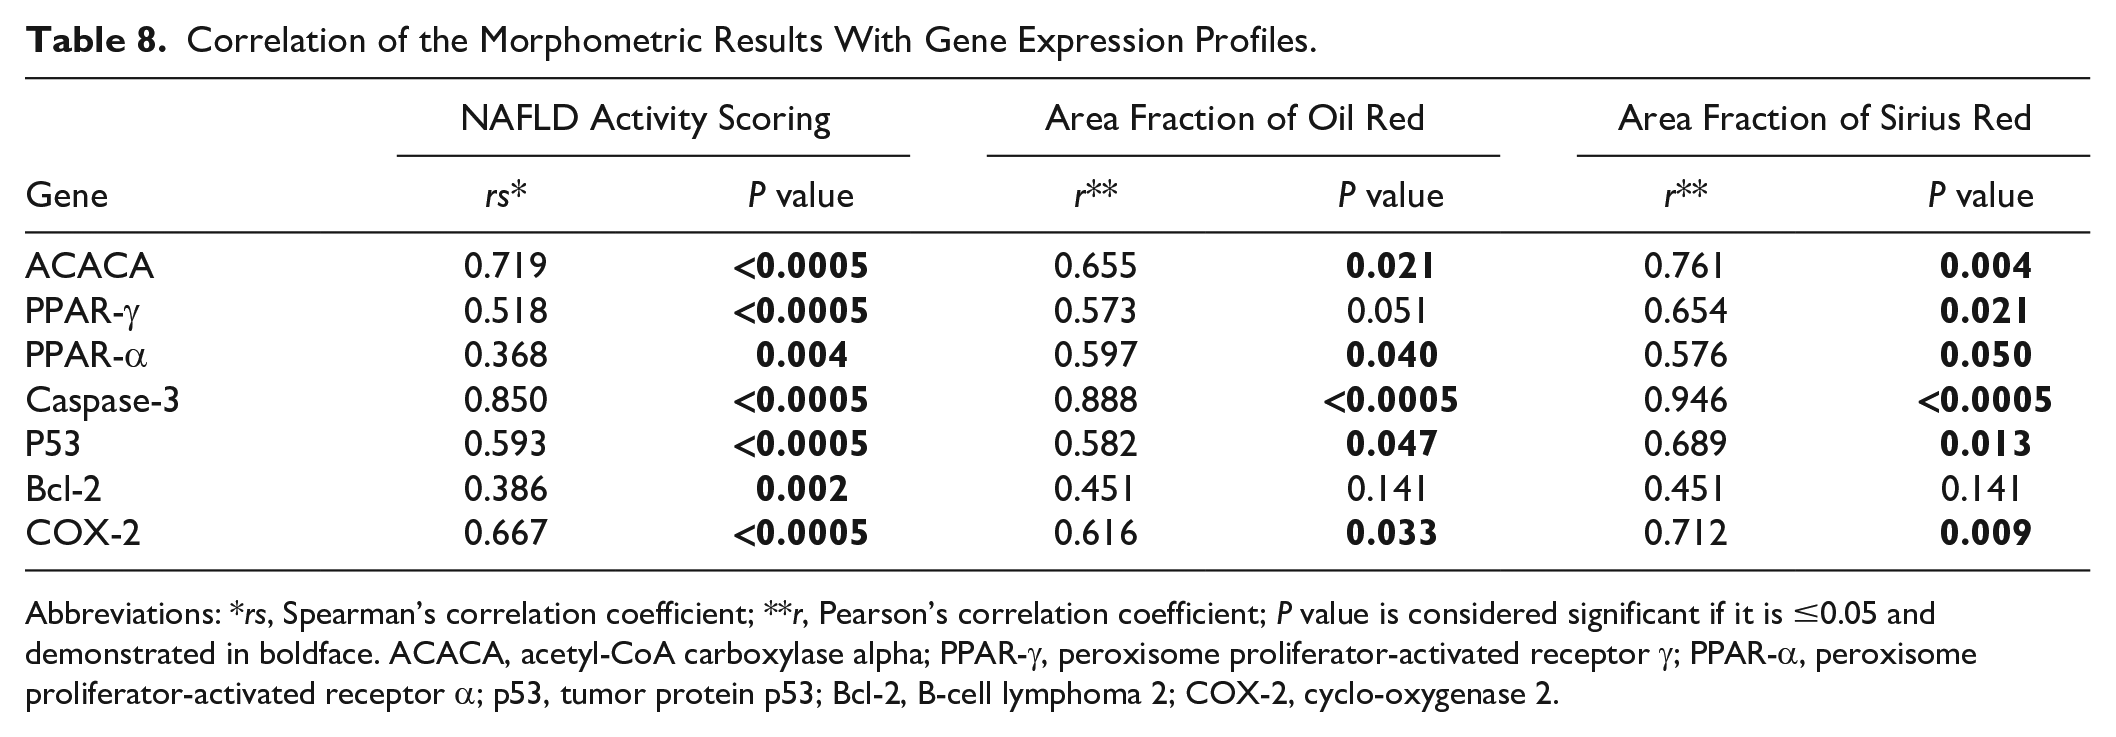
Abbreviations: *rs, Spearman’s correlation coefficient; **r, Pearson’s correlation coefficient; P value is considered significant if it is ≤0.05 and demonstrated in boldface. ACACA, acetyl-CoA carboxylase alpha; PPAR-γ, peroxisome proliferator-activated receptor γ; PPAR-α, peroxisome proliferator-activated receptor α; p53, tumor protein p53; Bcl-2, B-cell lymphoma 2; COX-2, cyclo-oxygenase 2.
Discussion
Lipid accumulation in the liver represents an oxidative stressful event that leads to inflammation and NASH. 30 In this study, we used SD rats to assess whether ADF may be useful in alleviating the pathological effects of NASH. Steatosis, inflammation, ballooning of hepatocytes, and fibrosis were the most striking pathological changes observed by histopathological examination of the NASH group in accordance with the previous results of Fraulob et al. 31 These changes were ameliorated by ADF. Similar positive effects of ADF were reviewed by Harvie and Howell. 32 Surprisingly, the positive effect of ADF on NASH was independent of weight loss. Moreover, previous studies confirmed the significant ultrastructural changes in liver after fasting. 33 However, we have applied here an intense protocol of ADF (24 hr) as it is argued that 24-hr fasting of rat is not comparable with similar duration in human because the rat has a higher metabolic rate, for example, rat fasting for 5–6 hr offers a better comparison with human overnight fasting (16–18 hr), 34 meaning that 24-hr fasting in rat may mimic 72-hr fasting in human. So, applying a clinically comparable fasting protocol in human with 3 days of fasting may need to be tested well at first in experimental animals.
Serum ALT and LDH5, the markers of liver cell injury, were significantly elevated in the NASH group. This may be explained by the fact that HFF diet exerted a damaging effect on liver cells, releasing ALT and LDH5 to the blood. These findings were in agreement with the results of a previous study by Wu et al. 35 In contrast, ADF opposed this effect in LDH but not in ALT.
In this study, the NASH group showed a significant upregulation of PPAR-γ, whereas the ADF group showed a significant downregulation. These findings can be explained by the fact that PPAR-γ, expressed mainly in adipose tissue, can modulate lipid metabolism and inflammation. 36 This is also in agreement with Matsusue et al., 37 who found that PPAR-γ promotes hepatic steatosis. In this study, ADF reversed this effect, indicating that ADF showed antilipogenic effect on NASH.
Moreover, NASH induced a significant upregulation in the ACACA gene expression, and this effect was also significantly ameliorated by ADF intervention. These findings can be explained by the fact that PPAR-γ induces the de novo lipogenesis enzymes fatty acid synthase and ACACA 1, in hepatocytes, facilitating an increase in hepatic triglycerides37,38 and that the expression of enzymes involved in de novo lipogenesis like ACACA is controlled during fasting and refeeding, dietary carbohydrate, and dietary fat.39–41 Moreover, high leptin levels associated with HFF diet indirectly induce the phosphorylation of ACACA. 42 Furthermore, Mao et al. 43 showed that by the inhibition of ACACA enzyme, liver triglyceride level decreases. In addition, Savage et al. 44 stated that by inhibiting ACACA mRNA expression, amelioration of hepatic steatosis occurred.
PPAR-α shows prominent expression in hepatic cells with an important role in lipid metabolism, regulating fatty acid uptake, β-oxidation of fatty acids, and turnover of triglycerides. 45 In addition, it exerts an anti-inflammatory effect via regulation of NF-κB. 46 In this study, NASH induced upregulation in PPAR-α gene expression, which was insignificantly reduced by ADF intervention. Patsouris et al. 47 stated that administration of HFF diet to mice leads to induction of PPAR-α as a protective mechanism against HFF-induced steatosis as reported in several models.48,49 On the contrary, other results showed that PPAR-α could not ameliorate steatosis, 50 and one research even reported that PPAR-α can induce steatosis. 51 So, the role of pharmacological agonists of PPAR-α in managing steatosis is not consistent.
Bcl-2 is known to play a key regulatory role in the antiapoptotic process. 52 In this study, it was amazing to find that Bcl-2 gene expression was upregulated in the NASH group and was downregulated by ADF. Bcl-2 upregulation in NASH might be explained as an adaptive response to resist apoptosis triggered by stressful lipid accumulation. 53 However, the apoptotic response was predominant, meaning that Bcl-2 upregulation was not enough to protect against apoptosis. 54
This study indicates that caspase-3-related apoptosis may have an important role in the progress of NASH, 55 showing significant increased expression in the NASH group. In addition, ADF was able to significantly attenuate that activation. Lipotoxicity-related stress may explain this, as it causes an increased production of reactive oxygen species (ROS) in the mitochondria of hepatocytes, and when this exceeds the capacity of scavengers, it leads to cellular damage. 56 As a response, caspase-3 is released from mitochondria to initiate the apoptotic pathway. 57
This study found that p53 may have an important metabolic role in the pathogenesis of NASH, showing significant increased expression in the NASH group. In addition, ADF was able to significantly attenuate it. These findings can be explained by the fact that p53 regulates production of ROS, cell senescence, and apoptosis. 58 P53 was also increasingly demonstrated as a key player in lipid metabolism. P53 exerts beneficial effects, being a regulator of β-oxidation of fatty acids as a trial for keeping fatty acids and triglycerides within healthy limits. A study by Goldstein and Rotter 59 on NASH found moderate induction of p53 gene that did not affect cell viability or apoptosis, but p53 was able to stimulate fatty acid oxidation, inhibit lipogenesis, and alleviate inflammation. This confirms the effect of moderate activation of p53 on protection against NASH.60,61 If these borders are exceeded, p53 levels become abnormally elevated and may stimulate apoptosis and progression of NASH, as seen in our study.
COX-2 is the enzyme responsible for synthesis of prostaglandin E2 from arachidonic acid. 62 COX-2 gene expression showed that a significant increase in NASH group may be as a protective mechanism against HFD-induced damage by attenuating steatosis and inflammation, by inhibiting apoptotic pathways with decreasing profibrogenic markers, and by restricting hepatic stellate cell activation and extracellular matrix deposition. However, in contrast to this constitutive expression of COX-2, the induction of inflammatory reactive COX-2 in advanced pathological conditions is closely associated with nitric oxide (NO) production by inducible NO synthase, which may also lead to hepatic damage. 63 In this study, ADF intervention was associated with significant normalization of COX-2 expression, indicating attenuation of hepatic inflammation. This demonstrates another potential mechanism of protection by ADF against hepatotoxicity induced by HFF diet.
Autophagy is the mechanism through which the organelles are isolated in membranes and then fuse with lysosomes for degradation and to be recycled for energy production. LC3 is a main constituent for the expansion of the autophagosomal isolation membrane, and p62 is responsible for selective autophagy of cytoplasmic ubiquitinated/aggregated proteins; hence, both are tangled in macroautophagy. 64 This study found that HFF diet inhibited autophagy indicated by decreased LC3 activity and increased P62 accumulation, demonstrating the inhibition of autophagic flux. 65 We found that ADF could restore the autophagic machinery with increased LC3 and decreased P62 expression, and this may be the main mechanism underlying the role of ADF in managing HFF diet-induced NASH through inducing lipophagy, too.
Furthermore, we found a significant correlation for the morphometric findings; Oil Red–stained and Sirius Red–stained area fractions as well as NAS with the levels of gene expression showed that all three morphometric parameters had a statistically significant positive correlation with ACACA, PPAR-α, caspase-3, p53, and COX-2 gene expression. This correlation can make the gene expression serve as a proxy for severity However, there was no statistically significant correlation between caspase-3 and morphometric parameters.
The results indicated that ADF, regardless of the decreased calorie intake, could ameliorate HFF diet–induced serum LDH elevation and hepatic histological alterations with less steatosis, inflammation, ballooning, fibrosis, and histopathological score as seen in H&E-stained sections, less steatosis in Oil Red O–stained sections, and decreased fibrosis as seen in Sirius Red–stained sections. Moreover, ADF ameliorated the HFF diet–induced alteration of hepatic lipogenic, inflammatory, proapoptotic, antiapoptotic, and autophagy markers ACACA, PPAR-γ, caspase-3, p53, COX-2, LC3, and P62, independent of weight loss. Coupled with an antilipogenic capacity and autophagy-enhancing, antiapoptotic, and anti-inflammatory effects of ADF, it may be clinically beneficial as a safe substitute to current therapeutic options. A graphical abstract describing the finding is presented in Fig. 8.
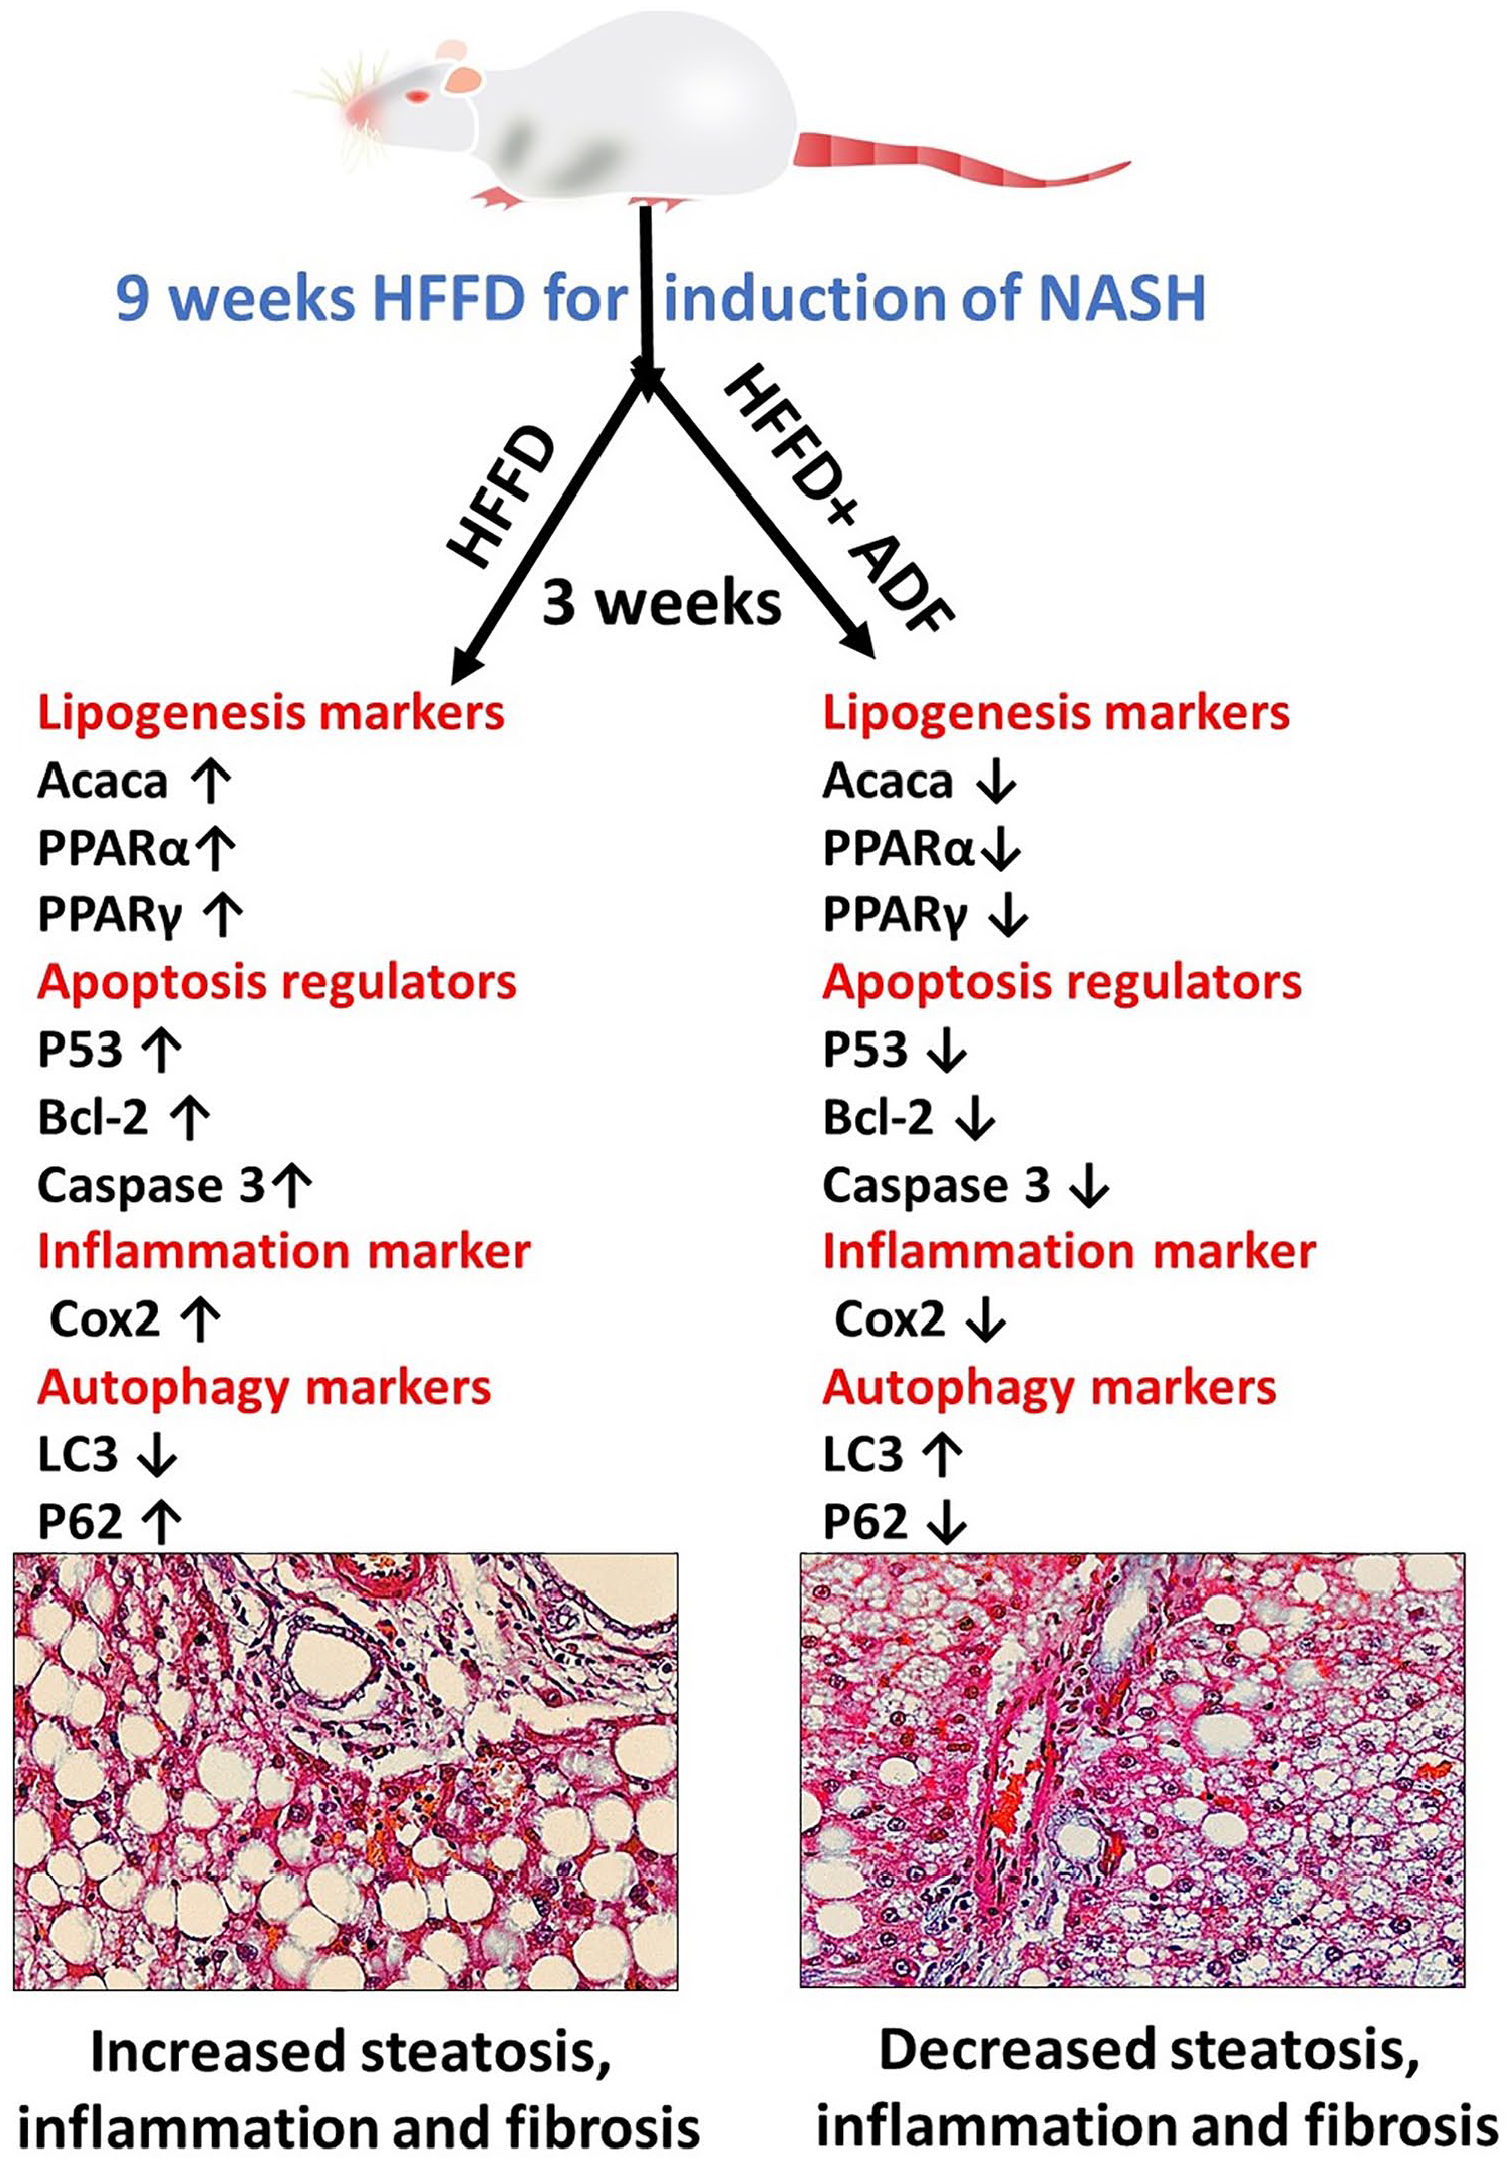
Graphical abstract for the experiment, with representative photomicrographs of hematoxylin and eosin–stained liver sections (×400). Scale bar = 50µm. Abbreviations: HFF, high-fat-fructose; NASH, non-alcoholic steatohepatitis; ADF, alternate-day fasting, ACACA, acetyl CoA carboxylase; PPAR-γ, peroxisome proliferator-activated receptor-γ; PPAR-α, peroxisome proliferator-activated receptor-α; p53, tumor protein p53; Bcl-2, B-cell lymphoma 2; COX-2, cyclo-oxygenase 2; LC3, Microtubule-associated proteins light chain 3.
Footnotes
Acknowledgements
The authors express their gratitude to King Khalid University, Saudi Arabia, for providing administrative and technical support.
Competing Interests
The author(s) declared no potential conflicts of interest with respect to the research, authorship, and/or publication of this article.
Author Contributions
HRHE was involved in conceptualization, methodology, histopathology, morphometry, statistical analysis, and publishing, ME-N and RE-G were involved in conceptualization, methodology, molecular workup, statistical analysis, and validation. BAK was involved in conceptualization, methodology, and histopathology. RNS and MMA-E were involved in conceptualization, supervision, and revision. WFE was involved in histopathology consultation. AMA and EMEN were involved in supervision and revision. Each author has read and approved the manuscript before submission.
Funding
The author(s) disclosed receipt of the following financial support for the research, authorship, and/or publication of this article: The authors extend their appreciation to the Deanship of Scientific Research at King Khalid University for funding this project through the research group program under grant number R.G.P. 1/217/41.