
Abstract
Immunohistochemistry (IHC) is the accepted standard for spatial analysis of protein expression in tissues. IHC is widely used for cancer diagnostics and in basic research. The development of new antibodies to proteins with unknown expression patterns has created a demand for thorough validation. We have applied resources from the Human Protein Atlas project and the Antibody Portal at National Cancer Institute to generate protein expression data for 12 proteins across 39 cancer cell lines and 37 normal human tissue types. The outcome of IHC on consecutive sections from both cell and tissue microarrays using two independent antibodies for each protein was compared with in situ proximity ligation (isPLA), where binding by both antibodies is required to generate detection signals. Semi-quantitative scores from IHC and isPLA were compared with expression of the corresponding 12 transcripts across all cell lines and tissue types. Our results show a more consistent correlation between mRNA levels and isPLA as compared to IHC. The main benefits of isPLA include increased detection specificity and decreased unspecific staining compared to IHC. We conclude that implementing isPLA as a complement to IHC for analysis of protein expression and in antibody validation pipelines can lead to more accurate localization of proteins in tissue.
Keywords
Introduction
In situ analysis of proteins is of fundamental importance in biological and medical research, and its role in clinical medicine is also expected to increase significantly. The standard approach for analyzing the expression of proteins in cells and tissues is based on affinity proteomics. This requires access to affinity reagents such as antibodies for specific detection reactions. Immunohistochemistry (IHC) is the dominating antibody-based method for in situ detection of proteins in tissues, and the technology is widely used in medicine, especially for diagnostic pathology. IHC is mainly applied for differential diagnostics, but as an extended range of validated antibodies is becoming available, IHC is increasingly applied in biomarker assays for disease prediction and to select optimal treatment. There is a widely acknowledged need for improved specificity and sensitivity of protein analyses 1 and for validation of antibodies used in both clinical studies and in research involving the human proteome in health and disease. Recently, the International Working Group for Antibody Validation 2 suggested five “pillars” as the standard for antibody validation, drawing increased attention to standardization of antibody validation strategies.
The Human Protein Atlas (HPA) project 3 represents a large-scale effort to generate affinity-purified polyclonal antibodies toward all human proteins and to use these to explore the entire human proteome in organs, tissues, cells, and organelles. All data are publicly available at www.proteinatlas.org, allowing for exploration of expression patterns at single-cell resolution. All antibodies generated by the HPA are routinely subjected to a series of quality assurance and validation steps, including a comparison of IHC results across a large number of human tissues with levels of the corresponding mRNAs in the same tissue types. Similarly, the antibody portal of the clinical proteomic tumor analysis consortium (CPTAC) at the U.S. National Cancer Institute (NCI) represents a community resource, providing access to a large number of standardized renewable affinity reagents to cancer-associated targets and accompanying data characterizing these reagents.
Several efforts are used to evaluate and validate reagents from HPA and CPTAC, as well as from other sources for IHC including western blotting and comparison to RNA expression and to immunostaining using independent antibodies toward the same protein, that is, two or more antibodies targeting non-overlapping epitopes of the same protein. 4 Nevertheless, it is often challenging to establish true protein expression patterns as opposed to off-target binding across a large spectrum of IHC stained tissues. The fact that manual scoring of IHC staining is subjective and not a quantitative measurement adds to the difficulty in determining the reliability of IHC-based protein expression data.
The risk for cross-reactive binding and detection of irrelevant proteins in the sample, so-called off-targets, is an important issue that must be taken into consideration when validating antibodies. 5 To address this problem, we here employed in situ proximity ligation assays (isPLA). The isPLA technique is well established and widely used for advanced in situ protein analyses.6 −9 Since isPLA analyses depend on binding by pairs of antibodies to elicit a locally amplified detection signal, the assays have proven useful to reveal interactions between pairs of target proteins. The requirement for target recognition by two antibodies is also recognized as an important means to improve specificity of detection. It is well-known that sandwich immune reactions, where pairs of antibodies are used for detecting proteins in solution phase, offer improved specificity of detection compared to single-binder assays. Analogously, isPLA will only result in detection signals when the two antibodies bind the target jointly. Therefore, any cross-reactive off-target not shared between the two antibodies will not be detected. Accordingly, isPLA has a strong potential to improve specificity of detection, both during the validation of biomarkers and for routine clinical diagnostics.10 −13 Once pairs of antibodies bind a target protein, they trigger a reaction where a circular DNA strand is formed by ligation, and this is used to generate a locally amplified DNA strand via rolling circle amplification. Individual reaction products are conveniently visualized as intense spots of staining in situ, enhancing localized protein detection.
Because of the above properties, isPLA has been proposed as a means for advanced antibody validation, and protocols have been developed to enhance the suitability of isPLA for tissue analysis. 14 Specific detection by IHC is particularly challenging for low-abundance target proteins, where the antibody staining can be difficult to distinguish from background signals, and risks of troubling cross-reactivity may be greater. For such cases isPLA has the potential to improve both target selectivity and also signal strength while maintaining low background. isPLA may thus complement IHC for protein detection in everyday laboratory practice by allowing more precise and quantitative antibody-mediated in situ detection. The main aim of this work was to explore the pros and cons of isPLA as a general tool to distinguish true protein expression from off-target binding in cells and tissues. The performance of antibodies against different protein targets was examined with IHC and isPLA on a large set of various tissue and cell samples, and the outcome was compared to overall expression levels for the corresponding mRNAs in the same tissue types. Our results show that isPLA can facilitate and improve assessment of protein expression in tissue.
Materials and Methods
Tissues and Cells
All fresh frozen and paraffin embedded tissue samples used in this study were acquired from the Uppsala Biobank and the Department of Clinical Pathology, Uppsala University Hospital, Uppsala, Sweden. Tissue samples were collected in agreement with approval from the Research Ethics Committee at Uppsala University (Ups 02-577, #2011/473).
Formalin-fixed and paraffin-embedded (FFPE) morphologically normal human tissues, distributed in a tissue microarray (TMA) format, were used for protein expression profiling. The TMAs were generated with 1 mm diameter tissue cores from 37 human different tissue types (proteinatlas.org/humanproteome/tissue), collected from three individuals for each tissue type, as previously described. 15 Cell microarrays (CMAs), mimicking tissues with respect to fixation and dehydration, were generated from 39 different cell lines (proteinatlas.org/learn/cellines) as previously described. 16 TMA and CMA blocks were cut into 4 µm sections, dried at room temperature over-night, and baked at 50C prior to IHC or isPLA.
Fresh frozen human samples, obtained from Uppsala Biobank, from the same 37 tissue types used for in situ protein expression analyses, were used for analysis of global mRNA expression as previously described. 17 In brief, tissue samples were embedded in Optimal Cutting Temperature compound and stored at -80C. A hematoxylin and eosin (H&E) stained frozen section (4 µm) was prepared from each sample and examined by a pathologist to ensure proper, representative normal tissue morphology. Three sections (10 µm each) were cut from each frozen tissue block and collected into a tube for subsequent RNA extraction.
Selection of Targets
We screened 51 proteins for which IHC-based data had been generated using both a rabbit polyclonal antibody from the HPA program (proteinatlas.org) and a mouse monoclonal antibody from the Antibody Portal at NCI (proteomics.cancer.gov/antibody-portal). Twelve proteins were selected for inclusion in the present investigation (ANXA1, SFN, S100A6, AKR1B1, S100A4, PTPA, FSCN1, GPI, APEX1, CRYAB, CDC34, and ODC1), and the corresponding primary antibodies were obtained from HPA and NCI (Supplementary Table 1). The selection of the 12 proteins to include was based on (1) differential expression of corresponding mRNAs across included tissue types; (2) antibody performance in IHC with both expected true staining and some degree of suspected off-target staining, taking into consideration correlation with mRNA levels and consistency with available literature; and (3) medium abundance (>10TPM) based on mRNA levels and strong staining based on IHC in at least one tissue type.
Immunohistochemistry
TMA sections were deparaffinized in xylene and blocked for endogenous peroxidase in 0.3% hydrogen peroxide. Antigen retrieval was performed in a citrate buffer at pH6 (Target Retrieval Solution, S169 from Dako, Glostrup, Denmark) by pressure boiling in a Decloaking Chamber (Biocare Medical, Walnut Creek, CA) at 125C for 4 min. The dilution of the primary antibody was determined by optimization of the antibody on a test slide consisting of TMA cores from 20 different tissue types, followed by careful manual evaluation of the staining pattern in correlation with mRNA expression levels, available literature on the gene, mRNA and protein level, and data on subcellular localization. The final dilution of the antibody was chosen when a high level of specificity was observed in cell types and structures expected to express the protein, together with minimum off-target binding in structures serving as negative controls, for example, with mRNA levels below cutoff. The final slides were stained in an Autostainer XL ST5010 (Leica Microsystems GmbH, Wetzlar, Germany) with the HRP-UltraVision kit (Thermo Fischer Scientific, Waltham, MA) as described previously.15,18 Upon blocking, the slides were incubated with primary antibodies diluted in UltraAb Diluent at room temperature for 30 min, followed by incubation with secondary HRP-conjugated antibodies and enzymatic reaction with the substrate diaminobenzidine (DAB) (Thermo Fischer Scientific). Slides were counterstained in Mayers hematoxylin (Histolab, Gothenburg, Sweden) and cover slipped using Pertex (Histolab) as mounting medium. High-resolution digital images were generated with an Aperio AT2 slide scanner (Aperio, Vista, CA), using a 20x objective.
isPLA
To perform isPLA the slides were first blocked in Duolink blocking solution (Sigma-Aldrich, Stockholm, Sweden) for 1 hr and incubated overnight at 4C with a combination of two primary antibodies, one rabbit polyclonal and one mouse monoclonal (Supplementary Table 1), diluted in Duolink antibody diluent (Sigma-Aldrich). For control experiments, only one primary antibody was used. Proximity ligation was performed according to the Duolink protocol (Sigma-Aldrich) as follows: Anti-mouse-PLUS and anti-rabbit-MINUS secondary isPLA probes were applied to the tissues or cells previously treated with the primary antibodies and incubated at 37C for 2 hr. After washing in Tris-buffered saline with Tween (TBS-T) (50 mM Tris base, 150 mM NaCl, pH 8.4, with 0.05% Tween 20) the ligation solution was added and incubated for 30 min at 37C. The solution was then replaced with the rolling circle amplification mix for another 90 min at 37C, followed by washing in TBS-T. The products of amplification were visualized by hybridization with HRP-conjugated probes (5’-CAGTGAATGCGAGTCCGTCT-3,’ Biomers) in SSC buffer supplemented with 0.4 µg/µl BSA, 0.05% Tween 20, and 0.01 µg/µl polyadenine (Sigma). After washing with TBS-T, the slides were incubated with DAB substrate (Thermo Fischer Scientific) for 1 min. Slides were subsequently stained with hematoxylin, coverslipped, and digitized in the same manner as the slides used for IHC.
RNA Sequencing
We used mRNA expression levels as a proxy for true protein expression levels in the different tissues and cell lines 19 when assessing the specificity of protein expression by IHC or isPLA. In order to investigate the abundance of the mRNAs encoding the investigated proteins, we performed deep sequencing (Illumina HiSeq 2000 system) for paired-end reads with a read length of 2x100 bases, as described previously. 17 The mRNA levels were quantified, normalized, and reported in transcripts per million (TPM) units, corresponding to the recorded number of transcripts for a given gene for every million transcripts in the sample. In total, we analyzed 172 individual patient samples derived from 39 cell lines and 37 healthy tissue types.
Quantification and Annotation
High-resolution digital IHC images of CMAs were analyzed using the TMAx software (Beecher Instruments, Sun Prairie, WI). The TMAx software was used to quantify staining intensity and fraction of immunostained cells as previously described. 20 Images from isPLA stained CMAs were analyzed using the CellProfiler software. Images of tissues stained with IHC and isPLA were manually evaluated and scored using a 4-graded scale based on both the intensity and extent of positive staining. Scoring was performed according to following: 0 = not detected (negative, or weak staining in <25% of the cells), 1 = low (weak staining in ≥25% of the cells, or moderate staining in <25% of the cells), 2 = medium (moderate staining in ≥25% of the cells, or strong staining in <25% of the cells), or 3 = high (strong staining in ≥25% of the cells). Examples of different scores are shown in Supplementary Fig. 1. Scoring was performed by a trained expert in histology (CL) and for all dubious or unclear cases, a consensus score was made together with a pathologist (FP). Tissues were scored both based on a defined “specific cell type” score, where staining for cell types characteristic for each included tissue type was recorded, and as a “whole-core” score where staining of all cells in the TMA core was recorded.
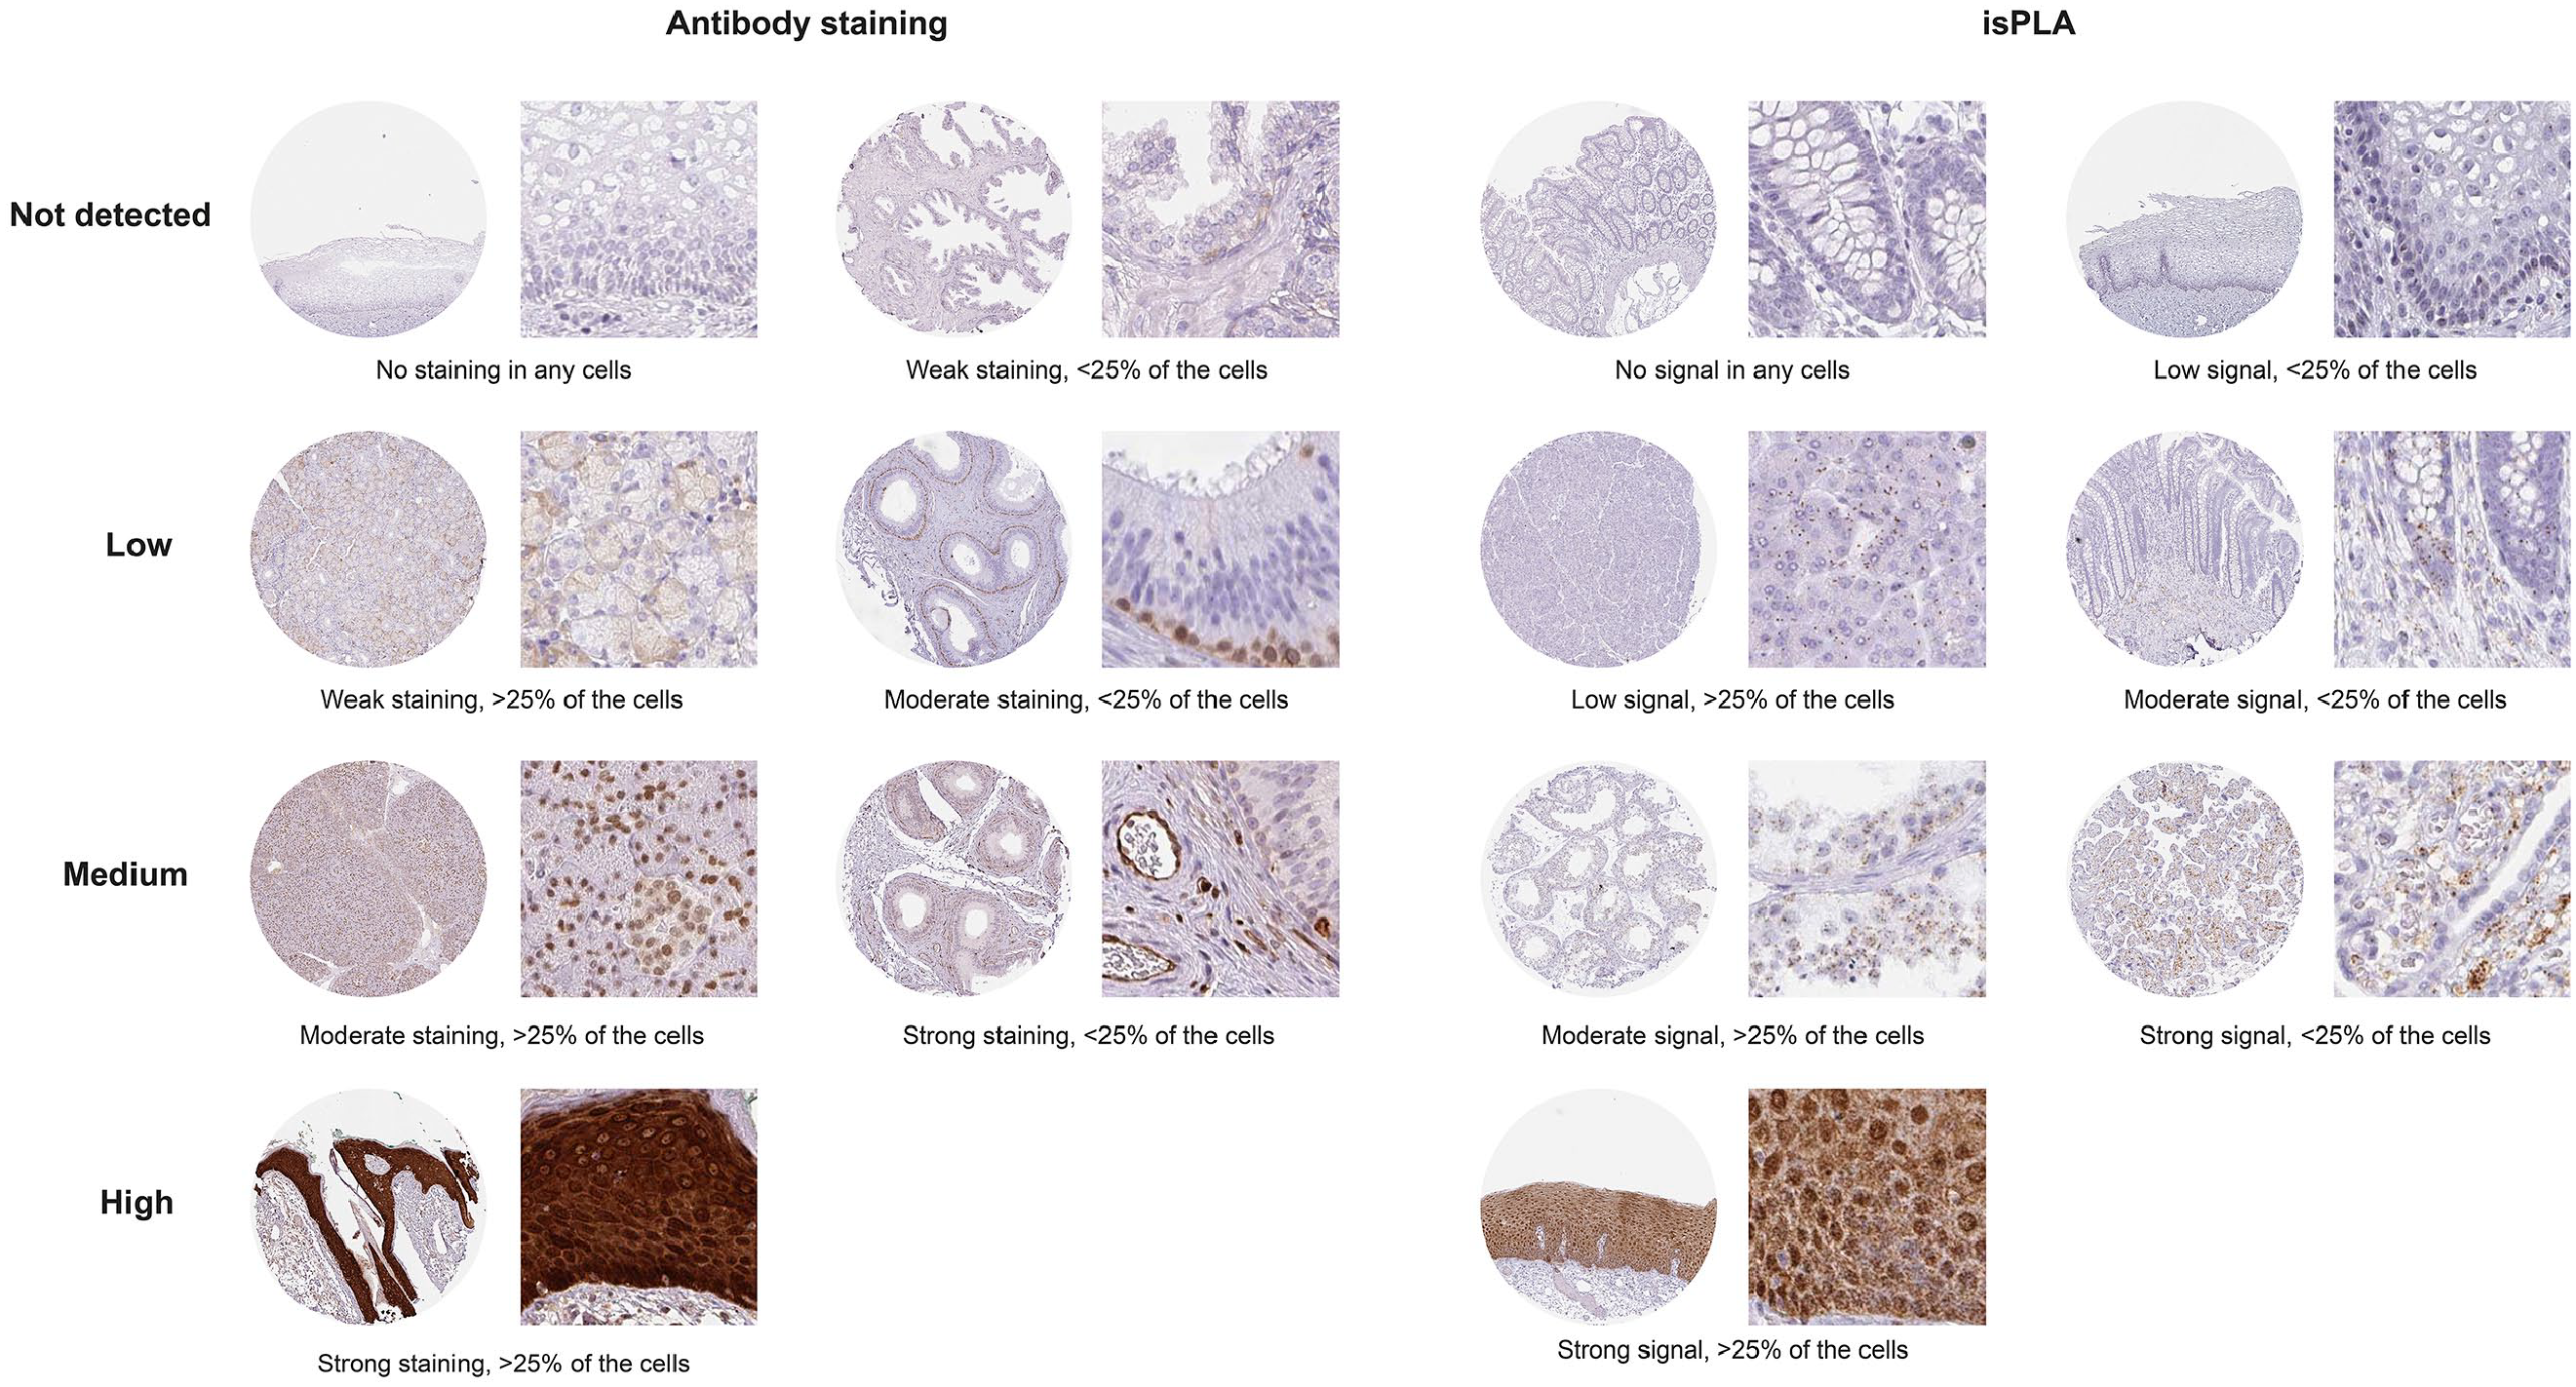
Examples of different annotation scores for tissues subjected to isPLA and IHC are shown as whole tissue microarray core overview (1 mm sample) and at high magnification. Not detected score is shown for IHC in exocervix (no staining in any cells) and prostate (weak staining in <25% of cells) and for isPLA in colon (no signal in any cells) and exocervix (low signal in <25% of cells). Low score is shown for IHC in salivary gland (weak staining in <25% of cells) and for epidydimis (moderate staining in <25% of cells) and for isPLA in pancreas (low signal in >25% of cells) and appendix (moderate signal in <25% of cells). Medium score is shown for IHC in pancreas (moderate staining in >25% of cells) and epidydimis (strong staining in <25% of cells) and for isPLA in testis (moderate signal in >25% of cells) and placenta (strong signal in <25% of cells. High score is shown for IHC in skin (strong staining in >25% of cells) and for isPLA in esophagus (strong signal in >25% of cells).
Data Processing and Statistical Analysis
All statistical analyses were performed using R version 3.3.2 with Rstudio, version 1.0.136. Both Pearson’s correlation coefficient and Spearman’s rank correlation coefficient were used to determine the correlation between the annotated tissue expressions based on IHC or isPLA and the RNA sequencing data, as well as correlating the expressions based on the different staining approaches to each other.
Results
For each of the 12 selected proteins, we stained 3 consecutive CMA and TMA sections using 2 independent antibodies in separate IHC reactions, and the same 2 antibodies in combination were also used for isPLA. Expression of mRNAs corresponding to the 12 tested proteins showed a substantial variation of expression levels across the analyzed cell lines and tissue types. All antibody pairs differed in their staining of the various cell lines and tissues by IHC, with at least one of the antibodies displaying presumed off-target binding in at least one sample having low or absent mRNA expression.
isPLA versus IHC for Cell Lines
CMAs encompassing 39 different cell lines derived from human cancer in different organs were used to compare mRNA expression with protein expression based on IHC and isPLA. The cell lines have the advantage over tissue samples that they are monoclonal in origin rather than combinations of different cell populations, allowing direct comparison to mRNA expression levels across all cells in the same sample. Protein expression levels as recorded from IHC and isPLA stainings were quantified using automated image analysis software to enable straightforward and unbiased comparison with corresponding mRNA expression levels in the same cell lines. Both Pearson and Spearman correlations were used to determine the level of correlation across all 39 cell lines. For 9 out of 12 proteins (ANXA1, SFN, S100A6, AKR1B1, S100A4, PTPA, FSCN1, GPI, and APEX1), a consistent significant correlation was observed between isPLA and mRNA using both Pearson and Spearman statistics (Table 1). Examples of three genes (ANXA1, SFN, and S100A6) with variable levels of mRNA expression in cell lines and variable levels of corresponding protein expression as recorded from isPLA and IHC using two different antibodies are shown in Fig. 1. For seven of the nine proteins with consistently significant correlations between isPLA and mRNA, the IHC levels also correlated significantly with mRNA expression for both HPA (rabbit polyclonal) and NCI (mouse monoclonal) antibodies, using both Pearson and Spearman statistics. The results suggest a generally high specificity of both HPA and NCI antibodies for these seven proteins, with only a limited amount of off-target binding. For the other two of these proteins (GPI and APEX1), with consistent significant correlation between isPLA and mRNA, a significant correlation between IHC and mRNA was evident for only one of the antibodies. Three proteins (CRYAB, CDC34, and ODC1) did not exhibit significant correlation between isPLA and mRNA levels.
Correlation Across 39 Cell Lines Comparing mRNA Expression and Protein Expression Using isPLA and IHC. Correlation Coefficients Are Given for Both Pearson (Top) and Spearman (bottom) for Correlations Between isPLA and mRNA Expression as Well as Between IHC With Both Antibodies and mRNA. Significant Correlation (p<0.05) Is Shown With Green Background and Non-significant Correlation With Red Background.
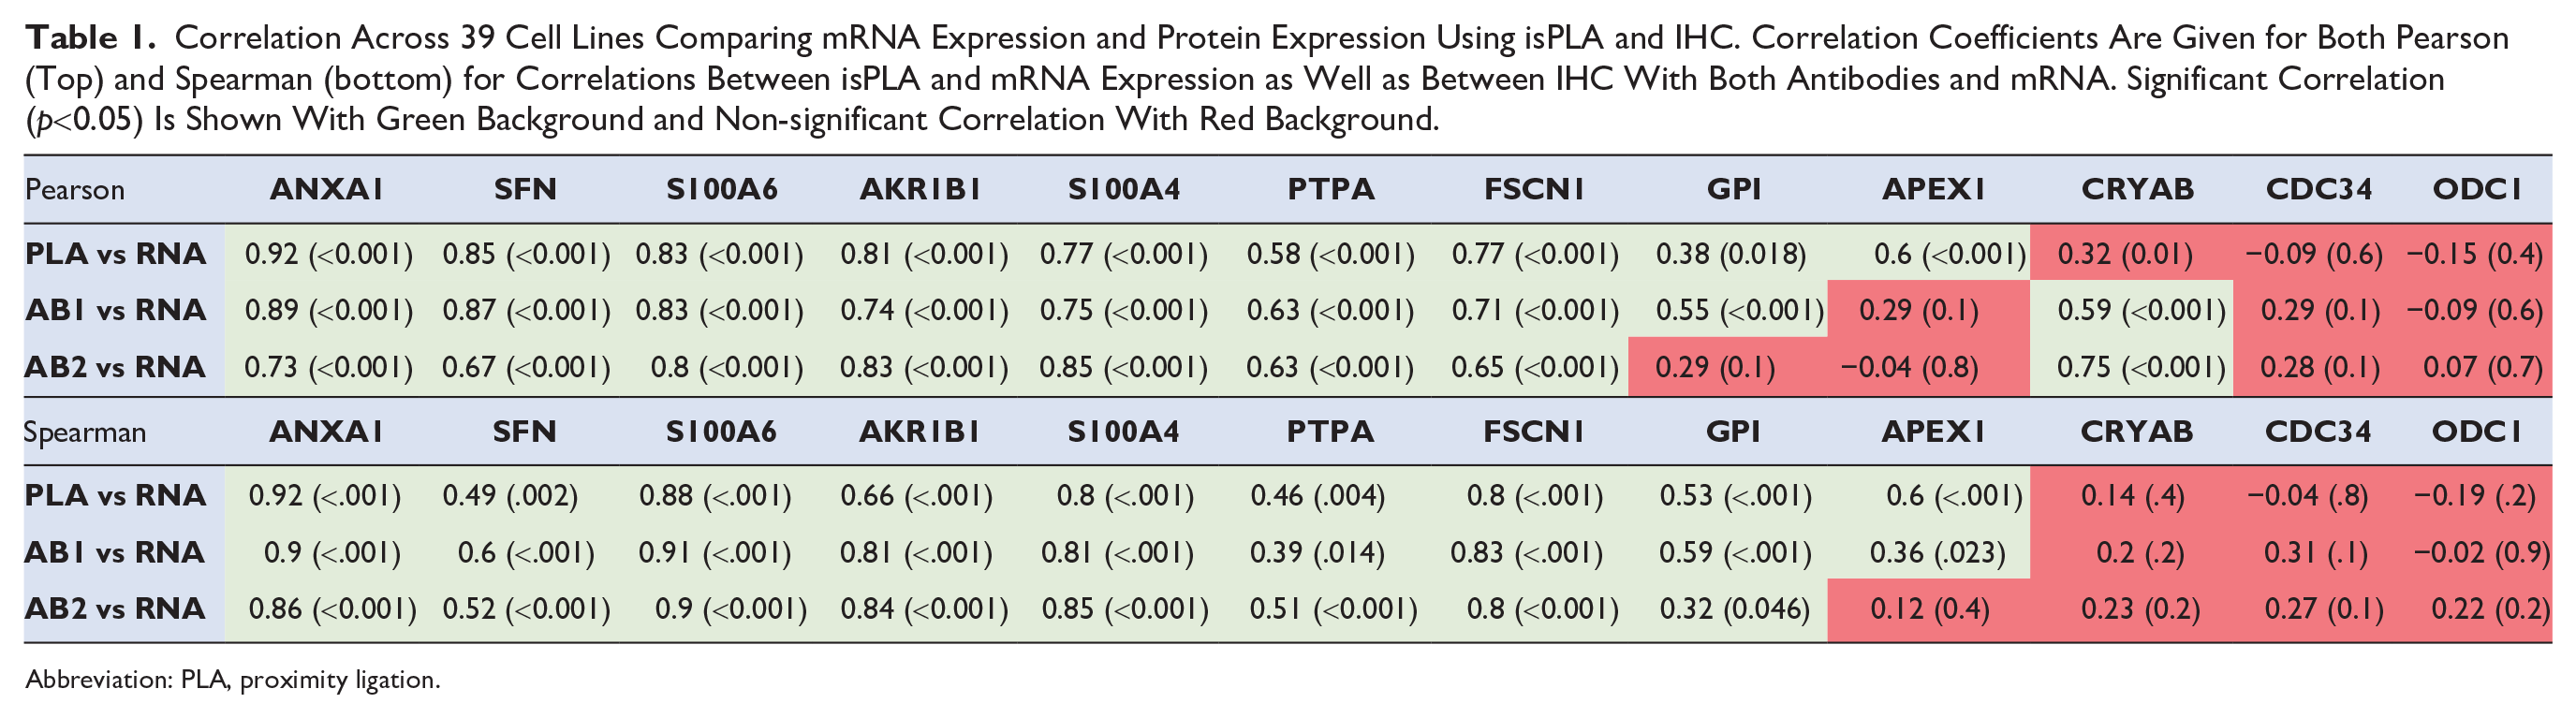
Abbreviation: PLA, proximity ligation.
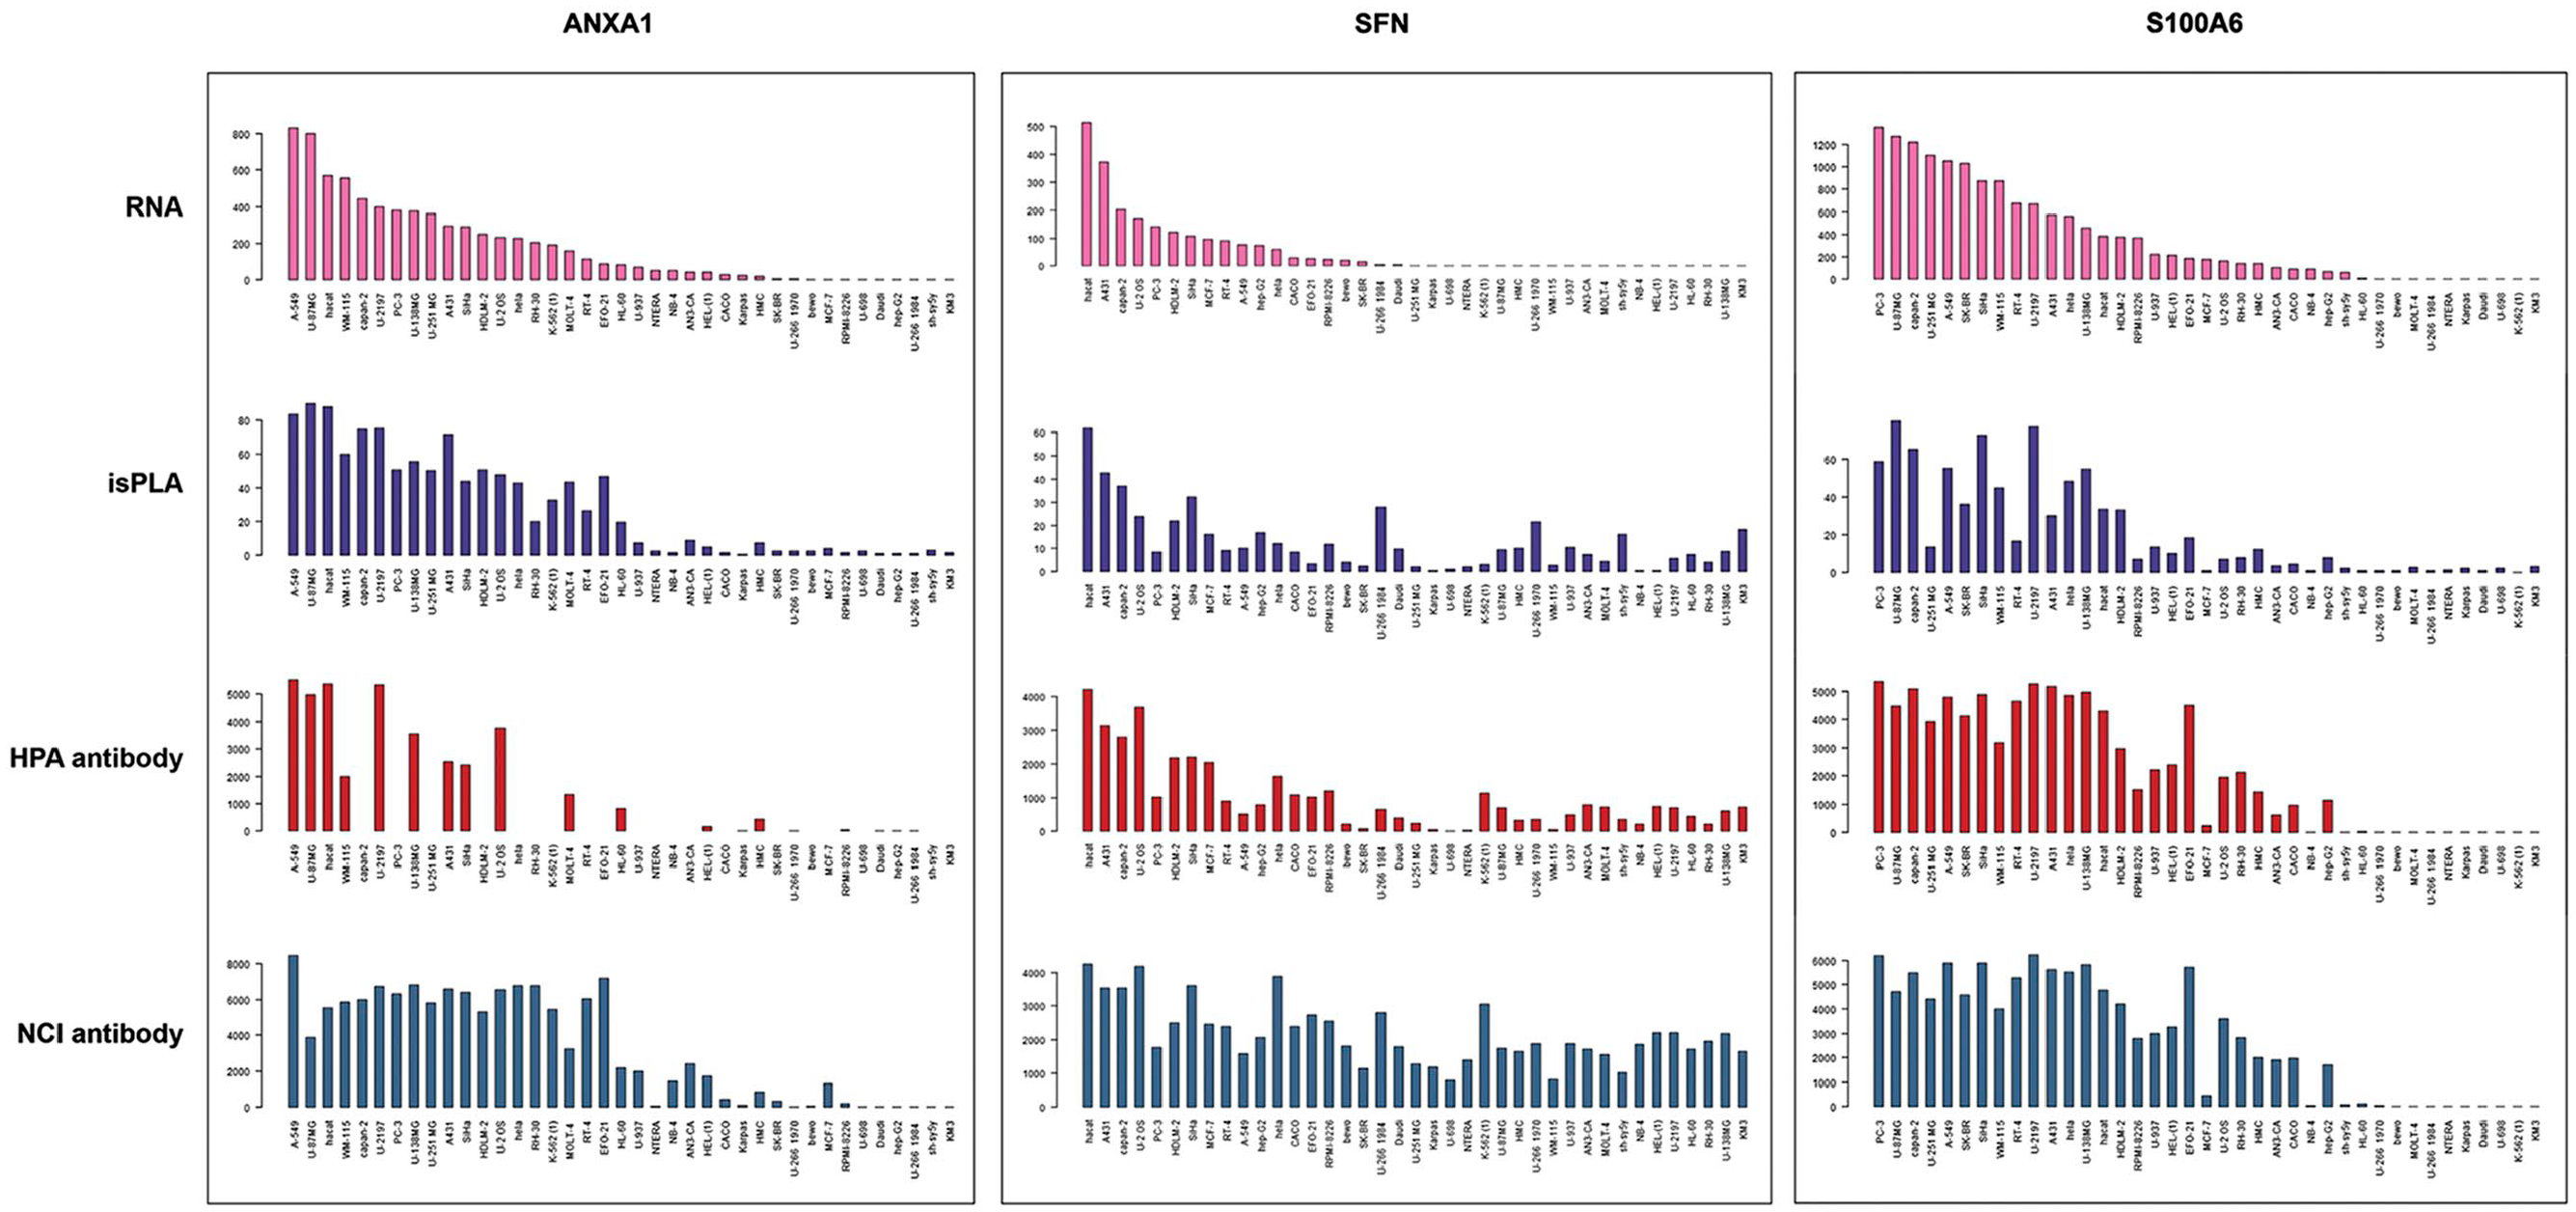
Comparison of mRNA and protein expression using isPLA and IHC for ANXA1, SFN, and S100A6 in cell lines. Bar charts showing mRNA expression levels with Transcripts Per Kilobase Million (TPM) on the y-axis (top), and semi-quantitative scores from automated annotation (lower three panels) of IHC and isPLA staining, corresponding to the 39 analyzed cell lines. The three shown proteins and corresponding mRNA: s for ANXA1, SFN, and S100A6 showed a consistently significant correlation between mRNA and isPLA using both Pearson and Spearman statistics. Abbreviations: isPLA, in situ proximity ligation; IHC, immunohistochemistry.
Primary data across all cell lines using IHC, isPLA, and RNA sequencing for the remaining 9 proteins not shown in Fig. 1 are presented in Supplementary Fig. 2.
isPLA versus IHC for Human Tissues
IHC and isPLA signals were manually evaluated and scored using both a defined “specific cell type” score and as a “whole-core” score for each of the 37 tissue types included. The data based on “whole-core” score is most closely analogous to the mRNA analysis as this is based on scores obtained from staining of all cells across a given tissue. There was an overall better correlation to mRNA levels using the “whole-core” score compared to “specific cell type” score, and we therefore used the “whole-core” score in further comparisons between results of IHC and isPLA with mRNA expression levels. Both Pearson and Spearman statistics were used to determine the level of correlation of expression levels across all 37 tissue types. The manual evaluation of IHC and isPLA, with scores based on a semi-quantitative approach, showed that both Pearson and Spearman correlation was in general similar to the results for cell lines. SFN, AKR1B1, S100A4, and FSCN1 showed consistent correlations for both isPLA and IHC in tissues as they did in cell lines, whereas CDC34 and ODC1 failed to show any significant correlation in either cell lines or tissues. Overall correlations appeared lower in tissues compared to cell lines, with a significant correlation between isPLA and mRNA for three genes (ANXA1, S100A6, and PTPA) where IHC vs mRNA did not show significant correlation. In contrast to the cell line analysis, there was no significant correlation between mRNA and isPLA for GPI and APEX1 in tissues, whereas CRYAB showed a significant correlation between mRNA and isPLA in tissues (Table 2). Visual assessment of the spatial distribution regarding isPLA and IHC signals at a cell type-specific level showed that isPLA signals were less widespread and more distinct compared to IHC, consistent with a lower degree of unspecific binding using isPLA.
Correlation Across 37 Tissue Types Comparing mRNA Expression and Protein Expression Based on “Whole-Core” Annotation Data Using isPLA and IHC. Correlation Coefficients Are Given for Both Pearson (Top) and Spearman (Bottom) for Correlations Between isPLA and mRNA Expression as Well as Between IHC With Both Antibodies and mRNA. Significant Correlation (p<0.05) Is Shown With Green Background and Non-significant Correlation With Red Background.
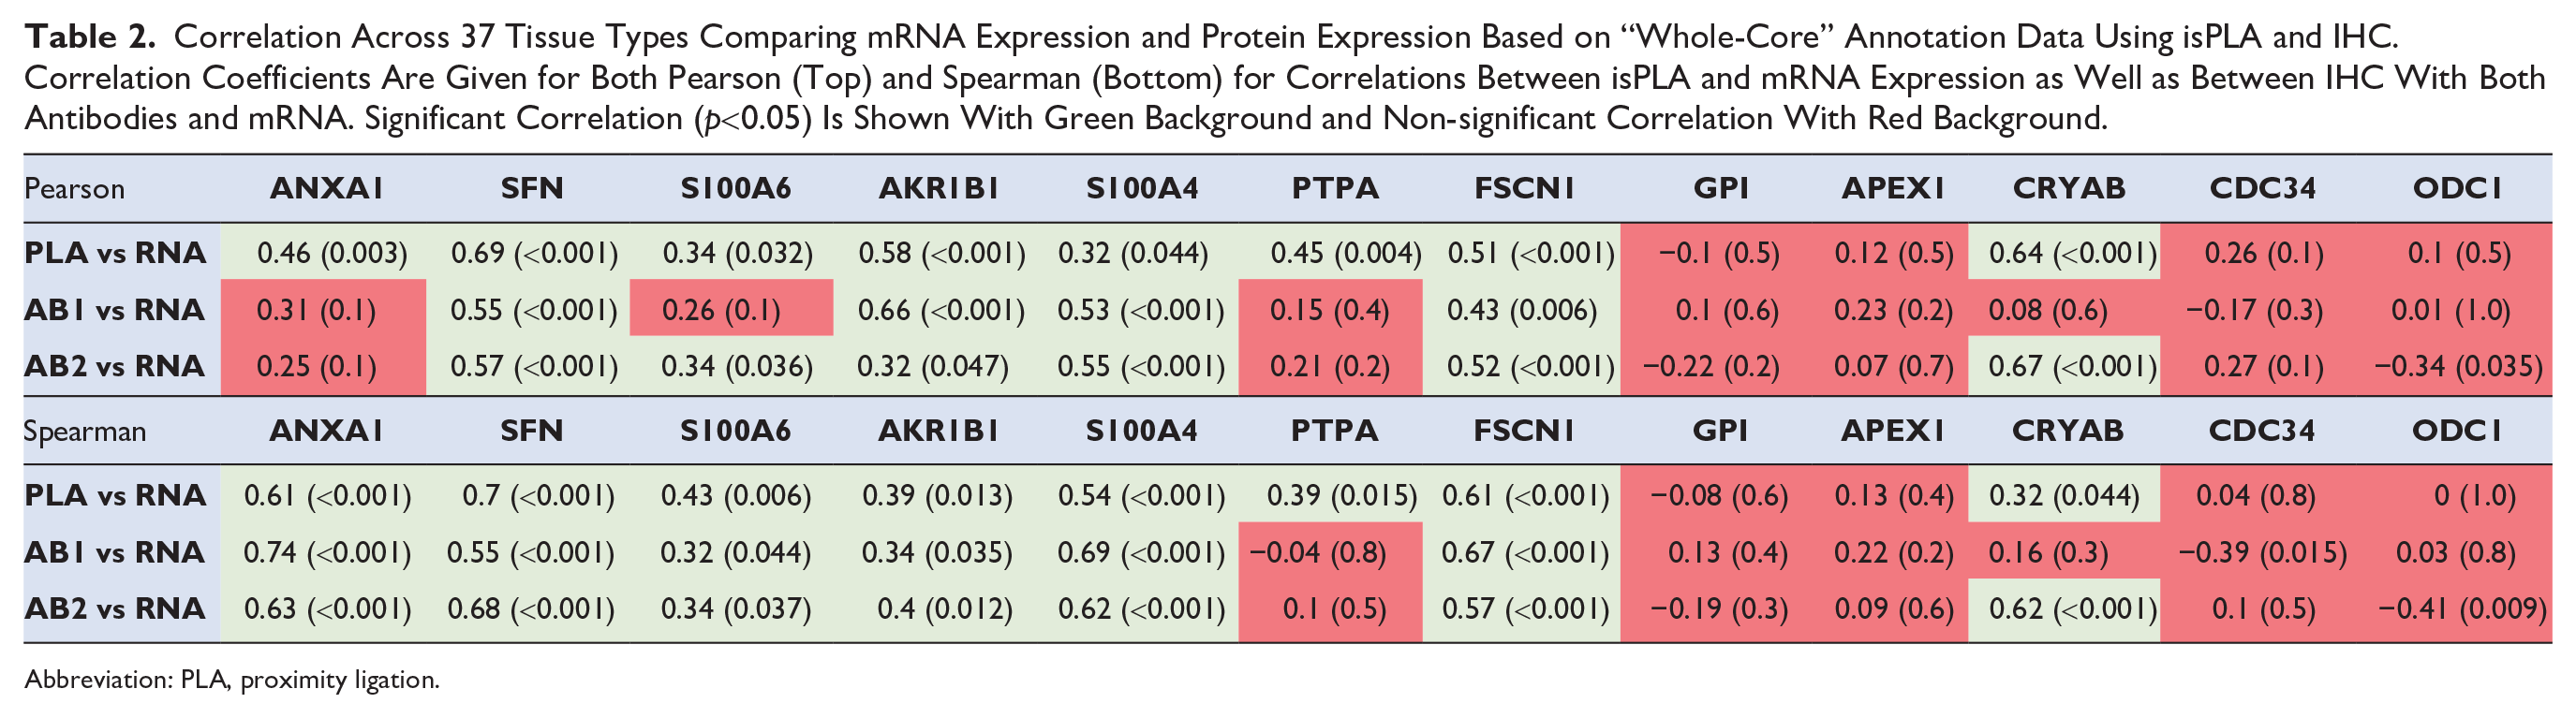
Abbreviation: PLA, proximity ligation.
SFN, AKR1B1, S100A4, and FSCN1 all showed a consistently significant correlation between mRNA and protein using both isPLA and IHC. Despite significant correlations it is evident that several tissues with no or relative low mRNA levels show a positive staining with IHC, exemplified by SFN in liver, AKR1B1 in colon, and FSCN1 in epididymis (Fig. 2). For ANXA1, S100A6, PTPA, and CRYAB there was a consistently significant correlation between mRNA and isPLA, but not for IHC. For ANXA1, S100A6, and PTPA one or both antibodies failed to show a consistent correlation between mRNA and IHC in tissues. The general pattern of protein expression was similar in IHC and isPLA, with additional or aberrant IHC staining in certain tissue types with low mRNA. Interestingly, CRYAB showed a highly significant correlation between mRNA and isPLA as well as for one of the antibodies using IHC (Fig. 3). By contrast, CDC34 and ODC1 did not show any significant correlation between mRNA and protein expression similar to the results in cell lines. GPI and APEX1 that both exhibited consistently significant correlations between mRNA and isPLA in cell lines, failed to show significant correlation between mRNA and protein expression in tissues (Fig. 4).
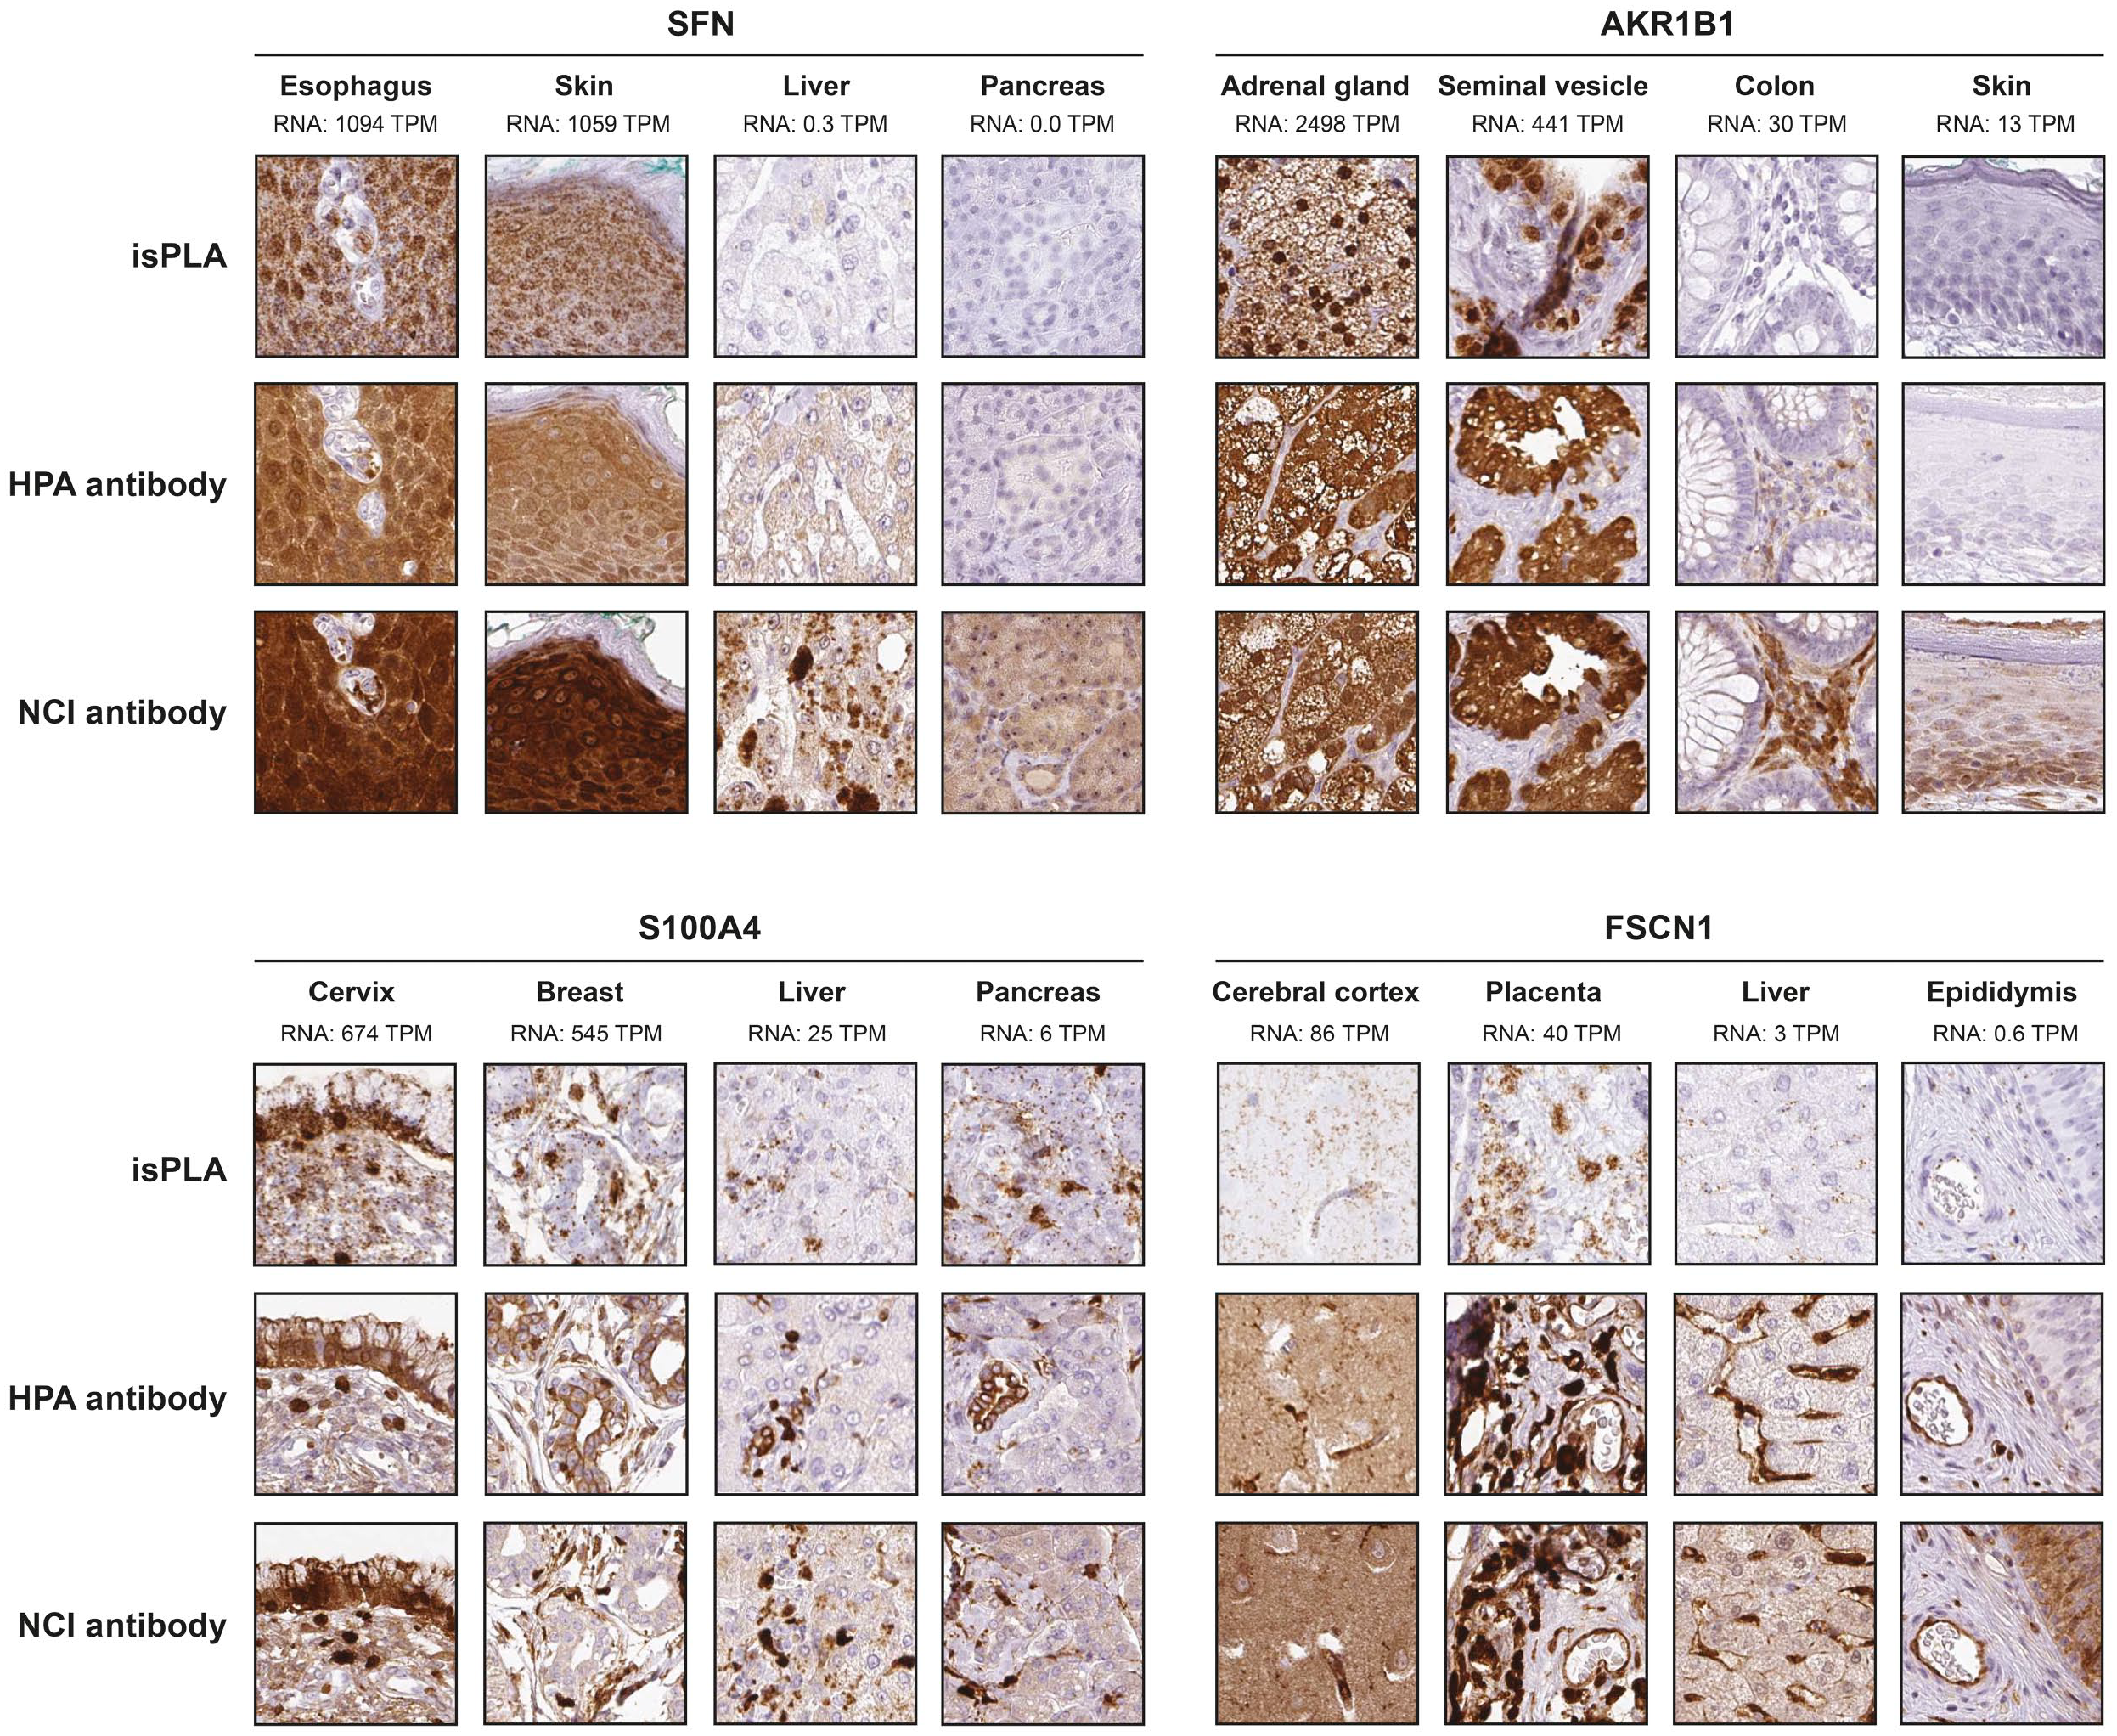
Protein expression patterns by IHC and isPLA in tissues for SFN, AKR1B1, S100A4, and FSCN1. Examples from two tissues with high and two tissues with low mRNA expression levels are shown for each protein to demonstrate the localization of isPLA and IHC signals.
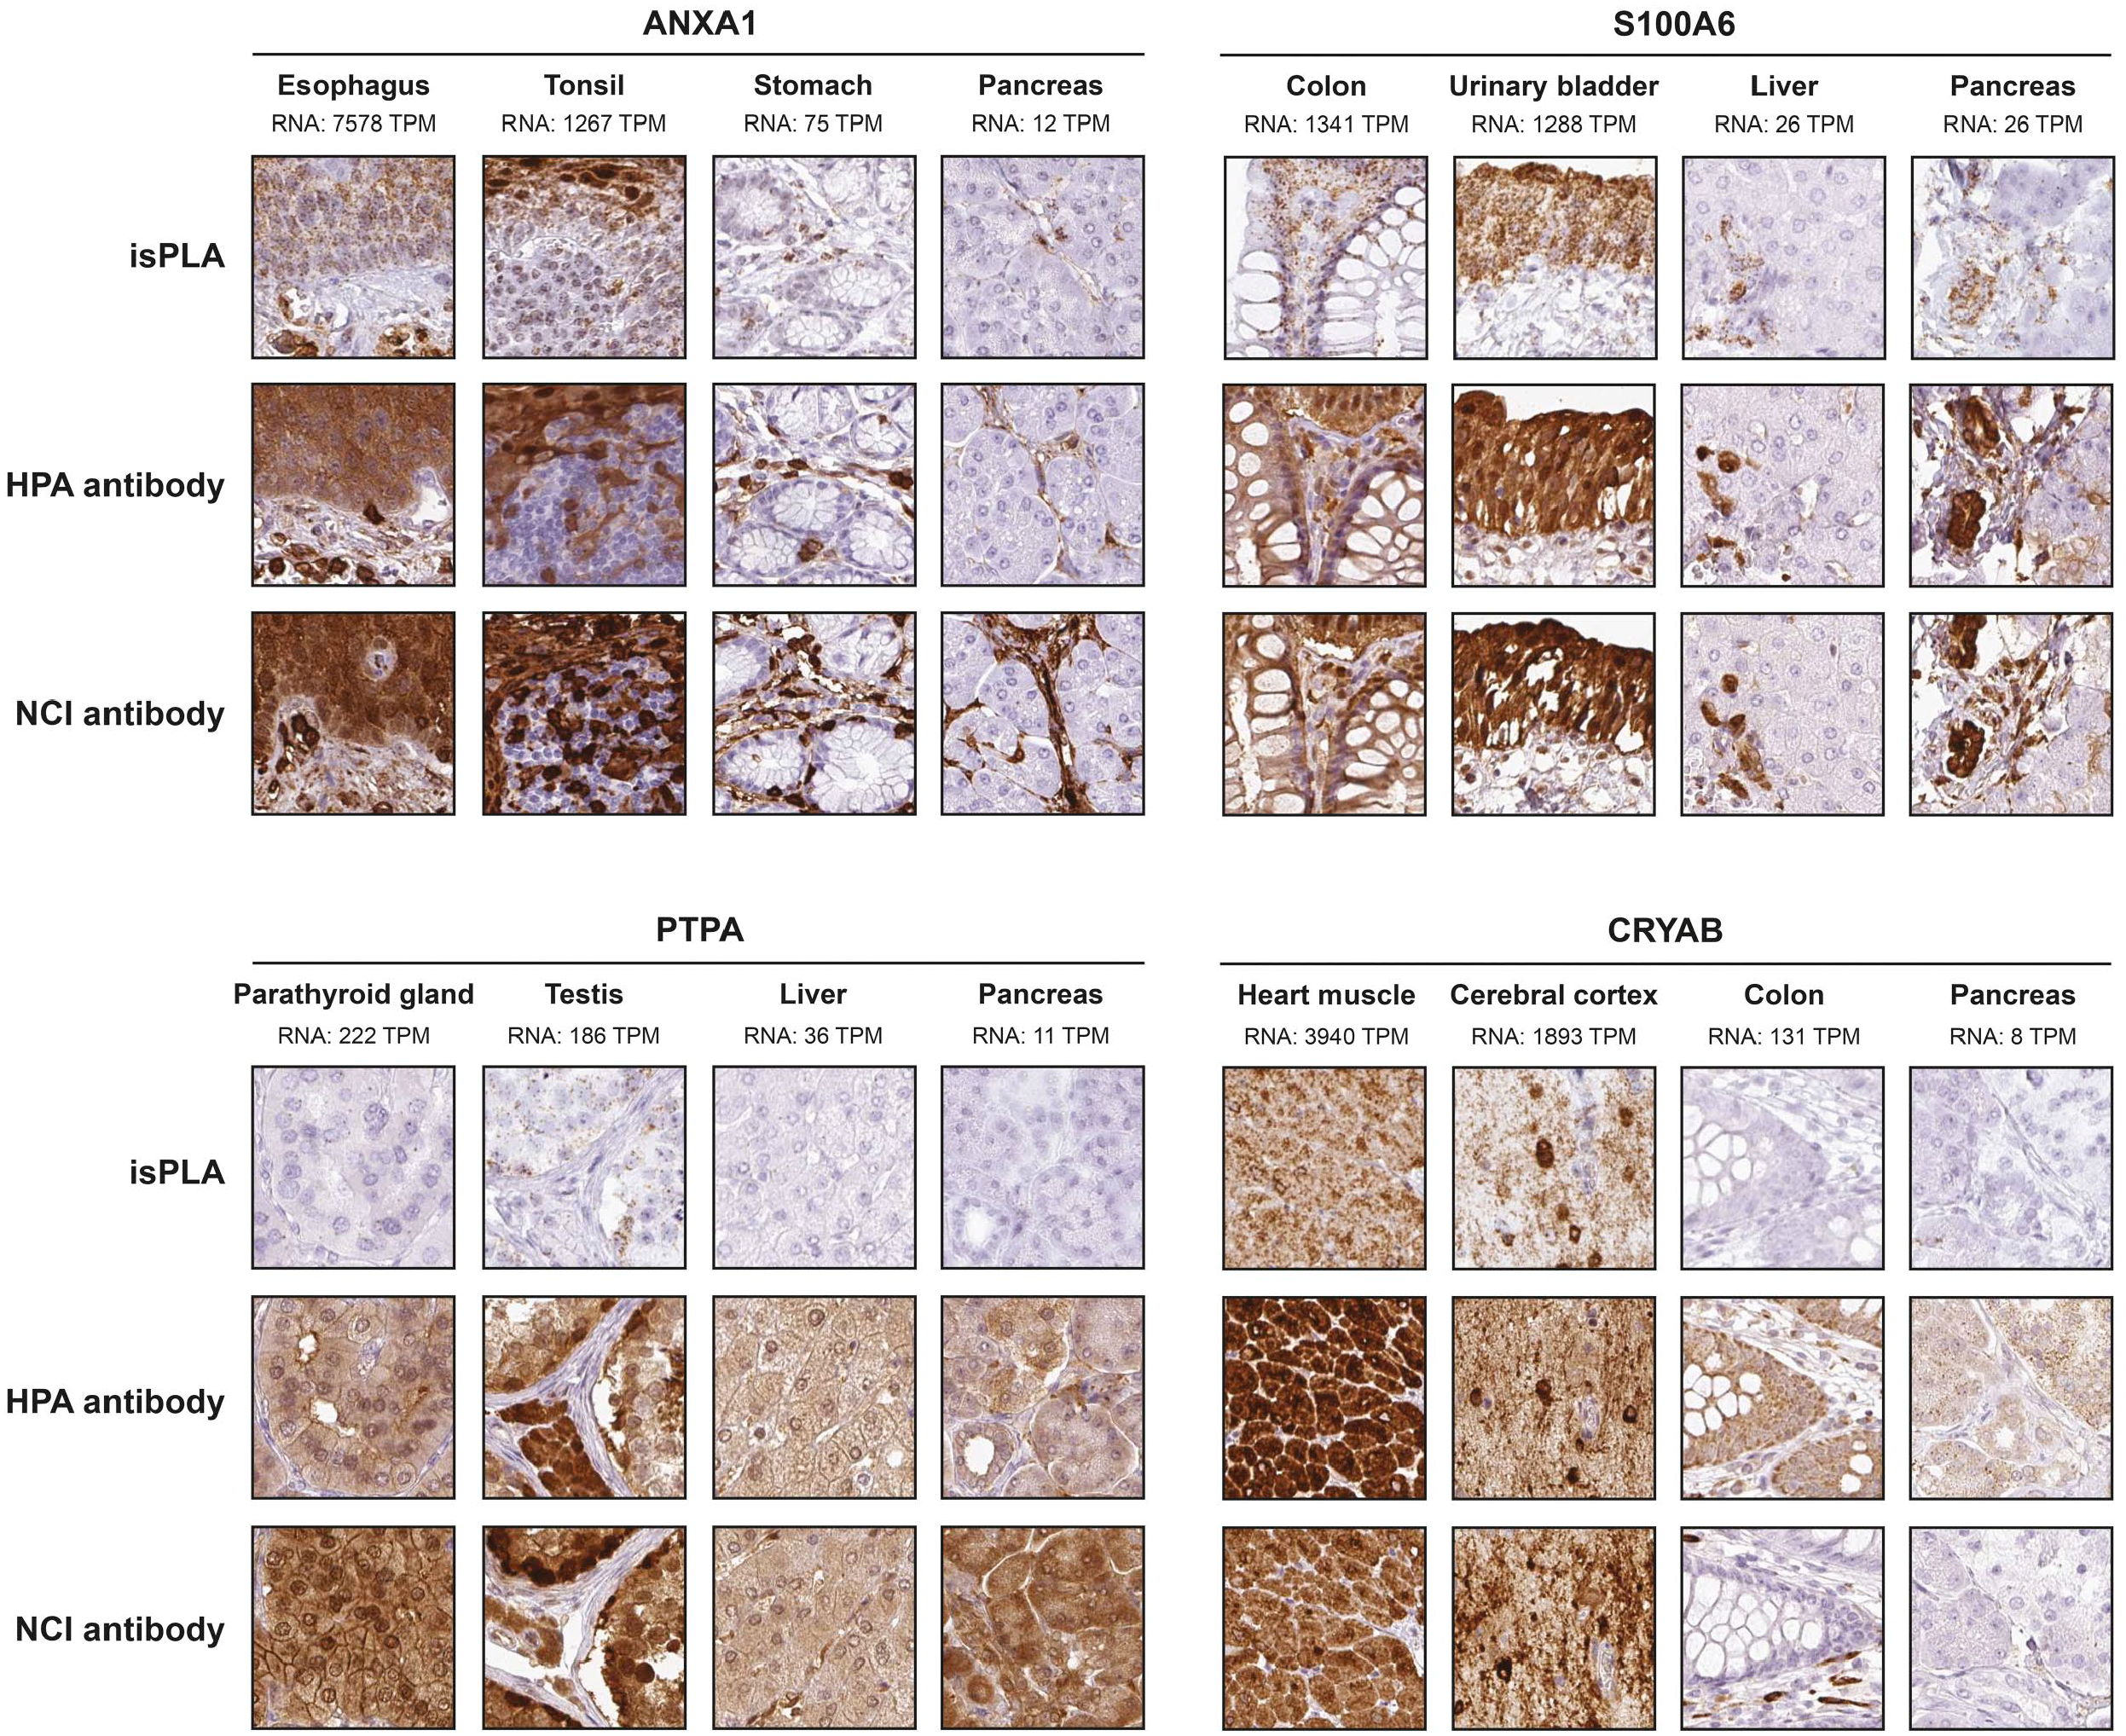
Protein expression patterns by IHC and isPLA in tissues for ANXA1, S100A6, PTPA, and CRYAB. Examples from two tissues with high and two tissues with low mRNA expression levels are shown for each protein to demonstrate the localization of isPLA and IHC signals.
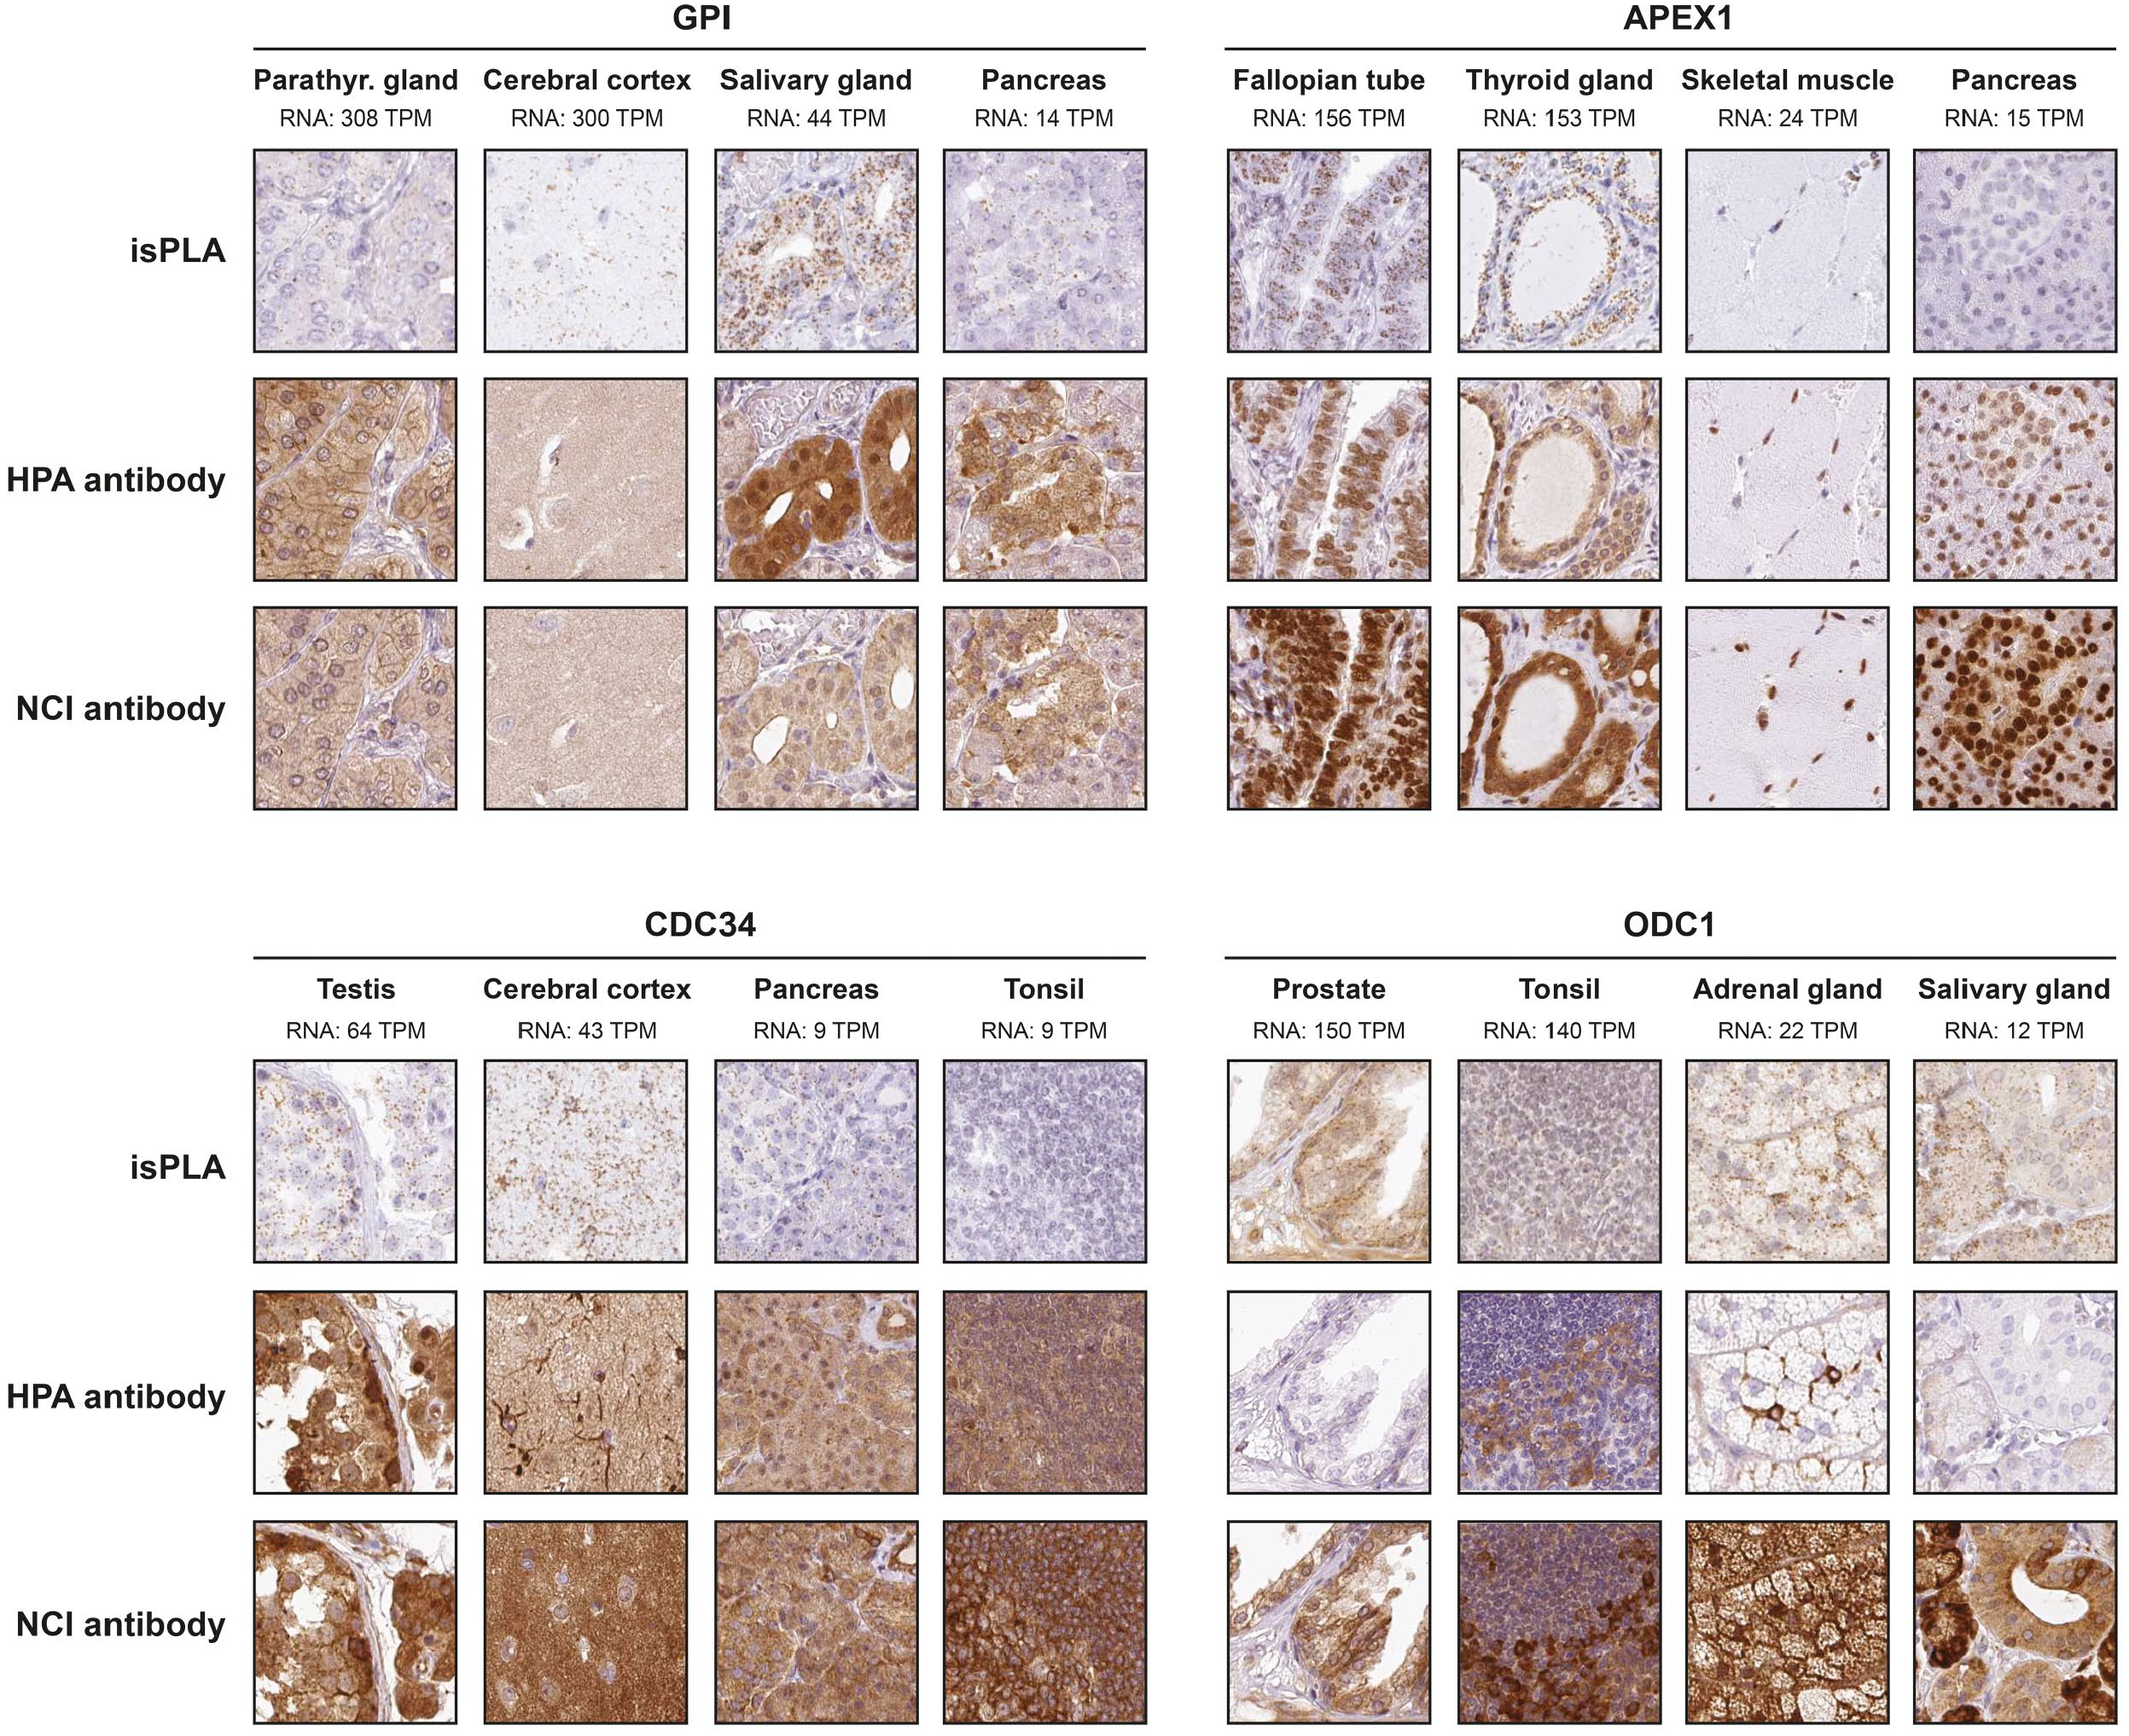
Protein expression patterns by IHC and isPLA in tissues for GPI, APEX1, CDC34, and ODC1. Examples from two tissues with high and two tissues with low mRNA expression levels are shown for each protein to demonstrate the localization of isPLA and IHC signals.
Primary isPLA and IHC data based on “whole core scores” in 37 tissue types, as well as “specific cell type” scores, where 80 main cell types and structures were annotated, are presented in Supplementary Fig. 3 and Supplementary Table 2.
Discussion
Our comprehensive analysis by IHC and isPLA for a set of 39 cell lines and 37 tissue types has allowed us to evaluate specific versus off-target protein binding for 12 proteins with variable and in part previously unknown expression patterns. We used quantitative mRNA expression levels (based on RNA sequencing) in corresponding tissues as a blueprint for where to expect high versus low expression of the corresponding proteins. The use of mRNA as a proxy for protein expression has been debated. Nonetheless, studies have shown that the correlation between levels of a specific transcript and the corresponding protein tend to be high across different tissues, provided that a gene-specific RNA-to-protein conversion factor is considered. 19 It is therefore anticipated that cells and tissues at a steady state with low expression levels of a given specific mRNA molecule also show a lower abundance of the corresponding protein and conversely.
In our study, we found strong correlation between the levels of mRNA and the corresponding isPLA results for 8 out of 12 tested candidate proteins in tissues. The poor correlation for the remaining four candidate proteins may be due to limited ability of the tested antibodies to recognize their intended target proteins; however, it could also reflect difficulties translating image data into the semi-quantitative scores used for correlation analysis with continuous mRNA expression data. Also, it cannot be ruled out that for certain genes the correlation between transcript and protein levels may be much weaker than for others. Differences between samples selected for RNA-Seq and for protein expression profiling can also be considered. The discordant results from parathryroid gland with high mRNA expression levels of PTPA (Fig. 3) and GPI (Fig. 4) and lack of clear isPLA signals despite positive IHC staining are unclear, but may be explained by individual differences between the very few samples used for RNA-Seq and samples used for IHC. For CDC34 and ODC1, which both failed to show any significant correlation between mRNA and protein expression, the results as well as the visual assessment of variable staining patterns suggest that these antibodies are of poor quality for use of protein detection in FFPE tissues.
We used both Pearson and Spearman correlations to capture both linear and non-linear monotonous correlations. 21 As discussed, the central dogma of molecular biology ensures an intimate association between mRNA and protein products of the same genes. However, mRNA transcripts can be translated to protein at varying rates, and both mRNA and protein exhibit variable turn-over, which would make a case for using Spearman correlations. On the other hand, non-monotonic but visually intuitive correlations are better captured by the linearity estimate of the Pearson correlation.
An obvious challenge for tissue-based assays where outcome depends on spatial assessment is how to record such results as quantitative data. It is difficult to convert an immunohistochemically stained complex tissue with several different cell populations and structures into quantitative measurements. The golden standard has long been that evaluation and scoring is done by a person trained in microscopy, for example, a pathologist. Technologies currently being developed for image analysis and machine learning are expected to overcome some of the problems with reproducibility due to subjectivity, although as of today we still lack algorithms to evaluate the finer details of immunohistochemically stained tissues. In this study, we tested different scoring methods to record protein expression data from stained tissues. Our approaches included both scoring of specific cell types and stroma/extracellular matrix (data not shown), as well as identifying a “whole-core” score based on all available cells in the tissue core. When compared with mRNA expression levels the “whole-core” score appeared best suited for analyzing correlation. Despite efforts to define the evaluation that underlies attempts for standardized scoring of tissue staining, visual assessment by a trained eye still appears superior for interpreting similarities and differences of protein expression using isPLA and IHC in consecutive sections, exemplified in ANXA1 and S100A6 images that appear with a near perfect concordance between isPLA and IHC with both antibodies (Fig. 3), even though the correlation to mRNA levels was relative poor for IHC. Also for unspecific IHC staining visual appraisal appears superior to fully evaluate differences and similarities between isPLA and IHC, as exemplified by excessive IHC staining in tissues with no or low mRNA for SFN, AKR1B1, S100A4 (Fig. 2), PTPA, and CRYAB (Fig. 3). A trained eye can also recognize artifacts, as seen in liver for the NCI antibody directed against SFN (Fig. 2). Here, the strongly stained structures are interpreted as unspecific binding to lipofuscin pigment and not taken into consideration in the manual annotation. Although correlation statistics using both Pearson and Spearman approaches appear appropriate to evaluate differences in outcome of isPLA and IHC, the very coarse scoring of positive staining is clearly insufficient to convey the details apparent by visual appraisal.
Antibody sensitivity and specificity is a major concern in IHC and the continuous increase of available antibodies to a large set of protein targets expressed at highly variable levels in different tissues and cells has caused a demand for a more structured pipeline for assay specific validation of antibodies. 2 This is of particular importance in clinical research when introducing novel candidate biomarkers in cohort studies using IHC.22,23 Analysis of mRNA expression for tissue localization of corresponding proteins is an attractive strategy for proteins that lack previous knowledge of expected expression pattern. Provided the correlation between mRNA levels and corresponding protein both RNA in situ hybridization, 24 single cell transcriptomics and bulk sequencing of RNA extracted from tissue can provide inferred evidence to substantiate findings based on IHC. For more direct detection and localization of a protein, the dual recognition required for isPLA provides increased detection specificity, which is well known for solution-phase protein detection by ELISA, has also been previously demonstrated on a smaller scale for isPLA.14,25 An increased use of isPLA, perhaps via an improved probe design, 26 can serve both to validate antibodies for IHC use, but isPLA reactions also offer an attractive approach for routine in situ protein detection for demanding targets.
The technique is particularly useful in determining the presumed true protein expression pattern in complex tissue samples consisting of a mixture of different cell types expressing low levels of mRNA. The orthogonal approach to compare mRNA and protein levels in tissues with low levels gene expression faces challenges to determine which cells are expected to show notable protein expression. While complementary single cell or spatial techniques on the mRNA level constitute important approaches for comparison with protein expression levels based on IHC, these techniques face other technical challenges. It is also important to note that despite a general high correlation between mRNA and protein levels, it is not certain that low mRNA levels can directly be translated to a functional phenotype. Thus, an alternative approach such as isPLA for validation of antibodies in tissues constitute an important addition to the field, and serves as an attractive approach both in basic and clinical research.
In conclusion, a total of 5400 staining reactions were evaluated in this study. The 39 cell lines and 37 tissue samples collected from three individuals were each subjected to two IHC and one isPLA reactions for each of 12 different proteins. Based on our visual interpretation of tissue sections stained either by IHC or by isPLA, we conclude that isPLA, with its requirement for coincident target binding by two antibodies, provides a generally higher specificity than IHC using single antibodies, in addition to the ability to avoid signals that represent noise from off-target binding using IHC. We foresee that the rapidly evolving field of digital pathology with image analysis based on machine learning algorithms together with isPLA will provide high fidelity spatial data with lower bias and more quantitative measurement of protein signals compared to conventional IHC.
Supplemental Material
2020-00032R1_Supplemental_Data_online_supp – Supplemental material for Proximity Ligation Assay as a Tool for Antibody Validation in Human Tissues
Supplemental material, 2020-00032R1_Supplemental_Data_online_supp for Proximity Ligation Assay as a Tool for Antibody Validation in Human Tissues by Cecilia Lindskog, Max Backman, Agata Zieba, Anna Asplund, Mathias Uhlén, Ulf Landegren and Fredrik Pontén in Journal of Histochemistry & Cytochemistry
Footnotes
Acknowledgements
We wish to thank Tara Hiltke at the National Cancer Institute for providing abs for IHC and isPLA experiments.
Competing Interest
The author(s) declared the following potential conflicts of interest with respect to the research, authorship, and/or publication of this article: UL is shareholder of Novice having rights to isPLA.
Author Contributions
FP and UL conceived and designed the study. AZ and AA performed PLA and IHC experiments, CL annotated all histological samples, and MB performed statistical analyses. All authors analyzed and interpreted data. CL, FP, AZ, and MB wrote the manuscript, with contributions from all authors. CL and MB assembled the final figures. All authors commented on and agreed on the presentation.
Funding
The author(s) disclosed receipt of the following financial support for the research, authorship, and/or publication of this article: This work was supported by the Knut and Alice Wallenberg Foundation (#2008:0143).
References
Supplementary Material
Please find the following supplemental material available below.
For Open Access articles published under a Creative Commons License, all supplemental material carries the same license as the article it is associated with.
For non-Open Access articles published, all supplemental material carries a non-exclusive license, and permission requests for re-use of supplemental material or any part of supplemental material shall be sent directly to the copyright owner as specified in the copyright notice associated with the article.