
Abstract
γ-Glutamyl cyclotransferase (GGCT) contributes to the γ-glutamyl cycle that regulates glutathione metabolism. Although GGCT has been implicated in several studies as a possible cancer marker, little is known about its distribution in cells and tissues. The authors investigated GGCT expression in normal tissues and tumors using Western blots and immunohistochemistry with a novel anti-GGCT monoclonal antibody. GGCT was detected in most organs and was mainly found in epithelial cells. Although the intracellular distribution was mainly cytoplasmic, in some situations, nuclear staining was strong. A significant increase in the expression of GGCT was found in tumors of the lung, esophagus, stomach, bile duct, and uterine cervix. In contrast, there was a significant decrease in expression in renal and urothelial tumors. These results suggest that GGCT may be a biomarker of tumors in a limited range of organs.
Keywords
Glutathione is the major antioxidant in cells, and its conjugation to electrophiles by glutathione transferase enzymes contributes to the detoxification and elimination of a wide range of xenobiotic compounds. The γ-glutamyl cycle is a pathway that encompasses the synthesis and degradation of glutathione and is also thought to contribute to the uptake of amino acids across cellular membranes (Meister and Anderson 1983). Within the γ-glutamyl cycle, glutathione is hydrolyzed by membrane-bound γ-glutamyl transpeptidase to release cysteinyl-glycine and form a γ-glutamyl–amino acid dipeptide from a free amino acid (AA) brought in from outside the cell. In the cytoplasm, γ-glutamyl cyclotransferase (GGCT) cleaves the γ-glutamyl-AA to give 5-oxoproline and a free AA (Meister 1973). GGCT can also cleave γ-glutamylcysteine, an intermediate in the synthesis of glutathione, to release cysteine and 5-oxoproline (Smith et al. 1980). Human GGCT is a homodimer of 20,994 Da subunits composed of 188 amino acids, and its structure was recently determined by X-ray crystallography (Oakley et al. 2008). The GGCT gene occurs on chromosome 7p14-15 and consists of four exons that span 8 kb (Oakley et al. 2008).
Prior to the cloning of GGCT, its sequence was known as an open reading frame of unknown function on chromosome 7 and termed C7orf24. In several previous studies, differential expression of C7orf24 (GGCT) was noted in tumor tissues (Gromov et al. 2010; Kageyama et al. 2007; Uejima et al. 2011; Xu et al. 2007; Zhang et al. 2006), and it has been proposed that it may be a cancer biomarker. However, little is known about the cellular distribution of GGCT in normal human tissues or in human tumors. To further investigate the possibility that GGCT may be a biomarker with applications in cancer diagnosis, we have undertaken an extensive investigation of GGCT expression in normal human tissues and in tumors. For this study, we generated a new anti-human GGCT monoclonal antibody (GGCT-mAb) to detect the distribution of GGCT by immunohistochemistry (IHC) and Western blotting.
Materials and Methods
Patients
A total of 3 patients with autopsies performed at the Tokyo Medical and Dental University between September 2009 and January 2010 and a total of 785 patients with surgical operations performed at the Tokyo Medical and Dental University between April 2007 and April 2009 were enrolled in the study. The clinical background of the 3 autopsy cases is summarized in Table 1. Informed consent was obtained from all patients after explanation of the purpose of this study. The Ethics Committee of the Tokyo Medical and Dental University medical center approved the study.
Clinical Background of Autopsy Cases
Sampling
Tissue samples from surgical cases were used for IHC in normal tissues. Esophagus, stomach, small intestine, large intestine, liver, spleen, bile duct, pancreas, lung, kidney, ureter, urinary bladder, prostate, testis, uterine corps, uterine cervix, ovary, breast, adrenal gland, thyroid, salivary gland, peripheral nerve, ganglion of the nerve, cerebrum, cerebellum, lymph node, tonsil, bone marrow, and blood vessel were observed in at least five cases for each tissue.
IHC was used to study cancer tissues obtained from surgical cases. Cancers of esophagus, stomach, colon, liver, biliary duct, pancreas, lung, kidney, urothelium, prostate, uterine corpus, uterine cervix, and breast were observed in 30 cases for each organ.
Surgical and autopsy samples were obtained within 5 hr, fixed in 10% buffered formalin for 24 to 48 hr, and embedded in paraffin and processed for routine pathologic examination. To carry out IHC for cancer, 3-to 4-cm-long blocks of paraffin-embedded tissue were selected from the margin of cancer and normal tissue.
For Western blotting, we used autopsy cases. Esophageal mucosa, fundic gland mucosa, pyloric gland mucosa, jejunal mucosa, ileal mucosa, colonic mucosa, tracheal mucosa, urinary bladder, lung, liver, pancreas, spleen, kidney, adrenal gland, thyroid, parotid gland, submaxillary gland, prostate, endometrium, ovary, breast, striated muscle (thigh, neck), heart muscle, smooth muscle, peripheral nerves, ganglion of the nerve, cerebrum, cerebellum, spinal cord, lymph node, tonsil, bone marrow, aorta, and carotid artery were resected. To carry out Western blotting, resected tissues were sliced to about 100 mm3, cooled with liquid nitrogen, and stored at −80C. In tissues that have mucosa, the mucosa was dissected away from muscle layer.
Monoclonal Antibody Production
A novel monoclonal antibody (mAb) was developed to locate GGCT on the formalin-fixed and paraffin-embedded tissue sections. mAbs were generated according to the protocol described in a laboratory manual (Harlow and Lane 1988) with modifications. BALB/c mice (CLEA Japan, Inc., Tokyo, Japan) were immunized with the recombinant GGCT protein. The recombinant GGCT protein was expressed in Escherichia coli and purified by previously described methods (Oakley et al. 2008). Hybridoma cell lines producing anti-GGCT antibodies were checked by enzyme-linked immunosorbent assay (ELISA) with the recombinant GGCT protein used as an immunogen. Myeloma cell line P3-X63Ag8 was used in the hybridoma. Hybridomas giving positive results were screened by IHC with formalin-fixed and paraffin-embedded tissue sections of urinary bladder and salivary gland. Finally, the hybridoma producing the antibody that generated the most specific reaction products on the human tissue sections was selected and cloned by two rounds of limiting dilution. A single hybridoma clone was then implanted in the intraperitoneal space of the severe combined immunodeficiency mice (CLEA Japan, Inc.). At 1 week before the implantation, these mice were injected with pristane (Sigma-Aldrich; St. Louis, MO). At 1 or 2 weeks after the implantation, and ascites were collected and used as an undiluted mAb without further purification. The antibody (IgG1, κ) was named GGCT-mAb in the study.
ELISA Analysis
ELISA was performed as follows. Flat-bottomed 96-well NUNC-immunoplates (Nalge Nunc International; Roskilde, Denmark) were coated with recombinant GGCT protein (1 µg per well) in carbonate-bicarbonate buffer (pH 9.6) for 90 min at 37C. The mAb was serially diluted in phosphate-buffered saline (PBS) containing 0.25% Tween-20 (T-PBS) and added to each well, and the plates were incubated for 90 min at 37C. After incubation, they were incubated for 30 min further with biotinylated rabbit anti-mouse immunoglobulins (DAKO; Glostrup, Denmark) and then for 30 min with horseradish peroxidase–conjugated streptavidin (DAKO), both at room temperature. Before and after each step, the plates were washed with T-PBS. After the reaction, citrate phosphate buffer (pH 5.4) containing 0.3% o-phenylenediamine dihydrochloride (Sigma-Aldrich) and 0.012% H2O2 were added to each well, and the plates were incubated for 15 min at room temperature in the dark. The reaction was stopped by adding 25 µl of 2 M HCl to each well. The plates were read at 490 nm on a Bio-Kinetics Reader (BioTek; Winooski, VT).
Western Blot Analysis
The frozen samples and tumor cell lines were homogenized with PBS and were subjected to ultrasonic fragmentation. The homogenate was centrifuged at 14,000 × g for 5 min at 4C, and the supernatant was obtained. The protein in the supernatant was quantified with the BCA protein assay kit (23225; Pierce, Rockford, IL) and the protein concentration adjusted to 1 mg/ml, and 15 µg of total protein was used in each sample. Sodium dodecyl sulfate–polyacrylamide gel electrophoresis (SDS-PAGE) was carried out according to the method of Laemmli (1970). The separated protein samples were transferred to polyvinylidene difluoride membrane in a Mini Trans-Blot cell (Bio-Rad, Tokyo, Japan) for 60 min at 120 V. The membrane was blocked overnight at 4C with Block Ace (DS Pharma Biomedical Co. Ltd., Osaka, Japan). The membrane was rinsed well with T-PBS before incubating it with the GGCT-mAb (1:1000) for 120 min at room temperature. After washing, the membrane was incubated with Cy2-labeled goat anti-mouse immunoglobulins (ECL plex; GE Healthcare UK Ltd., Little Chalfont, UK; 1:1000) for 60 min at room temperature in the dark. The membrane was dried for 60 min at 37C in the dark. Fluorescence intensity in membrane was then measured using a Bio-Rad Molecular Imager FX.
IHC
All surgical samples were examined by IHC, using the GGCT-mAb. For comparison, some normal surgical samples were examined by IHC, using the rabbit anti-GGCT polyclonal antibodies (pAb) (Sigma-Aldrich; HPA020735 and HPA029914). Histologic sections (4 µm thick) were cut from formalin-fixed and paraffin-embedded tissue samples and mounted on Silane-coated slides (Muto Pure Chemicals Co. Ltd., Tokyo, Japan). After the sections were deparaffinized and rehydrated, they were microwaved (Microwave Processor H2850; Energy Beam Sciences Inc., East Granby, CT) in 10 mM citrate buffer (pH 6.0) for 1 hr at 99C. The sections were then treated with 3% hydrogen peroxide in methanol for 10 min. The sections were first incubated with normal horse serum (Vectastain Universal Elite ABC Kit; Vector Laboratories, Burlingame, CA). Subsequently, the sections were incubated overnight at room temperature with either of the appropriately diluted antibodies (GGCT-mAb 1:30,000, HPA020735 1:500, HPA029914 1:150) in a humidified chamber. The sections were then incubated for 30 min with biotinylated horse antibody, which recognizes rabbit and mouse IgG (H+L) (Vectastain Universal Elite ABC Kit), followed by a 30-min incubation with streptavidin-peroxidase complex (Vectastain Universal Elite ABC Kit), both at room temperature. Before and after each step, the sections were washed in T-PBS. The signal was developed as a brown reaction product using peroxidase substrate 3,3′-diaminobenzidine tetrahydrochloride (Histofine Simplestain DAB Solution; Nichirei Bioscience, Tokyo, Japan). All specimens were counterstained with Mayer’s hematoxylin. To assess the IHC results for normal tissues, cells from all areas of the section were examined and the percentage of GGCT-positive cells calculated directly. The sections were then scored as follows: no positive cells, –; less than 30% positive cells, 1+; 30% to 70%, 2+; and more than 70%, 3+. Samples from tumor margins were used to compare the level of GGCT expression in normal and cancer cells. An increase in expression was recorded in cases where more than 30% of cancer cells had stronger signals than normal cells, and a decrease in expression was recorded when more than 30% of normal cells had stronger signals than cancer cells. In the other cases, no change was recorded. Some tumors have variations in morphology and behavior, and some tumors only have a small number of positive cells that are difficult to score. To avoid these scoring problems, only those tumors that exceeded a cutoff at 30% of GGCT-positive tumor cells were studied. The samples were checked by three pathologists. If their judgments differed, the cases were reexamined and discussed to make a final decision.
Results
Specificity of GGCT-mAb for Detecting GGCT
Western blot analysis detected GGCT in human tissues (case 1, Fig. 1). The GGCT-mAb detected recombinant GGCT as a sharp band adjacent to the 21-kDa size marker on the membrane. All human tissues presented a sharp band the same as the recombinant GGCT. Some tissues had an additional band slightly smaller than the recombinant enzyme. A further band adjacent to the 70-kDa size marker on the membrane appeared in human tissue samples, but this band was detected without GGCT-mAb. Thus, the 70-kDa band probably represents a direct cross-reaction with the second antibody used in the blotting experiments. A different second antibody was used for the immunohistochemical analysis, and its specificity is confirmed in Figure 2. Positive staining was detected with GGCT-mAb but not in its absence.
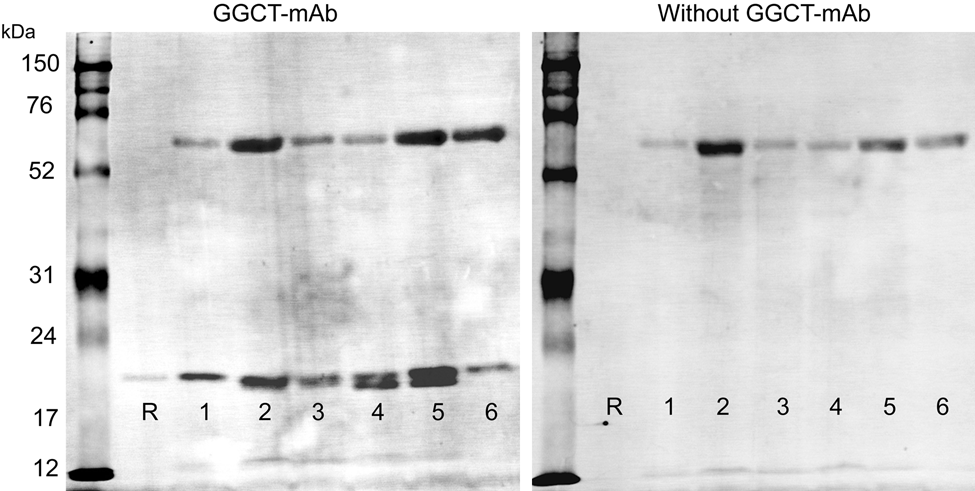
Specificity of γ-glutamyl cyclotransferase–monoclonal antibody (GGCT-mAb) for GGCT with Western blots. Western blots of recombinant GGCT and human tissues were probed with GGCT-mAb. R, recombinant protein (21 kD); 1, fundic gland mucosa; 2, ileum; 3, liver; 4, kidney; 5, spleen; 6, lung. Left membrane used GGCT-mAb as the primary antibody. Right membrane only used the secondary antibody. We could find the bands adjacent to the 21-kDa size marker and recombinant GGCT only with GGCT-mAb, but the band adjacent to the 70-kDa size marker appears on both membranes and results from cross-reactivity with the secondary antibody.
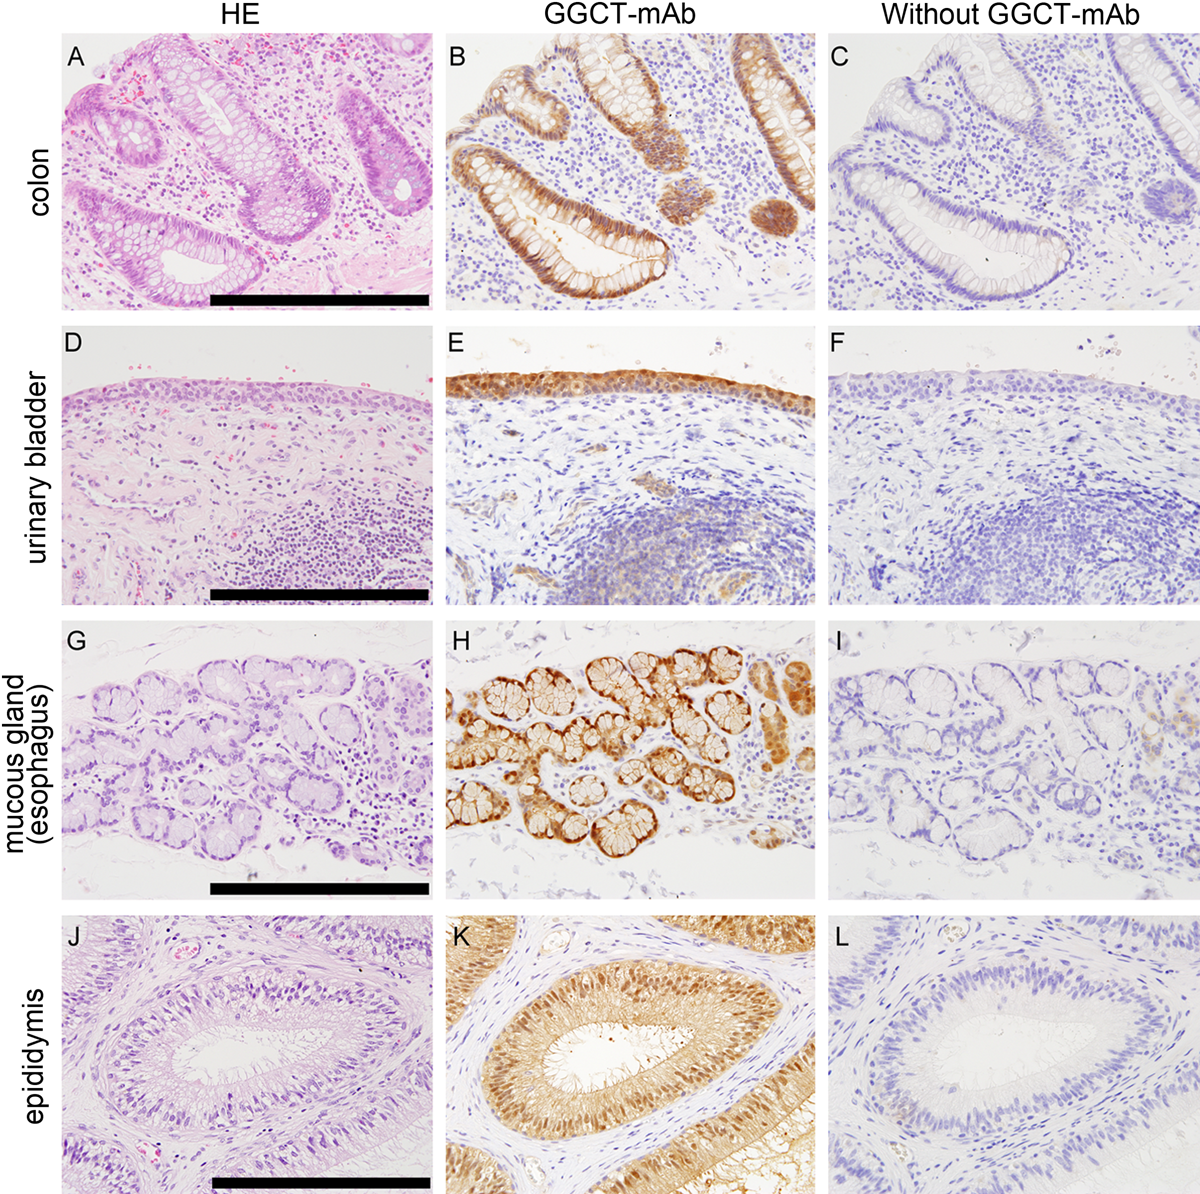
Specificity of γ-glutamyl cyclotransferase–monoclonal antibody (GGCT-mAb) for GGCT with immunohistochemical staining. Representative immunohistochemistry (IHC) results are shown for several tissues. Hematoxylin and eosin (HE) staining is shown in the left column (A, D, G, J). IHC with the GGCT-mAb of the same position is shown in middle column. IHC without GGCT-mAb is shown in right column. Positive staining was detected with GGCT-mAb in the colon (B), urinary bladder (E), mucous gland (H), and epididymis (K). No staining was shown without GGCT-mAb (C, F, I, L). The inserted bars are 150 µm.
GGCT Expression in Normal Human Tissue and Tumor Cell Lines
Western Blotting
Western blots of 15-µg samples obtained from autopsy cases and tumor cell lines are shown in Figure 3. GGCT was detected in all samples. The tissues that contain epithelium had high-intensity bands. Muscle and blood vessel had thin bands. Bone marrow and spleen, which contain blood, also had thin bands, but these tissues and kidney presented an additional band that was about 1 kDa smaller (20 kDa). Expression levels were different between each individual, but these differences were small, and the relative expression level in each tissue had a similar trend.
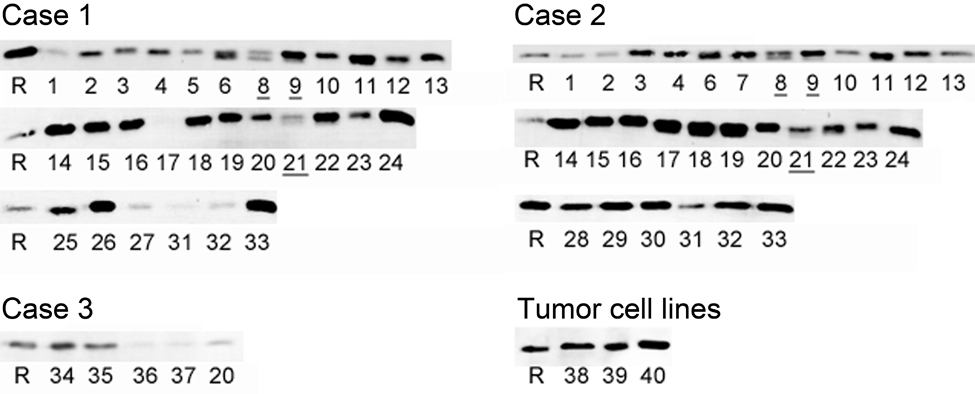
γ-Glutamyl cyclotransferase (GGCT) expression in normal human tissues and tumor cell lines. Western blotting of GGCT for normal human tissues and tumor cell lines. R, recombinant protein (21 kDa); 1, striated muscle (neck); 2, heart muscle; 3, striated muscle (thigh); 4, smooth muscle (intestinal tract); 5, smooth muscle (urinary bladder); 6, liver; 7, pancreas; 8, spleen; 9, kidney; 10, urinary bladder (mucosa); 11, adrenal gland; 12, lung; 13, bronchi; 14, esophagus; 15, fundic gland mucosa; 16, pyloric gland mucosa; 17, jejunum; 18, ileum; 19, large intestine; 20, peripheral nerve; 21, bone marrow; 22, lymph node; 23, thyroid; 24, tonsil; 25, endometrium; 26, ovary; 27, breast; 28, prostate; 29, sublingual salivary gland; 30, submandibular salivary gland; 31, aorta; 32, carotid artery; 33, skin; 34, cerebrum; 35, cerebellum; 36, spine; 37, nerve ganglion; 38, Daudi (B cell lymphoma); 39, PC3 (prostatic cancer); 40, AGS (gastric cancer). Two bands can be observed in liver (6), spleen (8), kidney (9), and bone marrow (21).
Immunohistochemistry
To confirm that the positive signal obtained with GGCT-mAb was specific, IHC was performed with two additional polyclonal antibodies. The comparative results obtained with urinary bladder and salivary glands are shown in Figure 4. A similar positive GGCT signal was obtained in the cytoplasm and the nucleus with each antibody.
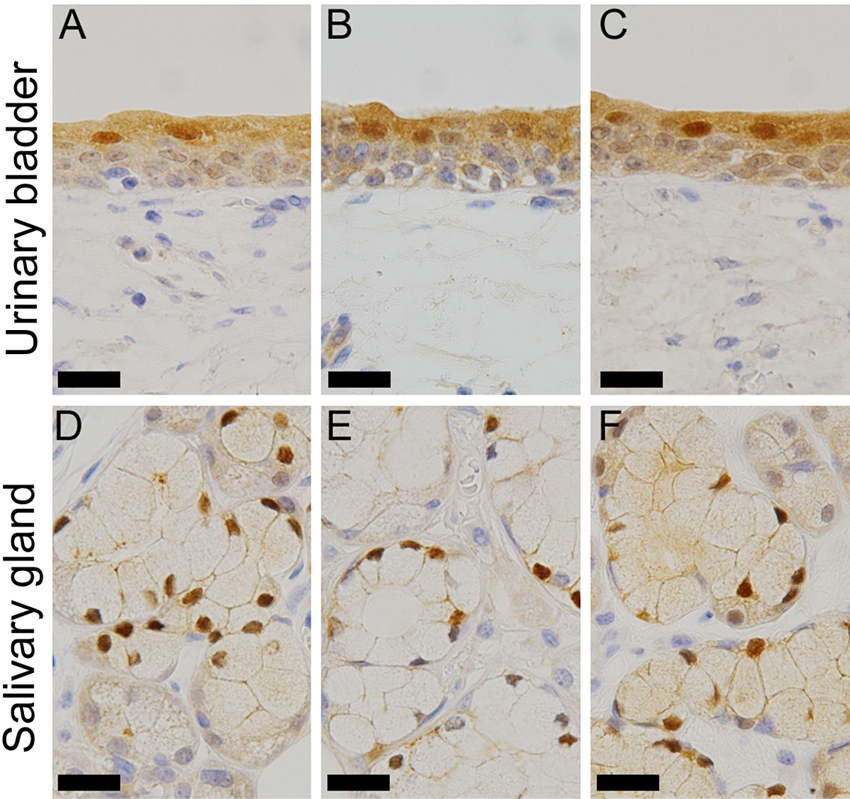
Comparison of the immunohistochemistry (IHC) results with the three anti–γ-glutamyl cyclotransferase (GGCT) antibodies. Representative IHC results for urinary bladder (A–C) and salivary gland (D–F) are shown. IHC with the GGCT–monoclonal antibody (mAb) is shown in the left column (A, D), GGCT-pAb (HPA020735) in the middle column (B, E), and GGCT-pAb (HPA029914) in the right column (C, F). The inserted bars are 30 µm.
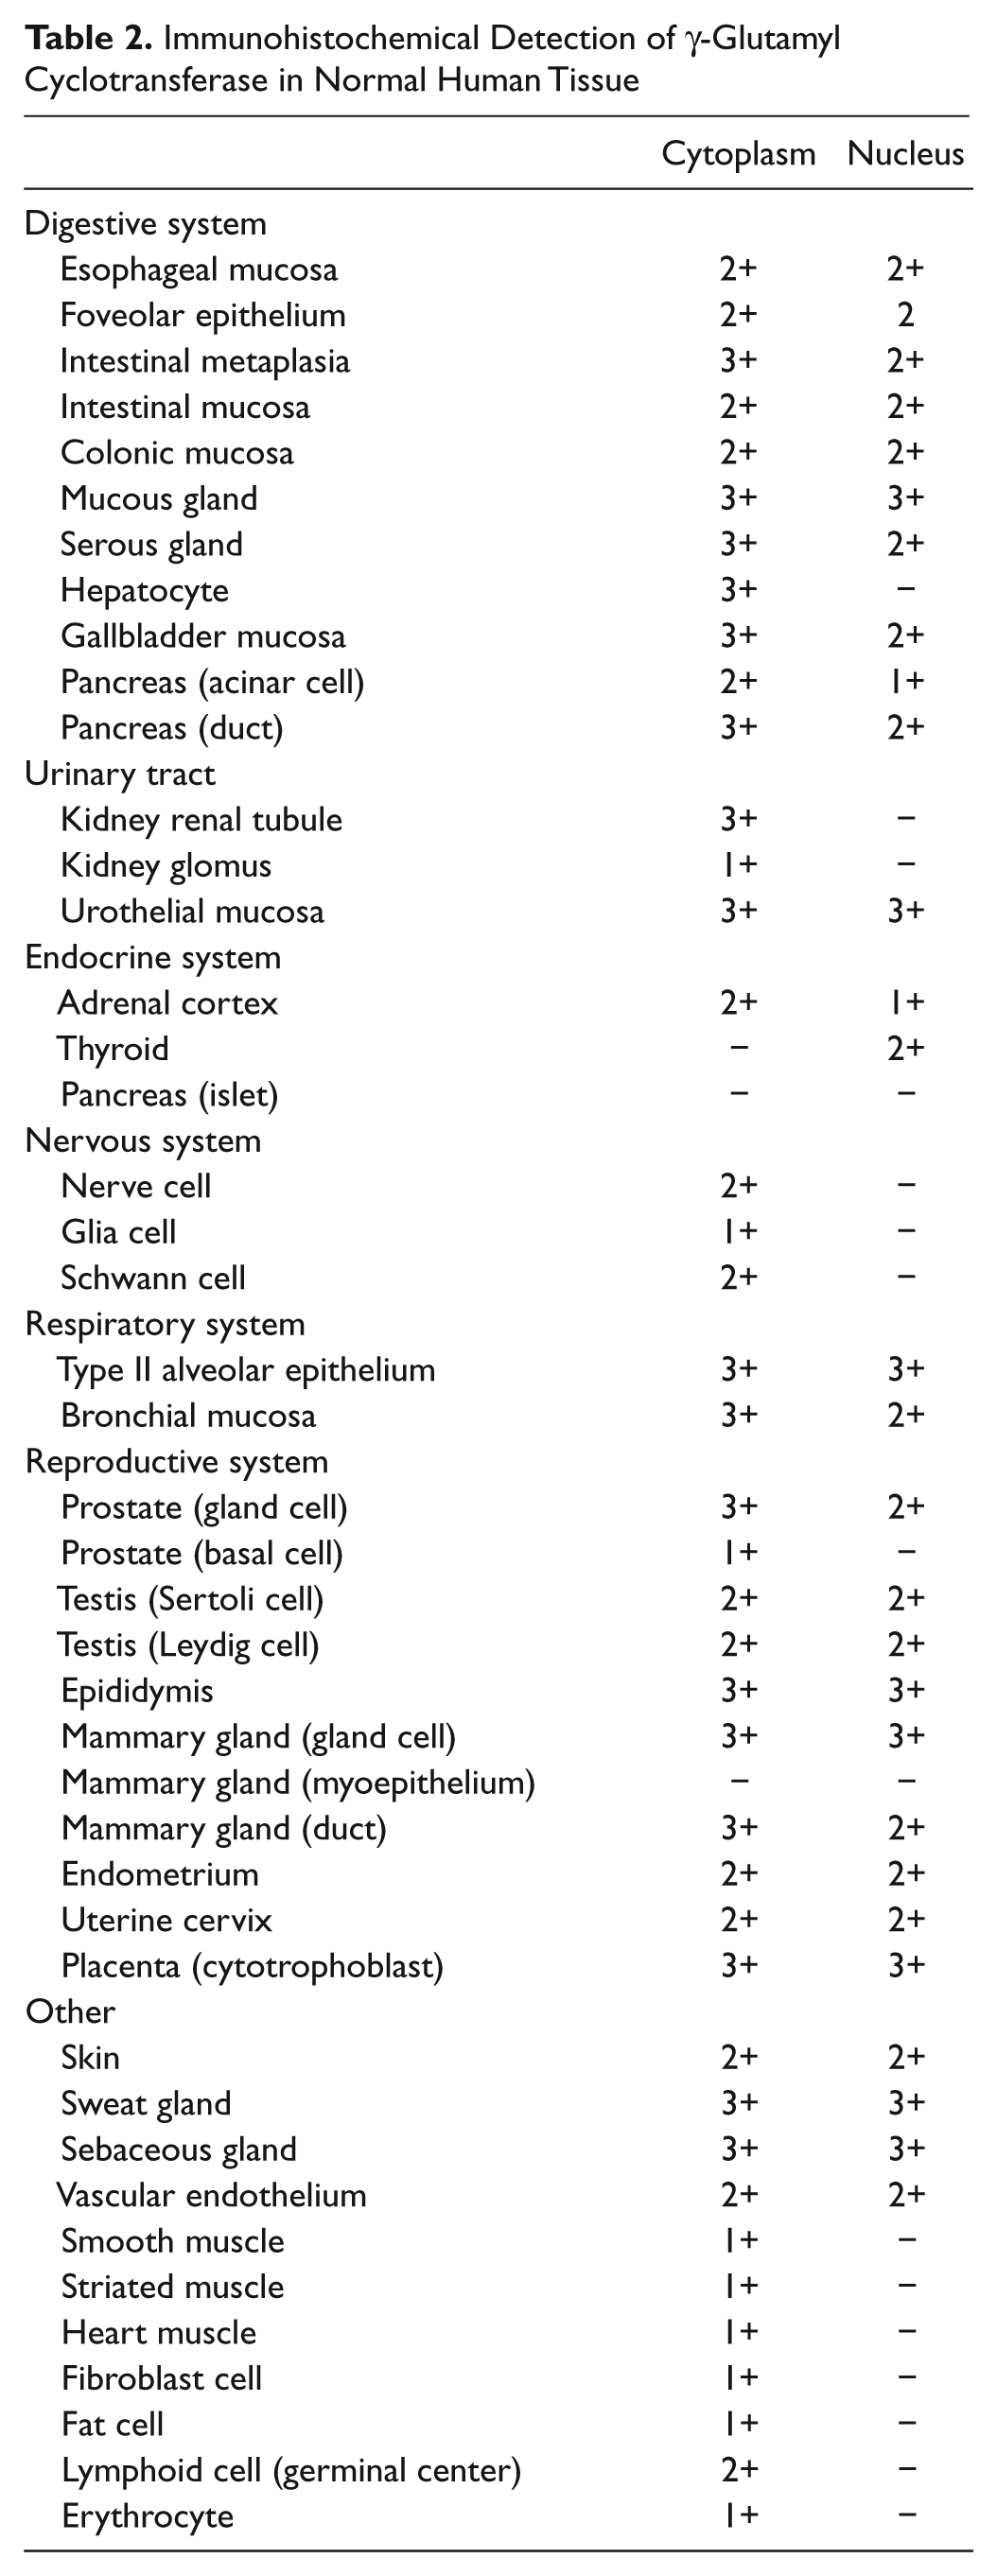
The results of the immunohistochemical analysis of a range of human tissues are summarized in Table 2, and Figure 5 shows representative images. GGCT could be detected in almost all tissues. It is notable that GGCT expression is particularly high in epithelial cells and also relatively high in mesothelium and endothelium. There was no positive staining in the absence of GGCT-mAb.
Immunohistochemical Detection of γ-Glutamyl Cyclotransferase in Normal Human Tissue
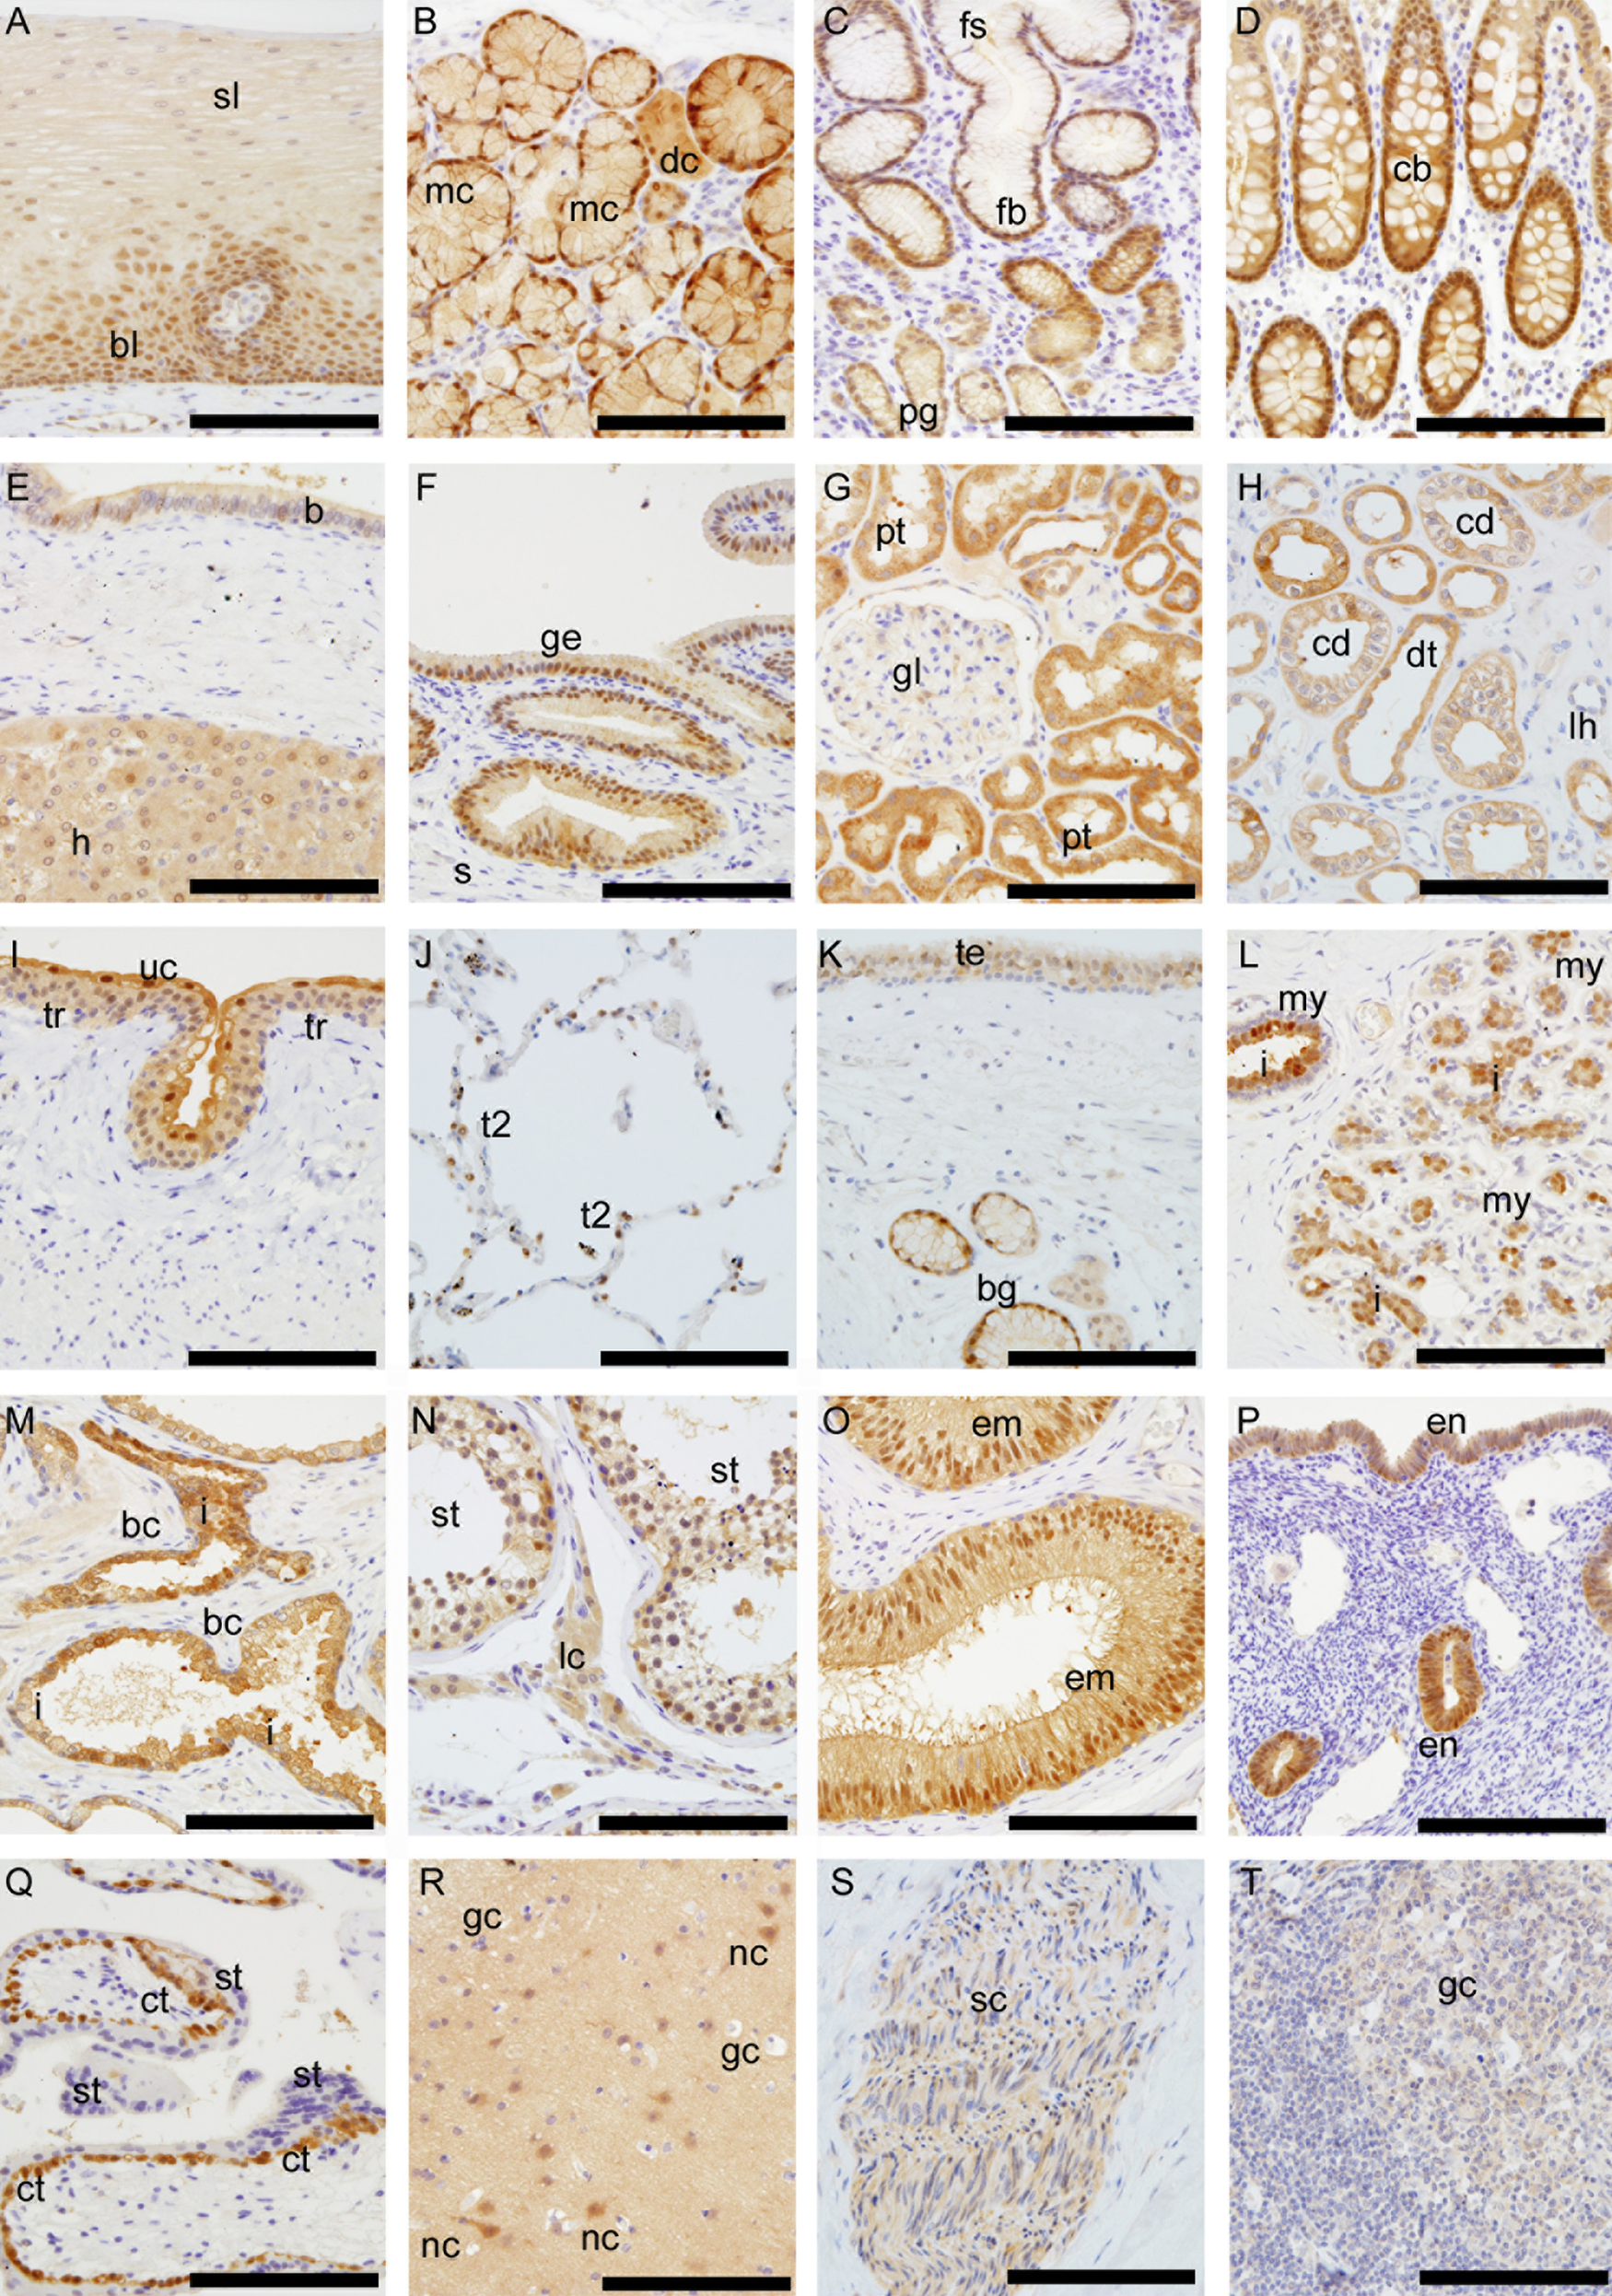
Immunohistochemical staining with γ-glutamyl cyclotransferase–monoclonal antibody (GGCT-mAb). (A) Esophageal mucosa; basal and parabasal layer (bl) and surface layer (sl). (B) Esophageal gland; mucous gland cells (mc) and cytoplasmic ductal cells (dc). (C) Gastric mucosa; foveolar epithelium (fb), the crypt (fs), and pyloric glands (pg). (D) Colonic mucosa; crypts (cb). (E) Liver hepatocytes (h) and intrahepatic bile duct (b). (F) Gallbladder mucosa; epithelial cells (ge) and submucosa (s). (G, H) Kidney; proximal renal tube (pt), distal renal tube (dt), and collecting duct (cd). The loop of Henle (lh) and glomerulus (gl). (I) Urinary bladder; transitional epithelium (tr) surface umbrella cells (uc). (J) Lung; type II alveolar lining cells (t2). Type I alveolar lining cells had no staining. (K) Trachea; tracheal epithelium (te) and bronchial glands (bg). (L) Mammary gland; inner cells (i) and myoepithelial cells (my). (M) Prostate gland; inner cells (i) and basal cells (bc). (N) Testis; seminiferous tubules (st) and endocrine components (lc). (O) Epididymis; epithelial cells (em). (P) Endometrium (em). (Q) Placenta; cytotrophoblasts (ct) and syncytiotrophoblasts (st). (R) Cerebrum; nerve cells (nc) and glia cells (gc). (S) Peripheral nerves; Schwann cells (sc). (T) Lymphoid tissue; germinal centers (gc). The inserted bar is 150 µm.
Digestive epithelium, from the esophagus to the colon, stained positively for GGCT. In the esophagus, stratified squamous epithelium (Fig. 5A) stained by GGCT-mAb shows cytoplasmic and/or nuclear staining of the basal and parabasal layer (bl) and weaker staining of the surface layer (sl). The submucosal esophageal glands (Fig. 5B) show strong nuclear staining of the mucous gland cells (mc) and cytoplasmic staining of the ductal cells (dc). The surface epithelium in stomach (Fig. 5C) stained faintly for GGCT, whereas the mucosa in the intestinal metaplasia in the stomach had much stronger cytoplasmic and/or nuclear positive staining than the foveolar epithelium. The nuclei were positive in the base of crypts (fs) and less positive in the superficial layers. The small and large intestines (Fig. 5D) were very positive for GGCT in absorptive cells as well as in the mucous-secreting cells. In contrast to the positive staining of the nuclei in the submucosal esophageal glands, there was faint staining in the pyloric gland and duodenal submucosal glands of Brunner. In gastric fundic glands, parietal and mucous neck cells and chief cells were faintly positive in their cytoplasm and/or nuclei. There was no obvious difference in GGCT expression levels in the lining epithelium of the villi of the small intestine and the crypts. In salivary gland (Fig. 4), acini were positive for GGCT, but there is an obvious difference between mucous cells and serous cells. Mucous cells stained strongly in nuclei and cytoplasm, but serous cells stained only in cytoplasm. In the liver (Fig. 5E), hepatocytes (h) were positive for GGCT in the cytoplasm, but there was only faint staining in the biliary epithelium in liver. Nevertheless, the epithelial lining of the gallbladder (Fig. 5F) was strongly positive for GGCT in the cytoplasm and nuclei. In the pancreas, acini and cells lining ducts were positive for GGCT in cytoplasm, and islets were negative.
In the kidney, cortical and medullary tubular structures stained intensely in cytoplasm (Fig. 5G). This contrasted with the negative staining of the connective tissue in the interstitium. In the glomeruli, the cells of the mesangium were not stained, and the viceral layer of the Bowman capsule was faintly positive. The proximal convoluted tubules and the distal convoluted tubule stained positively. The loop of Henle was not stained. The collecting duct stained positively near the cell membrane (Fig. 5H). Transitional epithelium (Fig. 5I) of the ureter and the urinary bladder stained intensely in the cytoplasm and nuclei, but there was much stronger staining of the surface umbrella cells.
The lining epithelium along the upper and lower airways (Fig. 5J,K), the ciliated epithelial cells, and submucous glands stained positive for GGCT in the cytoplasm and/or nuclei. The type II alveolar lining cells in the lung were strongly positive for GGCT in their cytoplasm and nuclei. The type I alveolar lining cells were negative for GGCT.
In the thyroid, staining for GGCT was found in follicular cells but not in colloid. In the adrenal glands, the cortex was positive in the cytoplasm and/or nuclei, but the medulla was negative.
In prostate (Fig. 5M), inner glandular epithelium (i) was positive, but basal cells were negative. This pattern was similar to the mammary gland. In the testis (Fig. 5N), the epithelium of the seminiferous tubules and endocrine component were weakly positive. The epididymis (Fig. 5O) showed strong staining of its epithelium (em).
The epithelia of the exocervix, the endocervix, the endometrium (Fig. 5P), and the tubes were positive for GGCT. The level of GGCT in the cells lining the exocervix was highest in the parabasal layers and diminished markedly in the more superficial cell layers. In the ovaries, the primary follicles and maturing follicles stained faintly. Breast epithelium (Fig. 5L) stained strongly for GGCT. There was an obvious difference in the inner cells (i) of the acini and outer peripheral cells. The inner cells were strongly positive in the cytoplasm and/or nuclei, but outer peripheral cells were negative for GGCT. In human placenta (Fig. 5Q), there was heterogeneity in GGCT levels. Cytotrophoblasts were strongly positive in the cytoplasm and nuclei, but syncytiotrophoblasts were negative.
In the brain (Fig. 5R), weak staining in matrix and nerve cells were shown, but the glia cells were negative. In most of the peripheral nerves (Fig. 5S), Schwann cells were positively stained for GGCT, whereas the axons were negative. Striated muscle, smooth muscle, and heart muscle stained positively, but the staining was very faint.
In the skin, the epidermis reactivity with GGCT antibody was faintly positive in the surface layer, but sebaceous and sweat glands stained strongly.
Connective tissue was mostly negative, but in areas of colloid degeneration or inflammation, fibroblast and fat cells were positive and sometimes exhibited very strong expression. Chondrocytes (trachea) and cartilaginous matrix were negative. Endothelial cells were partially positive for GGCT in the capillaries and arterioles. Cells lining the walls of the lymphatics were not stained for GGCT.
Most small lymphocytes were negative for GGCT. Larger positive cells corresponding apparently to large lymphocyte cells and macrophages were observed in the follicles in the digestive or respiratory tract and in lymph node germinal centers (Fig. 5T).
GGCT Expression in Tumor Tissue
IHC
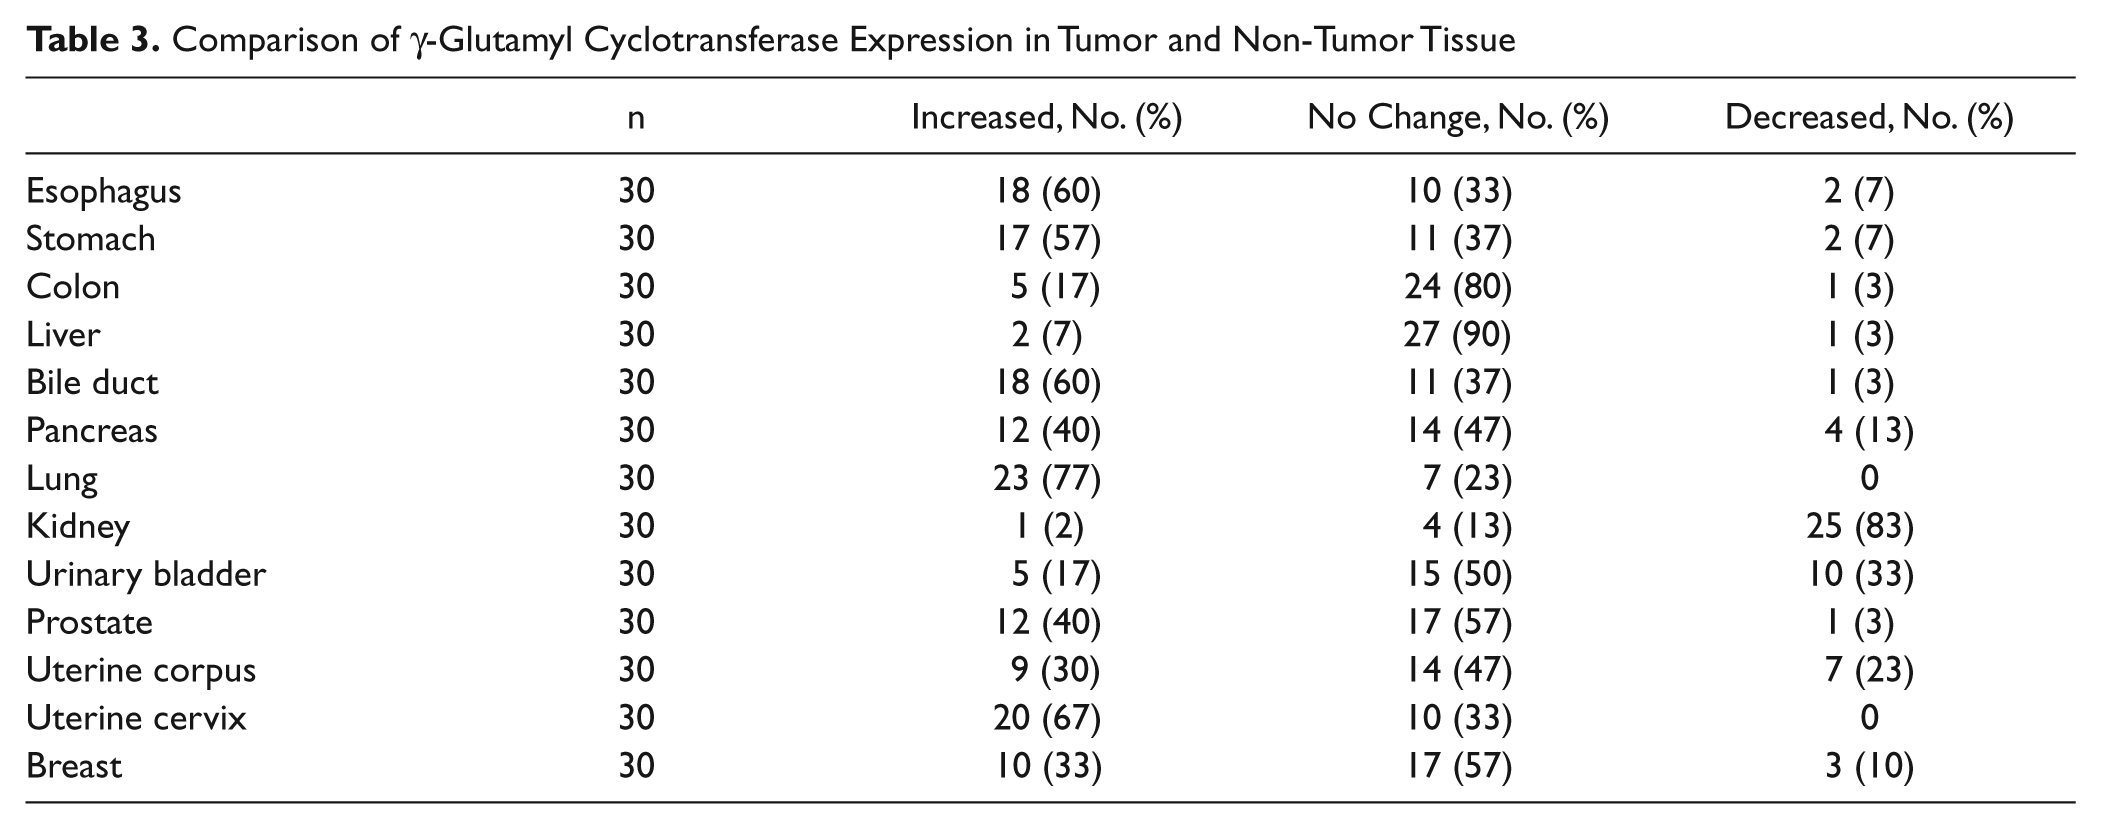
A summary of IHC findings is shown in Table 3, and photographic examples are shown in Figure 6. Tumor tissue was compared with adjacent normal tissue. We found that tumors in the esophagus, stomach, biliary duct, and lung had notably stronger staining than normal tissue. In contrast, urinary bladder and kidney tumors were weakly stained compared with normal tissue. Liver and colon tumors had similar levels of expression to the normal non-tumor tissue.
Comparison of γ-Glutamyl Cyclotransferase Expression in Tumor and Non-Tumor Tissue
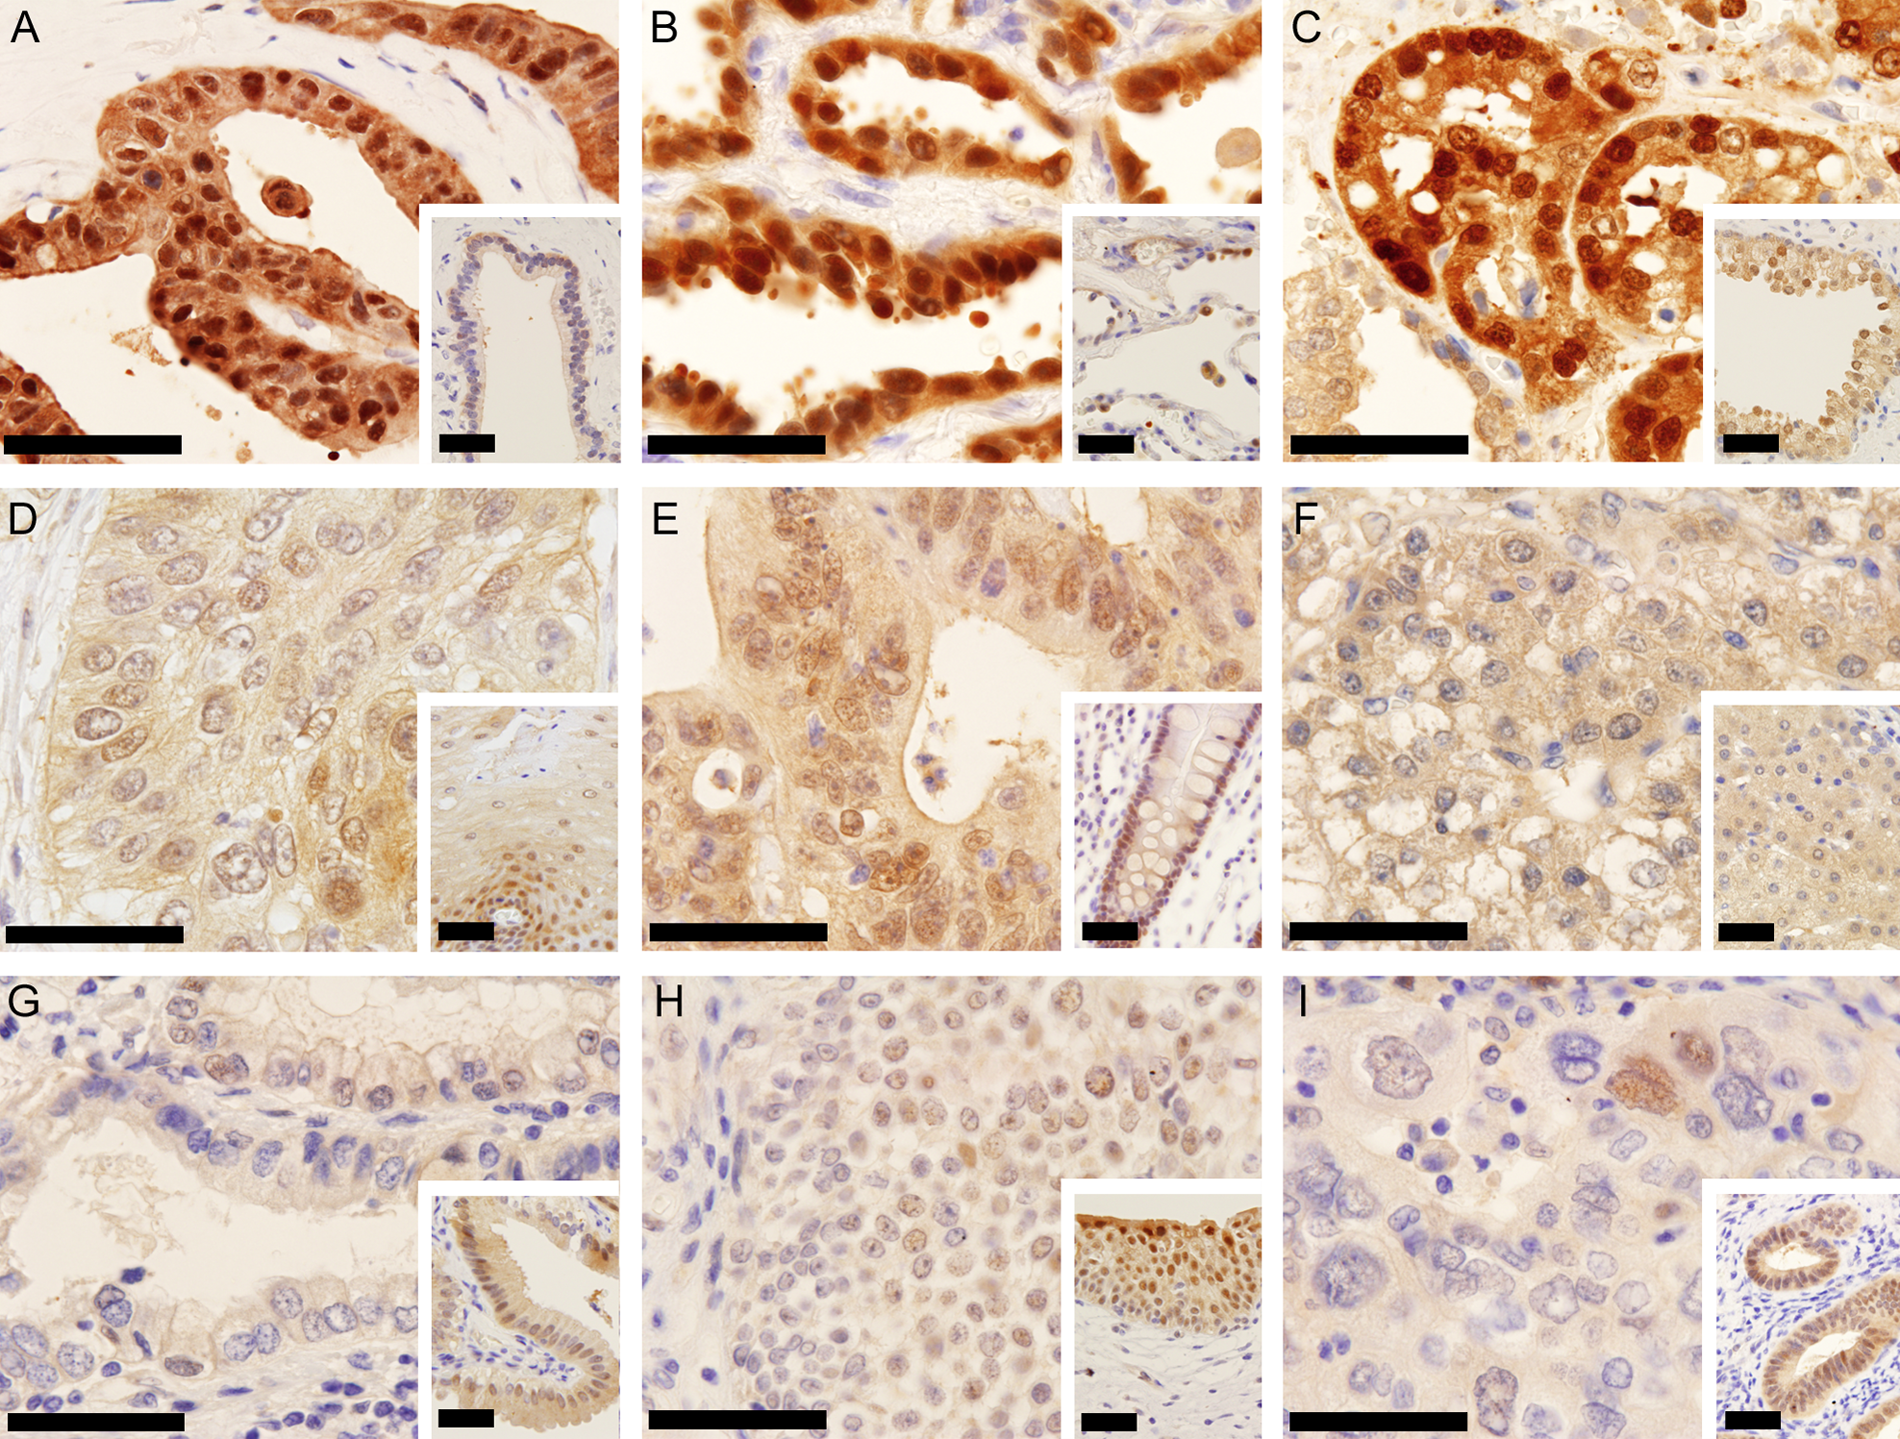
Immunohistochemical staining of normal tissue and tumors with γ-glutamyl cyclotransferase–monoclonal antibody (GGCT-mAb). Tumors are shown on the main pictures, and normal tissues are inserted in the lower right corner. (A) Pancreatic adenocarcinoma showed stronger cytoplasmic and nuclear staining than non-neoplastic pancreatic duct cells. (B) Lung adenocarcinoma showed very strong cytoplasmic and nuclear staining. Normal lung epithelium had weaker staining than the carcinoma. (C) Prostatic adenocarcinoma stained by GGCT-mAb showed very strong cytoplasmic and nuclear staining. Normal prostate had weaker staining than the carcinoma. (D) Esophageal squamous cell carcinoma showed cytoplasmic and nuclear staining on a level with normal squamous epithelium in this case. (E) Colonic adenocarcinoma showed cytoplasmic and nuclear staining on a level with normal colonic mucosa. (F) Hepatocellular carcinoma showed cytoplasmic staining. Non-neoplastic hepatocytes had weaker staining intensity. (G) Adenocarcinoma of the stomach stained by GGCT-mAb showed weaker cytoplasmic staining. Normal foveolar epithelium had stronger but still faint staining. (H) Transitional cell carcinoma of the urinary bladder showed weaker cytoplasmic and nuclear staining. Normal transitional cells had stronger staining than cancer cells. (I) Endometrial adenocarcinoma of the uterus showed extremely low staining, and non-neoplastic endometrium showed stronger staining. The inserted bar is 50 µm.
In the esophagus, many squamous cell carcinomas stained strongly positive in the cytoplasm and/or nuclei. Some cancers had partial expression, and in these cases, keratinizing cancer cells were stained stronger than the other cells. In the stomach, many gastric adenocarcinomas had a high level of GGCT expression in cytoplasm and/or nuclei. Generally, the intracellular distribution of GGCT in stomach cancer cells was mainly positive in the cytoplasm, but signet ring cells show very strong nuclear staining. In the colon, adenocarcinomas had a high level of GGCT expression in the cytoplasm and/or nucleus. But normal colonic mucosa has a similar level of GGCT expression in most cases. In the liver, hepatocellular carcinomas stained faintly for GGCT in the cytoplasm. Only a few cases had obvious high GGCT expression. In the biliary duct, adenocarcinomas had a high level of GGCT expression in cytoplasm and/or nuclei. In the pancreas, carcinomas gave faint GGCT expression that was mainly in the cytoplasm. In the lung, many adenocarcinomas were very positive for GGCT in the cytoplasm and nuclei. Squamous cell carcinomas had various levels of expression in the cytoplasm and/or nuclei. In the kidney, clear cell carcinomas were mainly stained faintly in the cytoplasm and membrane. Some papillary carcinomas and granular cell carcinomas had a high level of GGCT expression. In transitional cell carcinoma and prostatic carcinoma, many tumors had a high level of GGCT expression in the cytoplasm and/or nuclei, but normal epithelial cells have similar high GGCT expression in most cases. In the endometrium, endometrioid adenocarcinomas had various levels of GGCT expression in the cytoplasm and/or nuclei. In the uterine cervix, squamous cell carcinoma had similar GGCT expression to esophageal squamous cell carcinoma. In the breast, ductal carcinomas had various levels of GGCT expression. In summary, although the level of GGCT staining in colon cancer, transitional cell carcinoma, prostatic carcinoma, and breast carcinoma was strong, normal epithelial cells have similar high levels of GGCT expression in these tissues.
Discussion
GGCT plays a novel role in glutathione homeostasis and is responsible for the uncontrolled production of 5-oxoproline in patients with glutathione synthetase deficiency (Wellner et al. 1974). Because of the importance of glutathione in a range of cellular processes, including drug metabolism and drug resistance, the altered expression of any enzyme involved in its synthesis and turnover in tumors is of significant interest. As a result of its differential expression in several different tumors, C7orf24/GGCT was proposed as a possible cancer biomarker even before its biological function was elucidated (Kageyama et al. 2007; Xu et al. 2007; Zhang et al. 2006). To validate a potential cancer biomarker, it is important to fully characterize its expression in both normal tissues and tumors. This study has detected GGCT expression in almost all tissues. Significantly, GGCT expression is predominantly within epithelial cells. Although the intracellular distribution is mainly within the cytoplasm, in some cells, it is also localized in the nucleus. A marked increase in GGCT expression was also found in some tumors. These findings are in general agreement with a previous study that inferred a wide tissue distribution from the representation of GGCT cDNA clones in the EST database (Oakley et al. 2008) and a recent report that used real-time PCR (Azumi et al. 2009).
In the present study, Western blots identified two cross-reacting proteins in the spleen, kidney, and bone marrow and possibly other tissues. These proteins differ in molecular size by only around 1 kDa and vary in relative abundance (e.g., spleen in Figs. 1 and 3). These proteins could arise from genetic variation, alternative splicing, or posttranslational modification. Two electrophoretically distinct GGCT isoenzymes have previously been reported in human erythrocytes (Board 1980), and multiple peaks have been eluted from ion exchange chromatography columns during the purification of GGCT (Board et al. 1978; Orlowski and Meister 1973; Orlowski et al. 1969). As some of the previously observed variation occurred during sample preparation, it seems most likely that the variation in protein molecular size observed in the present study is the result of posttranslational modification. However, other explanations are possible, and at this stage, it is not clear if this variation is due to degradation or is in some way related to individual variation in genetics, physiological activity, or pathology.
Although previous studies have inferred the high expression of GGCT in some tissues (Gromov et al. 2010; Kageyama et al. 2007; Oda et al. 2009), the present study has revealed that GGCT is very strongly expressed in epithelial cells in many tissues. This is particularly clear in the urinary bladder, which has a well-defined epithelium. The significance of this association is not immediately clear, but it would be consistent with a role for the γ-glutamyl cycle in amino acid uptake (Meister 1973). Although the intracellular distribution of GGCT is predominantly cytoplasmic, we also noted that GGCT is also localized to the nucleus in cells (urothelial epithelium, mucous cells, epididymis, cytotrophoblast, and type II alveolar epithelium) that have a high rate of proliferation, reactive change, or mucous production. In a previous study of the intracellular distribution of GGCT, a green fluorescent protein–GGCT fusion protein was only detected in the cytoplasm. However, a deletion mutant lacking GGCT residues 61–120 was localized to the nucleus, suggesting that the central region is required to anchor GGCT in the cytoplasm (Azumi et al. 2009). In the present study, we noted that GGCT is sometimes detected in the nucleus of human cells, and we also noted a lower molecular weight variant in some tissues. Taken together, these results suggest that the GGCT observed in the nucleus may represent a posttranslationally modified form or a splice variant that has a modified or deleted cytoplasmic anchor. The role of GGCT in the nucleus has yet to be identified, but functions other than a catalytic role in the γ-glutamyl cycle are suggested by the fact that nuclear localization occurs in many tissues.
GGCT expression in the tumor tissue was compared to normal tissue in the same sample by IHC. We found increased expression in many tumors. This result is consistent with previous studies using other techniques (Kageyama et al. 2007; Xu et al. 2007; Zhang et al. 2006). In a recent investigation, Gromov et al. (2010) tested GGCT expression by IHC with an anti-GGCT polyclonal antibody. They reported that 72% of colon cancers, 58% of cervical cancers, 46% of breast cancers, and 38% of lung cancers had high expression of GGCT. This result was similar to our result determined by IHC with the exception of colon cancers. By statistical evaluation, we found significantly increased GGCT expression in cancers of the esophagus, stomach, bile duct, and lung. In contrast, we found significantly lower expression in urothelial and renal tumors. These results suggest that there may be changes in the expression of GGCT in tumors, but the apparent differences between tumors and the possible impact of individual differences make it difficult to understand the significance of these changes or propose a general mechanism at this stage. Although several previous studies have suggested that C7orf24/GGCT may be a biomarker for cancer, the present data suggest that it is unlikely to be a general cancer biomarker but may have value in specific organs and tissues.
Footnotes
Acknowledgements
We thank Ms. Tomomi Kato, Ms. Chihiro Yamato, Mr. Yousuke Hayashi, and Ms. Yuka Morita for their technical assistance.
The authors declared no potential conflicts of interest with respect to the authorship and/or publication of this article.
The authors disclosed receipt of the following financial support for the research and/or authorship of this article: This study was supported by grants from the Australian NHMRC (525458) and ARC (DP00880027) and from the Japan Society for the Promotion Science Grant-in-Aid Scientific Research (22659287).