
Abstract
The ability to visualize and quantify the spatial arrangement and geographic proximity of immune cells with tumor cells provides valuable insight into the complex mechanisms underlying cancer biology and progression. Multiplexing, which involves immunofluorescence labeling and the visualization of multiple epitopes within formalin-fixed paraffin embedded tissue sections, is a methodology that is being increasingly employed. Despite the power of immunofluorescence multiplex analysis, application of this technology to bone marrow core biopsies has not yet been realized. Given our specific long term goal to identify immune cells in proximity to bone marrow malignant plasma cells in multiple myeloma patients, we describe in this study adaptation of multiplex immunofluorescence analysis to this tissue. We first identified a blocking strategy that quenched autofluorescence. We next employed a multiplex strategy that uses a simple stripping solution to remove primary and secondary antibodies prior to subsequent rounds of staining. This method was found to be highly efficient and did not significantly alter antigenicity or tissue integrity. Our studies illustrate for the first time that immunofluorescence multiplexing is achievable in bone marrow core biopsies and will provide a novel opportunity to analyze the role of the immune contexture in disease progression of the monoclonal gammopathies.
Introduction
Multiple myeloma (MM) is an aggressive and often fatal plasma cell (PC) malignancy that is, characterized by the clonal expansion of malignant PCs in the bone marrow (BM). 1 The development of MM is known to be preceded by the preneoplastic condition termed monoclonal gammopathy of undetermined significance (MGUS) and the more advanced precursor state termed smoldering multiple myeloma (SMM). 2 Although MGUS and SMM patients have a significant, life-long, increased risk of progressing to MM (a rate of 1 and 10% per year, respectively), 3 most MGUS and SMM patients will never transform into MM. However, there is currently no definitive way to predict which MGUS or SMM patients will progress to MM and thus, no medical treatment is initiated. 4 Instead, MGUS and SMM patients are regularly monitored for symptoms of malignant disease and a diagnosis of MM is not made until there are overt clinical manifestations of serious end-organ damage. 5 Thus, the discovery of accurate progression biomarkers is urgently needed so that therapy can be initiated at an earlier time point.
Longitudinal studies over the last decade have focused on identifying genomic alterations underlying malignant transformation from MGUS to MM. 6 Although these studies have discovered a number of recurrent mutations, their overall success has been limited due to a number of factors including significant patient heterogeneity and the identification of MM genetic alterations that are also present in MGUS and SMM patients. 7 This information suggests that factors extrinsic to clonal PCs may influence MGUS and/or SMM progression to symptomatic MM. Based on the importance of immune cell infiltration in either promoting or suppressing tumor growth in solid tumors, 8 emerging studies now suggest that the cellular composition, spatial arrangement and/or function of immune cells within the BM microenvironment (ME) may be key factors in progression from MGUS/SMM to MM.9,10 Although cellular composition and cellular function can often be obtained from studies employing BM aspirates, cellular spatial relationships within the BM are lost in single cell suspensions. 11 Thus, examination of the BM immune contexture is truly only achievable through visualization of multiple epitopes in BM core biopsy (BMCB) material using immunohistochemistry (IHC) or immunofluorescence (IF). 12
IHC has been a diagnostic pillar of pathology, however, the use of IHC for multiple epitope detection in a single tissue section requires the use of multiple chromogens, which to date has had limited success. 13 Similarly, the use of IF for multiple epitope detection on formalin-fixed paraffin-embedded (FFPE) BM sections has previously not been a routine methodology due to several limitations which include; inherent background autofluorescence, 14 the required use of primary antibodies from different species in order to avoid cross reactivity, 15 and the inability to effectively remove or strip both primary and secondary antibodies (Abs) from tissue sections. 16 However, over the past few years several groups have demonstrated, using various methods that primary and secondary antibody (Ab) removal and reprobing is possible with FFPE sections thus, allowing for immunofluorescence multiplex staining.13,17–19 In this regard, Bolognesi et al. 17 demonstrated that primary and secondary antibodies could be removed from tonsillar tissue by incubating slides in a solution containing a detergent and a strong reducing agent. This simple methodology, which is comparable to techniques used to remove Abs from immunoblots, allowed for a single tissue section to be stained with more than 30 different antibodies. Given our interest in the spatial characterization of the BM immune cell microenvironment across the disease spectrum of MGUS to SMM to MM, the goal of this study was to develop methodology that would permit this analysis using BM core biopsies. Indeed, we describe for the first time a protocol that permits multiplex analysis of FFPE BM core biopsies. Our protocol includes steps to quench the autofluorescence that is, an intrinsic feature of BM core biopsies20,21 and also permits multiple rounds of staining on FFPE BM tissue by use of a very effective primary and secondary antibody stripping solution that preserves tissue integrity and antigenicity.
Materials and Methods
Bone Marrow Core Biopsy Samples
This study was performed with the approval of the Mayo Clinic Institutional Review Board, and informed consent was obtained in accordance with the Declaration of Helsinki. Bone marrow core biopsies (BMCB) were obtained at the time of diagnosis and were processed by the Hematopathology Morphology and Histology laboratory at Mayo Clinic, Rochester, MN. In brief, specimens were fixed in B5 fixative/10% formalin for a minimum of 2 hours. If samples were not to be processed immediately, specimens were transferred to 10% formalin. Prior to decalcification, specimens were rinsed well with 10% neutral buffered formalin and were then placed in RDO gold decalcifier working solution (Apex Engineering Product, Fisher Scientific, Waltham, MA) for 2 hours. Samples were then washed for 30 min with running tap water. Following decalcification the BMCB were processed and embedded in paraffin wax using a Peloris processor (Leica, Buffalo Grove, IL). 5-μm thick sections were cut from the paraffin-wax blocks using a microtome and sections were water floated onto poly-
Immunofluorescence (IF) Staining
Paraffin from FFPE BMCB slides was removed by incubating the slides at 80C for 20 min in a hybridization oven (Genemate, Bioexpress, Kaysville, UT). Slides were then cooled for 3 minutes and processed through a series of incubation steps for deparaffinization and rehydration which included the following steps: 1) xylene for 5 min; 2) xylene with 5% iodine for 5 min; 3) xylene for 5 min; 4) two times in 100% EtOH for 5 min; 5) 95% EtOH for 5 min; and 6) 70% EtOH for 5 min. The slides were then rinsed in running distilled water for 5 min after which they were placed in a steamer containing pre-warmed 1X antigen retrieval buffer (DAKO, Santa Clara, CA) for 30 min. After 30 min, the steamer was turned off, the lid was removed and the slides were allowed to cool for 20 min before rinsing in running distilled water for 5 minutes with 3 full changes of water. The BMCB slides were then permeabilized by incubation in 1X TBS solution containing 0.3% Triton-X (Sigma, St. Louis, MO) for 45 min. Following permeabilization slides were rinsed 3X for 5 min with 1X TBS solution containing 0.03% Triton-X. In order for small volumes of solutions to be added to the slides, a wax ring was drawn around the BMCB section using a hydrophobic pen. Background staining was prevented by incubating the BMCB tissue for 10 min with 3 drops of Background Sniper (Biocare Medical, Pacheco, CA) blocking reagent. After the 10 min incubation, Background Sniper solution was removed and slides were incubated with various primary antibodies diluted in DaVinci Green diluent (Biocare Medical, Pacheco, CA) including: goat anti-human lambda light chain (LC)-TRITC 1:100, Southern Biotech, Birmingham, AL; goat anti-human kappa light chain (LC)-TRITC 1:100, Southern Biotech; mouse anti-human CD4 1:50, Abcam, Cambridge, MA; rabbit anti-human CD8 1:50, Cell Signaling, Danvers, MA; mouse anti-human PD-1 1:50, Abcam; mouse anti-human CD68 1:50, DAKO; and, rabbit anti-human CD163 1:50, Cell Signaling. Diluted primary antibody was added to the wax ring area and incubated for 1 hr at RT or overnight at 4C. Slides were then washed 4X with TBS containing 0.03% Triton-X. If the antibody was not conjugated, the slides were incubated with either anti-mouse-Cy3 (Biolegend, San Diego, CA) or anti-rabbit-AlexaFluor 488 (Molecular Probes, ThermoFisher Scientific, Waltham, MA) for 45 min at room temperature. Secondary antibodies were diluted 1:500 in DaVinci Green. The slides were then washed 4X with TBS containing 0.03% Triton-X. To quench tissue autofluorescence that is, inherent to BMCB tissue, following incubation with primary and secondary antibodies slides were incubated with 1X TrueBlack Lipofuscin Autofluorescence Quencher (Biotium, Fremont, CA) for 30 sec followed by washing with PBS 3X for 1 min each. One drop of VECTASHIELD Antifade Mounting Media (Vector Labs, Burlingame, CA) containing DAPI (4’,6-diamidino-2-phenylindole) was then added to the slides prior to the placement of the coverslip. Nail polish was used to seal the slides. Slides were not viewed under the microscope for at least 15 min and/or were stored at 4C until imaged.
Slide Viewing and Image Capture
Prior to capturing individual images, a full overview scan of the tissue was performed at 4X using an Olympus BX53 fluorescence microscope (Olympus, Center Valley, PA) equipped with an automated stage, an X-Cite 120LED illuminator (Excelitas/Lumen Dynamics, Waltham, MA) and Olympus cellSens software. Using the overview scan, individual regions of interest (ROI) were selected and their locations were recorded. Images of epitope specific staining at the selected ROI were then captured at either 20X or 40X magnifications. Image capture settings were optimally adjusted for each acquisition and were within the following range: blue channel 75-125 ms exposure/5-7 dB gain; green channel 125-200 ms exposure/5-7 dB gain and red channel 175-300ms exposure/9-12 dB gain. Images of epitope specific staining captured at each ROI were then combined using cellSens software to create overlay ROI images as illustrated in our multiple epitope figures.
Antibody Stripping and Reprobing
In order to strip the primary and secondary antibodies from the BMCB tissue, the slides were first incubated in 1X TBS with 0.03% Triton-X for 10-15 minutes in order to loosen and subsequently remove the coverslips. Once the coverslips were removed the slides were washed for 10 min with 1X TBS with 0.03% Triton-X with mild agitation. The slides were then placed in a 50 mL conical tube containing 35 mL of 2-ME stripping solution (3.5 mLs 20% SDS, 1.1 mLs 2M Tris-HCL pH6.8, 30.1 mLs dH2O, 280 uL 2-ME) that had been prewarmed to 56C. The tube containing the slides was incubated for 30 min in a circulating waterbath set to 56C. The slides were removed and washed 4X for 15 min with dH2O with mild agitation. Finally, the slides were reblocked with Background Sniper, reprobed with the next primary/secondary antibody combination and incubated with TrueBlack prior to mounting. Figure 1 summarizes the protocol for multiplex staining, blocking, stripping, and restaining.
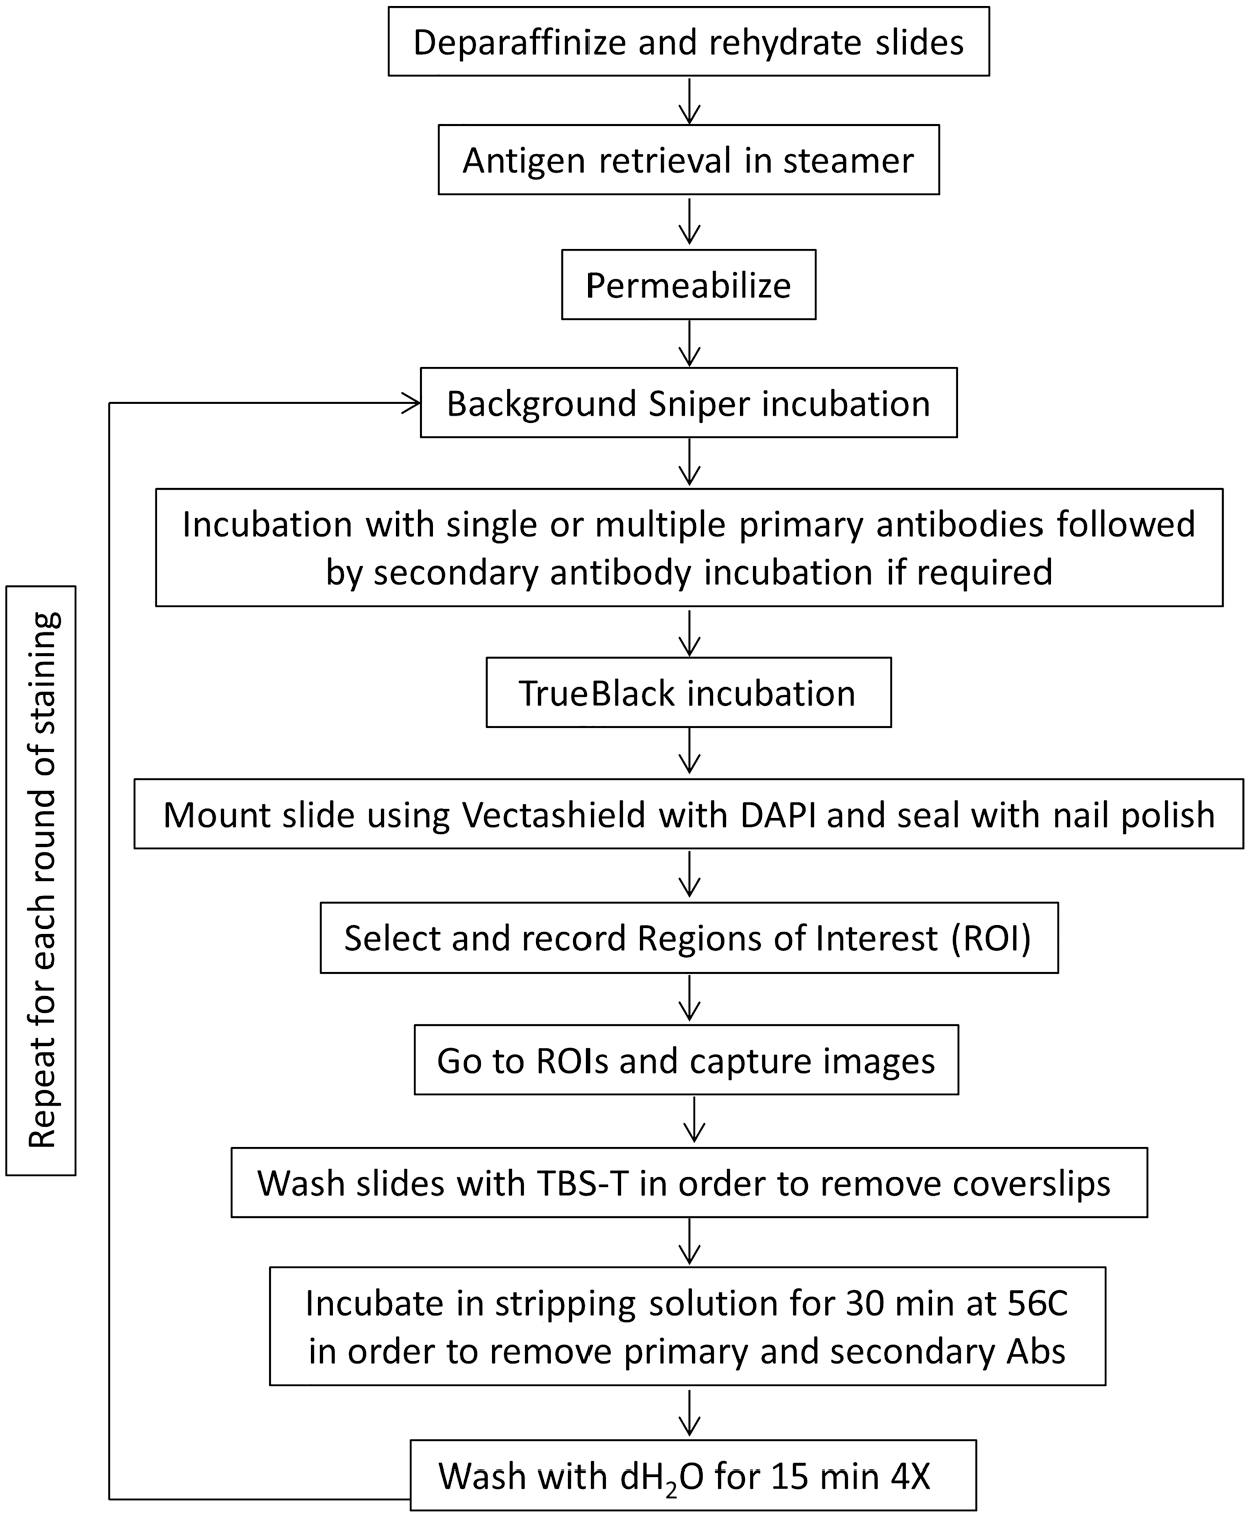
Protocol for multiplex staining in formalin-fixed paraffin-embedded (FFPE) BM core biopsy (BMCBs). Overview of the steps for sequential antibody staining and antibody removal using 2-ME/SDS stripping buffer.
Immunofluorescence (IF) Analysis
Individual images (DAPI, TRITC, Alexa488) captured at each ROI were uploaded to HALO software (Indica Labs, Albuquerque, NM) and appropriately fused together to create overlay images of each ROI. The images were analyzed using the HALO Highplex Fluorescence module. Spatial analysis of the overlaid image was performed and the selected cell types were plotted. Nearest Neighbor cellular proximity was subsequently performed via HALO by determining the nearest CD4 or CD8 cell to every clonal PC and measuring from cell center to cell center.
Results
BMCB Intrinsic Autofluorescence Is Blocked by TrueBlack Lipofuscin Autofluorescence Quencher
Given that FFPE BMCB slides are known to possess notoriously high levels of intrinsic autofluorescence20,21 we first began our studies by examining the ability of various blocking agents to reduce autofluorescence in BMCB. As shown in the upper left panel of Supplemental Fig. 1, high background fluorescence is observed in a BMCB from a MGUS patient in the absence of staining with any fluorescence conjugated antibodies. Likewise, when the sample was stained with a CD4 antibody and an Alexa488-conjugated secondary antibody (upper right panel), there is evidence of widespread autofluorescence which makes identification of true CD4 expressing cells very challenging (Supplemental Fig. 1). Methodologies that have previously been shown to reduce autofluorescence in various tissues include: 1) incubation with 10% goat serum 22 ; 2) incubation with 5% BSA 23 ; 3) incubation with 0.3M glycine (Abcam protocol); and 4) incubation with 0.25% NH3/70% EtOH. 24 We evaluated the ability of these strategies to reduce autofluorescence when staining MGUS BMCB slides with a CD4 antibody and an appropriate AlexaFluor 488-conjugated secondary antibody. As shown in Supplemental Fig. 1, each of these reagents did not significantly reduce autofluorescence in BMCB tissue (Supplemental Fig. 1). Thus, we also examined two commercially available reagents, TrueBlack and MAXblock for reducing autofluorescence when staining for CD4. Treatment of BMCB slides with TrueBlack for 30 sec following primary and secondary Ab incubation was found to result in the most significant reduction in autofluorescence without compromising epitope staining (Supplemental Fig. 1; bottom right panel). By comparison, treatment of BMCB slides with MAXblock did reduce autofluorescence but the reduction was not as effective as treatment with TrueBlack (Supplemental Fig. 1). Thus, incubation with TrueBlack was used as the method of autofluorescence reduction for all subsequent experiments.
2-ME Stripping Solution Removes Both Primary and Secondary Antibodies
To determine if incubation with 2-ME stripping solution could remove both primary and secondary antibodies from BMCB tissue, slides from MM patients were first probed with antibodies to either lambda LC, CD4 or CD8. Individual images of various ROI displaying positive staining for these epitopes and the corresponding DAPI image were captured and merged as shown in Fig. 2A. Following coverslip removal and incubation with 2-ME stripping buffer (see Fig. 1 for abbreviated protocol), the slides were remounted with VECTASHIELD with DAPI and the same ROI were evaluated to determine if any positive staining for lambda LC, CD4 or CD8 remained. As shown in Fig. 2B, the same ROI lacked any positive staining for lambda LC, CD4 or CD8 after stripping. DAPI staining confirmed that although specific staining for lambda LC chain, CD4 and CD8 could not be detected, the tissue was indeed still intact and that overall tissue integrity appeared to be comparable to the original images. Examination of additional ROI and scanning of the entire slide confirmed that specific staining could not be detected for any of the probed antigens. To ensure that the lack of specific staining was due to stripping of both the primary and conjugated-secondary antibody, the slides were reincubated with an appropriate conjugated-secondary antibody alone and the ROI were evaluated for the presence of specific staining. No detectable staining was observed, thereby indicating the stripping procedure removed both the primary and secondary antibodies. This same procedure was repeated using normal BM, MGUS and SMM slides and similar results were obtained.
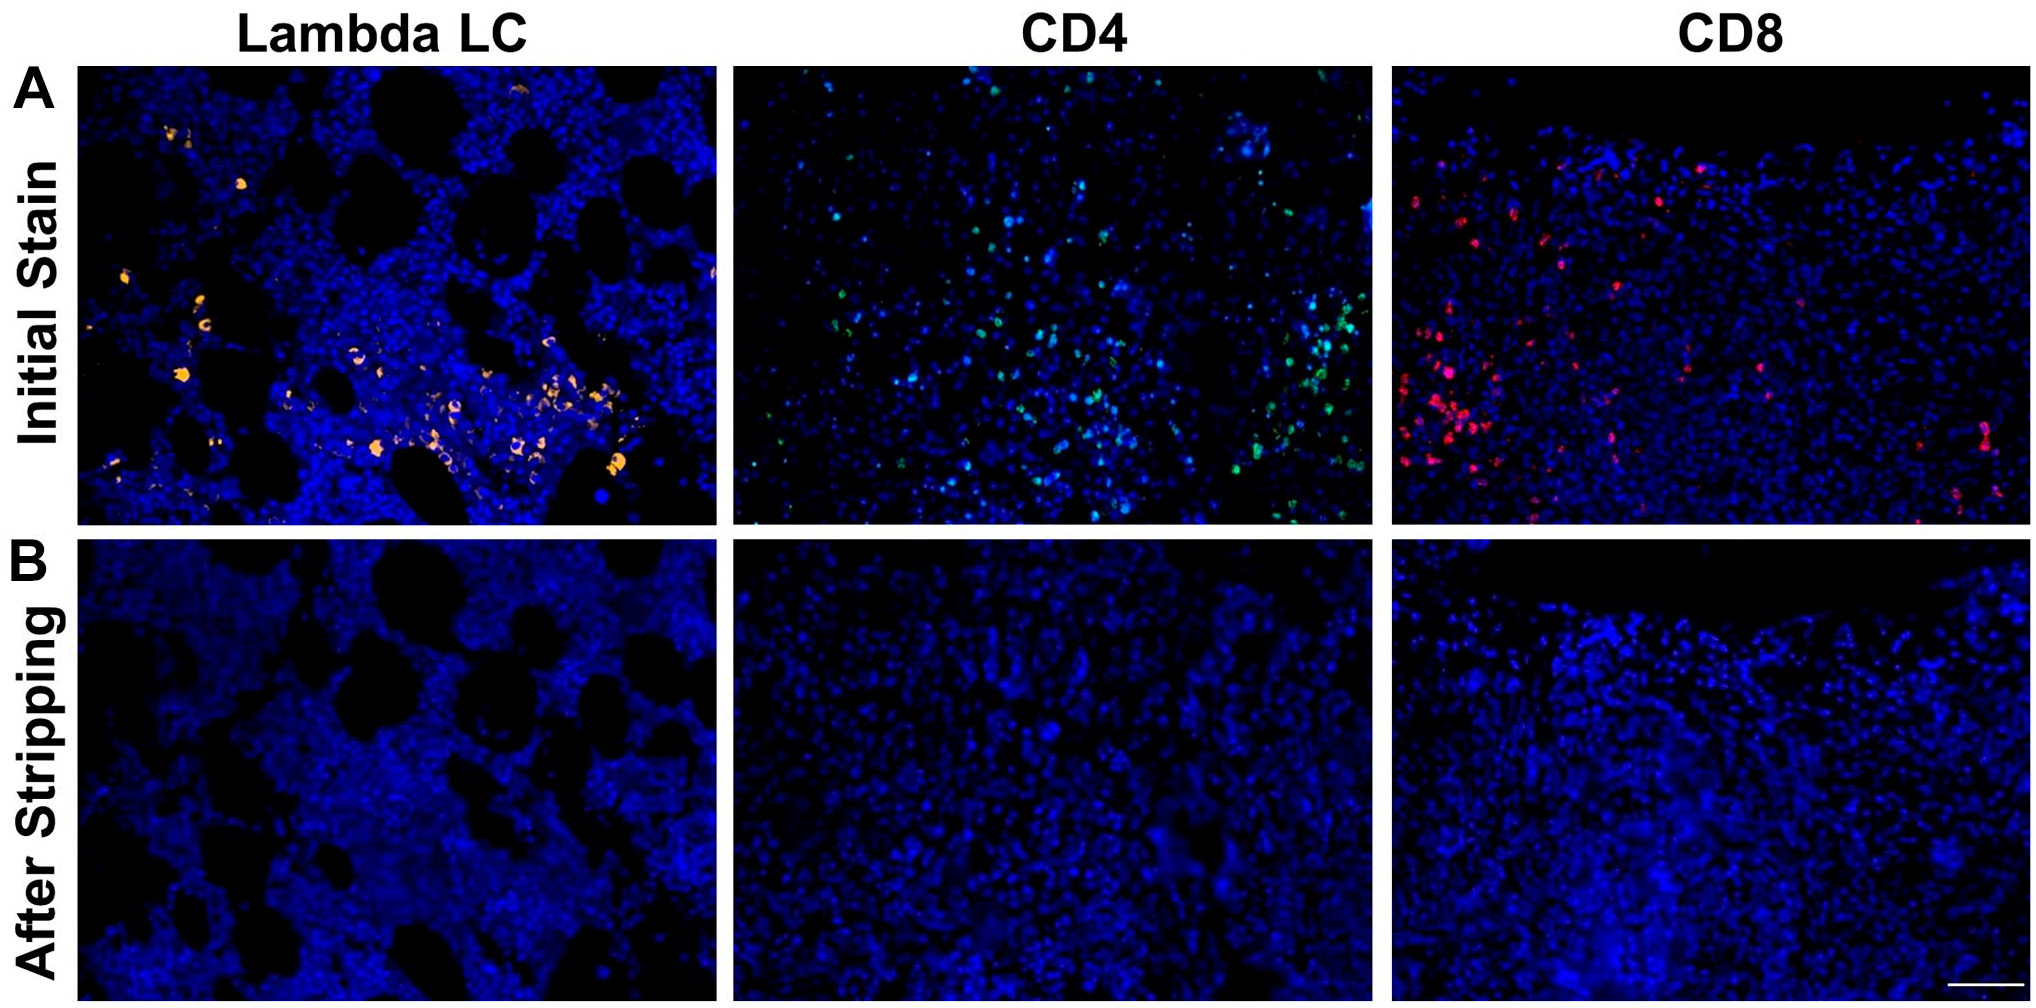
2-ME/SDS stripping solution removes both primary and secondary antibodies from BM core biopsy (BMCB) tissue. (A) Immunofluorescence (IF) detection of lambda light chain (LC), CD4, CD8 and DAPI (4’,6-diamidino-2-phenylindole) in three separate BMCB regions of interests (ROIs) from a MM patient with clonal lambda plasma cells (PCs). (B) Re-examination of the same ROI reveals that lambda LC, CD4 and CD8 can no longer be detected following stripping with 2-ME/SDS stripping solution while DAPI staining of the ROI indicates that the tissue at the ROI is intact. Scale bar: 50 µm.
Stripping and Reprobing of BMCB Tissue Does Not Result in Loss of Antigenicity
Given that our goal was to be able to probe, strip and reprobe BMCB slides multiple times in order to overlay ROI images and visualize the BM immune contexture, we wanted to ensure that loss of antigenicity would not occur with multiple rounds of stripping and reprobing. Thus, we began by initially staining MM BMCB slides for CD4 and CD8 and capturing specific ROI and corresponding DAPI images as shown in Fig. 3A. Next, we stripped the slides, remounted them and evaluated them for Ab stripping efficiency. After confirming successful Ab stripping (data not shown), the slides were reblocked and reprobed for CD4 and CD8. The same ROI were then evaluated and images were captured using the initial exposure and gain settings. This process was then repeated 3 additional times and the resulting staining was found to be comparable after each round of staining. Figures 3B illustrates the results achieved in the fourth staining and the pattern of staining is comparable to images shown in Fig. 3A. Due to the fact that enhanced DAPI staining was observed in some cases following the stripping process, images in Fig. 3 are shown with and without DAPI staining to permit a more sensitive assessment of the signal strength of CD4 and CD8 after stripping.
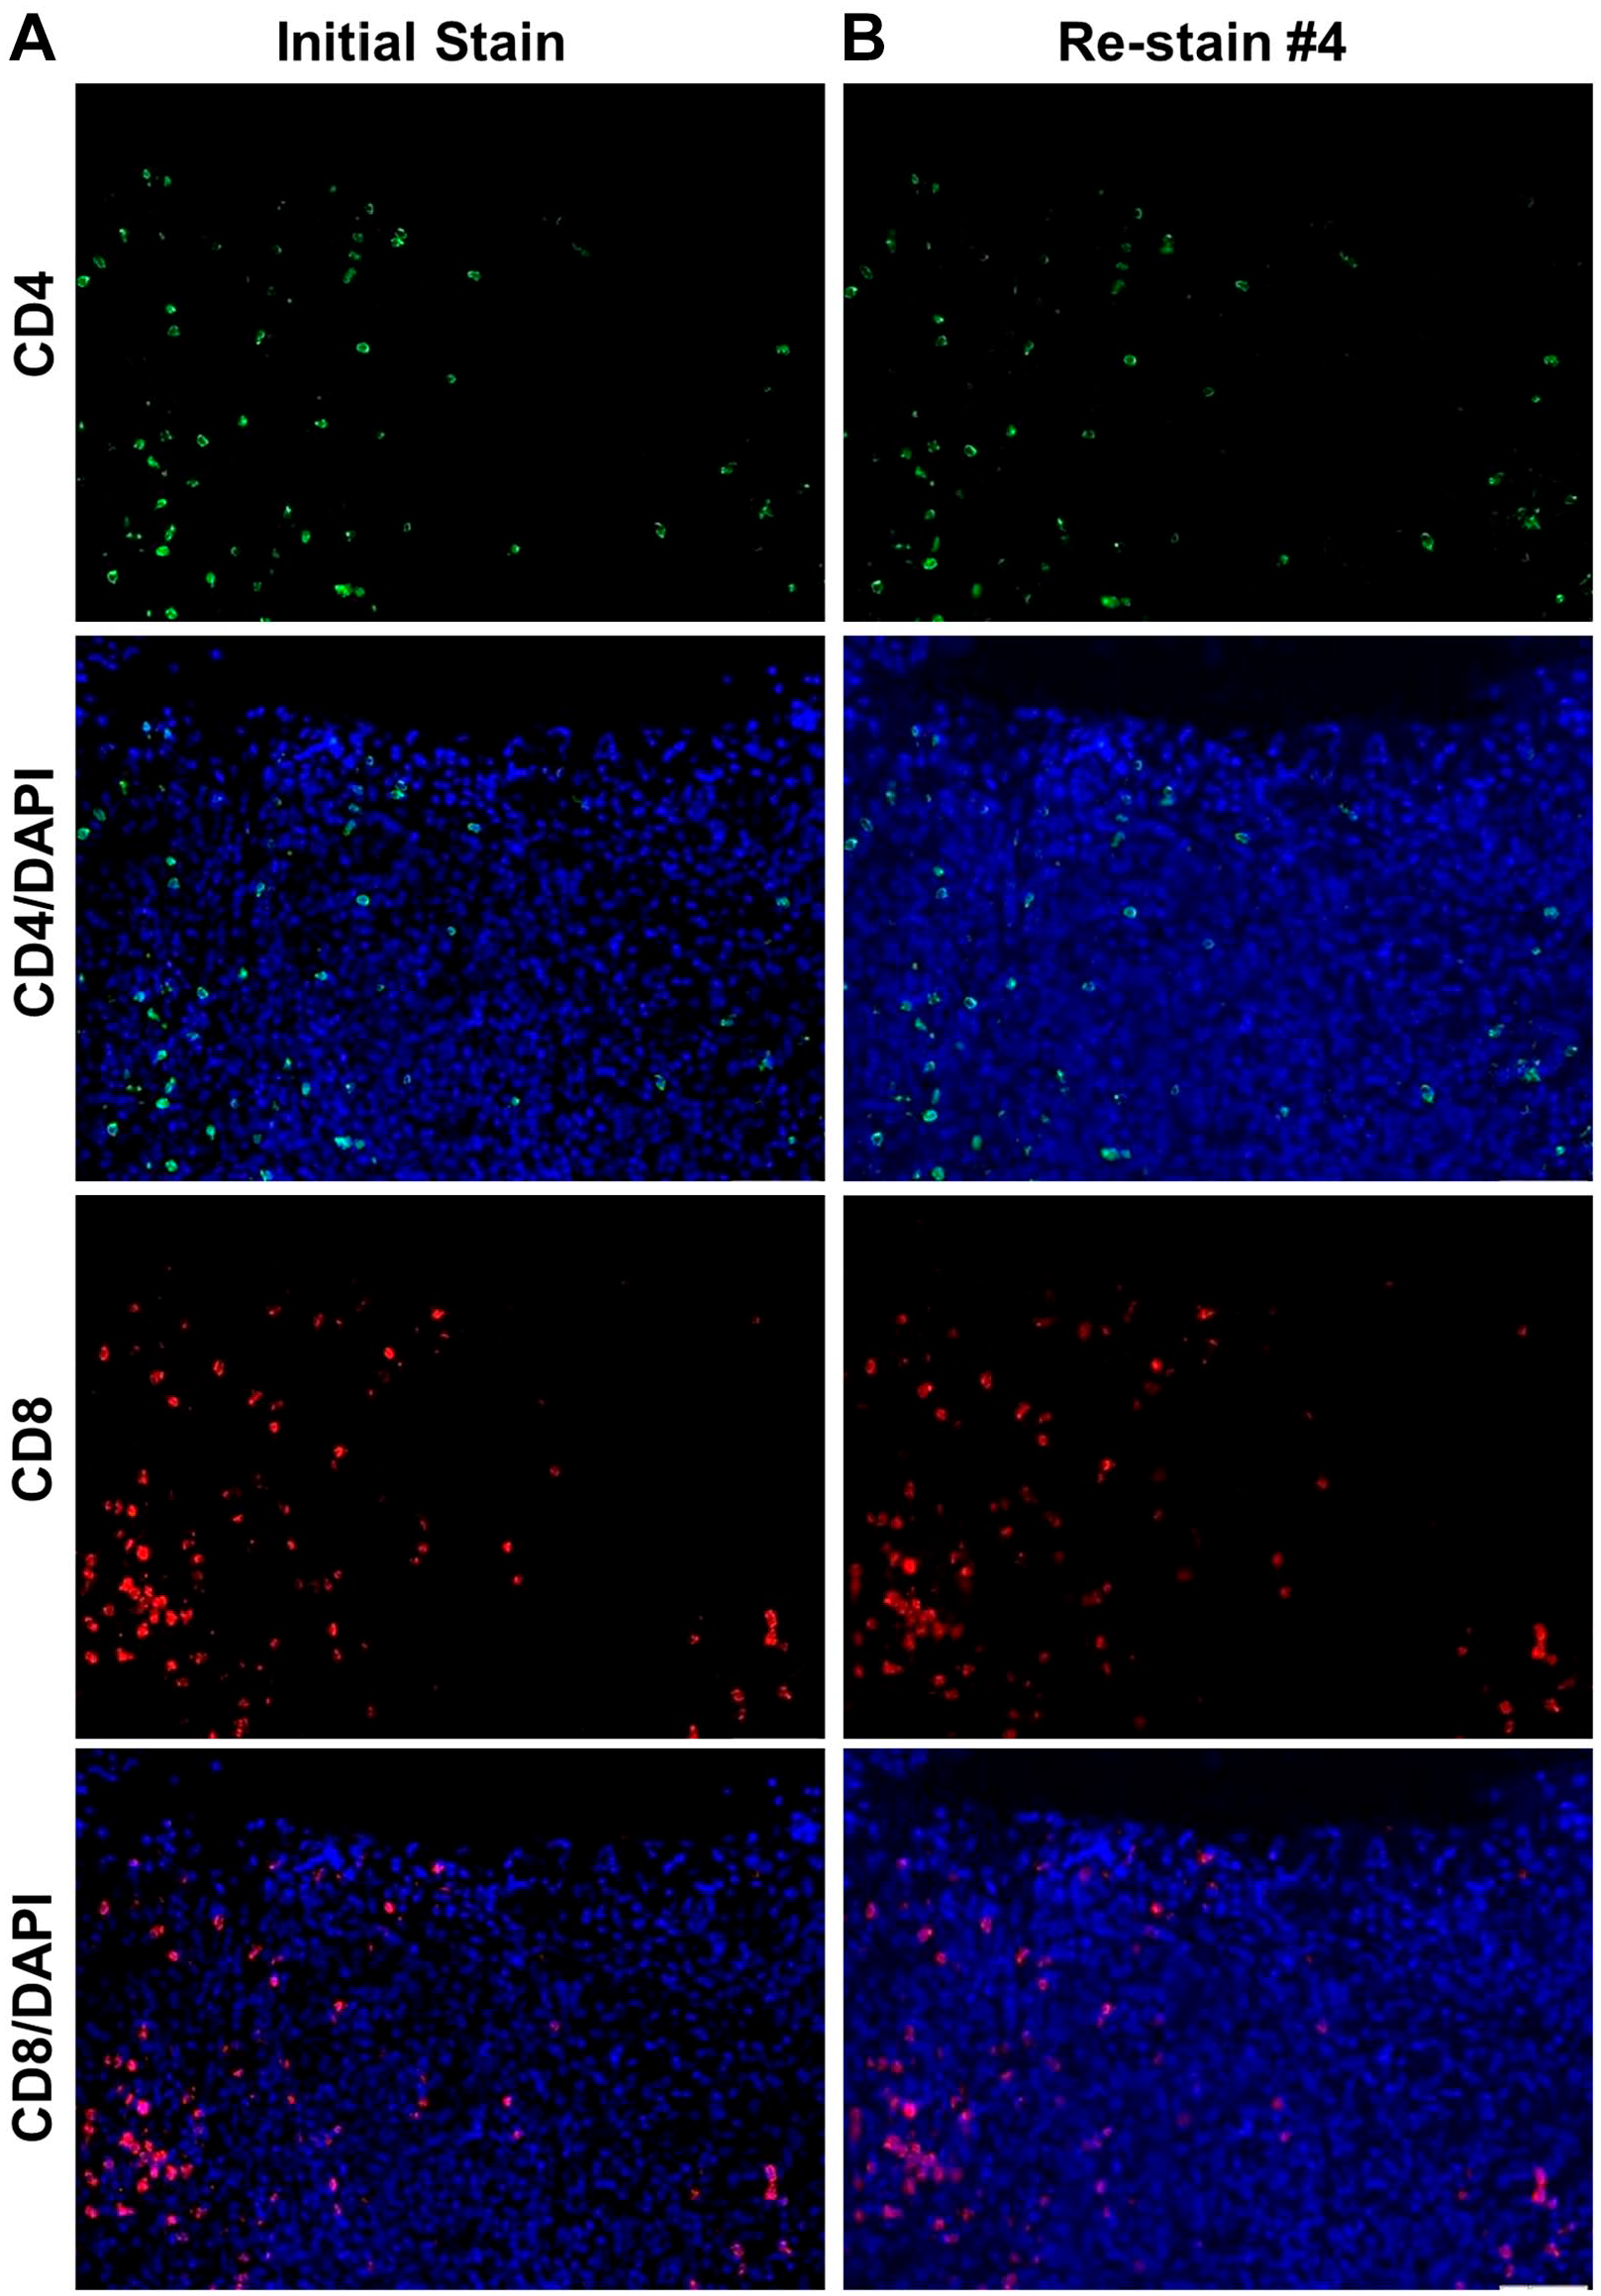
2-ME/SDS stripping solution does not alter epitope antigenicity. (A) Initial immunofluorescence (IF) detection of CD4 and CD8 in a single BM core biopsy (BMCB) regions of interest (ROI) from a multiple myeloma (MM) patient with or without DAPI (4’,6-diamidino-2-phenylindole) staining overlaid. The bottom panel in column A reflects merged images of CD4, CD8, and DAPI. (B) Fourth detection of CD4 and CD8 following stripping of antibodies from the third staining. Scale bar: 50 µm.
Loss of Tissue With Multiple Rounds of Probing and Reprobing
Although stripping and reprobing of BMCB slides from normal BM, MGUS, SMM and MM patients was found to be achievable and reproducible; one issue that was occasionally encountered was loss of tissue at an ROI due to tissue fragility. As shown in the DAPI image in Supplemental Fig. 2B captured following the second round of stripping, a portion of the BMCB tissue is detected to be absent as compared to the original image (Supplemental Fig. 2A). In order to mitigate this unpredictable loss of tissue, multiple ROI were imaged in all experiments.
Stripping and Reprobing of BMCB Tissue Allows for Visualization of the BM Immune Contexture
In order to be able to visualize the spatial relationship of various immune cell types in the BM microenvironment of MGUS, SMM and MM patients, BMCB slides from each patient group underwent sequential probing, stripping and reprobing for the following antigens: lambda and kappa LC chain, CD4, CD8, PD-1, CD68 and CD163. Examples of the cell specific 20X images acquired when probing for the expression of each of these antigens and counterstaining with DAPI using a BMCB from a MM patient whose monoclonal MM cells were known to express lambda LCs is shown in Fig. 4. The individual images were then combined using cellSens software to create an overlay image that displays the various cell types present in the specific ROI (Fig. 5). Portions of Fig. 5 were then magnified and displayed in the insets with the various cell types labeled for greater clarity.
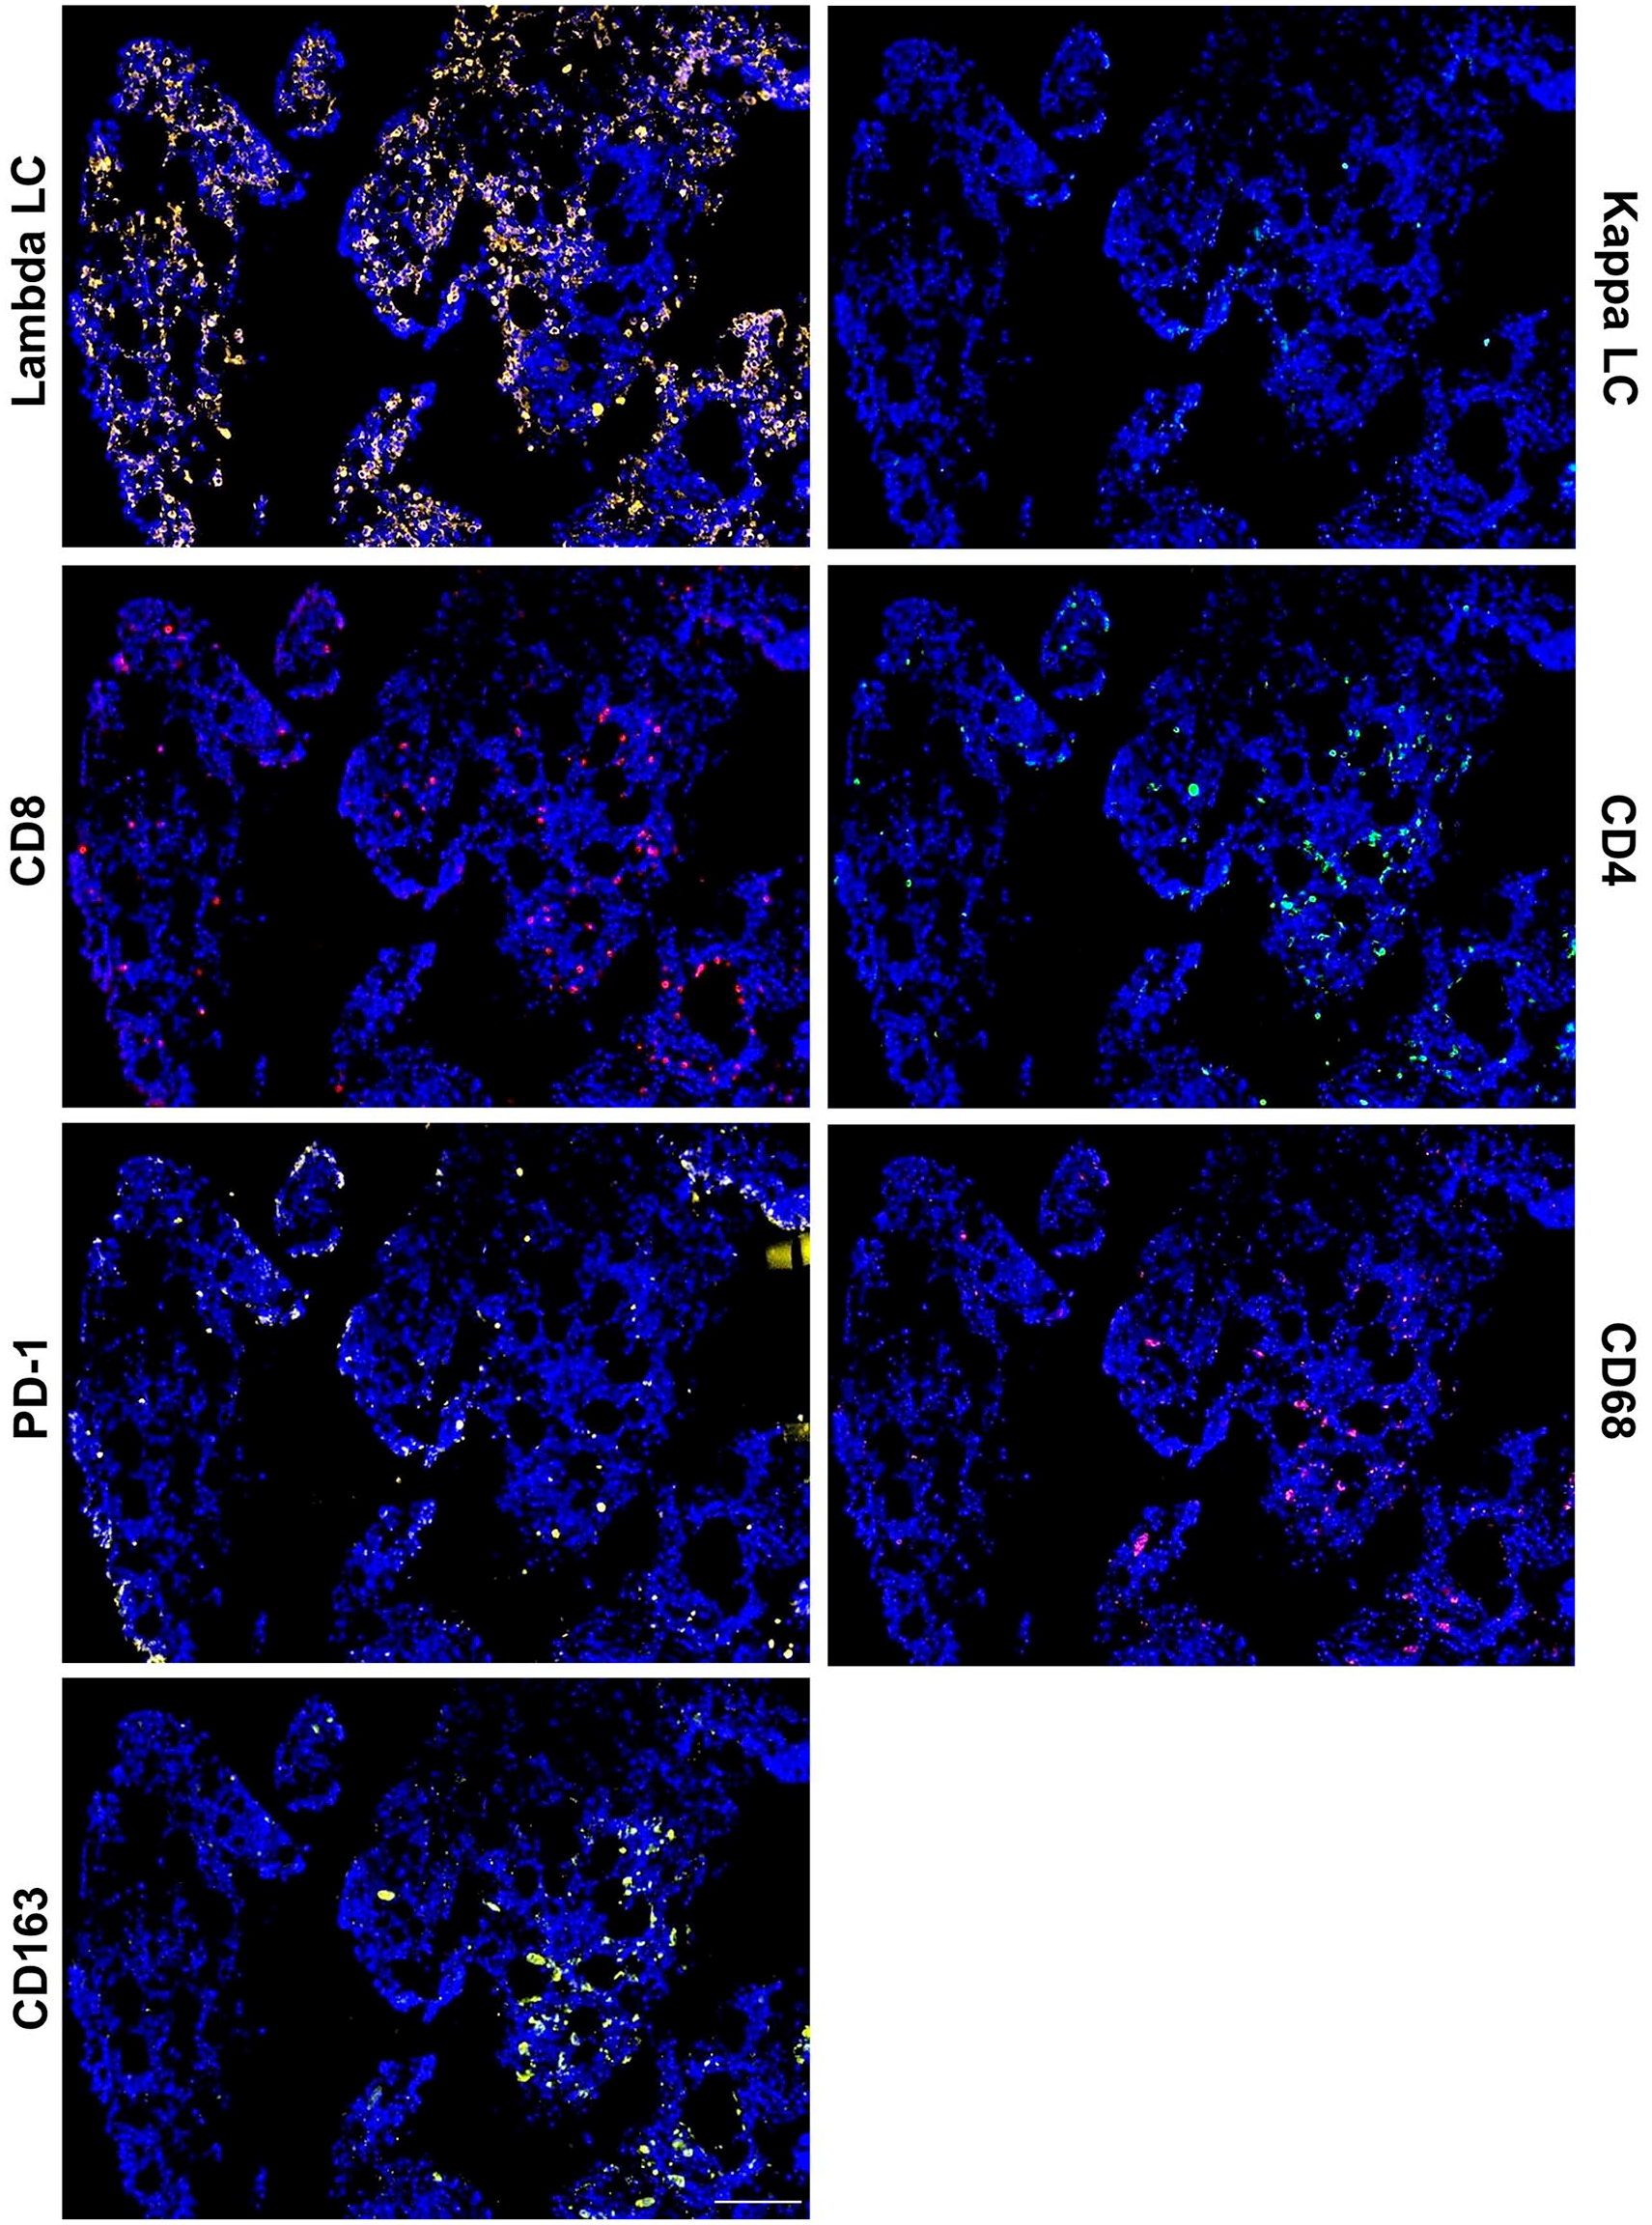
2-ME/SDS stripping allows for sequential immunofluorescence (IF) detection of various immune cells in a BM core biopsy (BMCB) from a multiple myeloma (MM) patient. (A–F) Sequential IF detection of lambda light chain (LC), kappa LC, CD8, CD4, PD-1, CD68, CD163 and DAPI (4’,6-diamidino-2-phenylindole) from a single BMCB regions of interest (ROI) from a MM patient with clonal lambda PCs. Scale bar: 100 µm.
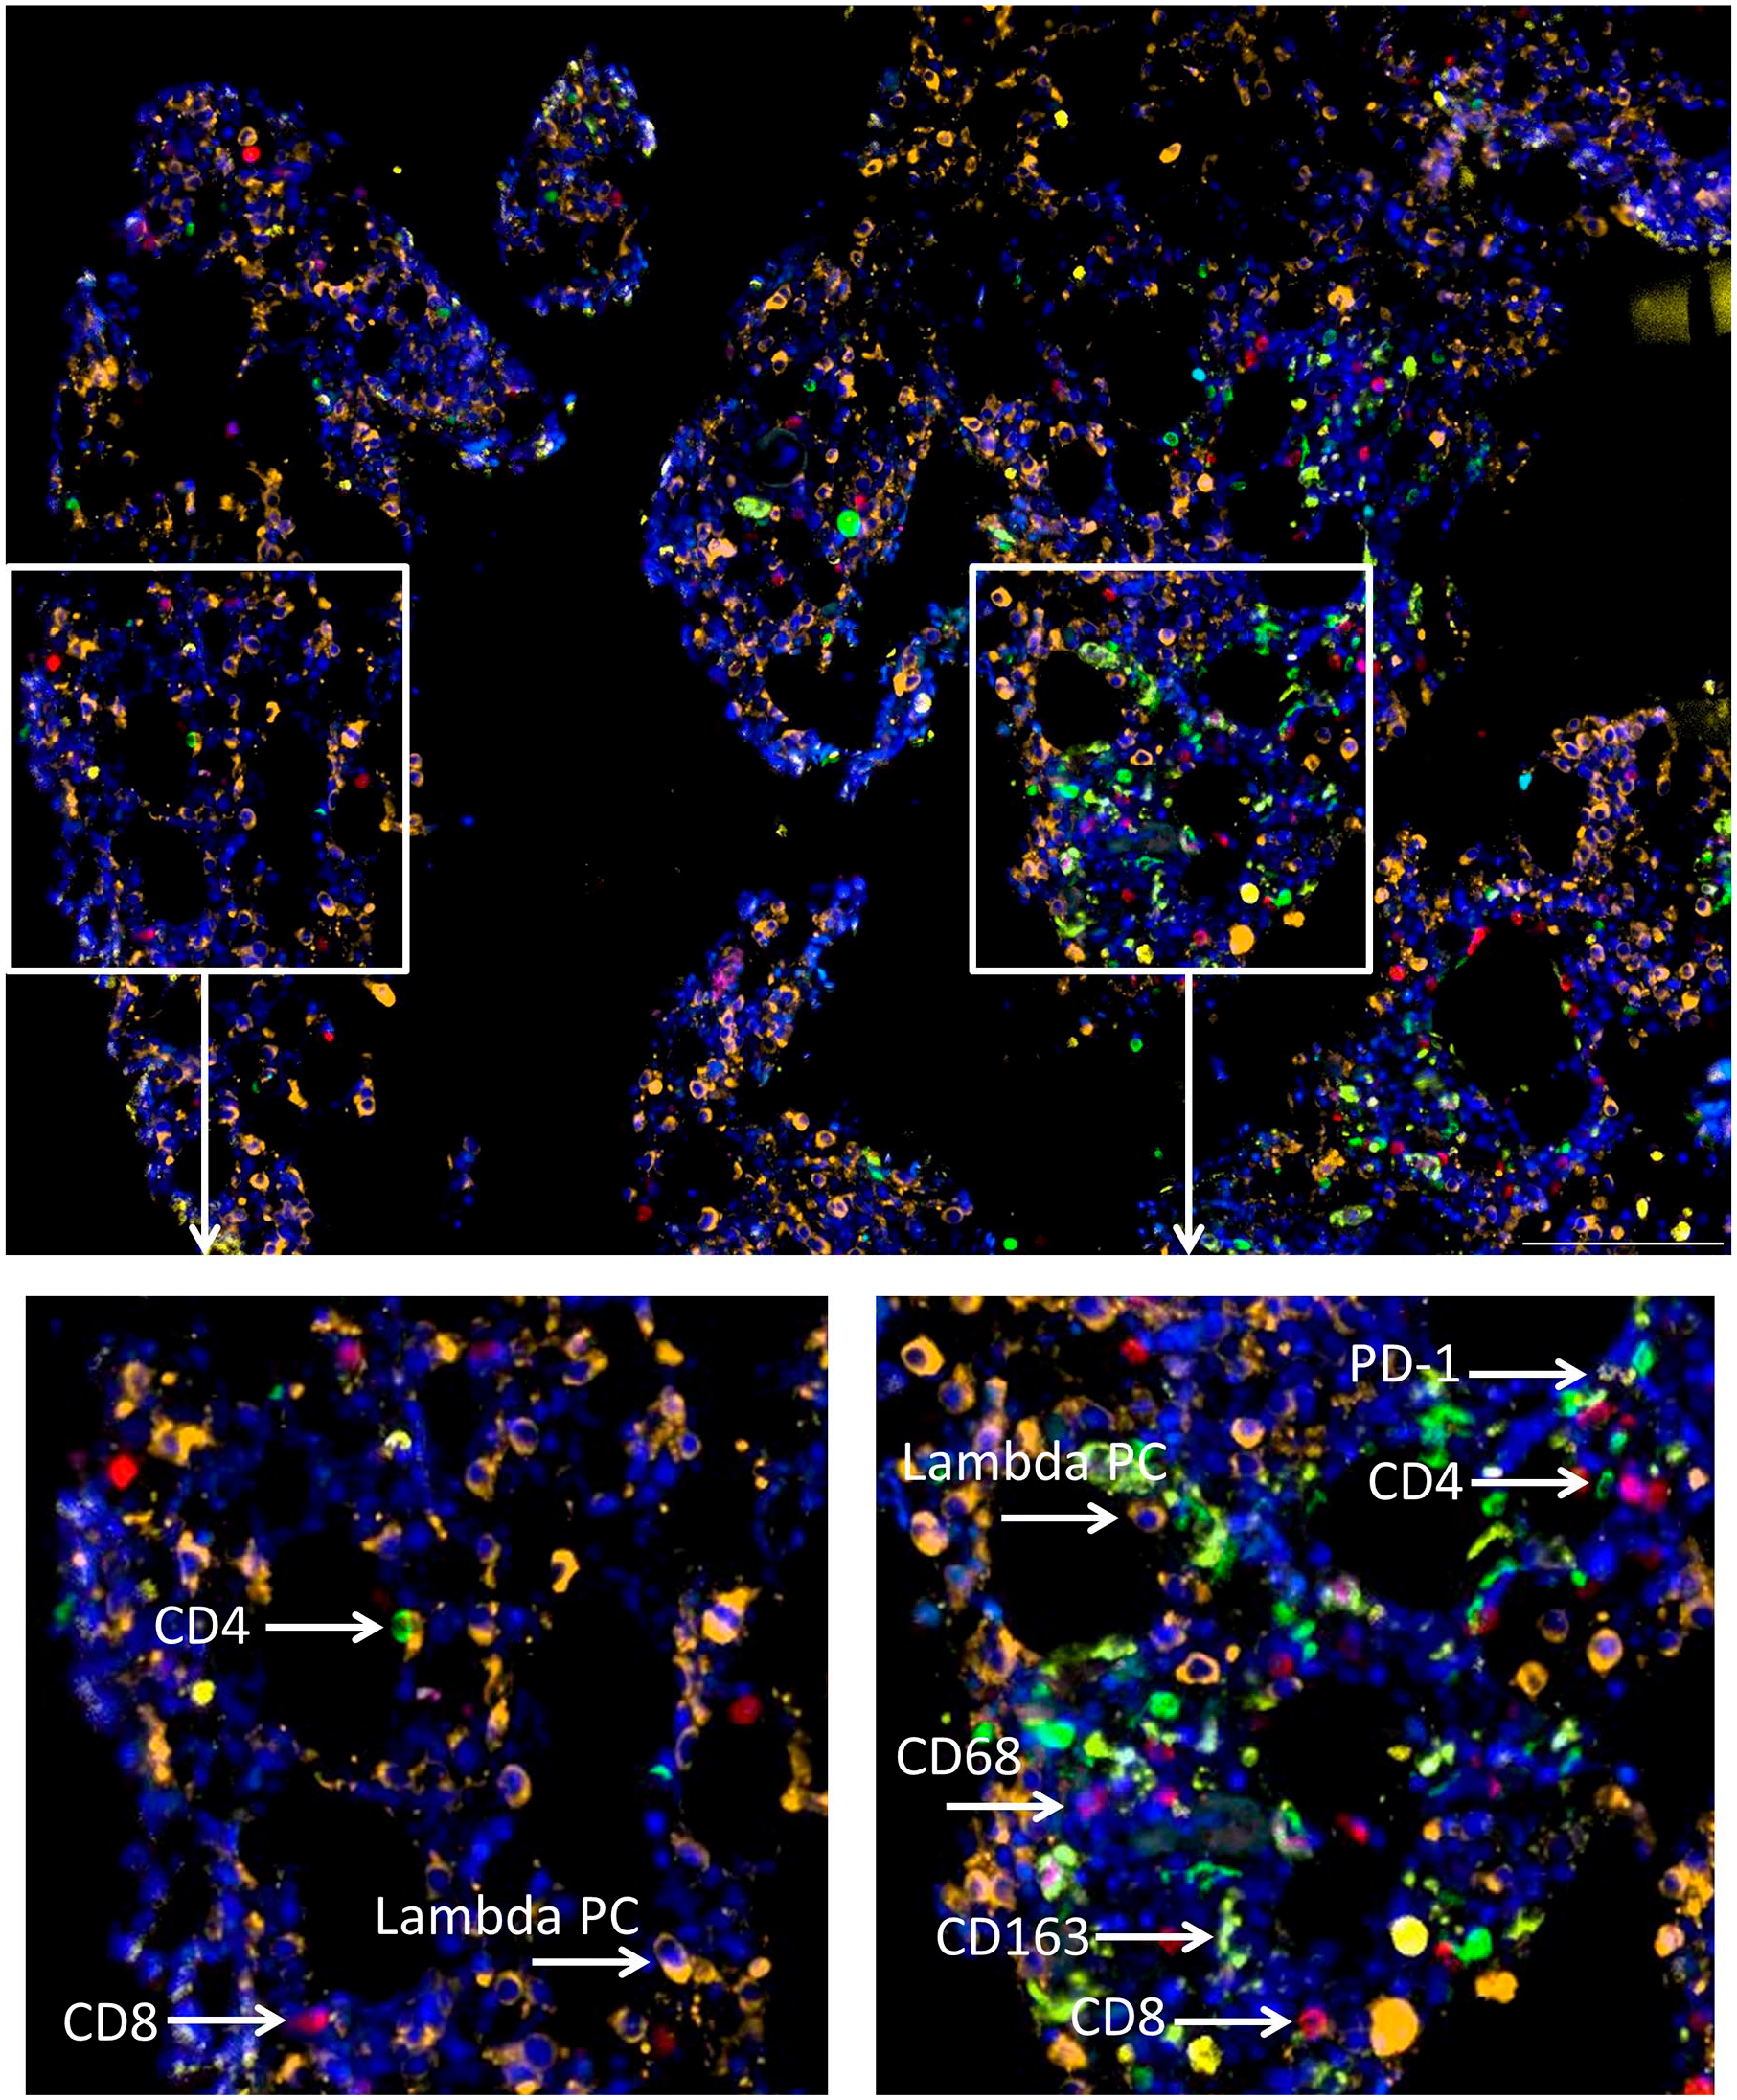
Sequential immunofluorescence (IF) allows for visualization of the bone marrow (BM) immune contexture. Overlay image following sequential IF detection of lambda light chain (LC), CD4, CD8, PD-1, CD68, CD163, and DAPI (4’,6-diamidino-2-phenylindole) (Fig. 5) from a single BM core biopsy (BMCB) regions of interest (ROI) from a multiple myeloma (MM) patient with clonal lambda plasma cells (PCs). Individual insets demonstrate the heterogeneity of the BM immune contexture within the same patient. Scale bar: 100 µm.
Spatial Analysis Reveals Nearest Neighbor Relationships
Given that one of our future end goals is to quantify the spatial relationship of various immune cells across the disease spectrum of MGUS to SMM to MM, we wanted to demonstrate our capability to do so. Thus, we analyzed the spatial relationship between clonal plasma cells and CD8 and CD4 cells across the disease spectrum of MGUS, SMM and MM ROI using HALO Nearest Neighbor analysis. Figures 6A–C illustrates the spatial relationship of CD8 cells to clonal plasma cells. Nearest neighbor analysis of these ROIs determined that the average distance of CD8 cells to clonal plasma cells was 31.9 µm in the MGUS ROI, 26.9 µm in the SMM ROI and 23.2 µm in the MM ROI. Similarly, the spatial relationship of CD4 to clonal plasma cells was also determined for distinct ROIs from the same MGUS, SMM and MM patients (Fig. 7). Using nearest neighbor analysis the average distance of CD4 cells to clonal plasma cells was determined to be 37.7 µm in the MGUS ROI, 11.4 µm in the SMM ROI and 29.8 µm in the MM ROI.
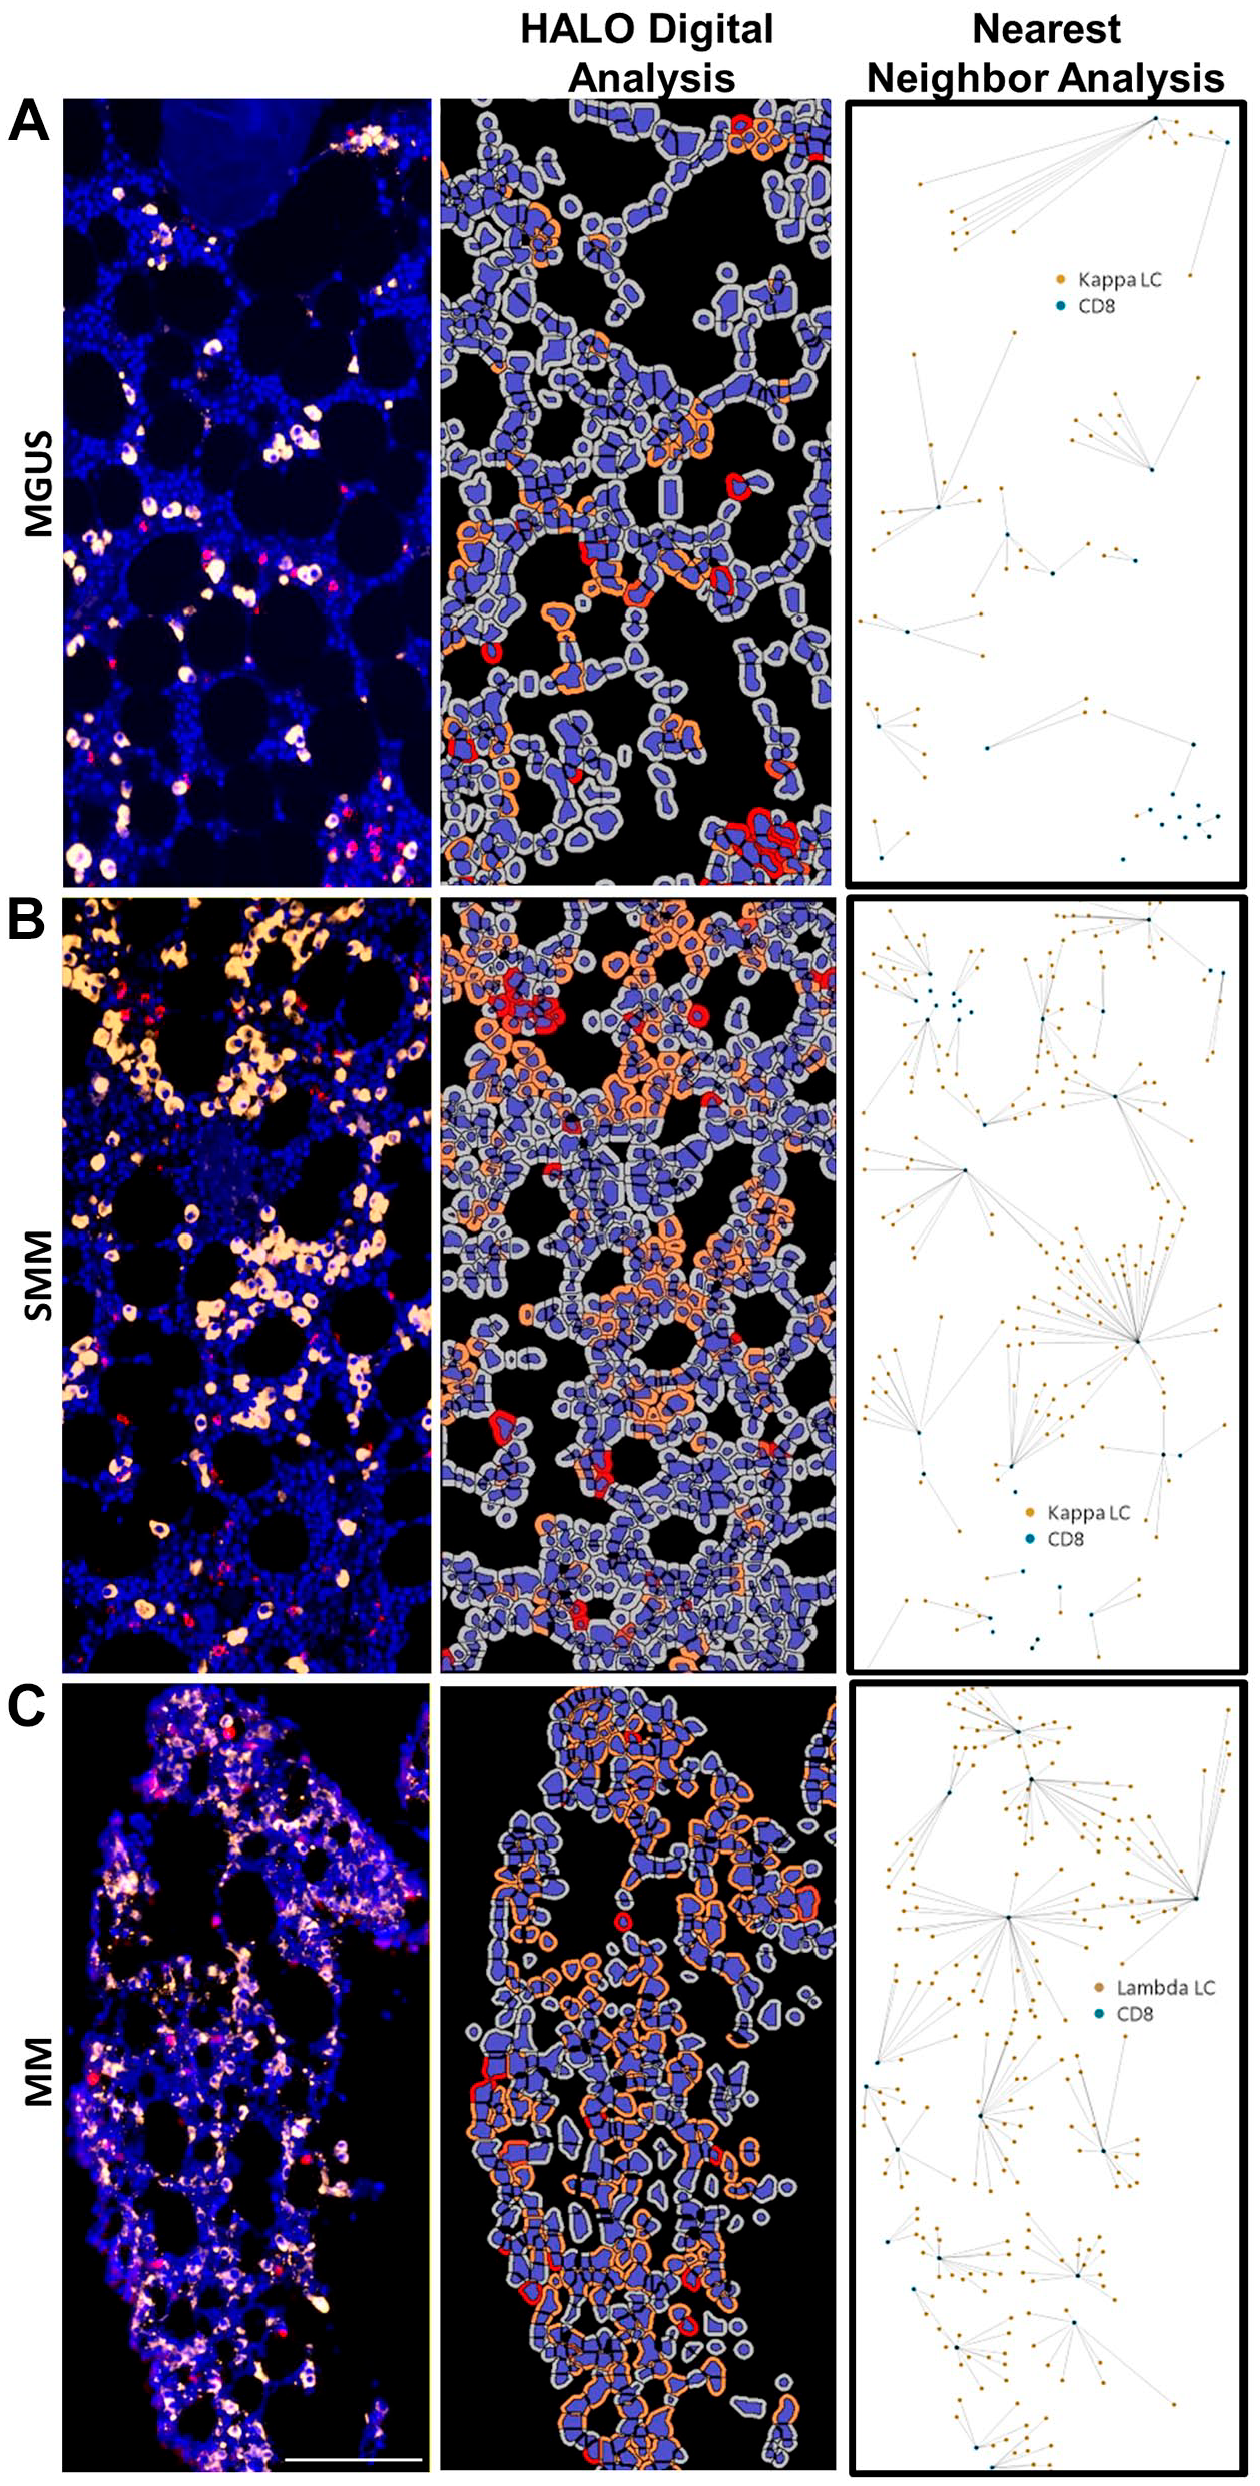
Nearest neighbor analysis of CD8 cells to clonal plasma cells. Immunofluorescence (IF) detection of clonal plasma cells (PCs), CD8 and DAPI (4’,6-diamidino-2-phenylindole) in BM core biopsy (BMCB) regions of interests (ROIs) from: (A) kappa monoclonal gammopathy of undetermined significance (MGUS) patient, (B) kappa smoldering multiple myeloma (SMM) patient; and (C) lambda multiple myeloma (MM) patient. HALO digital analysis of each ROI is also illustrated as well as the spatial plot demonstrating nearest neighbor analysis of nearest CD8 cells to every clonal PC. Scale bar: 100 µm.
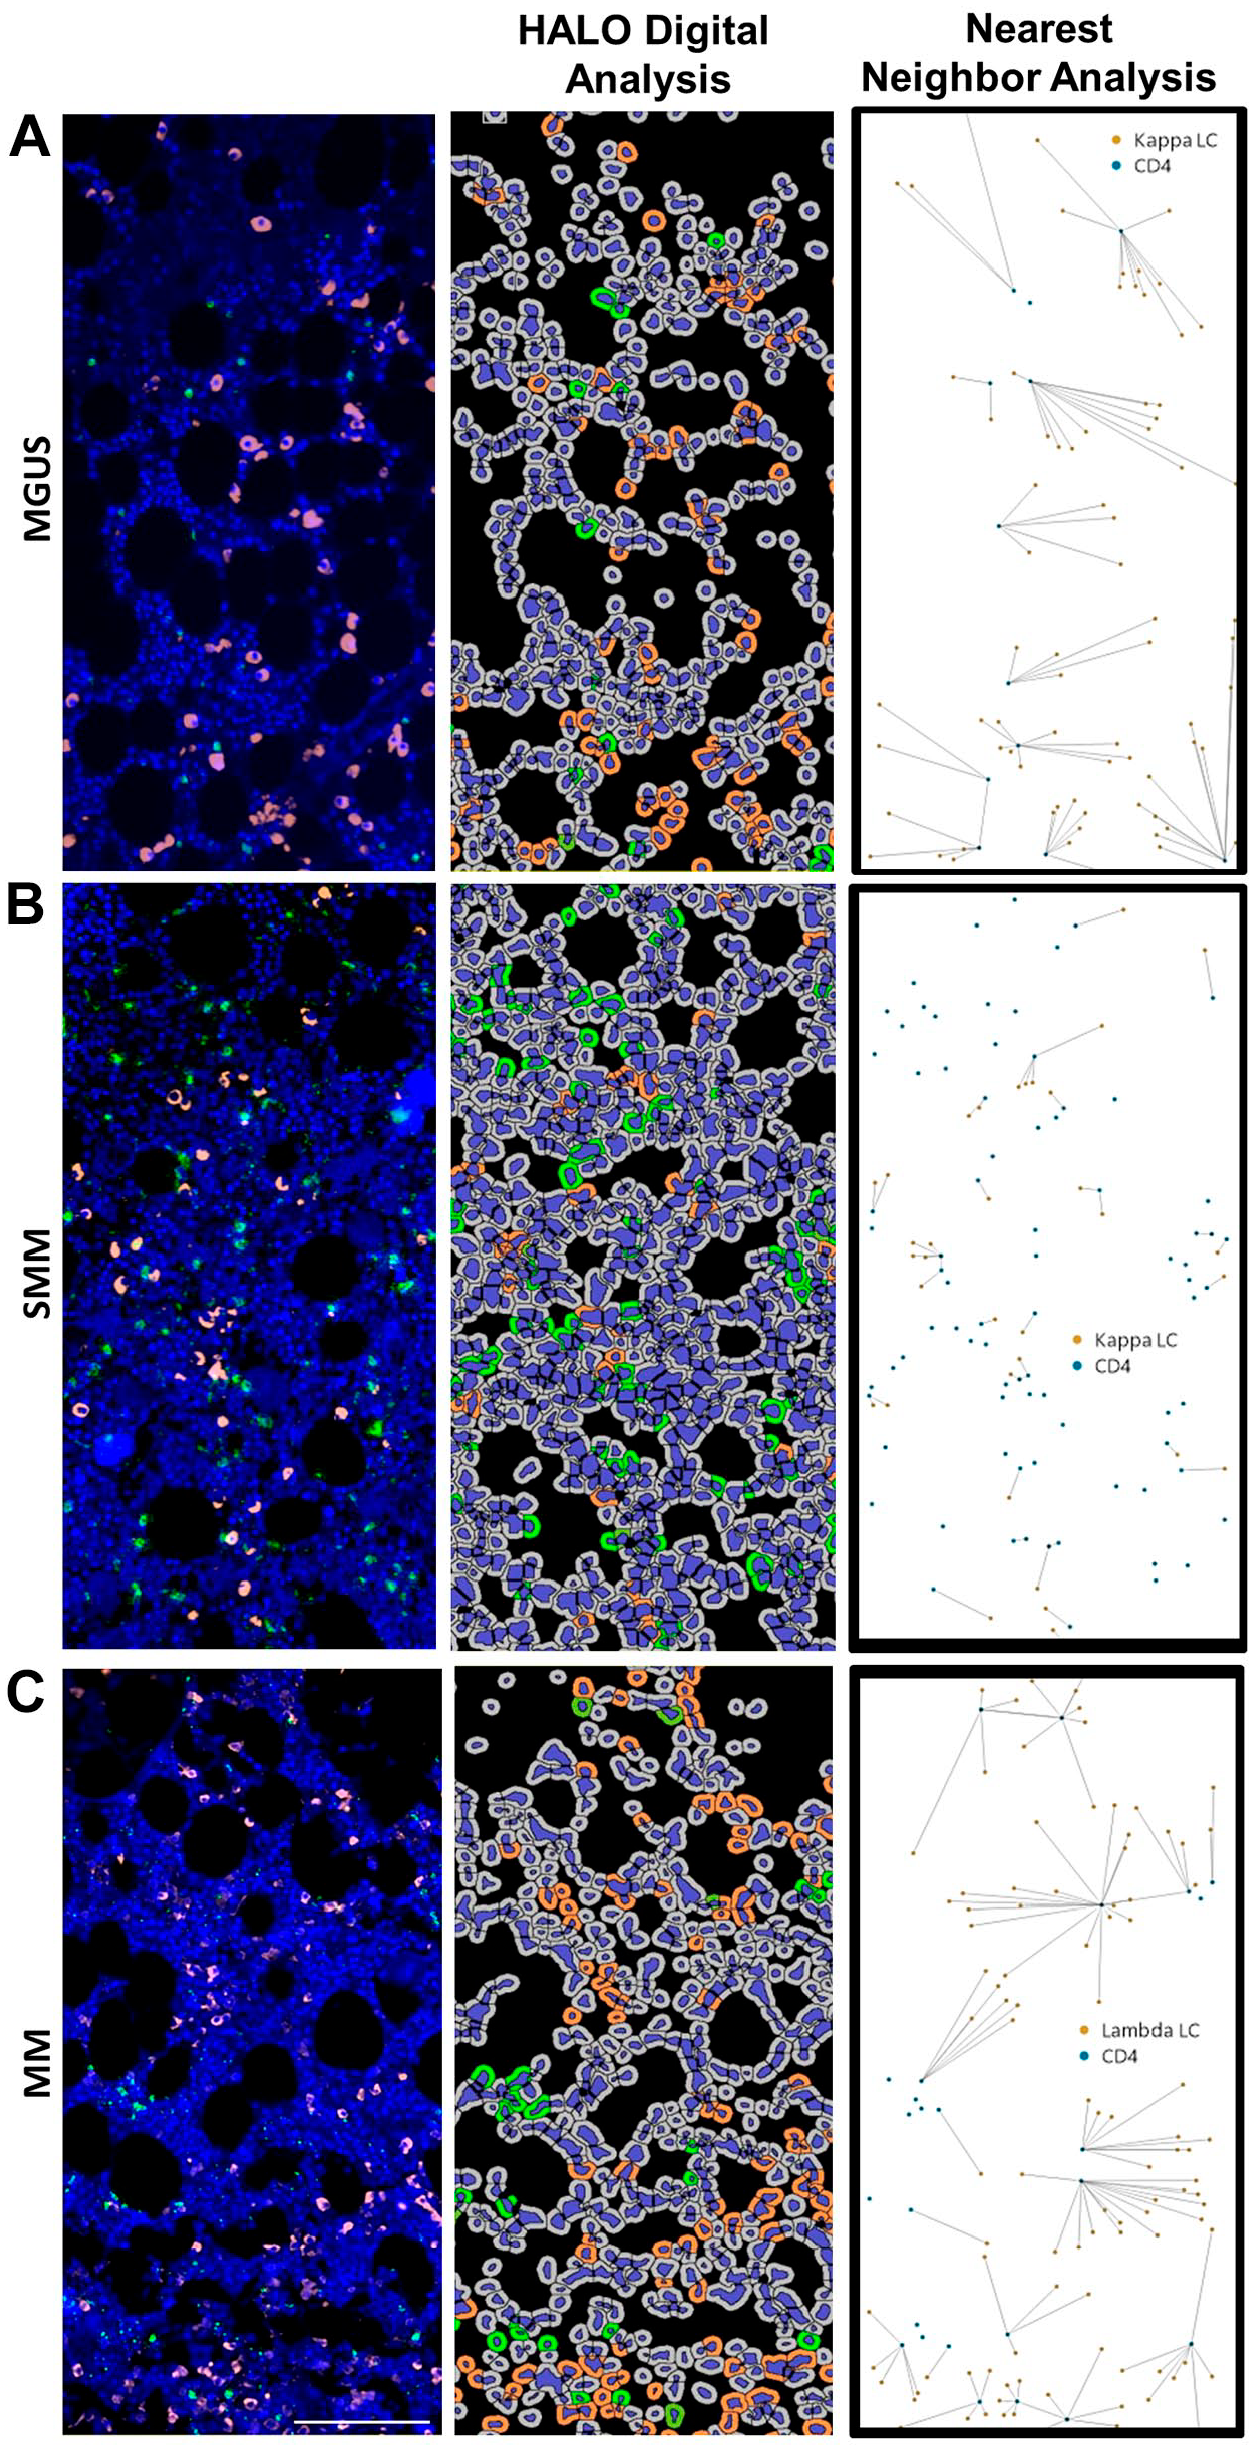
Nearest neighbor analysis of CD4 cells to clonal plasma cells. Immunofluorescence (IF) detection of clonal plasma cells (PCs), CD4 and DAPI (4’,6-diamidino-2-phenylindole) in BM core biopsy (BMCB) regions of interests (ROIs) from: (A) kappa monoclonal gammopathy of undetermined significance (MGUS) patient, (B) kappa smoldering multiple myeloma (SMM) patient; and (C) lambda multiple myeloma (MM) patient. HALO digital analysis of each ROI is also illustrated as well as the spatial plot demonstrating nearest neighbor analysis of nearest CD4 cells to every clonal PC. Scale bar: 100 µm.
Discussion
High intrinsic autofluorescence of FFPE tissue can often preclude detection of specific epitope staining. 25 In our studies with FFPE BMCB samples we consistently observed high intrinsic autofluorescence, primarily in the red and green channels. We also observed non-specific fluorescence in the absence of specific staining when examining BMCB samples in the far red fluorescence channel. Notably, this non-specific background fluorescence was not present in other tissue types we examined (e.g., tonsil). Intrinsic tissue autofluorescence in BM tissue is thought to arise from a number of factors which can include high numbers of immune cells that naturally bind antibodies and engulf cells that possess fragment crystallizable (Fc) receptors, 26 the autofluorescence properties of red blood cells and macrophages due to their respective high content of hemoglobin and flavoprotein-associated granules20,27 and the autofluorescence properties of lipofuscin granules present in macrophage lysosomes.26,28 In addition, routine formalin tissue fixation procedures29,30 can also increase autofluorescence. Although several methodologies to decrease autofluorescence have been published over the years, the autofluorescence quencher TrueBlack has recently been shown to effectively remove autofluorescence in both mouse mammary samples 31 and in human bone marrow aspirates.26,31 Given the effectiveness of TrueBlack in these studies we also evaluated its ability to reduce autofluorescence from BMCB samples. Comparatively, TrueBlack effectively removed the intrinsic autofluorescence observed in the red and green channels with BMCB sections, however, the non-specific background fluorescence we observed in the far red channel could not be blocked by TrueBlack or any other autofluorescence quencher we examined. Consequently, our studies with BMCBs were limited to using antibodies that fluoresce in the blue, red and green channels only.
Multiplex IF or the visualization of two or more epitopes in the same tissue section as discussed above, can be achieved using a fluorescence microscope able to spectrally resolve five different fluorochromes. 18 However, in order to perform effective multiplex IF experiments it is essential to ensure that all channels are free from non-specific background staining and that primary antibodies from different species are available in order to avoid cross-reactivity. 24 If needed, however, staining can be performed using antibodies raised in the same species if both staining and imaging are done sequentially. In order to perform multiple sequential stains using antibodies raised in the same species one of the following methodologies is typically used: 1) antibody access is blocked with each round of staining; 2) conjugated fluorochromes are inactivated; or 3) antibodies are physically removed from the tissue. 17 Each of these strategies possesses various limitations that can include but are not limited to the high cost of conjugating primary antibodies, the high cost of automated staining and imaging equipment, potential steric hindrance issues, highly repetitive tasks and the alteration of tissue integrity.12,17 Based on our needs and available equipment we investigated the ability to perform manual sequential IF by physical removal of antibodies from BMCB samples between stainings.
Several methods for physically removing antibodies from FFPE tissue have been published and typically involve the use of heat in combination with buffers that vary in ionic strength.19,32–34 The ability of these methodologies to effectively remove both primary and secondary antibodies has been wide-ranging. More specifically, Gendusa et al. 19 demonstrated that some antibodies could not be removed with the use of glycine pH2 or 6M urea hot buffers. The authors concluded that some antibodies are able to remain bound even under harsh conditions and that removal is ultimately dependent upon antibody affinity. Gendusa et al. also tested a stripping buffer containing 2-ME and also found it to be superior in antibody removal due to the fact that 2-ME irrevocably alters antibody structure. Similarly, Bolognesi et al. 17 reported that both primary and secondary antibodies could be successfully removed from FFPE tonsillar tissue using heat and a solution containing the detergent SDS and the reducing agent 2-mercaptoethanol (2-ME). Notably, this process was found to have little effect on antigenicity or tissue integrity even following 10 antibody removal cycles. Similarly, when employing this method we also found that 2-ME/SDS stripping buffer effectively removed both primary and secondary antibodies from FFPE BMCB sections with little effect on tissue antigenicity or integrity. Additionally, our findings demonstrated that this methodology also removed fluorochrome-conjugated anti-immunoglobulin (Ig) LC antibodies which bind to heavily present Ig LC epitopes found in clonal MGUS, SMM and MM plasma cells. Bolognesi et al. 17 also tested the sensitivity of 9 different antibodies following 10 stripping/reprobing cycles and found that subsequent stainings were within 10% above or below the value of the original staining. Likewise we also found that staining of CD4 and CD8 was similar in BMCB following several rounds of stripping/reprobing cycles. However, caution should be taken when performing multiple cycles of stripping and reprobing as the sensitivity of different antigens to this process can differ and should be tested individually. Bolognesi et al. 17 likened the process of antibody stripping and restaining of FFPE tissue sections to antibody stripping and reprobing of Western immunoblots and described how the reducing agent 2-ME shifts the thermodynamic equilibrium of antibody disulfide bonds to the unbound form while SDS aids in dissociating the antibody heavy chains. 17 The authors concluded that these two components in combination allow the bond between antibody and antigen to be overcome, which subsequently allows for multiple rounds of staining, stripping and restaining.
MM is a clinically, cytogenetically and molecularly heterogeneous disease. 35 Given the recent focus on investigating the role of the BM microenvironment, visualization of the BM immune contexture may provide valuable information regarding the mechanisms underlying MGUS to MM progression and MM patient prognosis. Heterogeneous immune contextures are also likely to be observed in bone marrow and this possibility is underscored by our data demonstrating proof of principle multiflex IF to analyze archival BM biopsies. In this regard, the two ROIs highlighted in Fig. 6 both contain a significant number of lambda LC expressing PCs, however, the immune contextures of the two ROI vary considerably. Moreover, preliminary nearest neighbor spatial analysis of ROIs obtained from three individual patients (a MGUS, a SMM and a MM) demonstrated that CD8 cells were found to be closest to the malignant PCs in the MM patient. Of interest, these data may lend support to previous reports of CD8+ T cells in MM patients being dysfunctional. In this regard, Zelle-Rieser et al. 36 found that CD8+ T cells in MM patients expressed a number of markers associated with T cell exhaustion, which can arise following chronic antigen exposure. Exhausted CD8+ T cells are known to possess diminished proliferative capacity and impaired cytotoxicity functionality, both of which are factors that can contribute to tumor immune evasion. 36 However, this analysis is extremely preliminary and additional ROIs and analysis of a large cohort of patients would be required for a thorough analysis with statistical meaning.
In conclusion, our study demonstrates for the first time that sequential multiplex IF via antibody removal and spatial analysis of FFPE BMCB sections is a feasible and cost-effective methodology that will permit an analysis of correlations between the number and presence of various infiltrating immune cells and location relative to abnormal plasma cells across the disease spectrum of MGUS to SMM to MM.
Supplemental Material
2019-00115R1_Production_Supplemental_Data_online_supp – Supplemental material for Multiplex Immunofluorescence of Bone Marrow Core Biopsies: Visualizing the Bone Marrow Immune Contexture
Supplemental material, 2019-00115R1_Production_Supplemental_Data_online_supp for Multiplex Immunofluorescence of Bone Marrow Core Biopsies: Visualizing the Bone Marrow Immune Contexture by Denise K. Walters and Diane F. Jelinek in Journal of Histochemistry & Cytochemistry
Footnotes
Competing Interests
The author(s) declared no potential conflicts of interest with respect to the research, authorship, and/or publication of this article.
Author Contributions
DKW designed and performed research, analyzed data, and wrote the manuscript. DFJ designed research, wrote and approved the manuscript.
Funding
The author(s) disclosed receipt of the following financial support for the research, authorship, and/or publication of this article: This work was supported by the National Institutes of Health (grant CA196831 awarded to DFJ).
References
Supplementary Material
Please find the following supplemental material available below.
For Open Access articles published under a Creative Commons License, all supplemental material carries the same license as the article it is associated with.
For non-Open Access articles published, all supplemental material carries a non-exclusive license, and permission requests for re-use of supplemental material or any part of supplemental material shall be sent directly to the copyright owner as specified in the copyright notice associated with the article.