
Abstract
There is an important need in immuno-oncology to develop reliable immunohistochemistry (IHC) to assess the expression of CTLA-4+ tumor-infiltrating lymphocytes in human cancers and quantify them with image analysis (IA). We used commercial polyclonal and monoclonal antibodies and characterized three chromogenic cytotoxic T-lymphocyte-associated protein 4 (CTLA-4) assays with suitable specificity and sensitivity for use in formalin-fixed, paraffin-embedded (FFPE) tissues. We found variable numbers of CTLA-4+ lymphocytes in multiple types of cancer and secondary lymphoid organs (SLOs) and other normal human tissues. Combining CTLA-4 with CD3, CD4, or CD8 by immunofluorescence showed that CTLA-4+ lymphocytes in SLOs and tumors were typically CD3+ and CD4+, but not CD8+. Individual lymphocytes expressed CTLA-4 either as primarily granular cytoplasmic staining or as excentric globular deposits. The CTLA-4/FoxP3 (forkhead box P3 protein) duplex IHC demonstrated that CTLA-4+/FoxP3− lymphocytes predominated in the germinal centers of SLOs and tumor tertiary lymphoid structures (TLSs), whereas CTLA-4+/FoxP3+ lymphocytes populated the T-cell zone of SLOs and TLSs, plus tumor stroma. IA scoring was highly comparable with pathologist scoring for CTLA-4 and CTLA-4/FoxP3 assays and a FoxP3 single IHC. Our findings show that CTLA-4 IHC can be used to reliably label lymphocytes in FFPE human tissues, making it possible to investigate the role of CTLA-4 in the tumor microenvironment.
Introduction
Immunotherapy has proven to be an effective means to treat some cancers, as evidenced by the approval of multiple new drugs in the last decade.1,2 In particular, several immunotherapies that target the immunoregulatory pathways cytotoxic T-lymphocyte-associated protein 4 (CTLA-4) and programmed cell death protein 1 (PD-1) and its ligand (PD-L1) are now approved to treat several common forms of solid human cancers. Despite the success of CTLA-4 and PD-1/PD-L1 antibodies, however, it remains the case that such immunotherapies fail to elicit a response in many patients. Thus, there is a clear need to continue to investigate the immune response to cancer and to explore in new ways how various cellular and molecular factors might affect the immune response in different manifestations of the disease. Especially needed are ways to better predict patient response to therapy, particularly by using markers of clinical response to CTLA-4 immunotherapy.
CTLA-4 (also known as cluster of differentiation 152) is an immunoglobulin superfamily protein receptor that is expressed on a fraction of lymphocytes and serves as one of the so-called immune checkpoint proteins. CTLA-4 is structurally homologous to cluster of differentiation 28 (CD28) and somewhat more distantly to PD-1. 3 Its biology has been studied in some detail, predating and succeeding the approval of the CTLA-4 therapeutic antibody ipilimumab for the treatment of melanoma.1,2,4–12 For example, CTLA-4 has been shown to play a strong and non-redundant inhibitory role in directly controlling T-lymphocyte responses, as well as in indirectly affecting B-cell responses. It is expressed in conventional T-lymphocytes upon activation via T-cell receptor and CD28 signaling and is also constitutively expressed in both natural and follicular regulatory T-cells (Tregs). 13 In addition to its expression on a majority of Tregs, CTLA-4 is reportedly expressed in a fraction of conventional CD4-expressing (CD4+) and CD8+ lymphocytes in tumors of patients with head and neck cancers. 14 In resting cells, CTLA-4 predominates in cytoplasmic vesicles, whereas activation via strong T-cell receptor stimulation increases cycling from endosomes to the cell membrane, where it forms microclusters.2,4,5,15,16 CTLA-4 controls the priming and activation of T-cells through interactions with antigen-presenting cells. This involves both binding to CD80 and CD86 with affinities greater than for CD28 and the removal of these two ligands from antigen-presenting cells in a process known as transendocytosis.7,9,12,17
Recent studies have questioned the mechanism of action of CTLA-4-directed therapeutic antibodies. Some reports support the original notion that they block CTLA-4 and thus its biological action.8,18 Others instead suggest that such antibodies deplete tumoral Tregs,19–22 in particular CTLA-4+ lymphocytes that also express the forkhead box P3 protein (FoxP3) (CTLA-4+/FoxP3+), but not lymphocytes that do not express FoxP3 (CTLA-4+/FoxP3−). 20 Accordingly, the importance of CTLA-4 expression in tumoral T-lymphocytes has taken on greater potential significance and warrants further study.
Because CTLA-4 expression in the tumor microenvironment might be meaningful, a better understanding of the prevalence and distribution of tumor-infiltrating lymphocytes (TILs) that express CTLA-4 is needed. Numerous preclinical and clinical studies have used immunohistochemistry (IHC) to investigate a variety of cell types and immune markers in tumor tissues that are relevant to the immune response to cancer. CTLA-4 has not been one of these markers, however. This may be due to the lack of importance previously ascribed to tumoral CTLA-4, as well as the lack of available antibodies considered suitable for IHC in formalin-fixed, paraffin-embedded (FFPE) human tissues. The primary objective of this study was therefore to develop and qualify the performance characteristics of an IHC assay that can be used to demonstrate the cellular and tissue expression patterns of CTLA-4 in FFPE tissue from human cancers. Another key objective was the development and validation of digital image analysis (IA) algorithms to quantify CTLA-4 expression in tumor tissues.
Here, we describe multiple IHC assays that label CTLA-4 lymphocytes in FFPE human tissues, along with related IA methods that we have begun to use to profile multiple human cancer indications. These methods should allow others to similarly profile human tumors to better understand the role of CTLA-4 in the immune response to cancer and to explore potential markers of clinical response to CTLA-4 therapeutic antibodies.
Materials and Methods
Study Design
This study consisted of two main parts. The first part involved our development and validation of three chromogenic CTLA-4 IHC assays for use in FFPE human tissue. To qualify the performance characteristics of the IHC assay, we used a combination of FFPE human tissues and relevant in vitro–processed cell pellets made into FFPE blocks to microscopically assess the specificity and relative sensitivities of the IHC assays. We also present limited findings with the use of immunofluorescence (IF) to combine CTLA-4 individually with CD3, CD4, and CD8 and validated similarly. The second major part of the study comprised our testing and validation of IA solutions for quantitative digital analyses of CTLA-4 in cancer tissues. This included microscopic inspection of IA results and their statistical comparisons with pathologist assessment on a cell-by-cell basis.
Aspects of both parts of the study were performed on commercially obtained tissues and tumors from patients with non-small-cell lung carcinoma (NSCLC) enrolled in a phase 1/2 clinical trial investigating the PD-L1 antibody therapy durvalumab (ClinicalTrials.gov study NCT01693562). Throughout this work, we discovered characteristics of CTLA-4 expression in human tumor and secondary lymphoid organs (SLOs) that could be useful to others studying CTLA-4. Therefore, we present some features of our microscopic profiling relevant in this regard. Finally, we also present the IA results for our FoxP3 single IHC assay to accompany those of the CTLA-4 polyclonal antibody (PC) assay and the CTLA-4/FoxP3 duplex assay. This makes sense to us because of the close biological relationship between CTLA-4 and FoxP3 in Tregs.
IHC Assay Development and Performance Qualification
The three CTLA-4 IHC assays (Table 1) were developed and validated to a degree that supports their use for profiling CTLA-4 in human FFPE tissues. Combined, these assays represent our laboratory’s advancement of CTLA-4 IHC assay conditions over several years, together with the evolution of our understanding of the possible role of CTLA-4 in the immune response to cancer and its relationships with other relevant lymphocyte markers. The technical progress itself was based on our identification and testing, over time, of commercially available antibodies as well as IHC staining platforms and specific assay reagents that affect assay performance. We initially developed a PC assay with suitable specificity and other IHC performance characteristics. This assay was applied to numerous samples of multiple types of cancer, alongside other immune markers that include FoxP3. This work formed the basis for the IA development and validation described later.
CTLA-4 IHC and IF Assays.
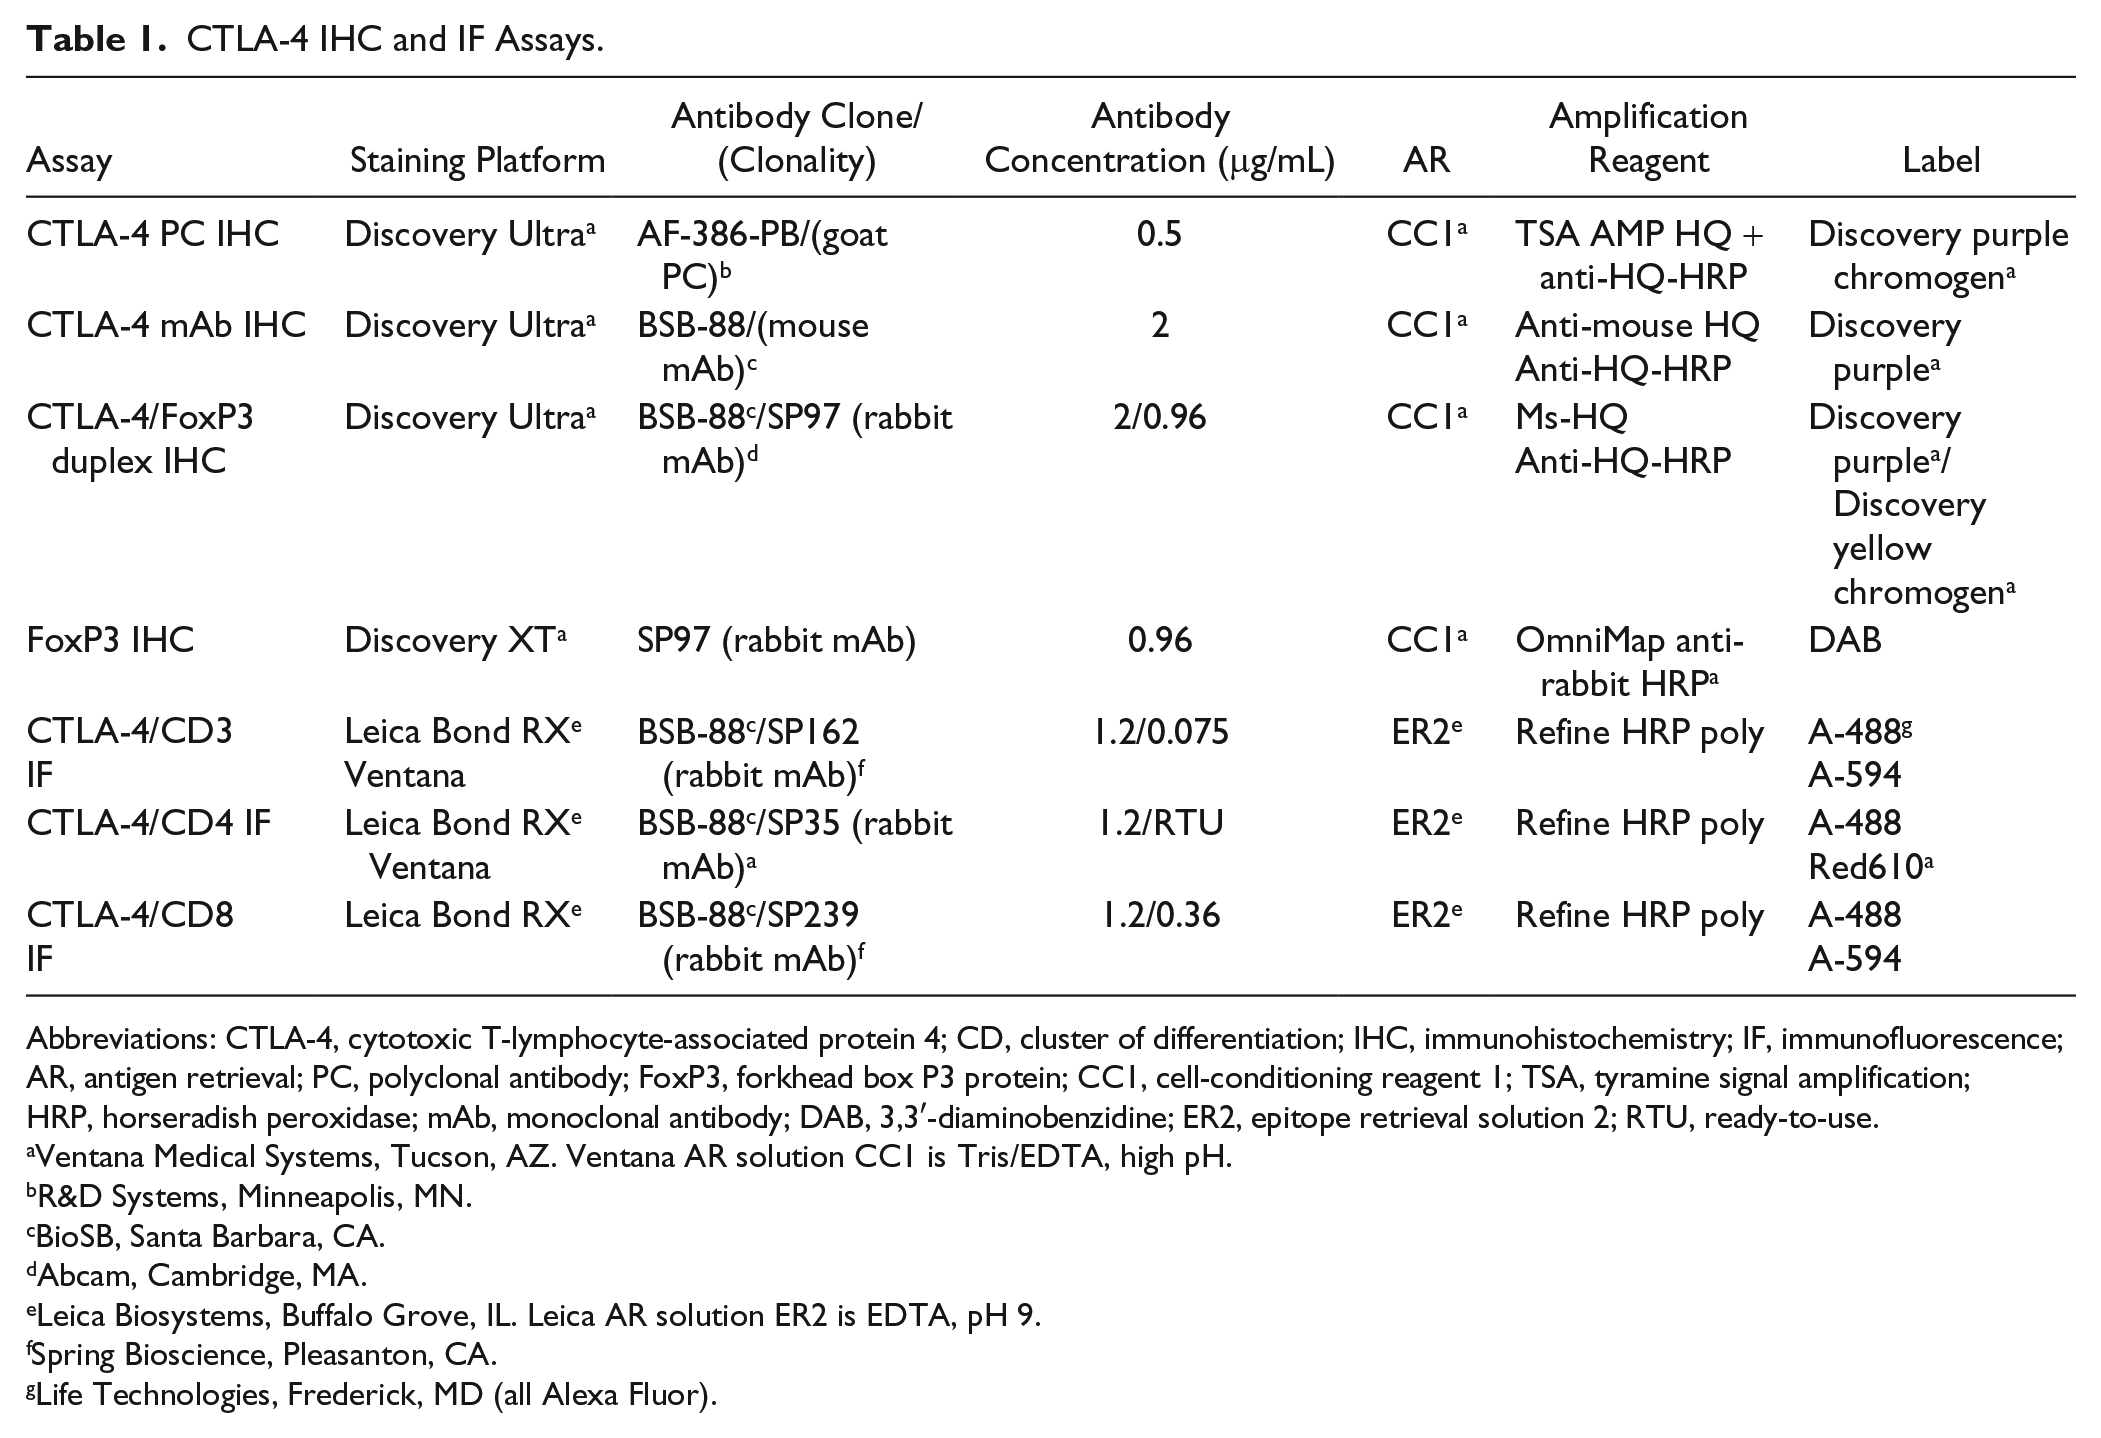
Abbreviations: CTLA-4, cytotoxic T-lymphocyte-associated protein 4; CD, cluster of differentiation; IHC, immunohistochemistry; IF, immunofluorescence; AR, antigen retrieval; PC, polyclonal antibody; FoxP3, forkhead box P3 protein; CC1, cell-conditioning reagent 1; TSA, tyramine signal amplification; HRP, horseradish peroxidase; mAb, monoclonal antibody; DAB, 3,3′-diaminobenzidine; ER2, epitope retrieval solution 2; RTU, ready-to-use.
Ventana Medical Systems, Tucson, AZ. Ventana AR solution CC1 is Tris/EDTA, high pH.
R&D Systems, Minneapolis, MN.
BioSB, Santa Barbara, CA.
Abcam, Cambridge, MA.
Leica Biosystems, Buffalo Grove, IL. Leica AR solution ER2 is EDTA, pH 9.
Spring Bioscience, Pleasanton, CA.
Life Technologies, Frederick, MD (all Alexa Fluor).
Recently, a CTLA-4 monoclonal antibody (mAb) became available that provided comparable specificity and greater sensitivity when used with applicable assay reagents (mAb assay). In addition, recognizing the potential value of FoxP3 in conjunction with CTLA-4, we combined the CTLA-4 mAb with FoxP3 in a dual chromogenic assay (duplex assay) that we are currently applying in our laboratory to tumor samples from patients enrolled in multiple immuno-oncology clinical trials. Although the mAb assay is not being actively employed in our laboratory, it is included here for completeness and because others may benefit from its use. Finally, we further combined CTLA-4 with CD3, CD4, and CD8 in an IF format to preliminarily assess the types of T-lymphocytes that express CTLA-4 in selected lymphoid and cancer tissues.
The PC assay used a PC (AF-386-PB; R&D Systems, Minneapolis, MN) directed at recombinant human CTLA-4 applied on a Discovery Ultra staining instrument (Ventana Medical Systems; Tucson, AZ) with purple chromogen (Ventana). Purple chromogen was chosen to avoid IA detection of endogenous tissue pigments, particularly anthracotic pigment in NSCLC, which we previously found to be problematic in the quantification of CTLA-4 expression with 3,3′-diaminobenzidine combined with IA (unpublished data). The mAb assay used a CTLA-4 antibody (clone BSB-88; Bio SB, Santa Barbara, CA) directed at the C-terminus of human CTLA-4, also with the Discovery Ultra platform and purple chromogen. The duplex assay used the CTLA-4 clone BSB-88 combined with purple chromogen and a FoxP3 mAb (clone SP97; Abcam, Cambridge, MA) paired with yellow chromogen (Ventana). Key aspects of all three chromogenic IHC protocols, the FoxP3 IHC assay used to label the tumors included in the IA assessment of FoxP3, and the IF assays are provided in Table 1. Additional details of these assays are provided in Supplementary Material.
All three chromogenic assays were applied to tissue and cell specimens and qualified similarly to assess primarily specificity, meaning CTLA-4 immunolabeling of target cells combined with an absence of labeling of non-target elements. For target cells, CTLA-4-transfected cells, a proportion of activated T-lymphocytes (Supplementary Material), and lymphocytes in tissues where CTLA-4 is either known to be expressed (e.g., SLOs) or expected to be expressed (e.g., some tumors) were considered relevant. For non-target elements, the cell lines known not to express CTLA-4, non-lymphocytic cells, and non-cellular tissue components applied. The tissue specimens used for assay validation included multiple human SLOs, normal and tumor tissue microarrays (TMAs), and numerous individual tumors. Additional details of these samples are described below and provided in Supplementary Material. Cells known to express or not express CTLA-4 (Table 2) were cultured in vitro, pelletized, fixed in formalin, and processed into FFPE blocks. Additional details of this process are provided in Supplementary Material. Four-µm sections of all tissue and pelletized cell blocks were routinely used. The IF assays were validated similarly on applicable cell lines and a few select SLOs and tumor samples.
CTLA-4 Immunolabeling of Positive and Negative Control Cell Lines.
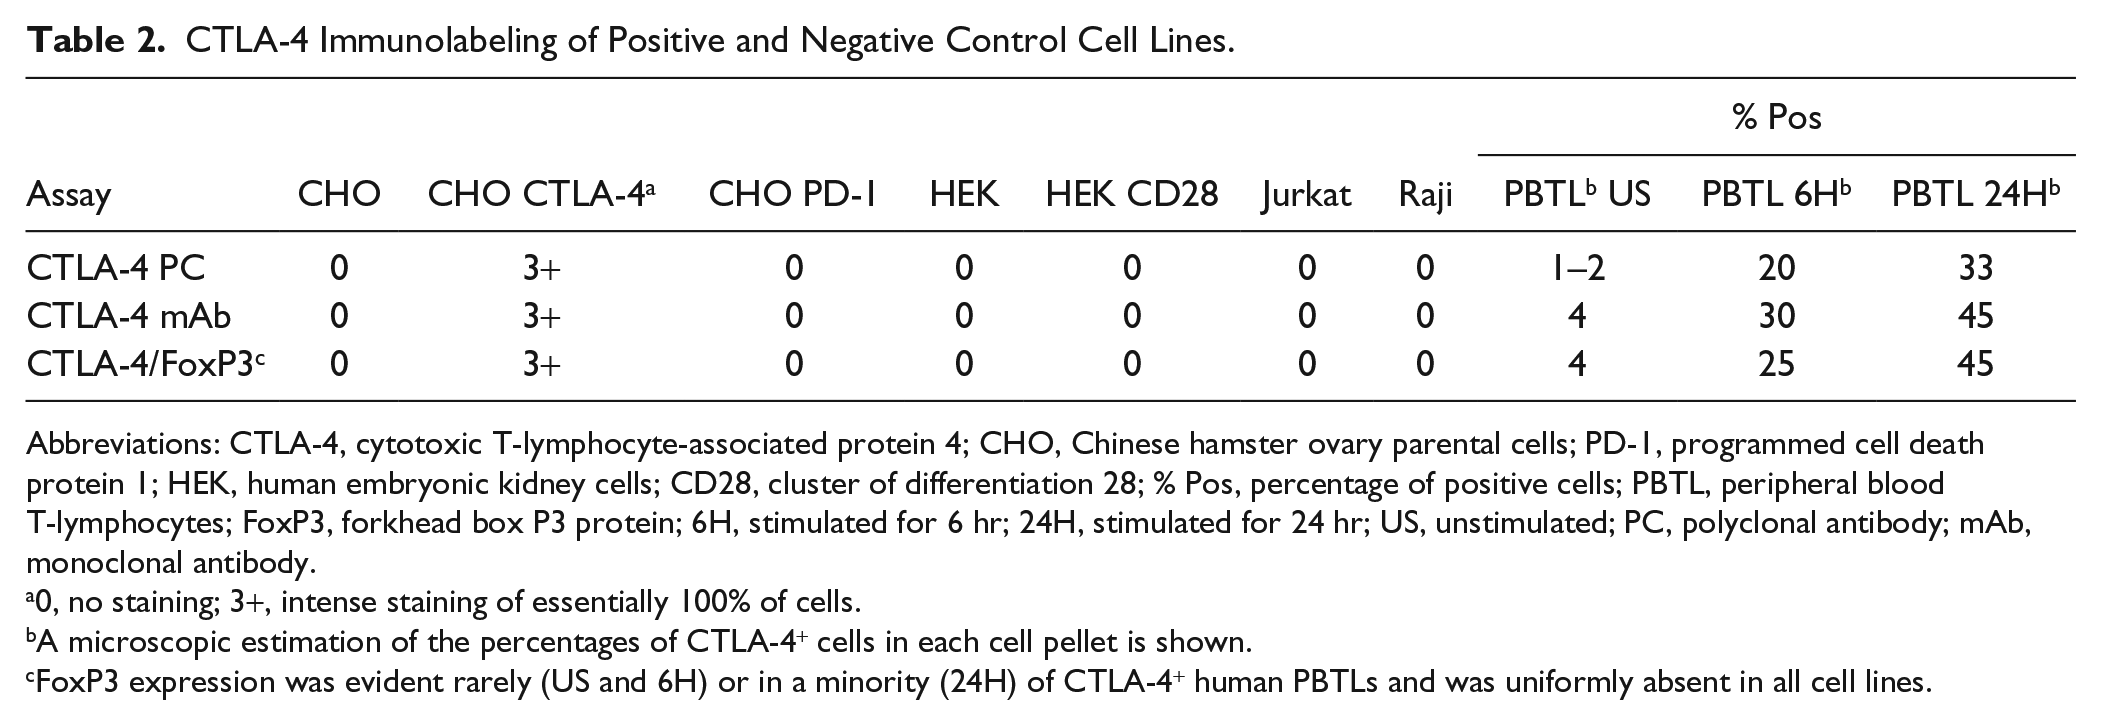
Abbreviations: CTLA-4, cytotoxic T-lymphocyte-associated protein 4; CHO, Chinese hamster ovary parental cells; PD-1, programmed cell death protein 1; HEK, human embryonic kidney cells; CD28, cluster of differentiation 28; % Pos, percentage of positive cells; PBTL, peripheral blood T-lymphocytes; FoxP3, forkhead box P3 protein; 6H, stimulated for 6 hr; 24H, stimulated for 24 hr; US, unstimulated; PC, polyclonal antibody; mAb, monoclonal antibody.
0, no staining; 3+, intense staining of essentially 100% of cells.
A microscopic estimation of the percentages of CTLA-4+ cells in each cell pellet is shown.
FoxP3 expression was evident rarely (US and 6H) or in a minority (24H) of CTLA-4+ human PBTLs and was uniformly absent in all cell lines.
Photomicroscopic images (Figs. 1–7) were prepared using a Nikon Eclipse Ni microscope for chromogenic stains and a Leica SP5 confocal microscope for IF images, except for Fig. 6. All captured microscopic images were saved as TIFF files. For the images shown in Fig. 6, IF-labeled slides were digitally scanned using a Leica Aperio FL digital scanner and a 20× objective. Digital files were opened using Aperio ImageScope software, and then the red channel (representing CD3, CD4, or CD8 in individual duplex stains) was deselected, leaving the green (CTLA-4) and blue (4′,6-diamidino-2-phenylindole) channels open. This was done to demonstrate the specificity of each duplex stain for CTLA-4 alone. Appropriate fields were selected from individual digital images, and these were saved as individual TIFF files using the ImageScope image capture function. All subsequent image production was performed using Adobe Photoshop CS. For Figs. 8 and 9, microscopic images were generated using Definiens software.
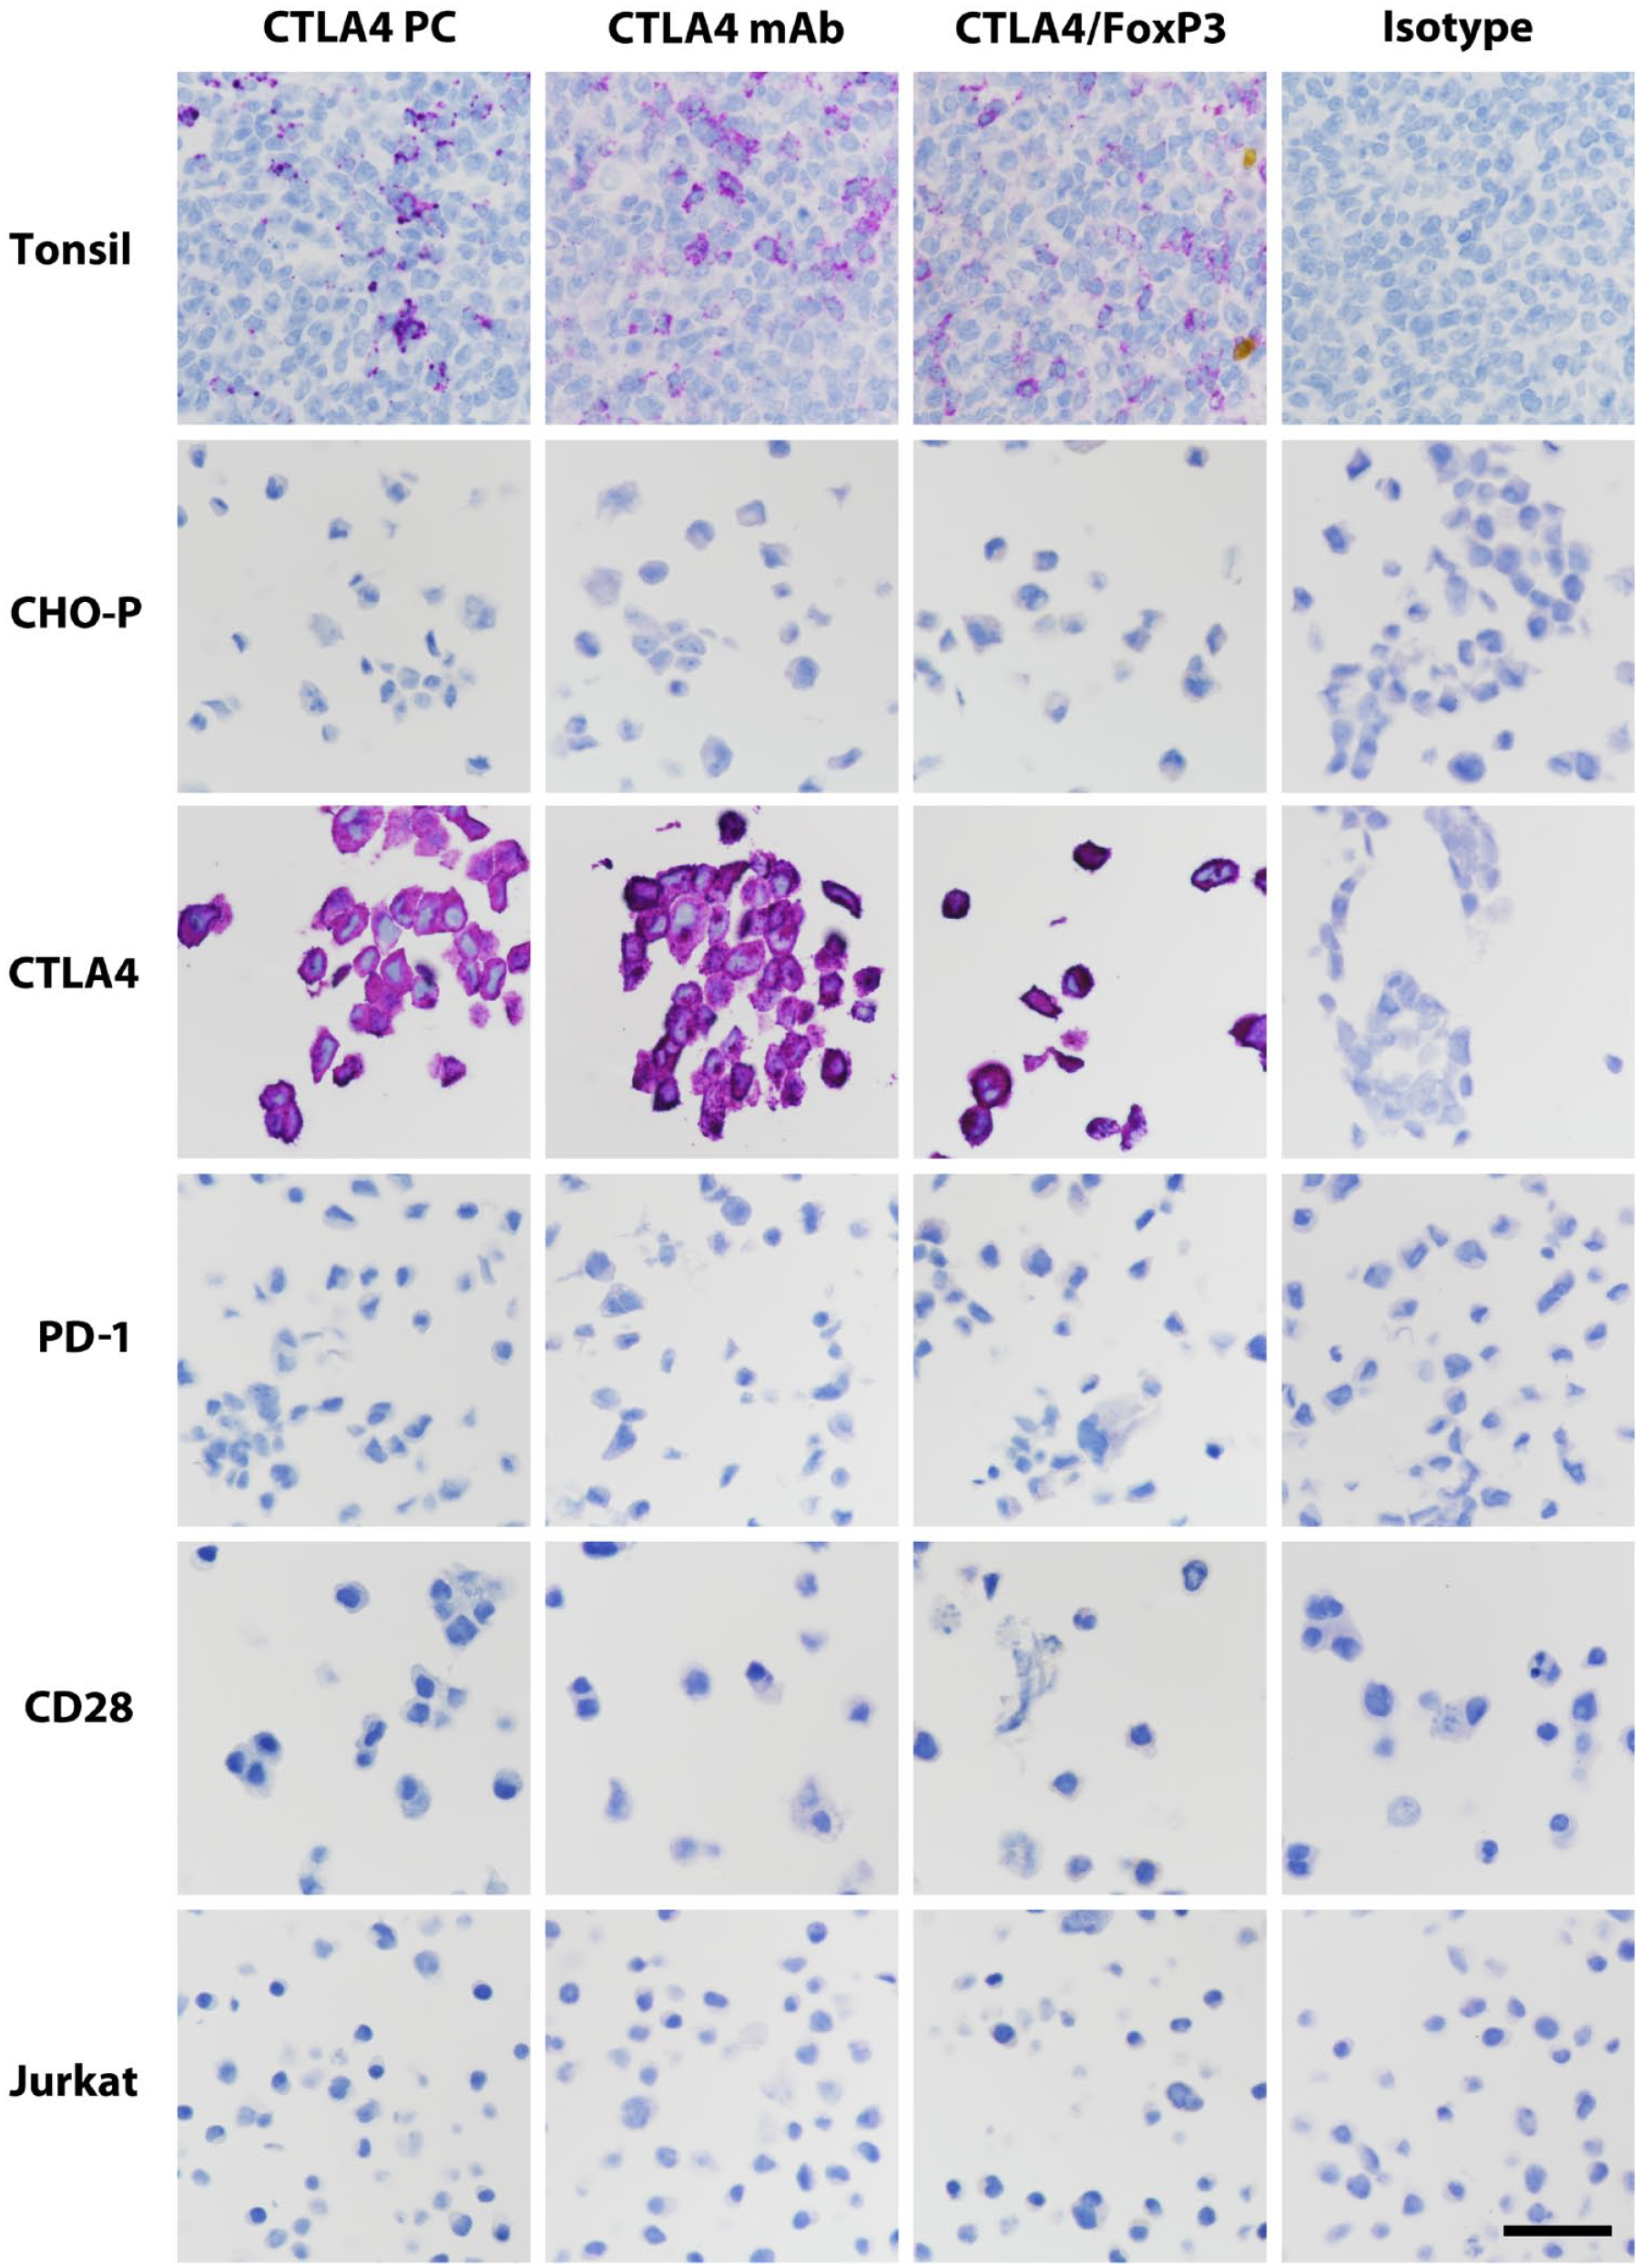
Representative immunolabeling of tonsillar germinal center and pelletized positive and negative cell lines. Scale bar, 60 μm. Abbreviations: CTLA-4, cytotoxic T-lymphocyte-associated protein 4; CHO-P, Chinese hamster ovary parental cells; PD-1, programmed cell death protein 1; CD28, cluster of differentiation 28; FoxP3, forkhead box P3 protein; mAb, monoclonal antibody; PC, polyclonal antibody.
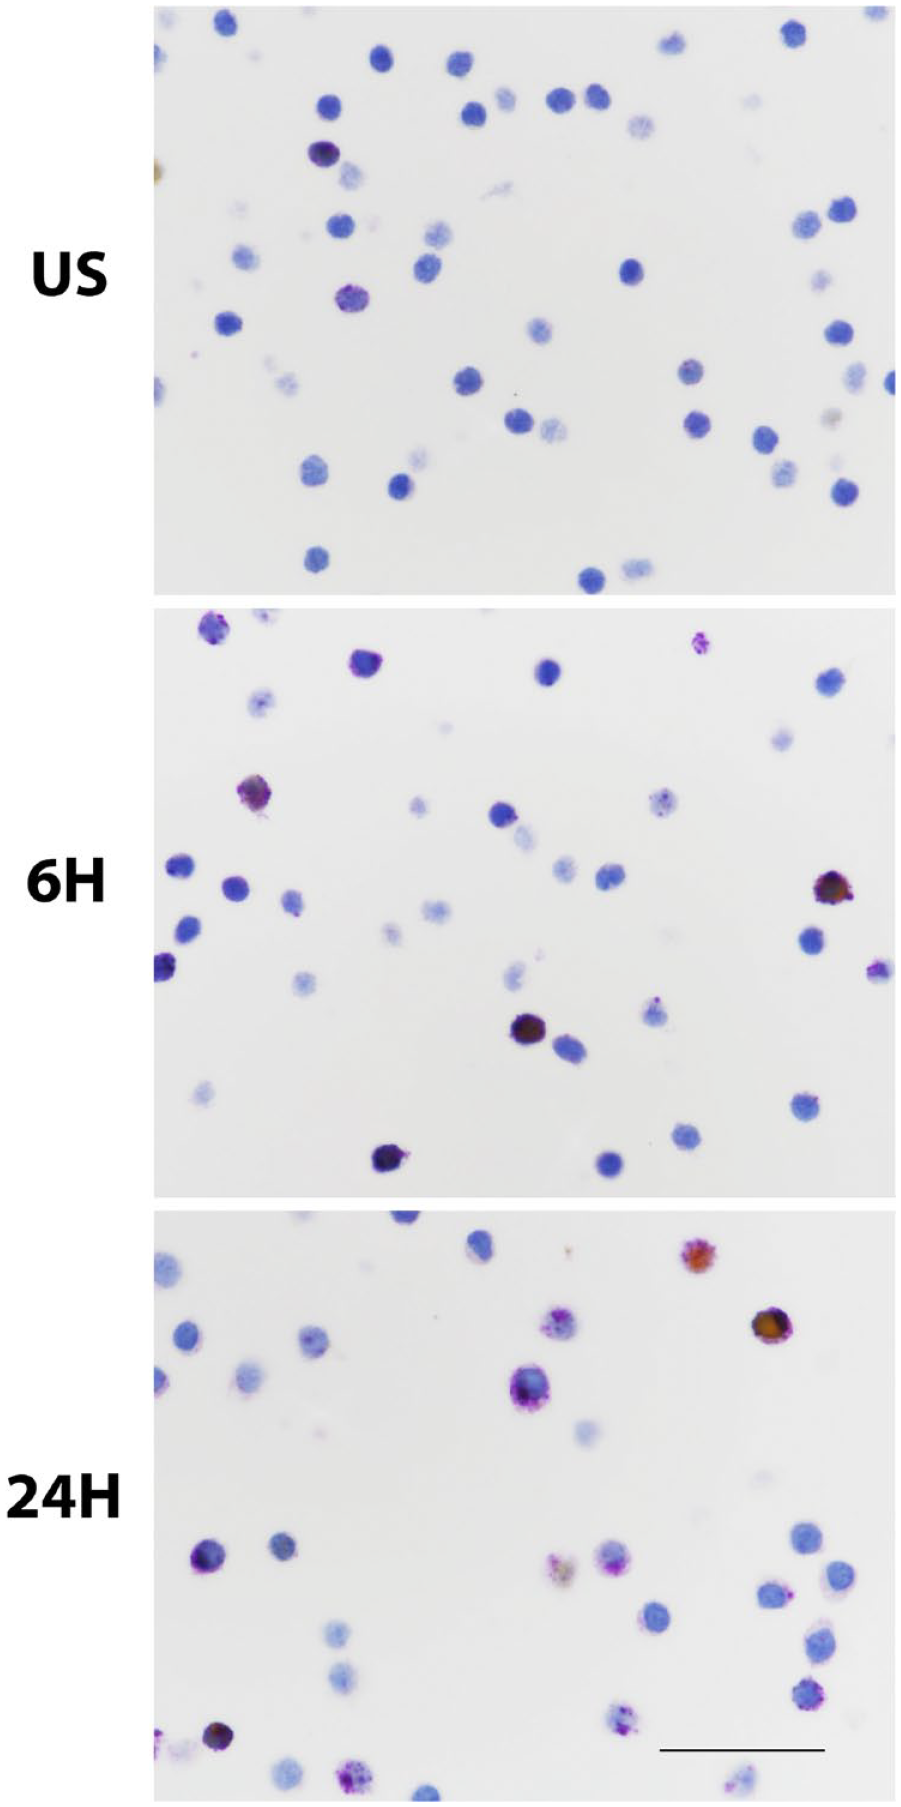
CTLA-4 expression in activated human PBTLs. Unstimulated and PBTL stimulated for 6 or 24 hr with CD3 and CD28 antibodies were immunostained with the CTLA-4 (purple)/FoxP3 (yellow) duplex stain. These images illustrate the more frequent expression of CTLA-4 by stimulated cells, as summarized in Table 2. Note the excentric, often globular nature of CTLA-4 expression evident in some stimulated lymphocytes and the infrequency of FoxP3 coexpression in these in vitro–stimulated lymphocytes. Scale bar, 50 μm. Abbreviations: CTLA-4, cytotoxic T-lymphocyte-associated protein 4; CD, cluster of differentiation; PBTL, peripheral blood T-lymphocytes; FoxP3, forkhead box P3 protein; 6H, stimulated for 6 hr; 24H, stimulated for 24 hr; US, unstimulated.
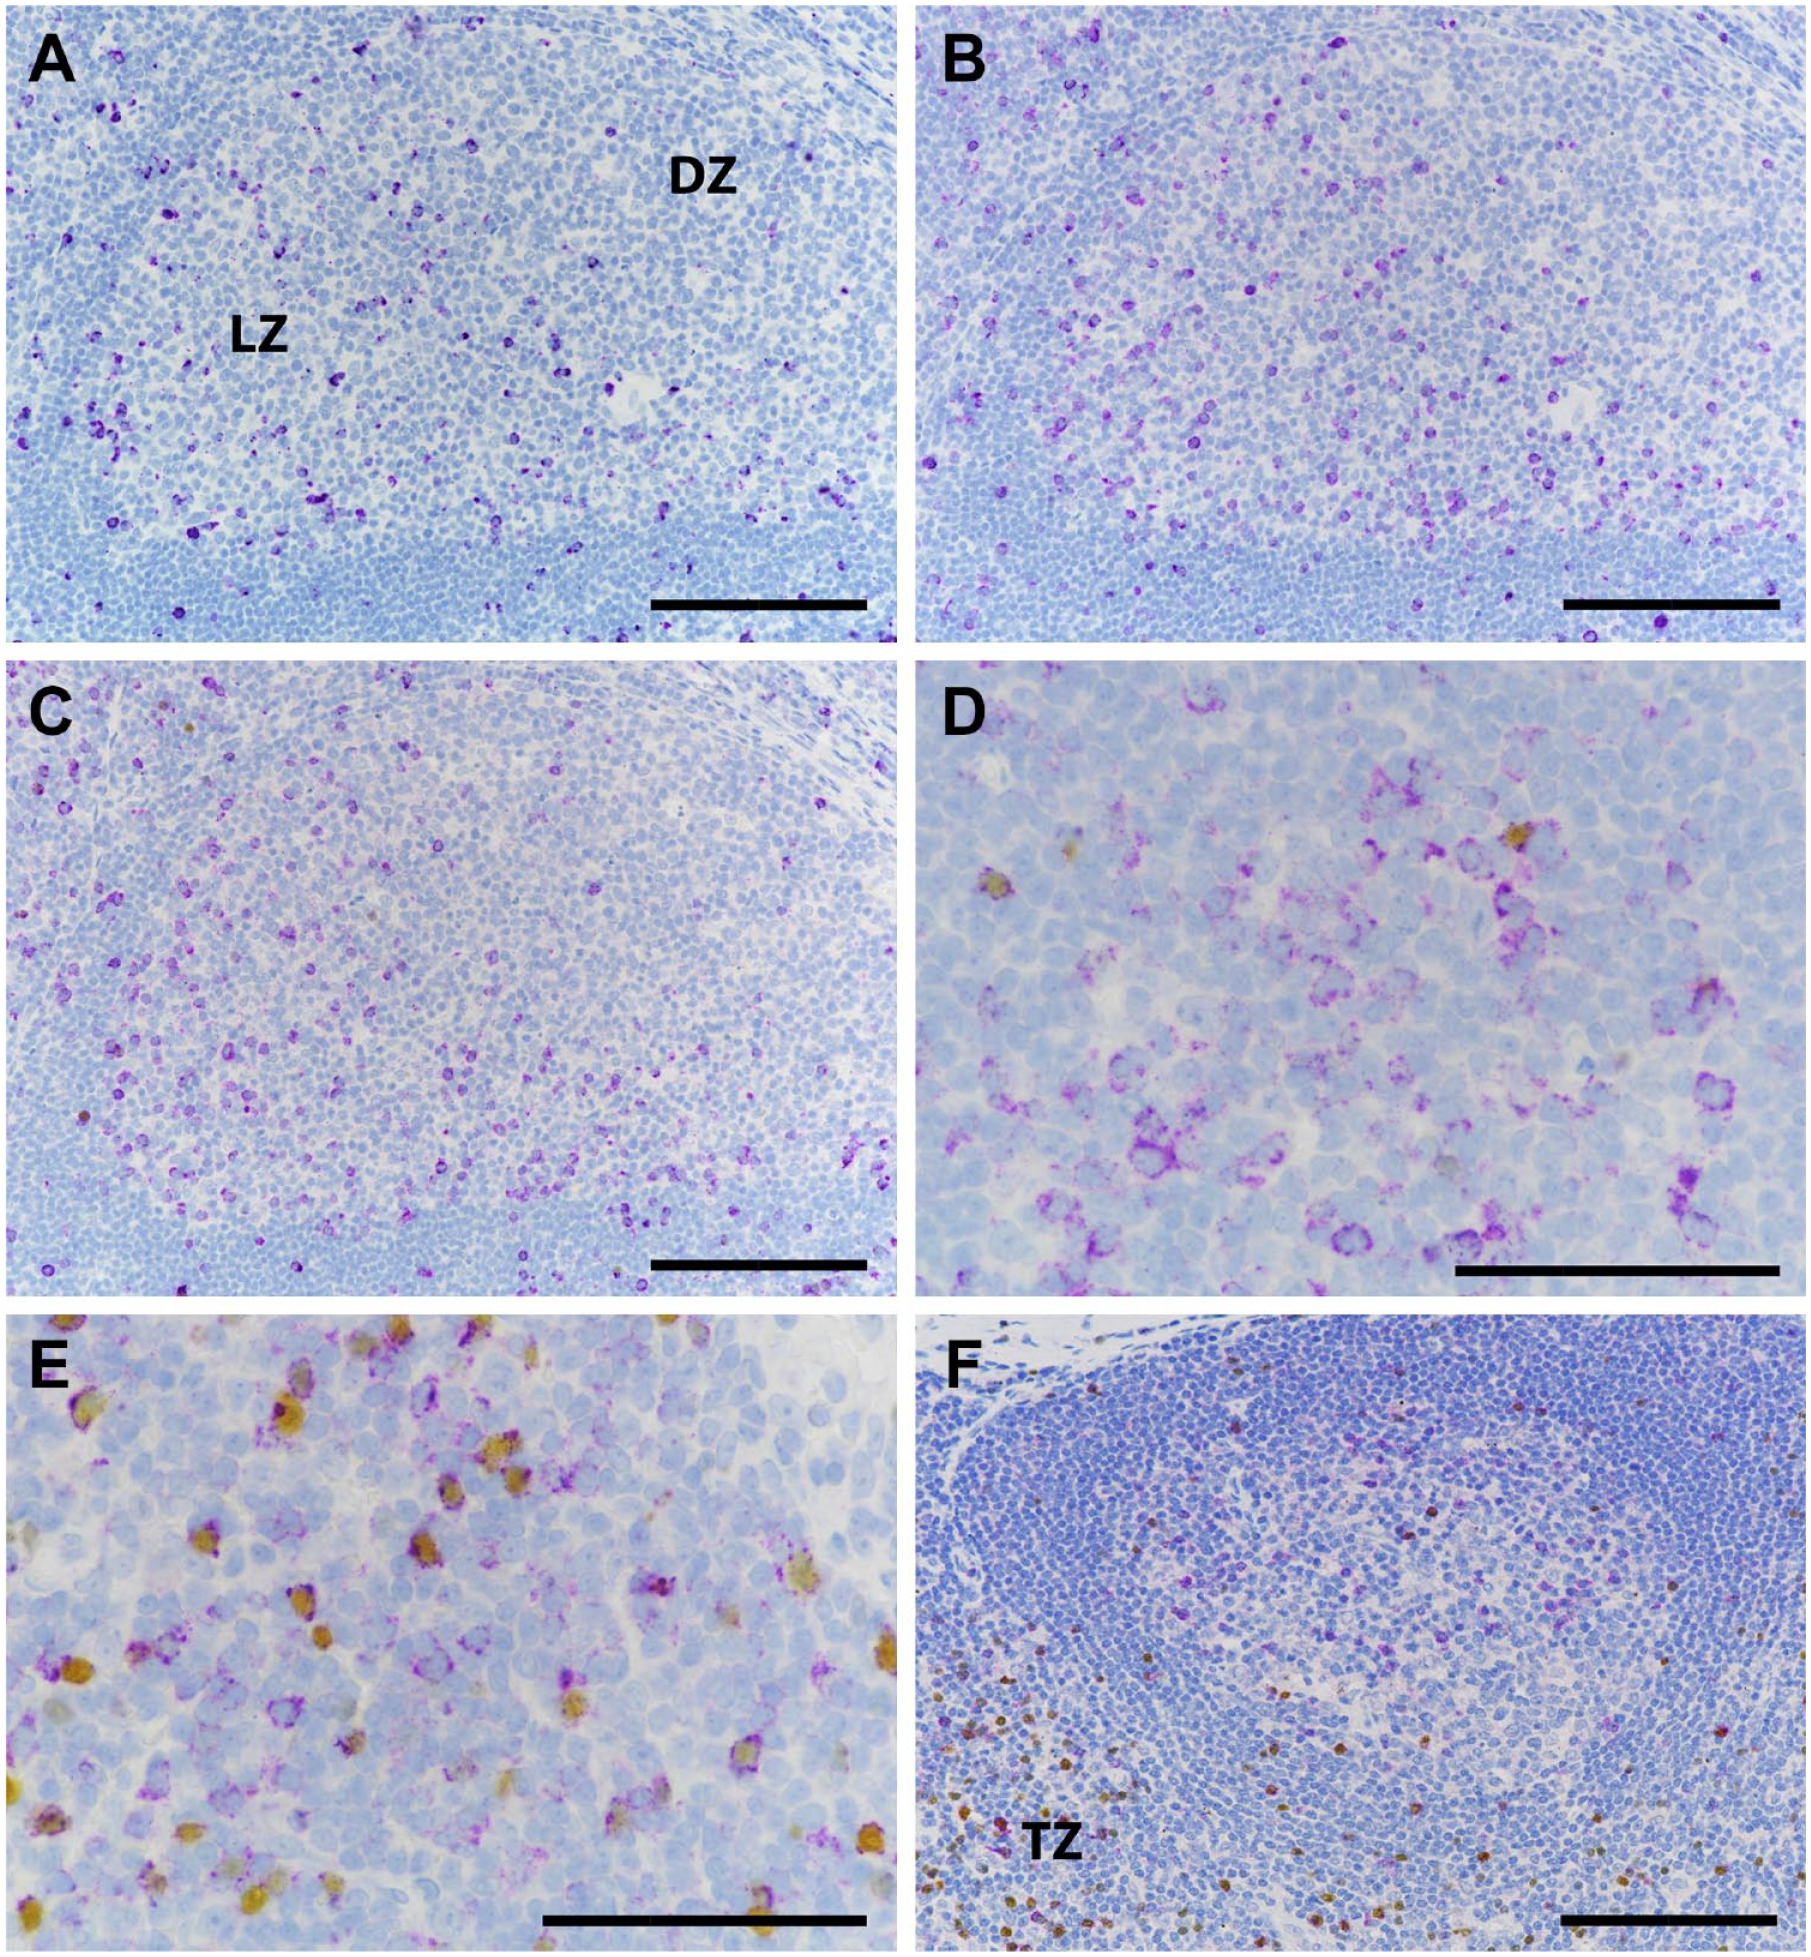
Representative immunolabeling of human tonsil (A–E) and draining lymph node of an NSCLC (F) stained with the CTLA-4 PC assay (A), the CTLA-4 mAb assay (B), and the CTLA-4/FoxP3 duplex assay (C–F). The light zones of germinal centers contain numerous CTLA-4+ lymphocytes (A–D) that do not express FoxP3 (D), whereas in the T-cell zone (E and F), many of the CTLA-4+ cells do express FoxP3. Scale bar, 100 μm. Abbreviations: NSCLC, non-small-cell lung carcinoma; CTLA-4, cytotoxic T-lymphocyte-associated protein 4; FoxP3, forkhead box P3 protein; PC, polyclonal antibody; mAb, monoclonal antibody; DZ, dark zone; LZ, light zone; TZ, T-cell zone.
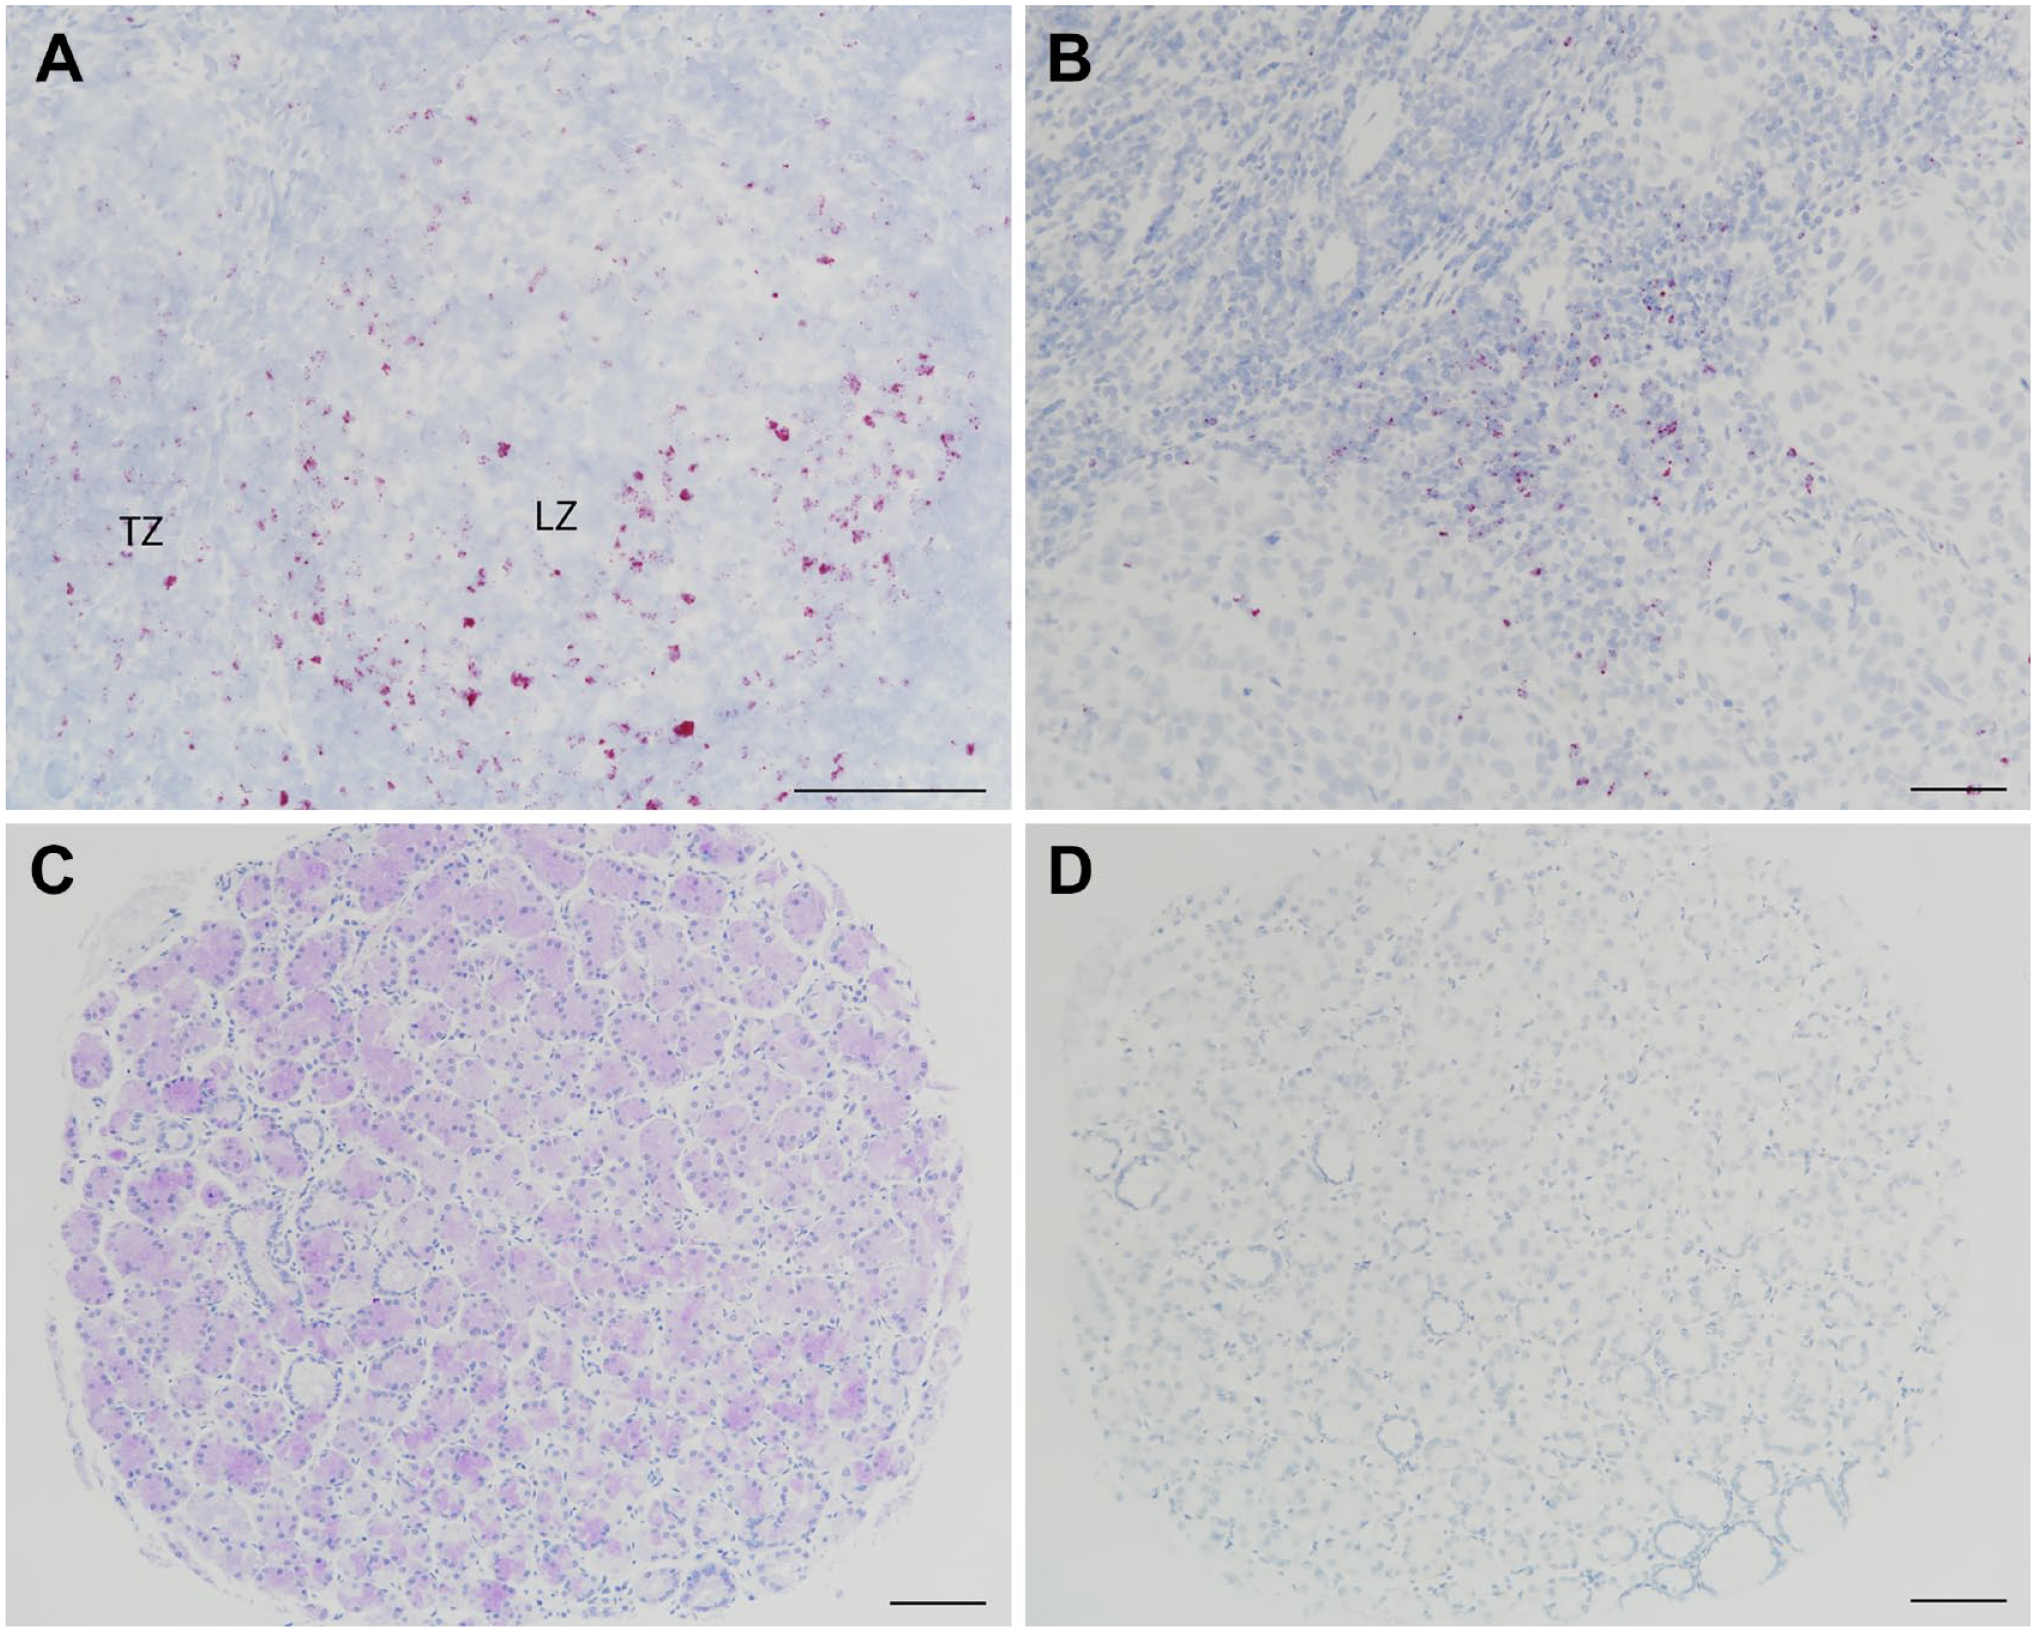
ISH using a CTLA-4 probe labels cells consistent with CTLA-4 IHC, as shown in the germinal center light zone (LZ) and T-cell zone (TZ) of a tonsil specimen (A) and TILs in the invasive margin of a head and neck squamous cell cancer specimen (B). Immunostaining of a TMA core of normal gastric fundic glands with the mAb assay (C) was not accompanied by ISH labeling (D), confirming it as nonspecific. ISH was performed by Ventana automated staining with a probe that recognizes human CTLA-4 (cat. no. 554348; Advanced Cell Diagnostics, Newark, CA). Scale bar, 100 μm. Abbreviations: ISH, in situ hybridization; CTLA-4, cytotoxic T-lymphocyte-associated protein 4; IHC, immunohistochemistry; TIL, tumor-infiltrating lymphocyte; TMA, tumor microarray; mAb, monoclonal antibody.
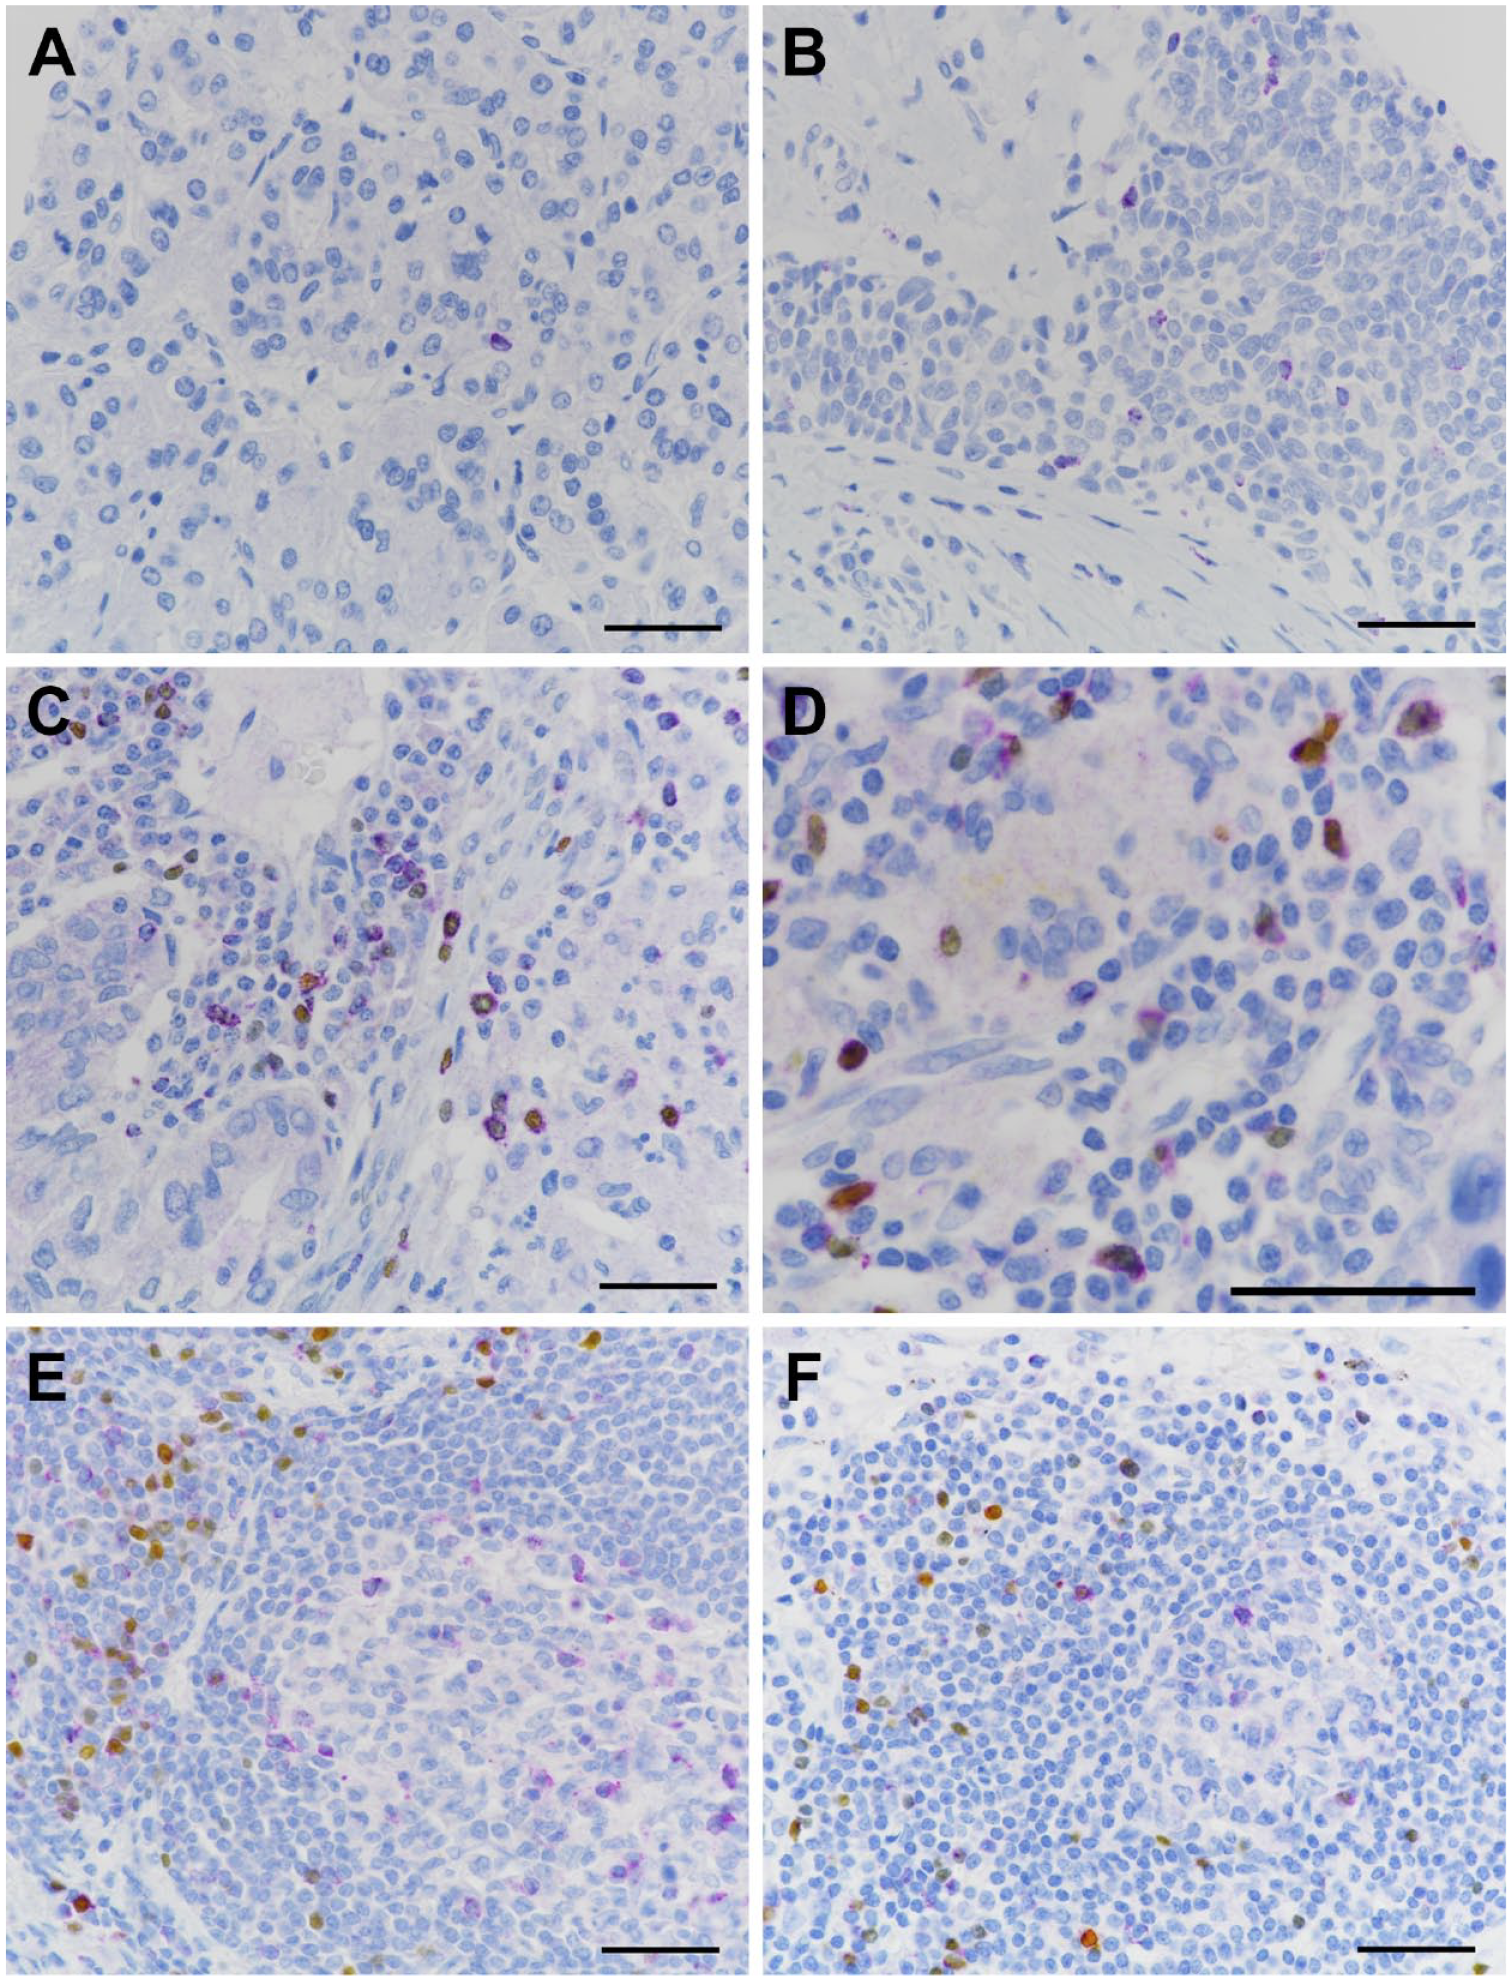
CTLA-4 expression in lymphocytes of human cancers. (A and B) CTLA-4 mAb assay and (C–F) CTLA-4/FoxP3 duplex assay. (A) A single CTLA-4+ TIL in renal cell carcinoma; (B) multiple CTLA-4+ TILs infiltrating a tumor island of head and neck squamous cell carcinoma; (C and D) CTLA-4 single-positive and CTLA-4/FoxP3 double-positive TILs in the stroma of NSCLC samples; (E) NSCLC TLS demonstrating CTLA-4 single-positive lymphocytes in the germinal center and CTLA-4/FoxP3 double-positive and FoxP3 single-positive cells in the T-cell zone; and (F) an apparent incipient TLS in NSCLC with staining features similar to those in panel E. Scale bar, 100 μm. Abbreviations: CTLA-4, cytotoxic T-lymphocyte-associated protein 4; FoxP3, forkhead box P3 protein; mAb, monoclonal antibody; TIL, tumor-infiltrating lymphocyte; NSCLC, non-small-cell lung carcinoma; TLS, tertiary lymphoid structure.
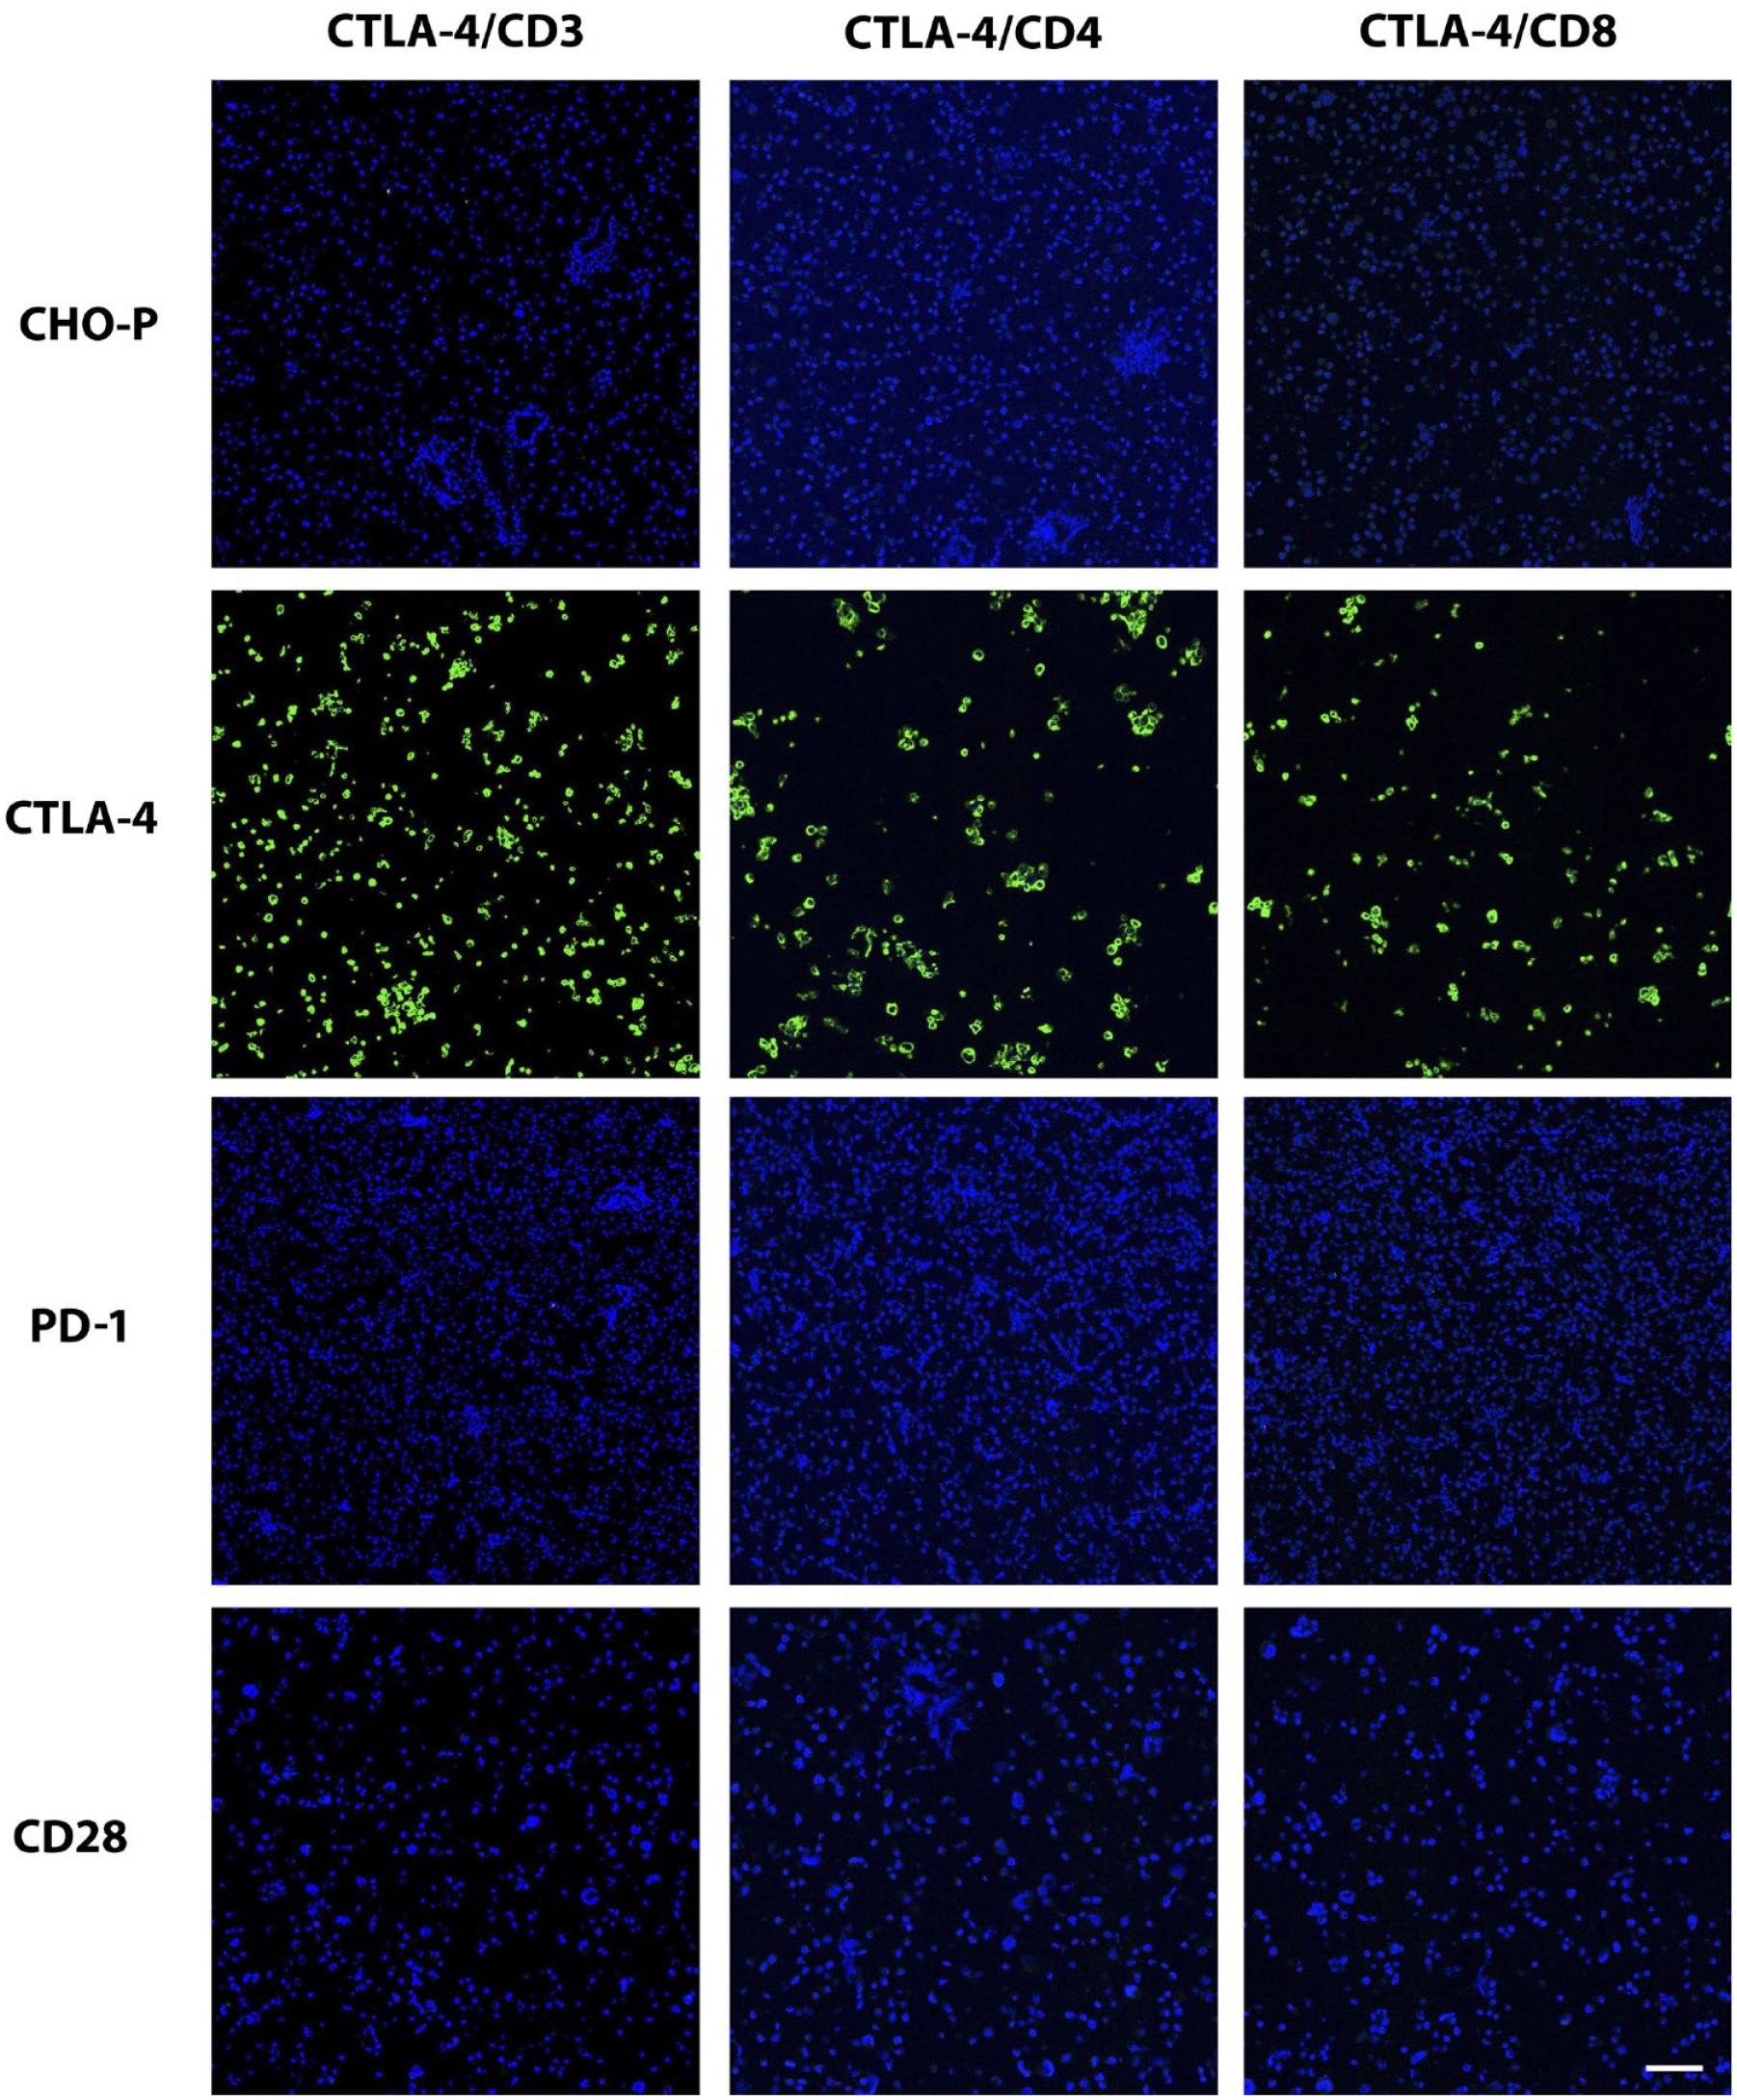
Validation of CTLA-4 immunolabeling of positive and negative control cells and tissues in IF format. The same IF stains (CTLA-4 combined with CD3, CD4, or CD8) shown in Fig. 7 were applied to the positive and negative control cell samples depicted in Fig. 1. In the images here, only the CTLA-4 channel is shown to demonstrate specificity of each duplex stain for the CTLA-4 component. Scale bar, 60 μm. Abbreviation: CTLA-4, cytotoxic T-lymphocyte-associated protein 4; IF, immunofluorescence; PD-1, programmed cell death protein 1; CD, cluster of differentiation; CHO-P, Chinese hamster ovary parental cells.

Coexpression of T-lymphocyte markers in CTLA-4+ cells. IF for CTLA-4 (green) combined with CD3, CD4, or CD8 (red) was applied to sections of tonsil and NSCLC. Note the high frequency of coexpression of CD3 and CD4 compared with the lack of coexpression of CD8 in CTLA-4+ lymphocytes. Scale bar, 50 μm. Abbreviations: CTLA-4, cytotoxic T-lymphocyte-associated protein 4; IF, immunofluorescence; CD, cluster of differentiation; NSCLC, non-small-cell lung carcinoma.
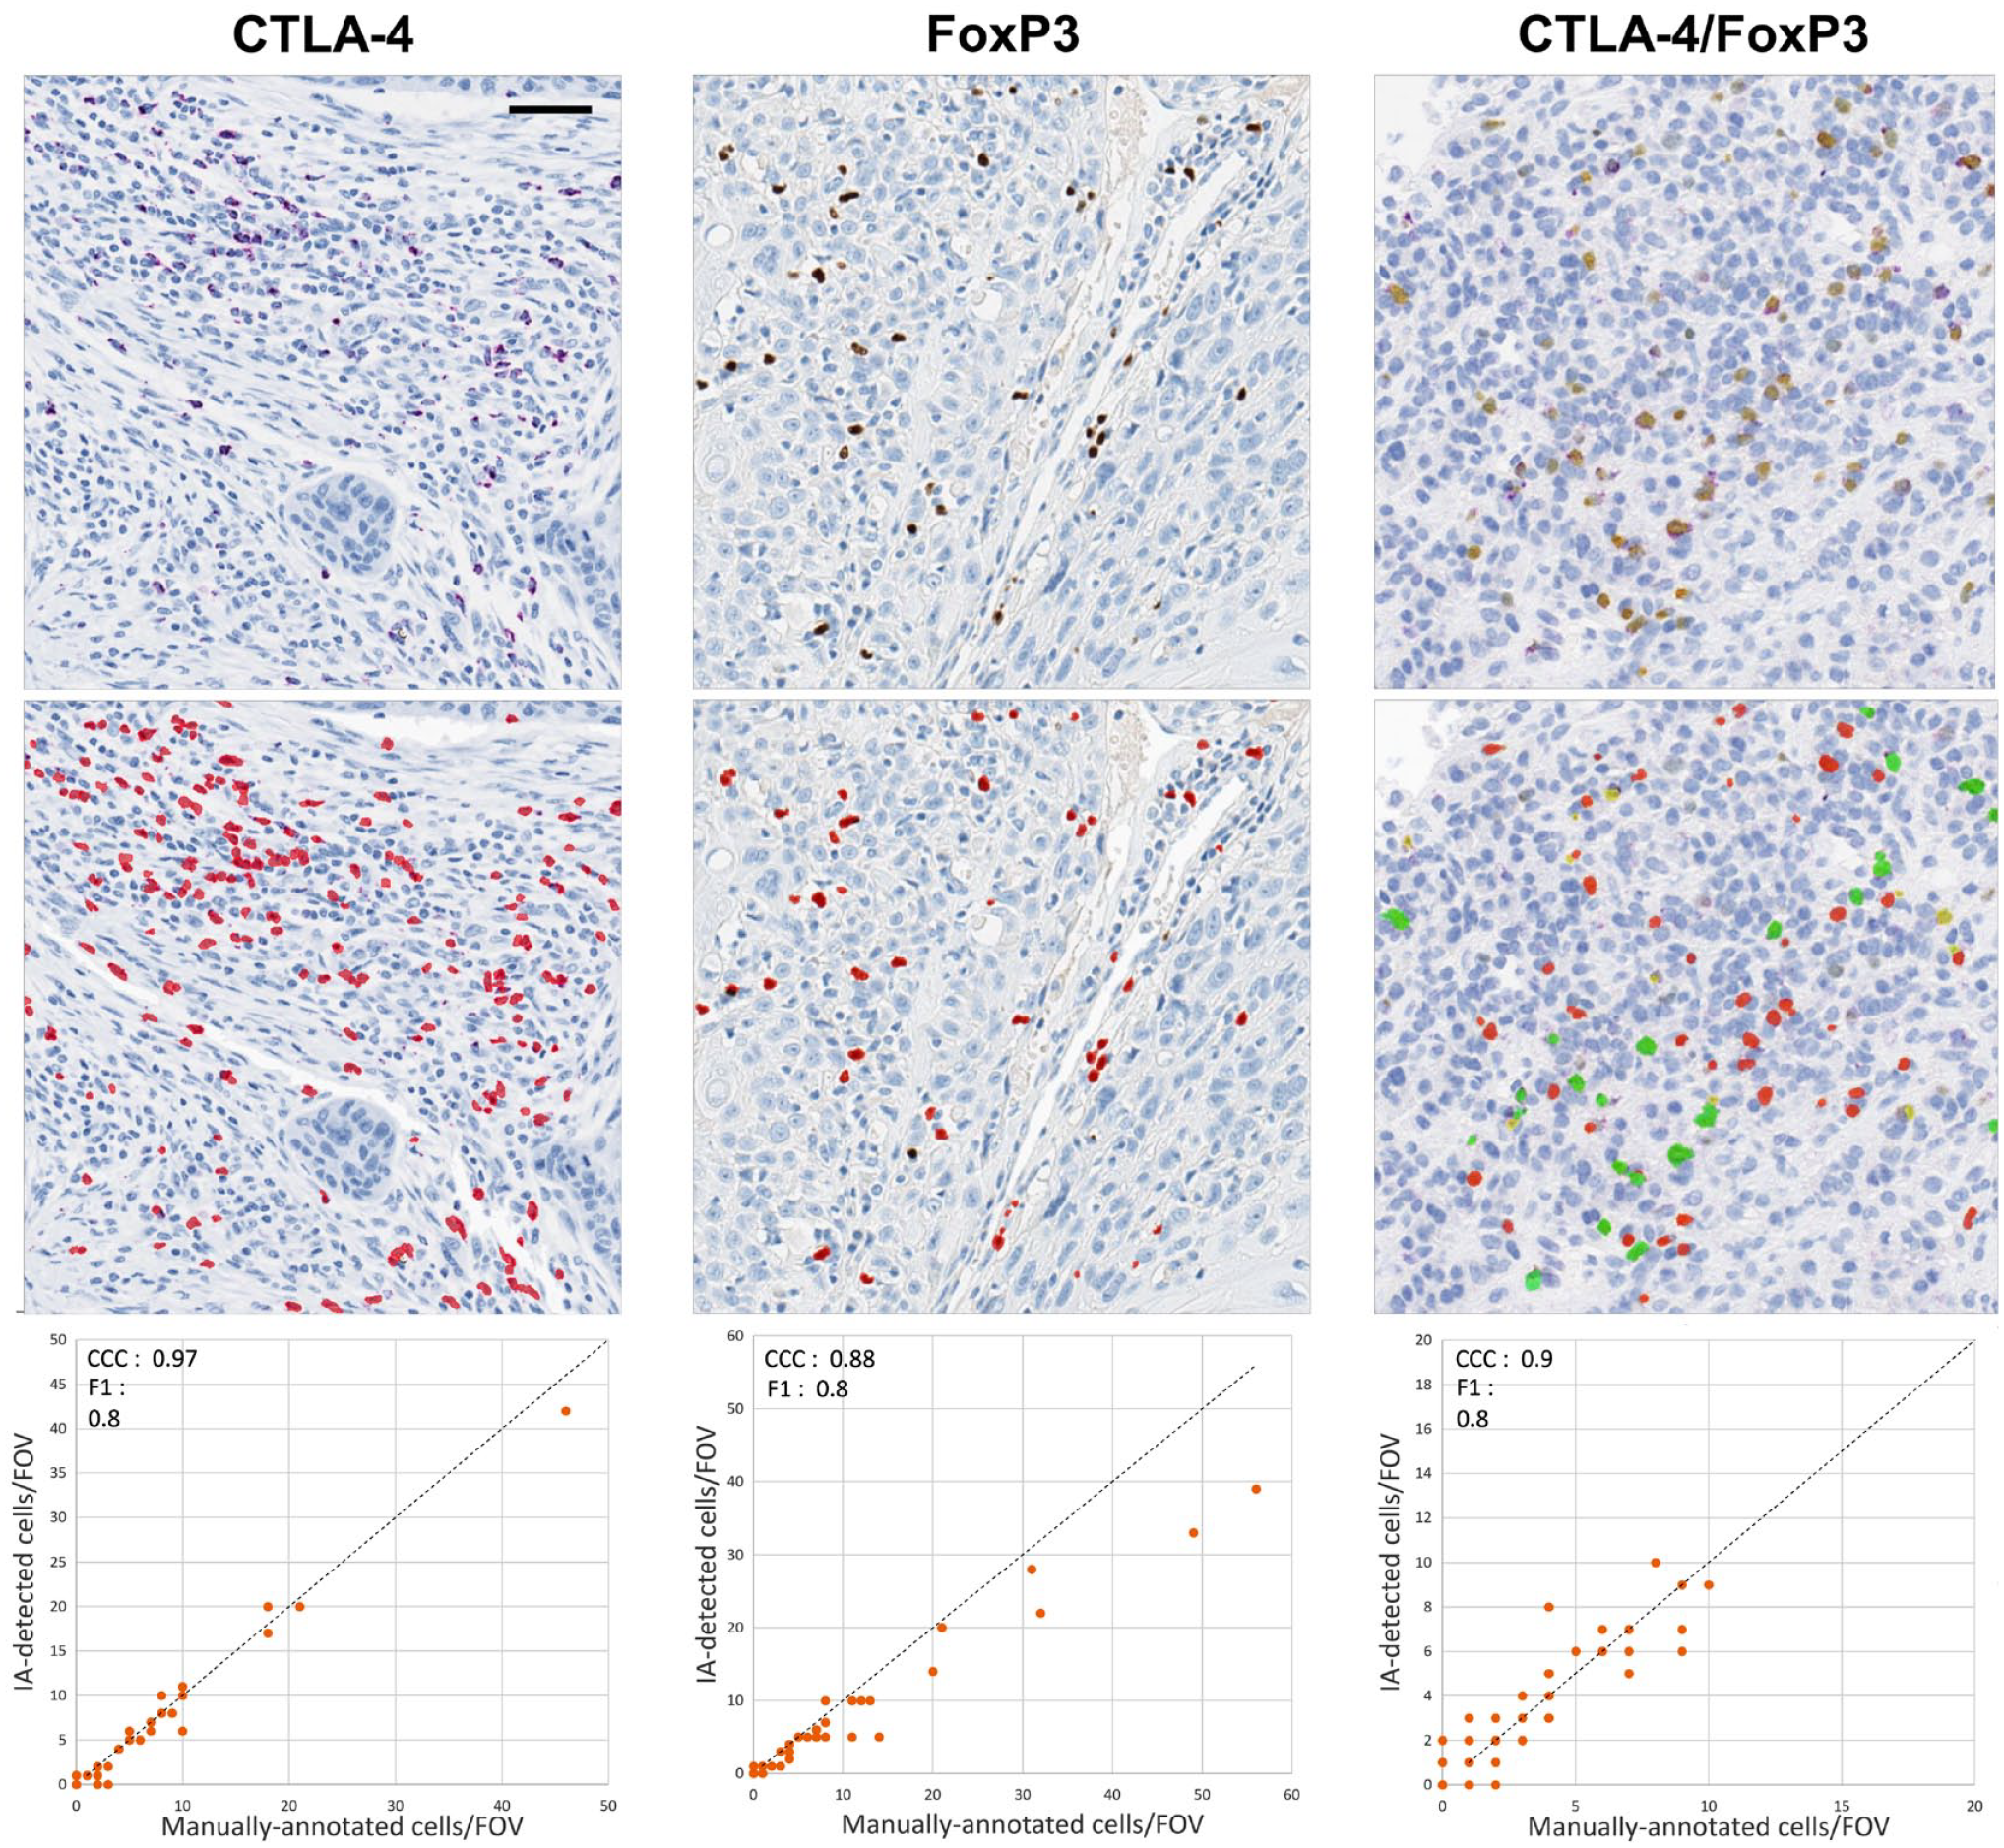
IA classification of CTLA-4 and FoxP3 in tumor sections. For the CTLA-4 and FoxP3 single immunostains, the red dots represent cells that were determined to be positive for each marker by IA. For the CTLA-4/FoxP3 duplex stain, red represents CTLA-4−/FoxP3+, green represents CTLA-4+/FoxP3+, and yellow represents CTLA-4+/FoxP3− cells. The charts compare IA results with those of manual annotation for each immunostain. For the CTLA-4/FoxP3 duplex stain, the chart shows the comparison only for double-positive cells. Scale bar, 50 μm. Abbreviations: IA, image analysis; CTLA-4, cytotoxic T-lymphocyte-associated protein 4; FoxP3, forkhead box P3 protein; CCC, Lin’s concordance correlation coefficient; FOV, field of view.
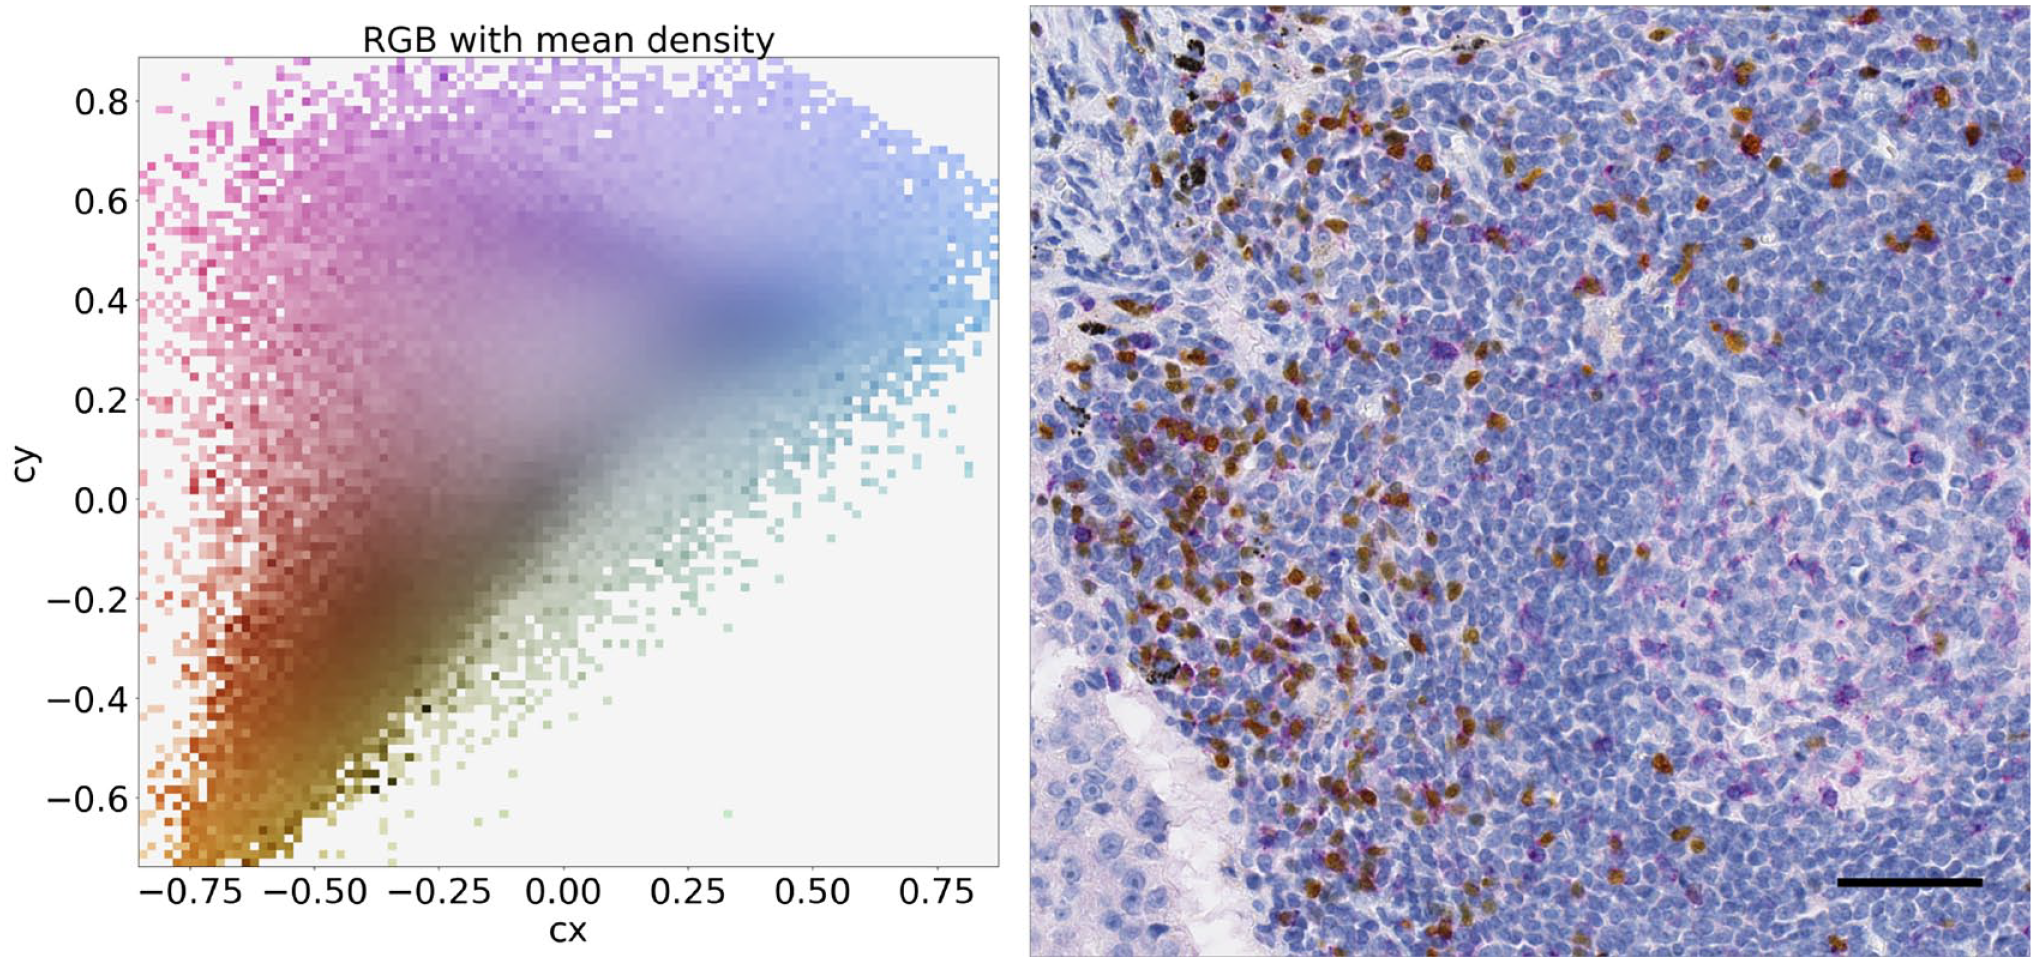
The left panel shows the distribution of the pixels in chromatic coordinates (cx and cy) for the image on the right. The right panel shows a CTLA-4/FoxP3 duplex-stained tumor sample. The cx and cy coordinates can be used to separate the pixels on the basis of their color contents and then to separate purple (top left), yellow (bottom left), and blue (middle right) colors. Scale bar, 50 μm. Abbreviations: CTLA-4, cytotoxic T-lymphocyte-associated protein 4; FoxP3, forkhead box P3 protein; RGB, red, green, blue.
Image Analysis
Immunostained tissues were digitally scanned, uploaded to Developer XD software (Definiens; Munich, Germany), and processed for IA as previously described. 23 After upload, each image was visually assessed for adequacy of tumor tissue and the presence of scanning or staining artifacts applicable to the quality of IA classification. Developer XD software was used to detect positive cells and to evaluate the quality of detection. Individual IA solutions were developed for the CTLA-4 PC assay, the FoxP3 assay, and the CTLA-4/FoxP3 duplex assay. Segmentation of CTLA-4+ cells was carried out by first isolating each nucleus based on the hematoxylin counterstain and then applying a color deconvolution to separately isolate the purple-stained pixels. Due to the granular nature of the CTLA-4 stain in the cytoplasm or at the cell membranes, the algorithmic strategy we followed considered positive cells to be those with segmented nuclei that had any detected immunolabel touching or very close to the nuclei. In addition, classification of positive cells required localized stain deposit to represent a cell size typical of lymphocytes. For the CTLA-4/FoxP3 duplex assay, each marker was detected separately, that is, segmented as single-positives. Then, in a final merging step, the intensity of both stains in each single-positive segmentation and their area overlap were evaluated. If the overlap was greater than 60% and the intensity thresholds for double positivity were met, the cell was merged into a double-positive.
Both the CTLA-4 PC assay and the FoxP3 IHC method were applied to as many as 99 commercial samples each of breast cancer, triple-negative; colorectal carcinoma; head/neck carcinoma; NSCLC, non-squamous and squamous; pancreatic carcinoma; and urothelial carcinoma. These provided sufficient numbers of images to assess the validity of the IA scoring solutions. Initial assessment of the IA classification of each marker was performed by visual inspection of IA segmentation results. Next, a more systematic validation of the IA segmentation results of the CTLA-4 PC assay and the FoxP3 IHC assay was performed, using a scheme we reported previously for CD8. 23 Briefly, immunolabeled lymphocytes were annotated in multiple high-magnification, 250-µm-diameter fields of view (FOVs) of scanned tumor images representing 56 FOVs across 38 images for the CTLA-4 PC assay and 54 FOVs across 35 images for the FoxP3 assay. Classified images were provided and then manually annotated to designate individual cells as either CTLA-4+ or FoxP3+ in the applicable immunostained tumors.
For qualification of the CTLA-4/FoxP3 duplex stain IA, we made use of already stained and scanned slides from tumor biopsy specimens of a cohort of NSCLC patients treated with durvalumab (ClinicalTrials.gov study NCT01693562). 24 This validation was performed somewhat differently than the single marker IA, owing to the complexity of the two markers in lymphocytes. In many well-preserved tissues with intact lymphocytes, the color distinction between purple cytoplasm (CTLA-4) and yellow nucleus (FoxP3) was clear, and therefore the pathologist could confidently differentiate CTLA-4 single-positive cells, FoxP3 single-positive cells, and CTLA-4/FoxP3 double-positive cells. In lymphocytes with apparent degenerative changes, some blurring was evident between cytoplasmic and nuclear chromogens that made it difficult to distinguish single-positive from double-positive cells. However, visual assessment of the IA classification of numerous duplex-labeled tumors indicated that IA produced better spectral separation than was clear to the pathologist. Therefore, manual annotations of CTLA-4+/FoxP3−, CTLA-4−/FoxP3+, and CTLA-4+/FoxP3+ cells in 100 FOVs distributed across 30 NSCLC images were done, using spectrally separated channels as a guide. In the case of the more difficult double-positive cells, all FOVs were annotated separately by two pathologists, and IA results were then tested against the positive cells annotated as such by both pathologists. For each of the three assays validated in this way, the manual annotations were compared with the IA results on a cell-by-cell basis, as previously described. 23 Lin’s concordance correlation coefficient (CCC) and F1 score were calculated. For both values, the lower boundaries of a one-sided 95% confidence interval for the CCC and the F1 score were evaluated, resulting in CCC_lower and F1_lower scores.
Results
Performance Characteristics of IHC Assays
Our primary objective was to develop and qualify IHC as suitable for the evaluation of CTLA-4 expression in FFPE tissue samples of human cancers. Initially, the three chromogenic IHC assays were developed and tested to produce assay conditions that resulted in substantial CTLA-4 labeling of human tonsillar lymphocytes that was comparable with findings demonstrated previously with frozen human tonsil tissue. 25
We found numerous immunolabeled lymphocytes in the germinal centers of tonsils with all three assays (Fig. 1), as expected. Isotype controls exhibited no such staining. Non-lymphocytic cells in tonsil tissue were not labeled with any of the assays. We then sought to further assess specificity in appropriate cell types. With the use of FFPE cell pellets, all three assays strongly labeled the Chinese hamster ovary (CHO) cells transfected with CTLA-4, but none labeled the negative cell lines, which included parental CHO cells, CHO cells transfected to express PD-1, human embryonic kidney (HEK) cells transfected to express CD28, parental HEK cells, Jurkat cells, and Raji cells (Fig. 1 and Table 2).
We also tested CTLA-4 expression demonstrated by each of the three assays applied to peripheral human blood T-lymphocytes (PBTLs), including resting cells and PBTLs activated in vitro with CD3 and CD28 antibodies (Supplementary Material). Few resting PBTLs expressed CTLA-4. Stimulated PBTLs were labeled in numbers according to the degree of their stimulation (Fig. 2 and Table 2). Separately, FoxP3 expression was observed in only a minority of CTLA-4+ and some CTLA-4− PBTLs with the duplex assay. FoxP3 labeling was not seen in any of the cultured cell lines. All three chromogenic assays thus demonstrated specificity in these principal control samples.
Next, we tested a variety of normal human tissues and cancers to further assess target and non-target immunolabeling microscopically. These findings helped to validate our assays and served to illustrate the landscape of cellular expression and distribution of CTLA-4+ lymphocytes in tumors and normal tissues. We therefore include some descriptive details of our immunolabeling findings in the following sections.
CTLA-4 Expression in Normal Human Tissues
We found that CTLA-4+ lymphocytes in the germinal centers of tonsillar lymphoid follicles were more numerous in the light zone (centrocyte region) than in the dark zone (centroblast region), especially along the light zone–mantle border (Fig. 3A–C). Many CTLA-4+ lymphocytes were also present in the interfollicular (T-cell zone) region (Fig. 3E), with fewer positive cells in the mantle per se. A few CTLA-4+ lymphocytes infiltrated the reticular epithelium of tonsillar crypts but were only rarely present in the superficial epithelium. In all tonsil regions, CTLA-4+ cells represented a minority of total lymphocytes. In situ hybridization (ISH) with a CTLA-4 probe developed in-house (Supplementary Material) showed labeling of tonsil tissue to be consistent with IHC (Fig. 4). RNA signal was predominant in lymphocytes of the light zone of germinal centers and the T-cell zone, and fewer cells were labeled in other regions. In the lymph node, the majority of CTLA-4+ immunolabeled lymphocytes were likewise present in germinal centers and the T-cell zone (Fig. 3F) when such structures were evident, as they were not in some TMA cores. CTLA-4 was evident in many lymphocytes as granular cytoplasmic staining, especially in the germinal center. However, some positive cells in both germinal centers and the T-cell zone exhibited intense excentric, globular, or sometimes bleb-like staining in which CTLA-4 appeared to be localized near the cell membrane (Fig. 3D and E). Diffuse cytoplasmic labeling predominated in unstimulated PBTLs, whereas activated cells showed the excentric, globular pattern more frequently.
Lymphoid tissues immunolabeled with the CTLA-4/FoxP3 duplex assay revealed a notable and consistent distinction between the germinal center and the T-cell zone. The majority of CTLA-4+ lymphocytes in the germinal centers of tonsils demonstrated no FoxP3 labeling (Fig. 3C and D). This included cells in the central portion of the light zone and along the mantle border. In contrast, the majority of CTLA-4-positive cells in the T-cell zone demonstrated FoxP3 coexpression (Fig. 3E). Some double-positive cells were also observed infiltrating the crypt epithelium. The excentric, globular pattern of CTLA-4 cellular expression was observed in some double-positive cells as well as in some CTLA-4 single-positive lymphocytes. The distinction between CTLA-4 single-positive cells in the germinal centers and double-positive lymphocytes in the T-cell zone was also evident in the lymph node (Fig. 3F). In addition, a few CTLA-4/FoxP3 double-positive cells and fewer CTLA-4 single-positive cells were observed in some lymph node sinuses.
In TMA cores of thymus, CTLA-4+ cells were more frequent in the medulla than the cortex, and most coexpressed FoxP3. In the spleen, double-positive cells were evident in the white pulp and fewer in the red pulp. Of secondary note, FoxP3+ cells with no apparent CTLA-4 expression were evident in different lymphoid compartments. In TMA cores and whole sections of tonsil and lymph node, FoxP3+ lymphocytes were infrequent in germinal centers but were present in the T-cell zone in numbers similar to, or somewhat greater than, those of the CTLA-4/FoxP3 double-positive lymphocytes.
Additional tissues in TMA format (Supplementary Material) showed labeling only of cells morphologically compatible with lymphocytes. In lymphoid organs, labeled cells were relatively abundant. In the connective tissue of some non-lymphoid tissues, such as the lamina propria of the gut, they were infrequent. In the remaining non-lymphoid tissues (e.g., liver, kidney, reproductive tissues), no or very few CTLA-4+ lymphocytes were present. ISH labeling of normal tissues was evident only in cells that were morphologically consistent with lymphocytes (Fig. 4).
CTLA-4 Expression in Human Cancers
CTLA-4+ TILs varied substantially in numbers and their locations among various tumors (Fig. 5). This finding was based on the three chromogenic assays applied to resected NSCLC specimens selected to include tertiary lymphoid structures (TLSs) and tumor microarrays or resection samples of melanoma and carcinomas of the breast, urinary bladder, ovary, lung, prostate gland, thyroid gland, kidney (renal cell carcinoma), colon and rectum, pancreas, and head and neck. Accordingly, a few microarray tumor cores had no or very few CTLA-4+ TILs (Fig. 5A). In the remaining TMA cores and the resection specimens, CTLA-4+ TILs varied from few to many. In resection specimens, the number of positive cells also varied regionally.
In most tumors, the majority of CTLA-4+ TILs were present in the stroma and were especially numerous in regions containing dense TIL aggregates (Fig. 5C and D), lymphoid nodules, or nodules exhibiting features of TLS (Fig. 5E and F). Infiltration of CTLA-4+ TILs into tumor islands was overall infrequent, although a few specimens had notably higher percentages of infiltrating lymphocytes (Fig. 5B). In the resection specimens, CTLA-4+ TILs were present in the invasive margin in numbers usually greater than those in the tumor center of the corresponding sample. TLSs were typically not evident or difficult to recognize in the small TMA tumor cores. In resected tumors containing TLS, CTLA-4+ lymphocytes were mainly localized to the germinal centers and the T-cell zone, similar to normal tonsil and lymph node. ISH only labeled apparent lymphocytes, in variable numbers, of the multiple tumors assessed (Fig. 4).
In the duplex-immunostained resection samples, TLS also exhibited the same distinction between predominantly CTLA-4+/FoxP3− cells in germinal centers and CTLA-4+/FoxP3+ cells in the T-cell zone (Fig. 5E), as was seen in tonsil and lymph node secondary follicles. Also evident in the dual-stained resection tumors were a few small nodular lymphoid aggregates with CTLA-4+/FoxP3− cells contained in a region of central clearing that appeared to be incipient TLS (Fig. 5F). Mixtures of CTLA-4+/FoxP3+ TILs and CTLA-4 or FoxP3 single-positive cells were otherwise present in the stroma of these tumors, as well as in several tumor cores in the TMA. The globular localization of CTLA-4 we already described was observed in some CTLA-4+/FoxP3− and in CTLA-4+/FoxP3+ TILs.
Additional Microscopic Findings
In general, we observed more CTLA-4-labeled tissue lymphocytes and PBTLs with the mAb and duplex assays than in replicate samples immunostained with the PC assay (Fig. 3A–C and Table 2). Although this observation indicated somewhat greater sensitivity of these two assays, their assay conditions differed from those of the PC assay in ways other than just the two different primary antibodies. Nonetheless, and as described below, the PC assay still provided sensitivity we found useful for profiling multiple cancer types by IA.
Aside from the evident lymphocyte staining in various normal and tumor tissues already described, we noted purple chromogen staining of colloid in normal thyroid and gastric fundic glands (Fig. 4) with the mAb and duplex assays. Similar colloid and epithelial staining was also evident in the applicable isotype control slides for these assays, but was not seen in the same tissue cores with the PC assay. In the tumor TMAs, moderate to intense staining of colloid in a few prostate and thyroid carcinoma specimens was similarly evident with the mAb and duplex assays. Otherwise, generally light-purple stippling of some epithelial cells or glandular luminal material, as well as stippling of some myofibers, was observed infrequently in a few normal and tumor tissues. The ISH-labeled tissues revealed staining only of cells consistent with lymphocytes and in locations where the applicable IHC stains also labeled lymphocytes (Fig. 4). No staining of epithelial cells, myofibers, or colloidal substance was evident in the ISH slides or in any other cellular or non-cellular elements. Immunostaining of non-lymphocytes, when it occurred, was uncommon and did not interfere with the interpretation of lymphocyte labeling or separately with IA. In summary, based on the immunolabeling characteristics observed with target cells and non-target elements, we concluded that all three chromogenic assays had performance characteristics that supported the specificity of lymphocyte immunolabeling for CTLA-4 expression, as well as a substantial degree of staining sensitivity. It is noted, however, that determination of the absolute sensitivities of our assays, that is, compared with CTLA-4 protein copy number, was not part of this study.
Finally, to add some additional relevant information to the overall findings of our CTLA-4 IHC assays, we developed IF assays that combined the CTLA-4 mAb with CD3, CD4, and CD8. Our validation of these assays in terms of CTLA-4 expression was similar to our validation of the chromogenic assays (Fig. 6). We found CD3 labeling of almost all CTLA-4+ cells, and likewise CD4 labeling of the majority of CTLA-4+ lymphocytes (Fig. 7), in both lymphoid tissues and a few select tumors. CTLA-4+ lymphocytes, however, were rarely colabeled for CD8 in these specimens. Because the cellular localization of CTLA-4 has functional relevance,5,6,15,20,26,27 the greater resolution of CTLA-4 provided by confocal microscopy used for the IF-stained specimens was beneficial in this regard. In particular, the diffuse and excentric patterns, as well as the occasional globular nature of CTLA-4 labeling, were both more readily apparent in the IF-stained specimens when viewed at high magnification (Fig. 7).
Image Analysis
IA with single immunostains applied to multiple types of cancer enabled the classification of TILs that individually expressed CTLA-4 and FoxP3 with good accuracy. Initial evidence of this was provided by visual inspection of unsegmented and segmented images (Fig. 8). Subsequently, IA classifications for each marker were systematically compared with those of manually annotated images and the results subjected to statistical analysis. For CTLA-4, the CCC_lower score was 0.97 and the F1_lower score was 0.8, whereas for FoxP3, the CCC_lower score was 0.88 and the F1_lower score was 0.8 (Fig. 8). These CCC values showed substantial to almost perfect agreement between IA and manual annotations, according to criteria previously proposed by McBride. 28
Separately, IA classification of the duplex stain compared with pathologist annotations also showed accurate individual determination of CTLA-4 single-positive cells, FoxP3 single-positive cells, and double-positive cells, with a CCC value of 0.9 and an F1 score of 0.8. Similar to IA for the CTLA-4 and FoxP3 individual assays, IA applied to the duplex stain resulted in a CCC value that was in substantial to almost perfect agreement according to the McBride criteria. 28 Spectral separation by the IA solution applied to the duplex stain was further demonstrated by inspection of pixel-based color space graphs of duplex-stained tumor images (Fig. 9). We found that the spectral separation between purple and yellow chromogens, as well as the distinctions between these chromogens and potential interfering tissue pigments (e.g., anthracotic pigment), enhanced both the accuracy and the sensitivity of IA results.
Discussion
The mechanism by which CTLA-4 affects the immune response to cancer is currently a key focus of the field of immuno-oncology. Our overall understanding remains limited, especially with regard to the role of CTLA+ lymphocytes in shaping the tumor microenvironment and the need to find robust markers of clinical response to CTLA-4 antibodies. The lack, previously, of validated IHC methods to investigate CTLA-4+ lymphocytes in FFPE tumor specimens represents a noteworthy limitation of cancer research compared with other key immune checkpoint proteins.
We developed CTLA-4 IHC methods using both a PC antiserum and a mAb. We qualified these assays using key elements of published guidelines from recognized experts in the field of IHC.29,30 Our qualification placed particular emphasis on the specificity of IHC results in terms of labeling of cells that are known or expected to express CTLA-4 and the lack of labeling of non-target cells. Important in this regard is that all three of our IHC assays labeled cells transfected to express CTLA-4, as well as lymphocytes in numerous human tissues, in a fashion consistent with those described in previous reports.15,18,25,31 All three assays showed no labeling of cells transfected to express the homologous proteins CD28 and PD-1 or cells in which CTLA-4 was not expected to be present, including non-lymphocytic cells in many tissues. Other findings that supported these results include the similar labeling characteristics provided by the PCs and mAbs, as well as our ISH findings. Although we could employ additional measures of specificity, such as labeling of cells in which CTLA-4 expression is eliminated by RNA interference, our qualification of the specificity of CTLA-4 immunolabeling has thus far failed to raise issues that would invalidate the results obtained with the assay conditions we employed. Nonetheless, additional study of a variety of tumor tissues under these IHC assay conditions should be informative in this regard. A better understanding of the sensitivities and dynamic range of these assays would also be helpful.
Our assays labeled cells with features expected of CTLA-4+ lymphocytes in many tissues. Chief among these, and as previously shown, 25 was the presence of many CTLA-4+ lymphocytes in human tonsil tissue, which we consider our primary positive anatomical control. This showed these assays had sufficient sensitivity to assess key aspects of the role of CTLA-4 in tumor immunity, such as the locations of CTLA-4+ TILs and their relative proportions among different specimens. Because the CTLA-4 mAb assay showed greater sensitivity than the PC assay, and because mAbs confer performance characteristics that are overall more suitable for use in diagnostic assays, 32 the CTLA-4 mAb is preferred over the PC. Accordingly, we used the CTLA-4 mAb in the CTLA-4/FoxP3 duplex method.
Our tissue staining provided useful information regarding CTLA-4 expression patterns. As expected, CTLA-4-labeled lymphocytes were observed mainly in the germinal centers and the T-cell zone of human SLOs, as shown previously by IHC with frozen tissue. 25 Our study extended this pattern to TLSs in tumors that showed the same regional distinctions. In addition, we found variable numbers of CTLA-4+ TILs in the tumor stroma of most cancer specimens, with typically few cells infiltrating tumor nests. Excisional tumor specimens demonstrated that more CTLA-4+ TILs were usually present in the invasive margin than in the tumor center. We are currently exploring these and other aspects of CTLA-4 expression in a quantitative sense through the application of IA to multiple cancer indications.
Our assays further showed the expected upregulation of CTLA-4 in T-lymphocytes after in vitro immune stimulation. We also observed intracellular distribution of CTLA-4, which appeared in some lymphocytes as fine granular cytoplasmic staining and in others as excentric, often globular deposits, consistent with findings from in vitro studies previously.15,18,31 For example, in the case of conventional T-cells, immune activation results not only in CTLA-4 upregulation but also in the redistribution of CTLA-4 from endocytic vesicles to the cell membrane, where it concentrates at the immunological synapse. This is in contrast to Tregs, in which membrane localization of CTLA-4 is considered a constitutive feature. Relevant to these studies is our observation of possible membrane localization in both CTLA-4+/FoxP3− and CTLA-4+/FoxP3+ cells. Although these findings seem interesting and potentially important, they should be interpreted cautiously given that light microscopy applied to FFPE tissues may be limited with regard to the accuracy of apparent membrane localization of lymphocyte antigens by IHC.
Using IF, we found the majority of CTLA-4+ lymphocytes in selected lymphoid tissues and tumors to be CD3+ and CD4+, also consistent with previous findings. 33 However, very little expression of CD8 in CTLA-4+ cells was evident in the samples we examined. In this respect, our preliminary findings are somewhat in contrast to those of other studies in which CTLA-4 expression has been demonstrated on CD8+ human T-cells, albeit at lower levels than in CD4+ lymphocytes.14,33 Possible explanations for this discrepancy include differences in CTLA-4 TIL phenotypes between the different tumors studied or lower sensitivity in the case of our IF assay for CD8 compared with the methods used by others. The expression patterns of CTLA-4 in these and other lymphocyte subsets should be explored more fully in future studies.
The duplex IHC assay provided the ability to directly evaluate CTLA-4 distribution in lymphoid tissues and the tumor microenvironment alongside FoxP3 as a marker of Tregs. We found that CTLA-4+/FoxP3− lymphocytes prevailed in the germinal centers of SLOs, whereas the T-cell zone contained CTLA-4+/FoxP3+ lymphocytes admixed with CTLA-4+/FoxP3− and CTLA-4−/FoxP3+ cells. These histological findings are consistent with a previous study demonstrating that CTLA-4 RNA is expressed in T follicular helper cells (CD3+, CD4+, FoxP3−) which localize to the germinal center and T follicular regulatory cells (CD3+, CD4+, FoxP3+) which localize to the T-B border rather than the germinal center. 34 Our findings further demonstrate that TLS recapitulates the organization of the SLO with respect to CTLA-4/FoxP3 subsets. In addition, we observed CTLA-4+/FoxP3+ lymphocytes admixed with CTLA-4+/FoxP3− and CTLA-4−/FoxP3+ cells in the stroma of most tumors, although the proportions of these subsets varied from one tumor sample to another. We are currently working to confirm these microscopic observations by using quantitative IA applied to multiple cancer indications of both non-clinical tumors and tumor biopsies of patients treated with durvalumab. Although FoxP3 is considered to be an imperfect marker of human Tregs, our preliminary findings nonetheless appear to generally support the notion put forth previously that CTLA-4 and FoxP3 direct independent but sometimes overlapping mechanisms of immune regulation. 28 Additional study is needed, though, to begin to understand the immunological significance of these phenotypic variants in the tumor microenvironment. The CTLA-4/FoxP3 duplex assay may be especially helpful to address the question of whether CTLA-4 therapeutic antibodies act by depleting regulatory T-lymphocytes on which CTLA-4 is expressed in the tumor microenvironment, as discussed previously.8,18–22
Accurate quantification of CTLA-4 in tumor tissues with IA should provide data beneficial to understanding the role of this key checkpoint molecule in the immune response to cancer. Accordingly, another key result of this study was the ability to assess the accuracy of IA classification of the CTLA-4 PC assay applied to multiple tumor types, as well as that of the duplex IHC method applied to NSCLC. To align the FoxP3 data with those of the CTLA-4 PC assay, we also included our separate validation of the FoxP3 IA measurement. Our results support the conclusion that the IA classifications of CTLA-4 alone, FoxP3 alone, and the cellular subsets that were distinguishable in the duplex-labeled tumor tissues were suitable to evaluate CTLA-4 and FoxP3 parameters in the tumor microenvironment of NSCLC and other types of cancer. In the case of IA applied to the duplex IHC assay, we were able to confirm, both digitally and visually, that it accurately classified spectral differences between the colors used separately for CTLA-4 and FoxP3 detection. In other words, the combination of purple chromogen to label CTLA-4 and yellow chromogen to detect FoxP3 in most instances permitted good discrimination between double-positive and single-positive lymphocytes, either by direct microscopy or by visualization of digital images. In some instances, however, we found visual evidence that IA provided better spectral separation of the two colors in certain cells than what was visually evident to a pathologist.
The value of a computational pathology approach to quantification of tissue biomarkers has been previously justified for single IHC markers, including in our own studies.23,24,35,36 On one hand, our study further illustrates the need for IA solutions such as our CTLA-4/FoxP3 IHC assay to quantify the increasingly complex information that is present in a duplex-labeled tumor. On the other hand, it must be recognized that the leading edge of the field of immuno-oncology is now increasingly relying on multiplex IF to assess multiple relevant markers in labeled FFPE tumors. 37 Thus, the accuracy of the data resulting from such studies will require close attention to the ability of IA to discriminate between the expressed markers included in such studies.
In summary, this study showed that lymphocytes expressing CTLA-4 could be labeled by IHC in human FFPE tissues and measured by quantitative IA. The methods described here should provide useful research tools to assess the role of CTLA-4 in tissue studies of the tumor microenvironment. Such studies could serve to increase our understanding of the immune response to cancer or even help to identify markers of therapeutic response to ipilimumab, tremelimumab, or other immunotherapies under investigation.
Supplemental Material
DS_10.1369_0022155419882292 – Supplemental material for CTLA-4 Immunohistochemistry and Quantitative Image Analysis for Profiling of Human Cancers
Supplemental material, DS_10.1369_0022155419882292 for CTLA-4 Immunohistochemistry and Quantitative Image Analysis for Profiling of Human Cancers by Charles Brown, Farzad Sekhavati, Ruben Cardenes, Claudia Windmueller, Karma Dacosta, Jaime Rodriguez-Canales and Keith E. Steele in Journal of Histochemistry & Cytochemistry
Footnotes
Acknowledgements
We thank, all from AstraZeneca, Karen Coffman, Andrew Garcia, Lori Clarke, Nicholas Durham, Kapil Vashist, and Michael Oberst for providing control cell samples; Holly Koelkebeck for histology; and Sally Lee, Martha Wester, Anmarie Boutrin, and Arthur Lewis for logistical management of clinical and non-clinical tissue specimens. Editorial support was provided by Deborah Shuman of AstraZeneca.
Competing Interests
The author(s) declared the following potential conflicts of interest with respect to the research, authorship, and/or publication of this article: C.B., K.D., J.R.-C., and K.E.S. are employees of, and hold stock interests in, AstraZeneca. F.S. and C.W. are employees of Definiens AG. At the time of manuscript approval, R.C. was an employee of Definiens AG.
Author Contributions
KES conceived the study. CB, FS, and KES devised the experimental design. CB developed assay conditions and performed the immunohistochemistry. FS and RC performed image analysis and statistical analysis. CW performed image analysis and quality control (QC). KD performed digital slide scanning and QC. KES performed microscopic analysis. JR-C performed critical review of intellectual content. CB, FS, and KES drafted the manuscript. All authors have read and approved the final manuscript.
Funding
The author(s) disclosed receipt of the following financial support for the research, authorship, and/or publication of this article: This study was supported by MedImmune, previously the global biologics R&D arm of AstraZeneca.
References
Supplementary Material
Please find the following supplemental material available below.
For Open Access articles published under a Creative Commons License, all supplemental material carries the same license as the article it is associated with.
For non-Open Access articles published, all supplemental material carries a non-exclusive license, and permission requests for re-use of supplemental material or any part of supplemental material shall be sent directly to the copyright owner as specified in the copyright notice associated with the article.