
Abstract
Peripheral inflammatory stimuli increase proinflammatory cytokines in the bloodstream and central nervous system and activate microglial cells. Here we tested the hypothesis that contrasting environments mimicking sedentary and active lives would be associated with differential microglial morphological responses, inflammatory cytokines concentration, and virus load in the peripheral blood. For this, mice were maintained either in standard (standard environment) or enriched cages (enriched environment) and then subjected to a single (DENV1) serotype infection. Blood samples from infected animals showed higher viral loads and higher tumor necrosis factor-α (TNFα) mRNA concentrations than control subjects. Using an unbiased stereological sampling approach, we selected 544 microglia from lateral septum for microscopic 3D reconstruction. Morphological complexity contributed most to cluster formation. Infected groups exhibited significant increase in the microglia morphological complexity and number, despite the absence of dengue virus antigens in the brain. Two microglial phenotypes (type I with lower and type II with higher morphological complexity) were found in both infected and control groups. However, microglia from infected mice maintained in enriched environment showed only one morphological phenotype. Two-way ANOVA revealed that environmental changes and infection influenced type-I and II microglial morphologies and number. Environmental enrichment and infection interactions may contribute to microglial morphological change to a point that type-I and II morphological phenotypes could no longer be distinguished in infected mice from enriched environment. Significant linear correlation was found between morphological complexity and TNFα peripheral blood. Our findings demonstrated that sedentary-like and active murine models exhibited differential microglial responses and peripheral inflammation to systemic non-neurotropic infections with DENV1 virus.
Keywords
Introduction
Many systemic viral or bacterial infections can induce neurobehavioral symptoms without entering the central nervous system (CNS). 1 It has been suggested that toll-like receptors on peripheral sentinel immune cells—for example, monocytes and macrophages that recognize viruses and bacteria 2 —can facilitate neuroimmune communication via proinflammatory cytokines and activation of immune pathways through the blood–brain barrier.3,4 Microglia cells are the resident tissue macrophages of the CNS. The kaleidoscope of functions of microglia, revealed by the transcriptomic evaluation in both developing and aging CNS, confirmed a diversity of microglia phenotypes associated with CNS homeostasis or neurological diseases. 5 Homeostatic phenotypes may help in the sculpture of brain circuits through synaptogenesis and neurogenesis, whereas their phenotypes associated with immune response against infectious agents and neurodegenerative diseases may act under altered non-homeostatic conditions seeking to restore the homeostatic balance. 6 To go for it, microglia express many genes of the myeloid lineage, including receptors for pathogen-associated molecular patterns and damage-associated molecular patterns, genes involved in phagocytosis, and antigen presentation. We refer to it as activated microglia, when a change occurs in its phenotypes to face a non-homeostatic challenge in the microenvironment of the CNS.5-7 Peripheral proinflammatory cytokines can induce microglia to produce a similar cytokine profile in the brain; however, synthesis of prostaglandins in the periphery and their actions on the brain induce sickness behavior.8-11
Dengue fever is the most important arbovirus-induced disease in the world, 12 and it is an example of viral infection that can lead to neurological manifestations, including encephalitis, encephalopathy, meningitis, stroke, transverse myelitis, Guillain-Barré syndrome, and others.13,14 Here we tested the hypothesis that non-neurotropic DENV1 virus infection may produce microglial response in the brain in correlation with peripheral increase of proinflammatory cytokine gene expressions, and, if so, also tried to minimize this response by environmental changes.
Host immune response to an infection may be modulated by a variety of factors.15-20 Environmental enrichment, for example, can contribute to disease progression or limitation depending on virus replication mechanisms. An improved response was shown in an infection with influenza type A in a model of 4-month enriched environment (EE) housing regimen. 21 These authors showed that mice from enriched cages were able to clear virus antigens more quickly than animals housed in a standard condition. The EE has been defined as social interactions with conspecifics and a stimulation of exploratory and motor behavior with a variety of toys, ladders, tunnels, rope, bridges, and running wheels for voluntary physical exercise changed periodically, as opposed to an impoverished environment with reduced social interactions. 22 Using this model of enrichment cage, we have similarly demonstrated in a mouse model of rhabdovirus infection that as compared with mice kept in standard cages, individuals maintained in EE showed increased inflammatory response to Piry virus encephalitis amplifying T-cell mobilization to the brain parenchyma, showing higher microglia activation and faster virus CNS clearing. 23 An EE was previously described as enhancing natural killer (NK) cell activity, including their recognition and killing of virally infected cells. 24 Rats reared under EE conditions present immune cell recruitment with a higher number of activated microglia than control rats, and these ramified microglial cells resemble the neuroprotective phenotype of microglia activated by T-cell–derived cytokines. 25
After antibody-enhanced dengue virus infections mimicking dengue crossed serotype infections, our group have demonstrated that mice housed in enriched cages also showed an increase in viral load and this was associated with an increase in T-cell response with higher mortality than those housed in standard cages.26,27 These models were transferred to primates, using antibody-enhanced disease in immunocompetent primates, and the results suggested distinctive memory T-cells recruitment followed by severe serotype cross-reactive antibody response in individuals from enriched condition.28,29
Despite the evidence of microglial morphological changes in the hippocampus and cortex of primates after antibody-enhanced DENGUE infection,28,29 it is poorly understood how microglia responds to a dengue non-neurotropic infection under influence of contrasting environments.
Microglia are motile cells that constantly screen their environment. As necessary, they monitor synapses, migrate, or phagocytose—correspondingly moving their processes as needed. Over time, they show multiple reversible morphofunctional transformations, assuming a variety of branching complexities between morphological extremes of rounded and hyper-ramified cells.30,31 Transitions between different profiles occur at different temporal scales depending on the nature and intensity of homeostatic changes. 31 Prior analyses of microglia morphofunctional plasticity in response to peripheral non-neurotropic virus infections are limited.32-34 Moreover, the previously investigated CNS areas have not included the lateral septum—a critical area that, together with the prelimbic cortex and the paraventricular nuclei of the hypothalamus, responds to stress and exercise. 35 Aerobic exercise and environmental enrichment reportedly reduce the impact of infections associated with a sedentary-like lifestyle in both adult rodents36,37 and aged rodents.37-39 However, few studies have assessed the impact of exercise on microglial response after peripheral infections.38-43 In addition, no studies have investigated the effects of environmental enrichment on microglial response to viral pandemics, such as dengue viruses.
We previously established an antibody-enhanced disease model in immunocompetent mice and primates, which mimics severe dengue in endemic areas with abundant vectors, where individuals are commonly infected with multiple different serotypes. Both the murine and primate models showed an exacerbated inflammatory response in the periphery, while only the primates showed an exacerbated microglial morphological response.26-29
From a quantitative perspective, it can be problematic to estimate morphological changes using standard morphometric methods that do not account for 3D analysis and a relatively simple solution to this problem is to apply random systematic sampling to classify cells via hierarchical cluster analysis.29,44,45 Recent studies describe and classify morphological changes using microscopic 3D reconstruction of microglia, followed by hierarchical cluster analysis of the morphometric features.45-47 It is known that microglial morphology can offer information about its physiology.31,48,49 Fontainhas and coworkers showed that morphological aspects and branch motility were differentially regulated by different neurotransmitters in an ex vivo mouse retinal explant system. Authors noted increased branch processes and motility induced by ionotropic glutamatergic neurotransmission and decreased branch processes and motility induced by ionotropic GABAergic neurotransmission, 50 indicating a strong relationship between microglial morphology and physiology. Furthermore, some authors have demonstrated the presence of subpopulations of microglial cells responding in a different way depending on the stimulus and on the brain region.51,52 Despite this information, a single previous investigation applied stereological sampling approach to quantify subtle microglial changes caused by viral infections under the influence of contrasting environments. 23
Here we used a random and systematic sampling approach to compare microglial morphological responses with DENV1 infection in the mice lateral septum, under influence of contrasting environments. We examined the microglial responses to non-neurotropic peripheral dengue infection induced by a single intraperitoneal (i.p.) DENV1 injection. Moreover, the experimental animals were maintained either in a standard cage (mimicking sedentary life) or in an enriched cage (active life). Our results demonstrated that the sedentary-like and active murine models exhibited lateral septum differential microglial responses to systemic non-neurotropic infections by dengue virus.
Materials and Methods
Animals
Experiments were performed using adult female albino Swiss mice (10 months old at the beginning of inoculations) obtained from an outbred colony at the Animal Care Facility of the Evandro Chagas Institute. Our choice to use females was supported by the fact that some evidences have indicated female as more sensitive to early environmental changes than males.53,54 Mice were handled following the “Principles of Laboratory Animal Care” (National Institutes of Health [NIH]) and all procedures were approved by the institutional animal care committee of the Federal University of Pará (CEPAE-UFPA 221-14). Mice had free access to water and food and were maintained with 12-hr dark and light cycles, at a room temperature of 22 ± 2C.
Inoculum
Viral samples of D1 serotype from infected human serum were obtained from the Hemorrhagic Fever and Arbovirus Unit at Evandro Chagas Institute. To obtain virus-infected brain homogenates, we intracerebrally inoculated newborn mice with 0.01 ml of DENV1 viral suspension, which was the supernatant of infected C6-36 cell cultures that contained 1.7 × 10⁴ pfu/ml. Subjects were observed daily and, upon presenting with clinical signs, were sacrificed and immediately stored at −80C. Later, the brain tissue (0.2 g/animal) was macerated and mixed with 1.8 ml phosphate-buffered saline (PBS) containing 100 U/ml penicillin and 100 mg/ml streptomycin. This suspension was cleared by centrifugation at 10,000 G for 15 min at 4C, and 0.2 ml of the supernatant was used for i.p. inoculation of studied animals.
Viral RNA Isolation and Reverse Transcription PCR
Viral RNA was extracted from serum samples using the PureLink RNA Mini Kit (Ambion, Austin, TX) following the manufacturer’s protocol. Extracted RNA was quantified using a Qubit 2.0 fluorometer (Invitrogen, Carlsbad, CA) with a Qubit RNA BR Assay kit (Invitrogen) following the manufacturer’s instructions. From this viral RNA, we then synthesized cDNA using the EXPRESS One-Step Superscript qRT-PCR Universal kit (Invitrogen) with primers previously described. 55
Viral Load Determination by Quantitative Reverse Transcription PCR (RT-qPCR)
For viral load quantification, we constructed a standard curve using a plasmid generated by cloning the amplicon using the TOPO TA Cloning Kit (Invitrogen) following the manufacturer’s protocols. As previously described by Johnson, 11 we used primers specific for the DENV1 (Table 1). Competent bacterial cells (Escherichia coli strain TOP10F) were previously prepared via the calcium chloride method. 56 Plasmid DNA was extracted using a Miniprep DNA Purification System kit (Promega Corporation, Madison, WI) following the manufacturer’s instructions. We determined the concentration of recombinant plasmids containing D1 inserts using a Qubit 2.0 fluorometer (Invitrogen) with a Qubit dsDNA BR Assay kit (Invitrogen). Afterward, the clone was transcribed into RNA using Megascript Transcription T7 (Ambion, EUA).
Nucleotide Sequences Used to Detect and Quantify D1 and D4 Genome Copies.
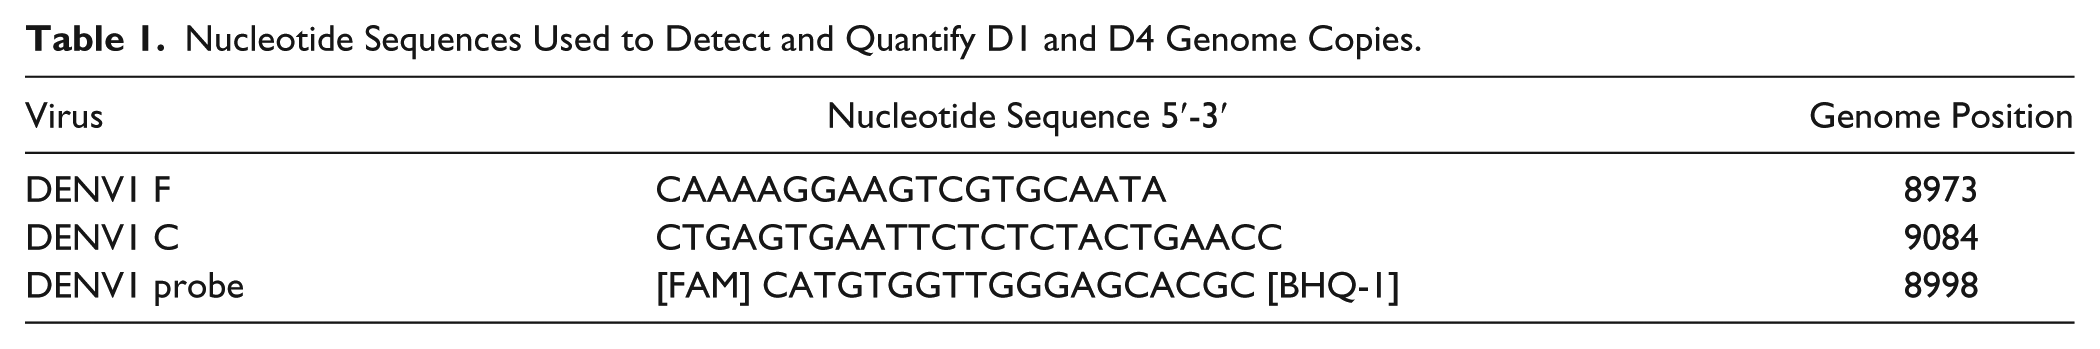
The primer pairs used to generate amplicons were the same used for reverse transcription, employing the same protocol and commercial kits as described above. The generated amplicon was serial diluted for cDNA quantification. TaqMan RT-qPCR was performed during the assay using the ABI Prism 7500 Sequence Detection System (Applied Biosystems, Foster City, CA). Thermal cycling conditions were as follows: one cycle at 50C for 2 min, followed by 45 cycles at 95C for 10 min, 95C for 15 sec, and 56C for 1 min. D1 viral load were expressed as viral particles/ml based on the standard curve constructed using serial dilutions of plasmids containing the D1 inserts at concentrations ranging from 8 × 101 to 8 × 10⁷ viral particles/µl.
Each animal received 0.2 ml i.p. of either DENV1 infected brain homogenate or normal brain homogenate. DENV1-infected brain samples contained 418,722 virus copies/ml. At day 7 postinfection, blood samples were collected from all animals to estimate viral load and tumor necrosis factor-α (TNFα) mRNA.
Housing and Inoculations
Female albino Swiss mice were raised from the age of 2 to 10 months, either in standard cages (standard environment [SE]; n=28) or in an enriched cage (EE, n=25). The standard laboratory cages were single-level plastic cages (32 × 39 × 100 cm) without equipment or toys, housing 15 to 20 young mice. The EE was a two-level wire cage (100 × 50 × 100 cm) equipped with ropes, rod bridges, tunnels, running wheels, and toys. The toys were made of plastic, wood, and metal of different colors, and were periodically changed. Each enriched cage housed 15 to 20 young mice. The mice were obliged to move from one compartment to another for drinking and eating. All animals remained on SE or EE throughout the experiment timeline.
All animals were i.p. challenged with 0.2 ml of infected brain homogenate viral suspension (1:25 dilution v/v in 100 U/ml penicillin, 100 mg/ml streptomycin) or with normal uninfected brain homogenate as a control (10% v/v in 100 U/ml penicillin, 100 mg/ml streptomycin). After injection with the DENV1-infected brain homogenate, all animals were housed in their original cages. Infected brain homogenate was previously used to induce virus infection in both neonate and adult mice,23,26,36 and the results were compared with control animals which were injected with normal brain homogenate. We followed these previous protocols in the present report.
Histology and Immunohistochemistry
At the time of sacrifice, the mice were weighed and anesthetized with i.p. 2,2,2 tribromoethanol (0.04 ml/g of body weight). They were then transcardially perfused with heparinized saline, followed by 4% paraformaldehyde in 0.1 M phosphate buffer (pH 7.2–7.4). Serial sections with a thickness of 70 µm were obtained using a Vibratome (Leica VT1000, Milton Keynes, UK) and were stored in 2% paraformaldehyde, at 4C, until immunohistochemical processing. To assess the distribution of DENV viral antigens and microglia in the mouse brain during different time windows, we performed immunohistochemical analysis on all infected animals and on five uninfected controls. Specific antibodies against DENV virus species were produced by the Department of Arbovirus and Hemorrhagic Fevers at the Evandro Chagas Institute, as described elsewhere.57,58 Briefly, free-floating sections were rinsed in 0.1 M phosphate buffer and incubated in a solution of 0.2 M boric acid (pH 9.0) at 70C for 1 hr for antigen retrieval. The sections were then rinsed in 0.1 M PBS with 5% Triton X-100, incubated for 15 min in a solution of 0.3% hydrogen peroxide, and again washed in PBS. To block unspecific biding, slices were incubated with a casein solution (Vector Laboratories, Burlingame, CA) (10% in phosphate buffer saline), followed by incubation with primary antibody for 72 h at 4C, with continuous gentle agitation. We used the following primary antibodies and dilutions: anti-IBA-1 (2 µg/ml) (Wako Chemicals, Richmond, VA), anti-D1, and anti-D4 (Instituto Evandro Chagas, PA, Brazil) 1:100 in 0.1 M phosphate buffer saline (pH 7.2–7.4). Sections were then incubated in Biotinylated horse anti-Mouse IgG Reagent (for DENV primary antibody) and Biotinylated horse anti-Rabbit IgG Reagent (for IBA-1 primary antibody) for 12 hr, washed in PBS, and transferred to avidin-biotin-peroxidase complex (ABC) solution (Vector Laboratories, Burlingame, CA) for 1 hr. Sections were washed again and then incubated for 5 min in 0.2 M acetate buffer (pH 6.0), and finally revealed in GND solution (diaminobenzidine 0.6 mg/ml, ammonium nickel chloride 2.5 mg/ml, and glucose oxidase). All steps were conducted under gentle and constant agitation. As a negative control, normal horse serum was added to some slides in place of each primary antibody and slides were processed for immunofluorescence or immunohistochemistry as previously described.
Immunofluorescence
The sections were incubated overnight with polyclonal antibody against DENV NS1 glycoprotein (ab41616, dilution 1:20; Abcam, Cambridge, MA), followed by incubation with fluorescein-labeled secondary antibodies for 1 hr at room temperature. Then indirect immunofluorescence was used to reveal fluorescein-labeled viral antigens (green). All dengue virus serotypes react with DENV NS1 glycoprotein. Some of the immunofluorescence-labeled sections were counterstained with ethidium bromide to reveal DNA (red).
Microglial Cell 3D Reconstruction and Quantitative Morphology
Brain sections were analyzed using a NIKON Eclipse 80i microscope (Nikon, Japan), equipped with a motorized stage (MAC6000; Ludl Electronic Products, Hawthorne, NY). Microglia from the lateral septum were analyzed under oil immersion using a high-resolution, 100× oil immersion, plan fluorite objective (Nikon, NA 1.3, DF = 0.19 µm). The borders of the lateral septum were those shown previously. 59 Images were acquired with Neurolucida software (MBF Bioscience Inc., Frederick, MD). Although shrinkage in the z-axis is not a linear event, the utilized software corrected for this effect based on previous evidence of 75% shrinkage in the z-axis. 60 Without correction, this shrinkage would significantly distort the length measurements along this axis. We performed 3D analysis only on cells with dendritic trees that were unequivocally complete, discarding cells if the dendrite branches appeared artificially cut or not fully immunolabeled. Terminal branches were typically thinner.
We included 17 variables obtained by 3D reconstruction: number of segments, number of trees, branch length, branch surface, branch volume, branch complexity, number of spines, spine volume, number of varicosities, density of segments, tortuosity, average base diameter, planar angle, vertex, K-dim, convex hull surface, and convex hull volume. To determine whether the changes reflected discrete or continuous alterations in morphology, we used previously described statistical methods. 45 We estimated the multimodality index (MMI) based on skewness and kurtosis of our sample for each morphometric variable as previously defined: MMI = (M3 +1) / (M4 + 3), where M3 is skewness, M4 is kurtosis, and n is sample size.61,62 Kurtosis and skewness describe the shape of the data distribution and enable differentiation between unimodal, bimodal, or multimodal curves. Multimodal data sets are essential for separating a cell population into different cell types. 62
We found that few microglial morphological features showed an MMI greater than 0.55 (Table S1), indicating that the distribution was at least bimodal and potentially multimodal. These features—complexity, branch volume, varicosity, and spine volume—were selected for cluster analysis as previously described. 62 To illustrate the classification generated by cluster analysis, we used Ward’s method with standardized variables, square Euclidian distances, and a tree diagram (dendrogram). We applied discriminant analysis to investigate differences among groups generated by cluster analysis and to discard variables that were not strongly related to group distinction. Discriminant analysis derives an equation as a linear combination of the independent variables (quantitative morphometric features) that will best discriminate between the groups (qualitative microglial morphological phenotypes). Detailed information about discriminant analysis can be found at https://www.researchgate.net/file.PostFileLoader.html?id=54eb12afef97130f298b4576&assetey=AS%3A273713604300800%401442269816239
All microglia reconstructed in the interest area were measured multiple times, and data obtained with Neurolucida were processed using dedicated software (Neuroexplorer, MicroBright Field Inc., Williston, VT). These morphological parameters were used to investigate possible features shared by lateral septum microglia. For detailed information and definitions, please see http://mbfbioscience.com/technical-support-center.
Microglia Morphometry and Statistical Analyses
To investigate the presence of morphological features shared by the 3D microglial cell reconstructions within each experimental group, we subjected all morphometric microglial quantitative variables to an initial multivariate cluster analysis, including all subjects from all experimental groups. Cluster analysis involves grouping a set of objects of interest, such that objects in the same cluster are more like each other than those in other clusters. Cluster analysis requires at least two variables (in this study, microglia morphometric features) with MMIs higher than 0.55 inside each experimental group.
Distinct microglial classes were defined based on morphological similarities, as suggested by cluster analysis, and were further assessed with a forward stepwise discriminant function analysis, performed using Statistica 7.0 (Statsoft, Tulsa, OK). Discriminant function analysis is used to identify the variables that discriminate between two or more naturally occurring clusters by determining whether clusters differ about the mean of a variable and then using that variable to predict cluster membership. We further calculated the arithmetic mean and standard deviation for the variables found to be the best predictors for the microglial clustering groups.
Stereology
We delineated at all levels in the histological sections the region of lateral septum, digitizing directly from sections using low power 4× objective on a NIKON Eclipse 80i microscope (Nikon, Japan), equipped with a motorized stage (MAC6000, Ludl Electronic Products, Hawthorne, NY). This system was coupled to a computer running Stereoinvestigator software (MicroBrightField, Williston, VT) used to store and analyze x, y, and z coordinates of digitized points. To detect and count unambiguously the objects of interest in the dissector probe, low power objective was replaced by a plan fluorite objective (Nikon, NA 1.3, DF = 0.19 µm) to count IBA-1 microglia. At each counting site, the thickness of the section was carefully assessed using the high-power objective and the fine focus of the microscope to define the immediate defocus above (top of section) and below (bottom). Because both the thickness and the distribution of cells in the section were uneven, we estimated the total number of objects of interest based on the number weighted section thickness. We have used selective IBA-1 marker of microglia in anatomical serial of sections to unambiguously distinguish all objects of interest. All sampled objects that came into focus inside the counting frame were counted and added to the total marker sample, provided they are entirely within the counting frame or intersects the acceptance lines without touching the rejection lines. 63 The counting boxes were random and systematically placed within a grid previously defined. Grid sizes of sampling were adopted to achieve an acceptable coefficient of error (CE). The calculation of the CE for the total cell counts of each subject in the present study adopted the one-stage systematic sampling procedure (Scheaffer CE) that has been used previously and validated elsewhere. 64 The level of acceptable errors of the stereological estimations was defined by the ratio between the intrinsic error introduced by the methodology and the coefficient of the variation.64,65 The CE expresses the accuracy of the cell number estimates, and a value of CE ≤ 0.05 was deemed appropriate for the present study because variance introduced by the estimation procedure contributes little to the observed group variance. 65 The experimental parameters for each cell marker and regions were established in pilot experiments and uniformly applied to all animals for each marker.
The determination of cell number in the optical fractionator method is based on a random and systematic distribution of counting blocks in a series of section containing the region of interest, all of them with the same probability of being sampled. The optical fractionator determines the number of cells multiplying the number of objects identified inside each counting box by the values of three ratios: (1) the ratio between the number of sections sampled and the total number of sections (section sampling fraction [ssf]), (2) the ratio of the counting box and the area of the grid (area sampling fraction [asf]), and (3) the ratio between the height of the counting frame and the section thickness after histological procedures (thickness sampling fraction [tsf]). Thus, the total number of cells for each marker was obtained by the following equation:
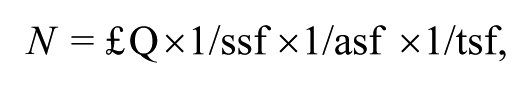
where N is the total number of cells and ΣQ is the number of counted objects. 66
Photomicrography
Photomicrographs were obtained using a digital camera (AxioCam–ERc, Zeiss, Gottingen, Germany) coupled to a NIKON Eclipse 80i microscope. Digital photomicrographs were processed using Adobe Photoshop software, and scaling and brightness and contrast adjustments were applied to the whole image. To illustrate morphological differences between microglia of each experimental group, we selected 3D microglial reconstructions with morphometric values close to the mean values for individual cells within each group. All 3D microglial reconstructions were performed using images taken at 8 dpi.
TNFα mRNA Quantification by RT-PCR
To quantify TNFα mRNA, we used the commercial kit GoTaq 2-Step Bryt RT-qPCR System (Sigma). The first step consisted of reverse transcription using random primers and MMLV enzyme (Invitrogen) as suggested by the manufacture. Then, we applied the quantitative PRC using a ViiA 7 platform (Life Technologies). To this step, we used the following initiators: TNFα F: AGGGGCCACCACGCTCTTCT, sense; TNFα R: GCTACGACGTGGGCTACAGGC, nonsense, as endogenous control. The mRNA relative amount was calculated and normalized based on the correspondent transcribed mRNA endogenous control.
The quantification of mRNA expression levels was based on the following mathematical equation: R = 2 – ∆∆Ct, obtained from
Results
Microglia From Lateral Septum of EE Mice Infected With Dengue Virus Showed Smaller Morphological Changes
First, the borders of the lateral septum were those shown previously (see Fig. 1A). 67 For 3D microglia reconstructions in the septal area, the most ventral sampled section included the septal region limited laterally and posteriorly by the lateral and third ventricles. The most dorsal sampled section was selected by choosing the very first dorsal section of the same series, where the septal region could still be recognized between the corpus callosum and the hippocampal fimbria. To guarantee that all regions of the area of interest had the same probability of inclusion among the analyzed samples, we took systematic and random samples from the whole dorsoventral series of sections containing the lateral septum. 68 As shown in Fig. 1B, boxes inside the outlined lateral septum indicated sites from which we selected single microglia for 3D reconstruction. Using this systematically blinded and randomized sampling methodology, we reconstructed 544 microglial cells from four experimental groups comprising adult individuals raised in standard (n=284) or enriched (n=260) cages, with dengue infections (SE-D1, n=142; EE-D1, n=148) and without dengue infections (SE, n=142; EE, n=112). Figure 1C to F shows immunofluorescence pictures of brain and lung sections of infected (C and E) and uninfected (D and F) mice. Virus antigens can be seen only in lungs (green) but not in the brain parenchyma. DNA staining is exhibited with propidium iodide staining (red).
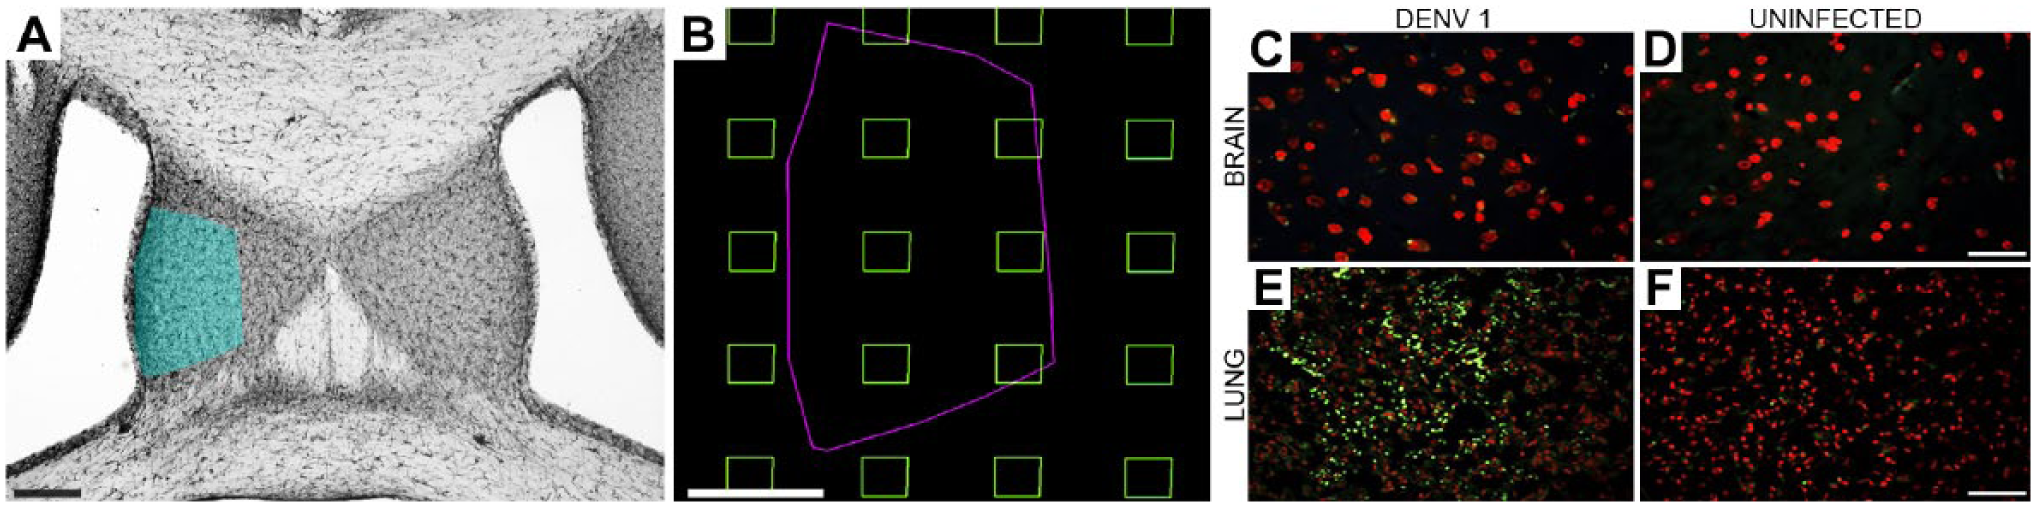
Area of interest is indicated as blue-shaded area over an IBA-1-immunolabeled section of the lateral septum (A), random and systematically sampling approach (B), and immunofluorescence virus antigens labeling (C–F). Lung but not brain sections of DENV1 infected mice were immunopositive for virus antigens (green dots). Propidium iodide staining was used for DNA labeling (red C–F). Scale bars A =125, B = 180, C = 50, D = 50, E = 50, and F = 50 µm.
We further immunostained septal sections with IBA-1 to illustrate microglia morphologies for 7 days after infection and compared them with that of control mice (Fig. 3). The 3D reconstructions illustrated the effects of single DENV1 serotype infection on microglial morphology in the lateral septum of mice maintained either in the standard laboratory cages or in the enriched cage environment (Fig. 2).
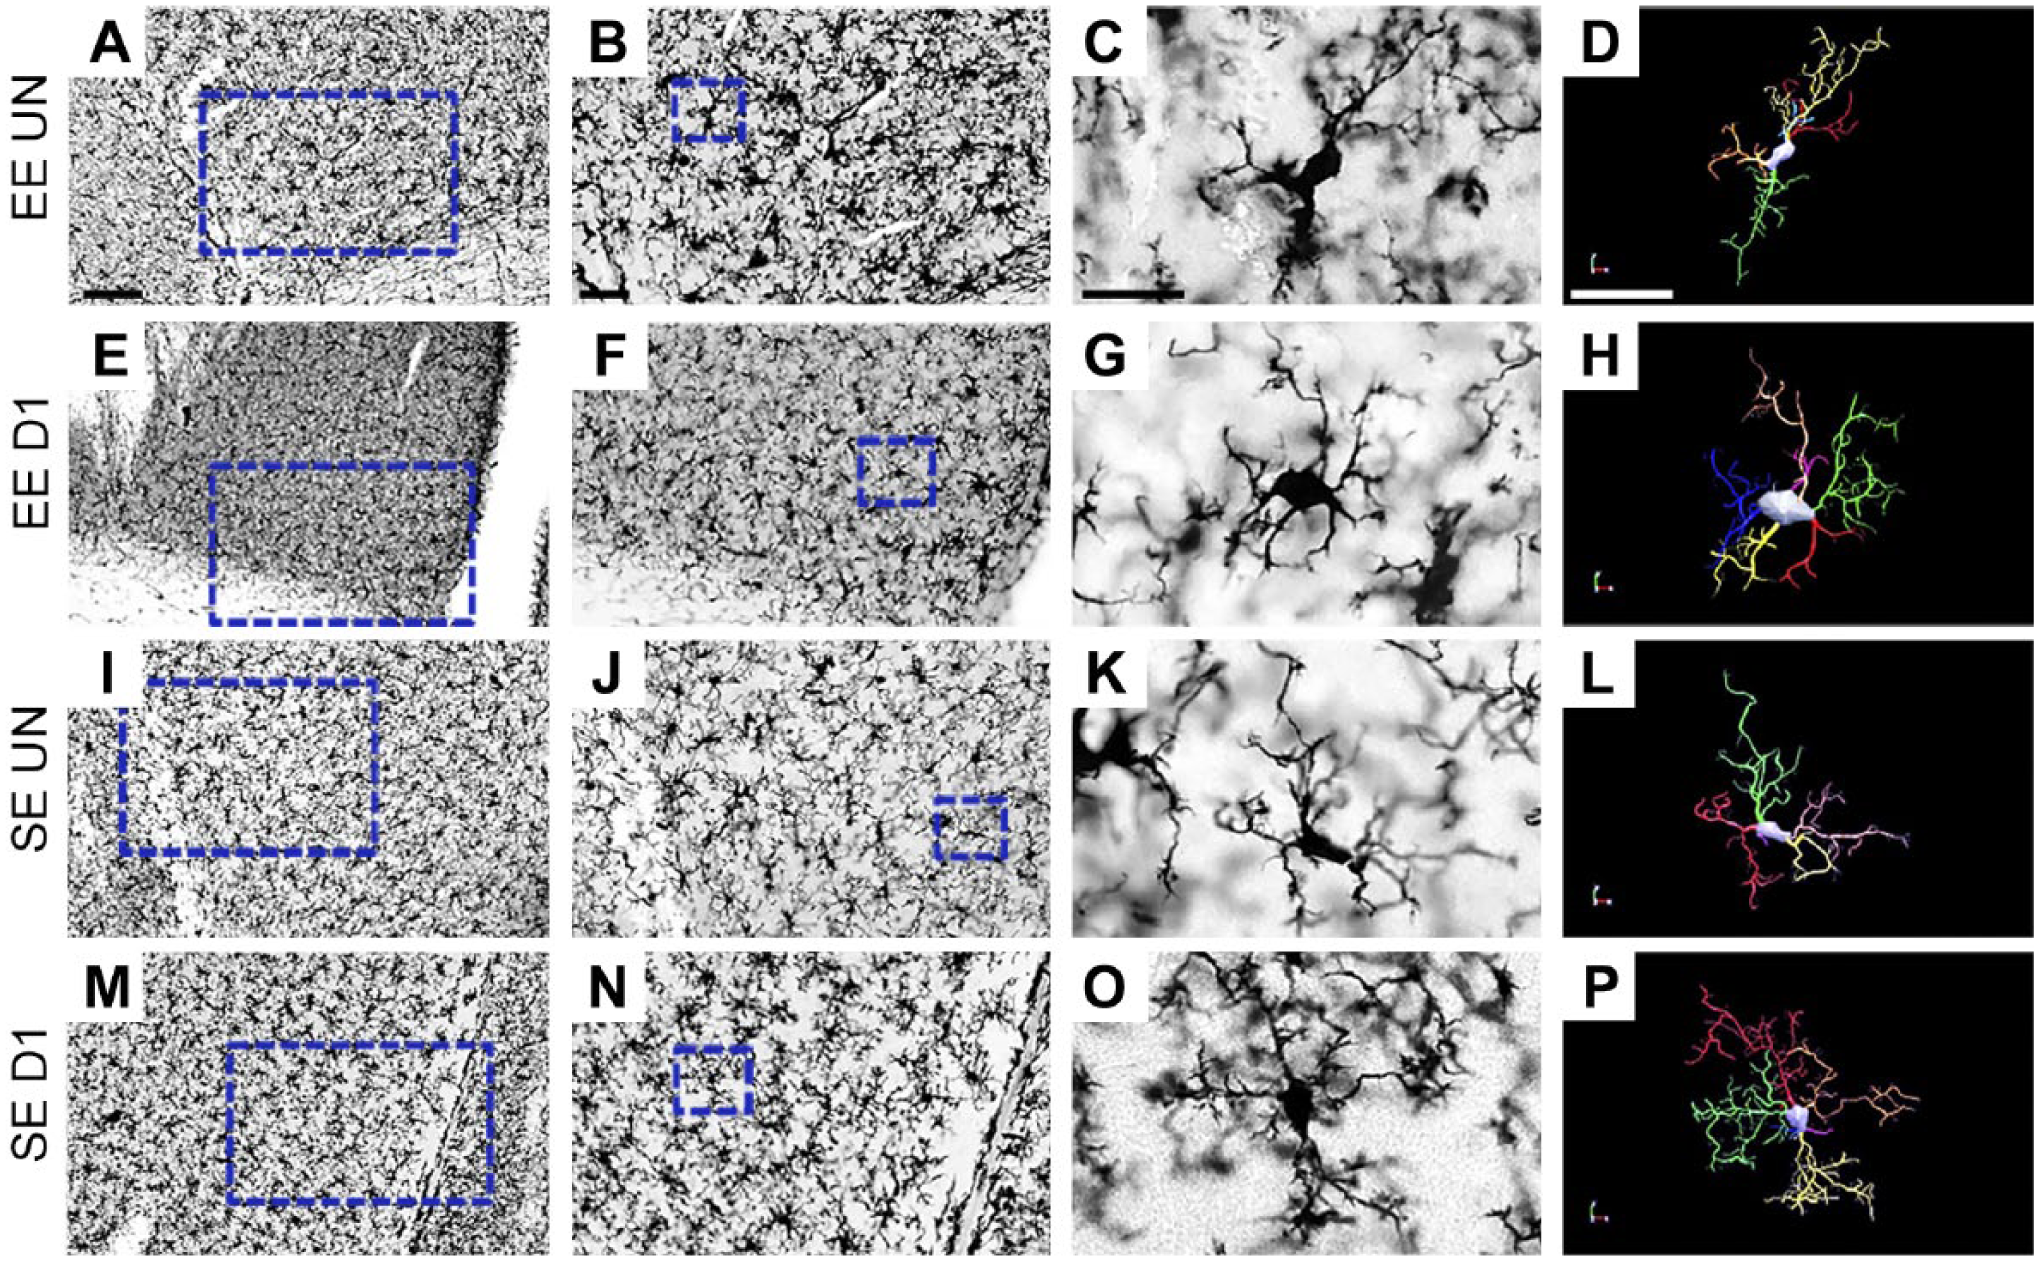
Low (A, E, I, and M), medium (B, F, J, and N), and high-power (C, G, K, and O) photomicrographs of IBA-1-immunolabeled sections of the lateral septum of controls uninfected (EE UN and SE UN) and infected mice (EE D1 and SE D1). Three-dimensional microscopic reconstructions (D, H, L, and P) of IBA-1-immunopositive cells correspond to the photomicrographs on the left side of the panel. Scale bars A, E, I, M = 125; B, F, J, N = 50; C, G, K, O = 25; D, H, L, P = 25 µm. Abbreviations: EE, enriched environment; SE, standard environment.
Microglia in Fig. 2 were selected to illustrate the appearance of IBA-1 immunolabeling and correspondent 3D microglia reconstructions. Their morphometry was closer to that of mean microglia measurements of each group. In general, microglia from SE lateral septum infected mice (SE D1) showed more complex arbors and higher number of segments compared with control mice (SE UN). Lateral septum microglia from EE mice (EE D1) showed smaller morphological changes as compared with correspondent control (EE UN).
Hierarchical Cluster Analysis of Microglia From Lateral Septum Revealed Two Different Cell Morphotypes
Hierarchical cluster analysis of morphometric features of each experimental group revealed two morphological phenotypes in control mice (SE UN and EE UN). On average, the type-I and type-II cell clusters showed quite distinct cell morphologies. Dendrograms of the 3D reconstructions are particularly useful for visualizing the differences in the number of processes between type I and type II and between control and infected mice microglia (Figs. 3 and 4). These phenotypes were detected in mice from all groups of SE and in control uninfected groups of EE. Microglia exhibiting processes with significantly smaller complexity values were designated as type I as compared with type II. Complexity was, by far, the morphometric feature that most contributed to cluster formation.
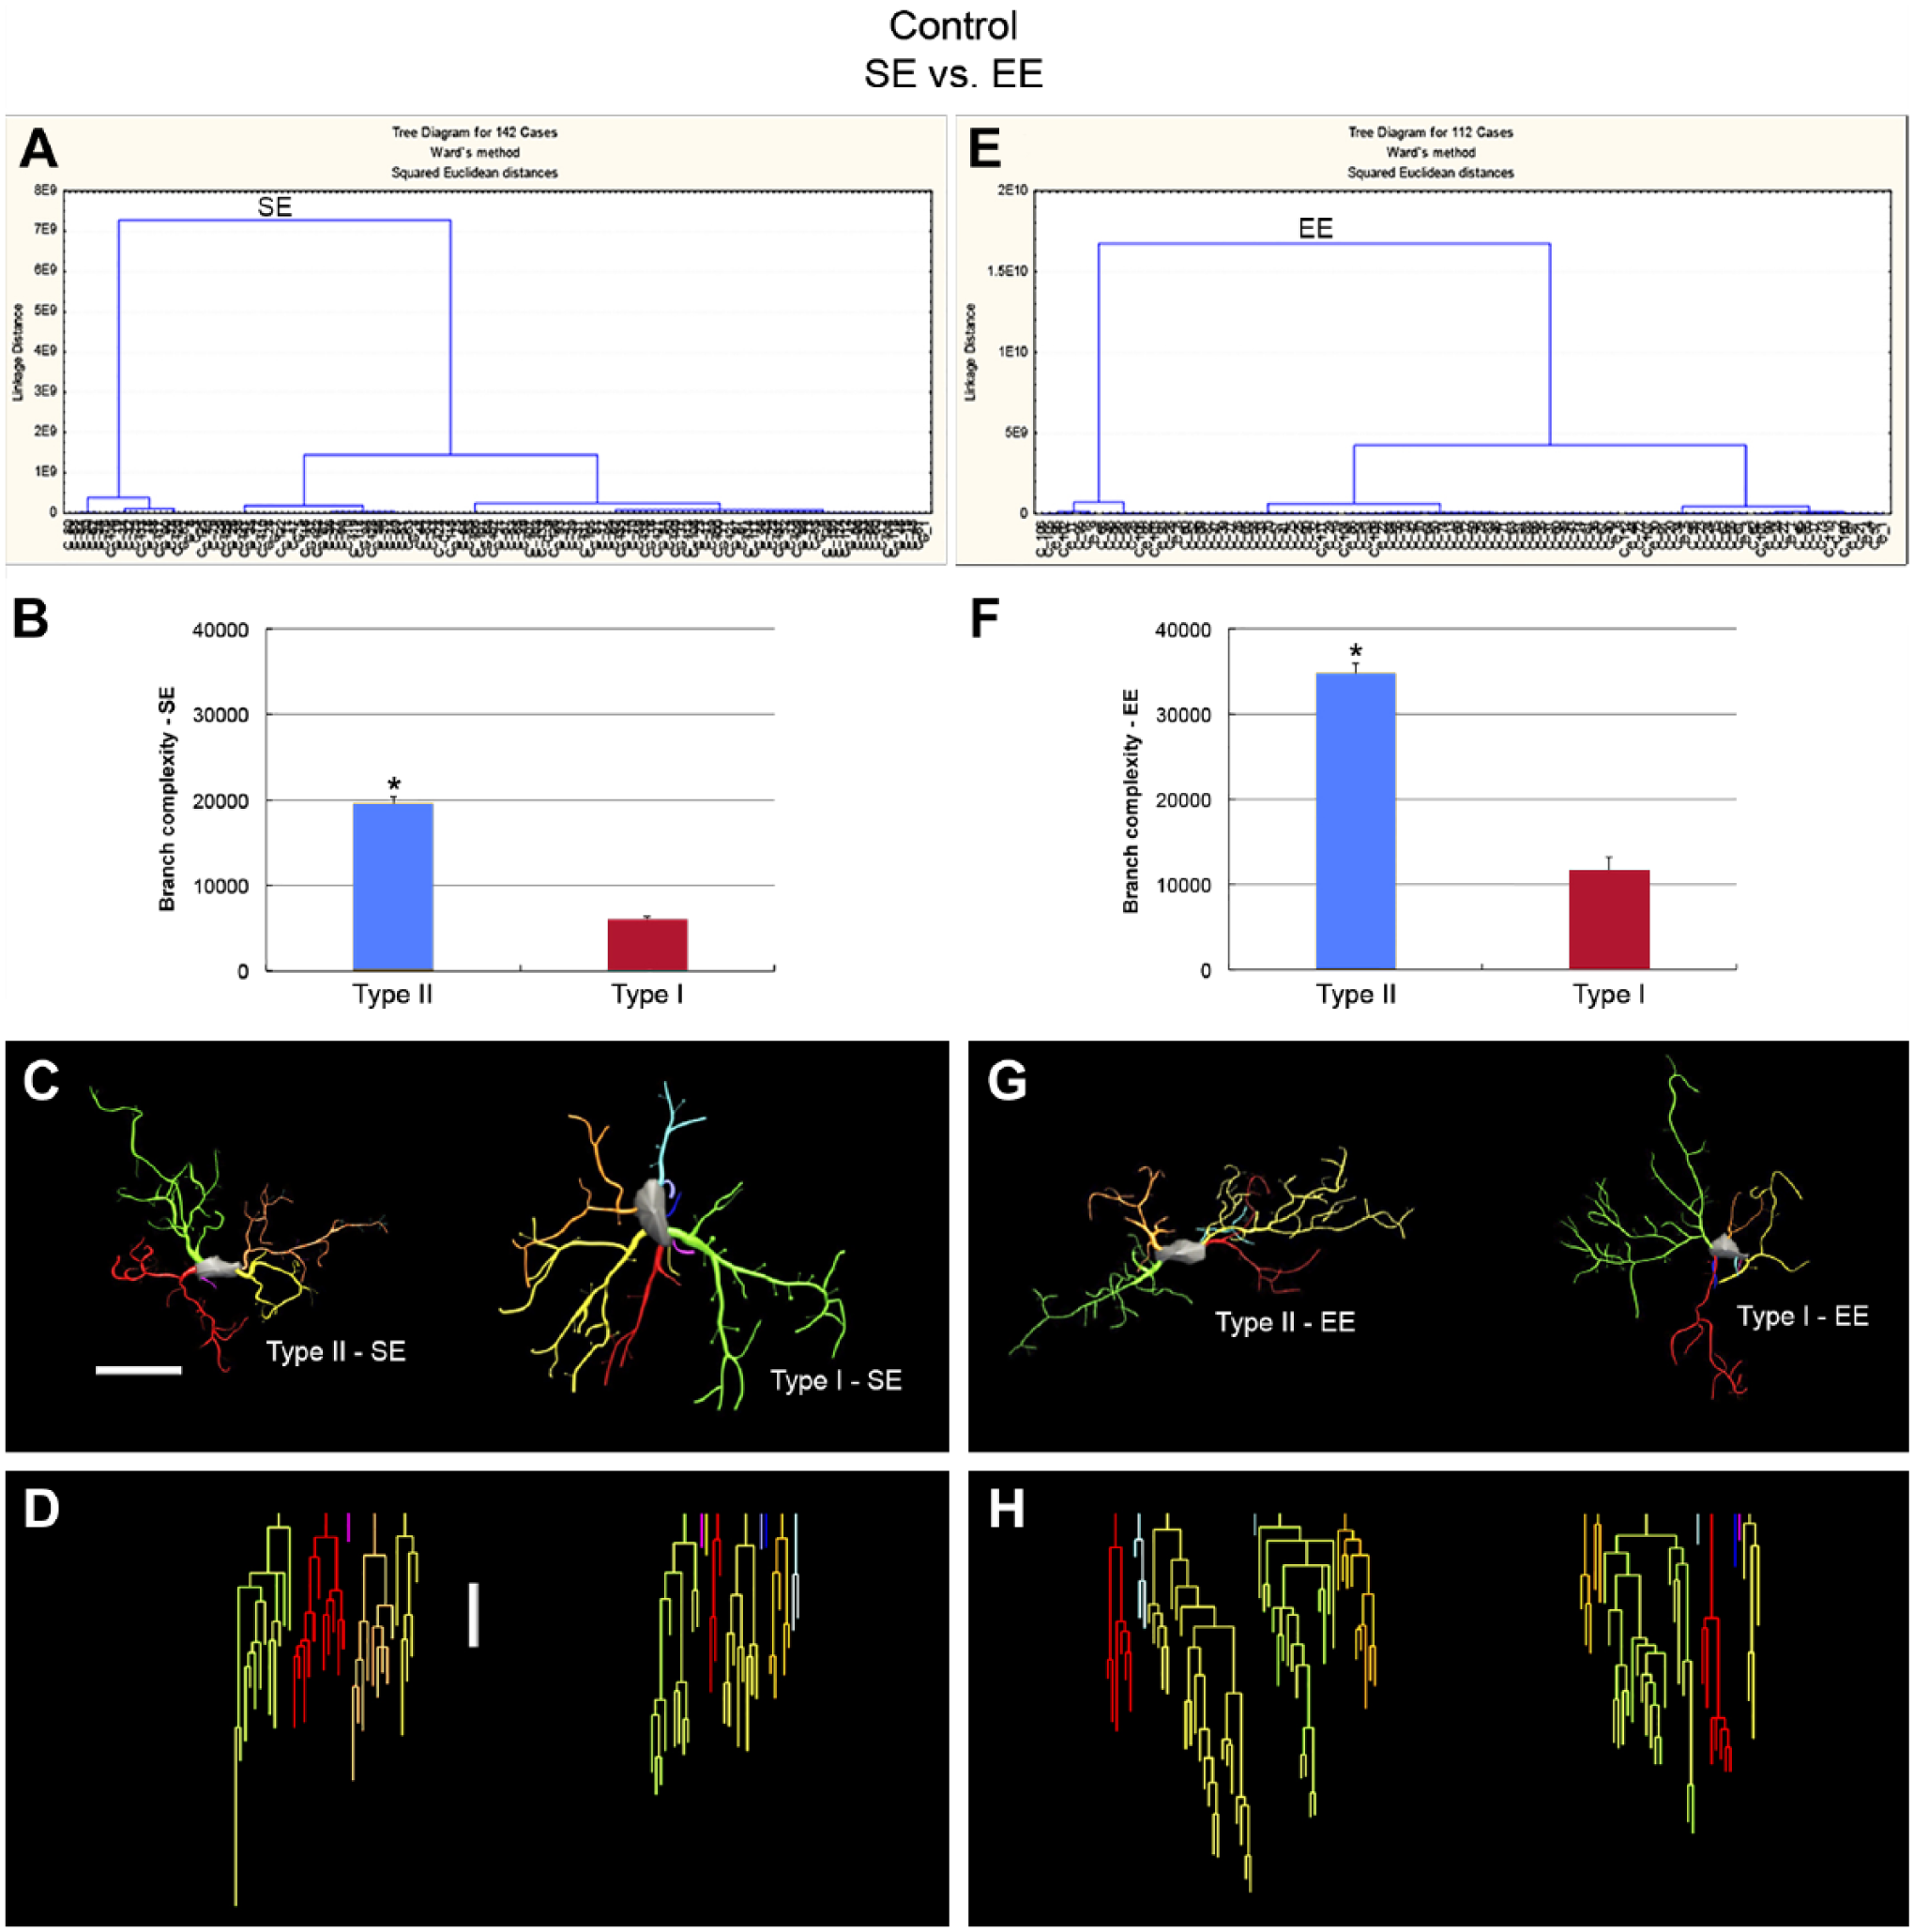
The morphological phenotypes of microglia in the lateral septum of control uninfected individuals maintained in contrasting environments (SE vs. EE). Cluster and discriminant analyses (Ward’s method) were performed after three-dimensional reconstructions of microglia from five mice. (A and E) Dendrogram groupings of 142 from SE (left) and 112 from EE (right) microglia identified two main morphological phenotypes, type I and type II. (B and F) Graphic representation of complexity mean values and corresponding standard errors illustrates the significant differences between type I and type II microglia of SE (left) and EE (right). (C–H) Three-dimensional reconstructions and correspondent dendrograms of type II and type I microglia from SE (left) and EE (right). The variable that contributed the most to cluster formation was complexity. Type I microglia (red bars) showed lower complexity mean values than type II microglia (blue bars). Microglia were reconstructed from both the dorsal and ventral regions of the lateral septum; cluster analysis was based on multimodal or at least bimodal morphometric features of the microglia (MMI > 0.55); *p<0.05 or less. Scale bars = 10 µm. Abbreviations: SE, standard environment; IE, enriched environment; MMI, Multimodality Index.
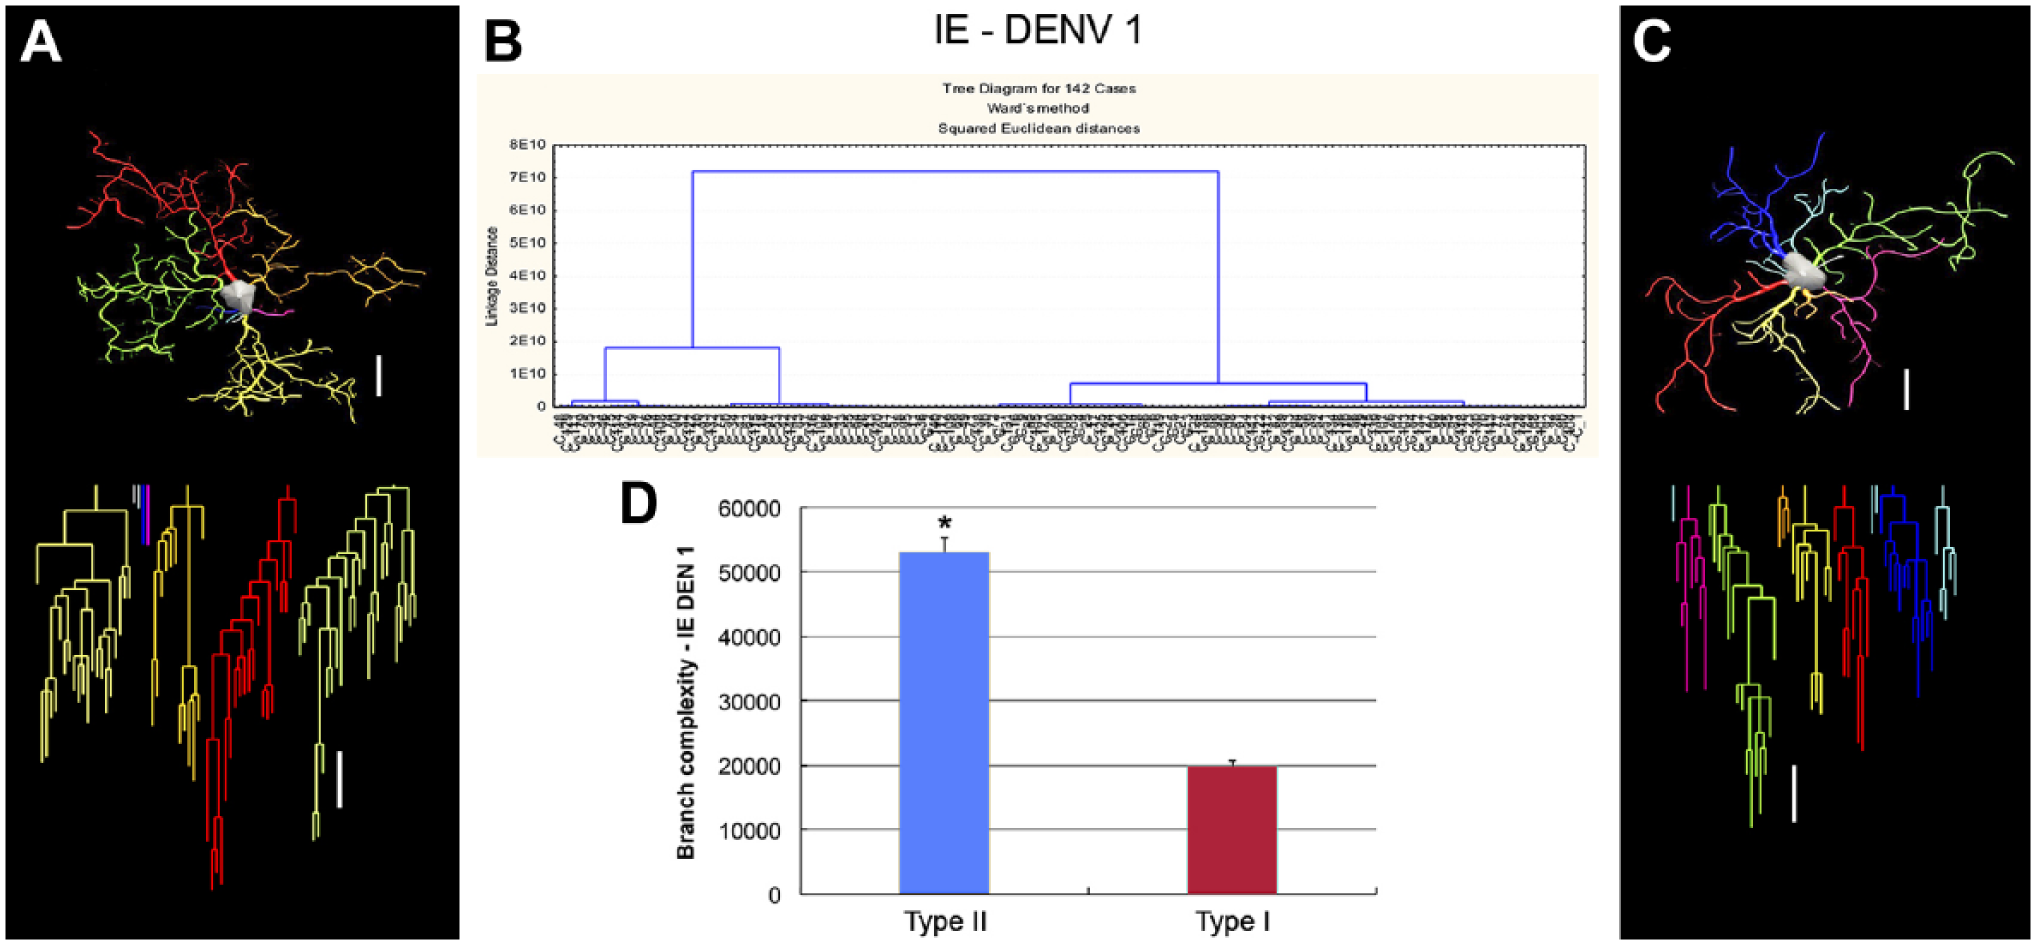
The morphological phenotypes of microglia in the lateral septum of DENV1 infected mice maintained in standard environment (SE–DENV1). Cluster and discriminant analyses (Ward’s method) were performed after three-dimensional reconstructions of microglia from five mice. (B) Dendrogram groupings of 142 from SE microglia identified two main morphological phenotypes, type I and type II. A and C are three-dimensional reconstructions and correspondent dendrograms of microglia from the lateral septum representing type II (A) and type I (C). (D) Graphic representation of complexity mean values and corresponding standard errors to illustrate the significant differences between type II and type I microglia of SE infected mice. The variable that contributed the most to cluster formation was complexity. Type I microglia (red bar) showed lower complexity mean values than type II microglia (blue bar). Microglia were reconstructed from both the dorsal and ventral regions of the lateral septum; cluster analysis was based on multimodal or at least bimodal morphometric features of the microglia (MMI > 0.55); *p<0.05 or less. Scale bars = 10 µm. Abbreviations: SE, standard environment; IE, enriched environment; MMI, Multimodality Index.
In contrast, we did not detect any multimodal variables among the morphological features of microglia from two groups of infected mice maintained in enriched cages; thus, cluster analysis was not applied to classify cells in these groups and cells from these two groups were mentioned as UNCLASSIFIED in our reports.
Figures 5 and 6 show all other significant differences between microglia morphometric features of uninfected and infected mice. Notice that morphometric features of both type I and type II microglia are influenced by environmental changes and infection and that the magnitude of these changes were higher in SE than in EE mice.
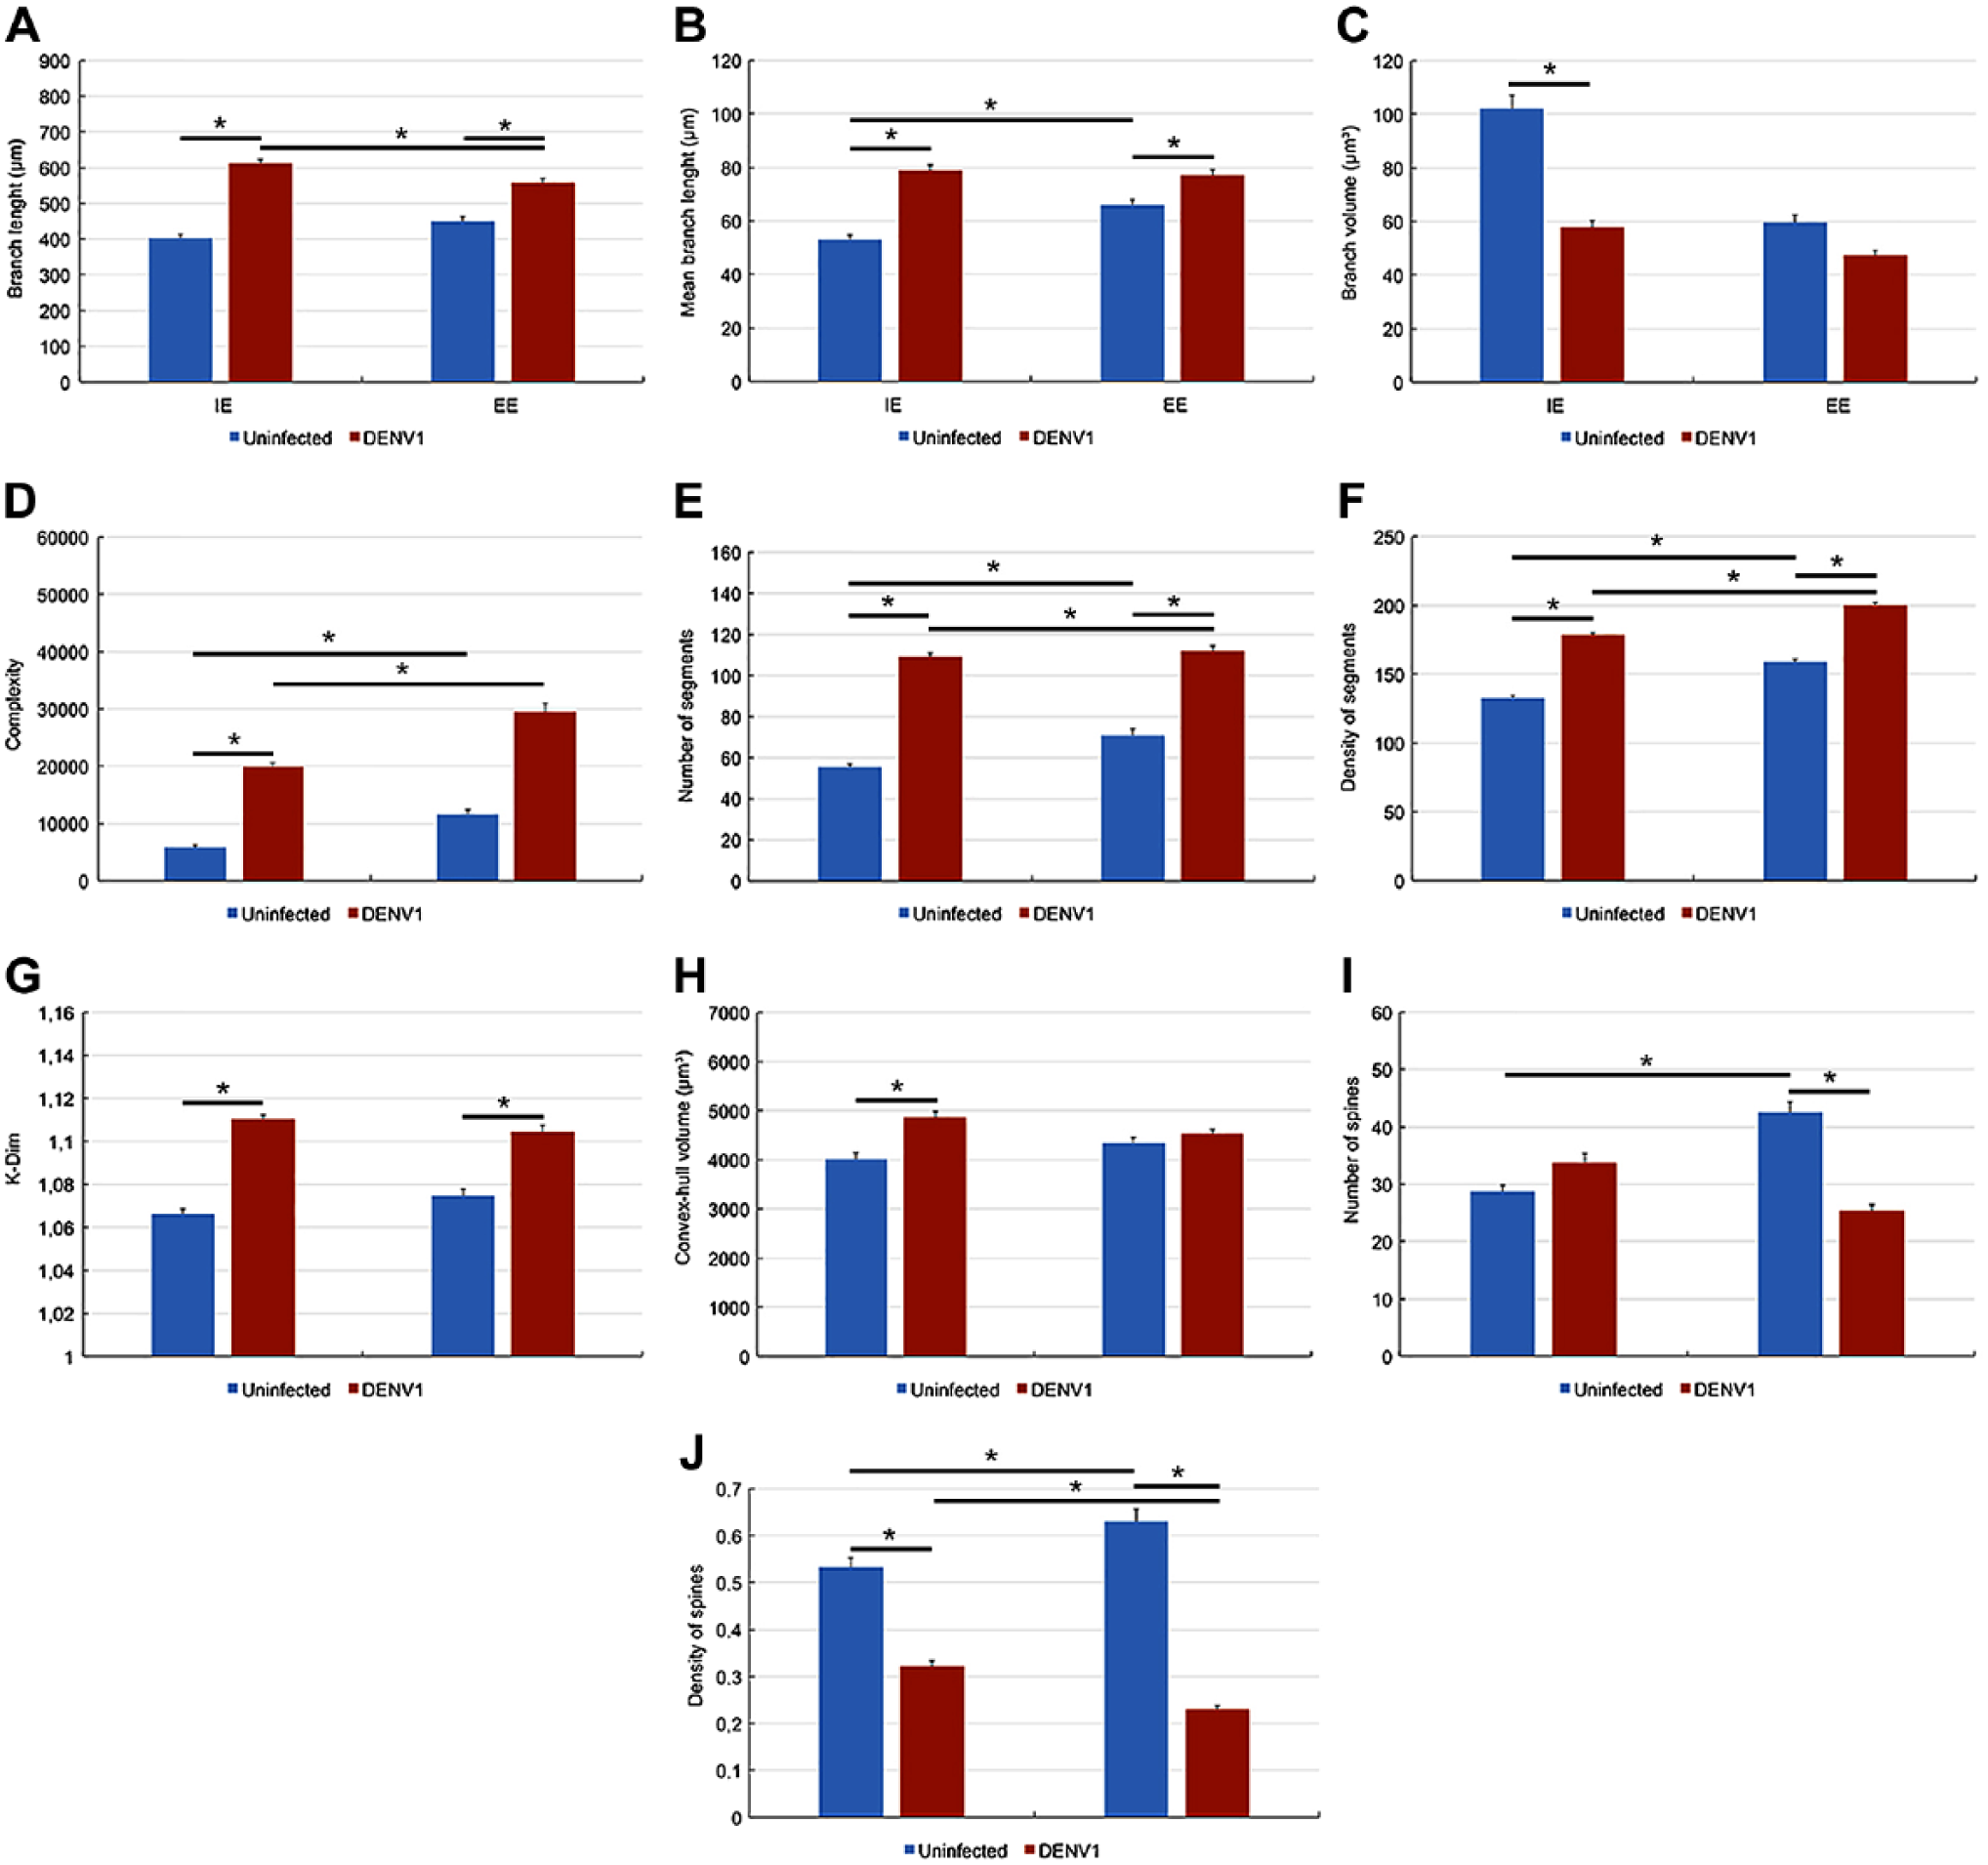
Graphic representations to illustrate significant differences between lateral septum microglia morphometric features of uninfected (blue bars) and infected (red bars) mice. Two-way ANOVA demonstrated that environment and infection contributed to the differences indicated by bar connectors. Abbreviation: EE = enriched environment. *p<0.05 or less.
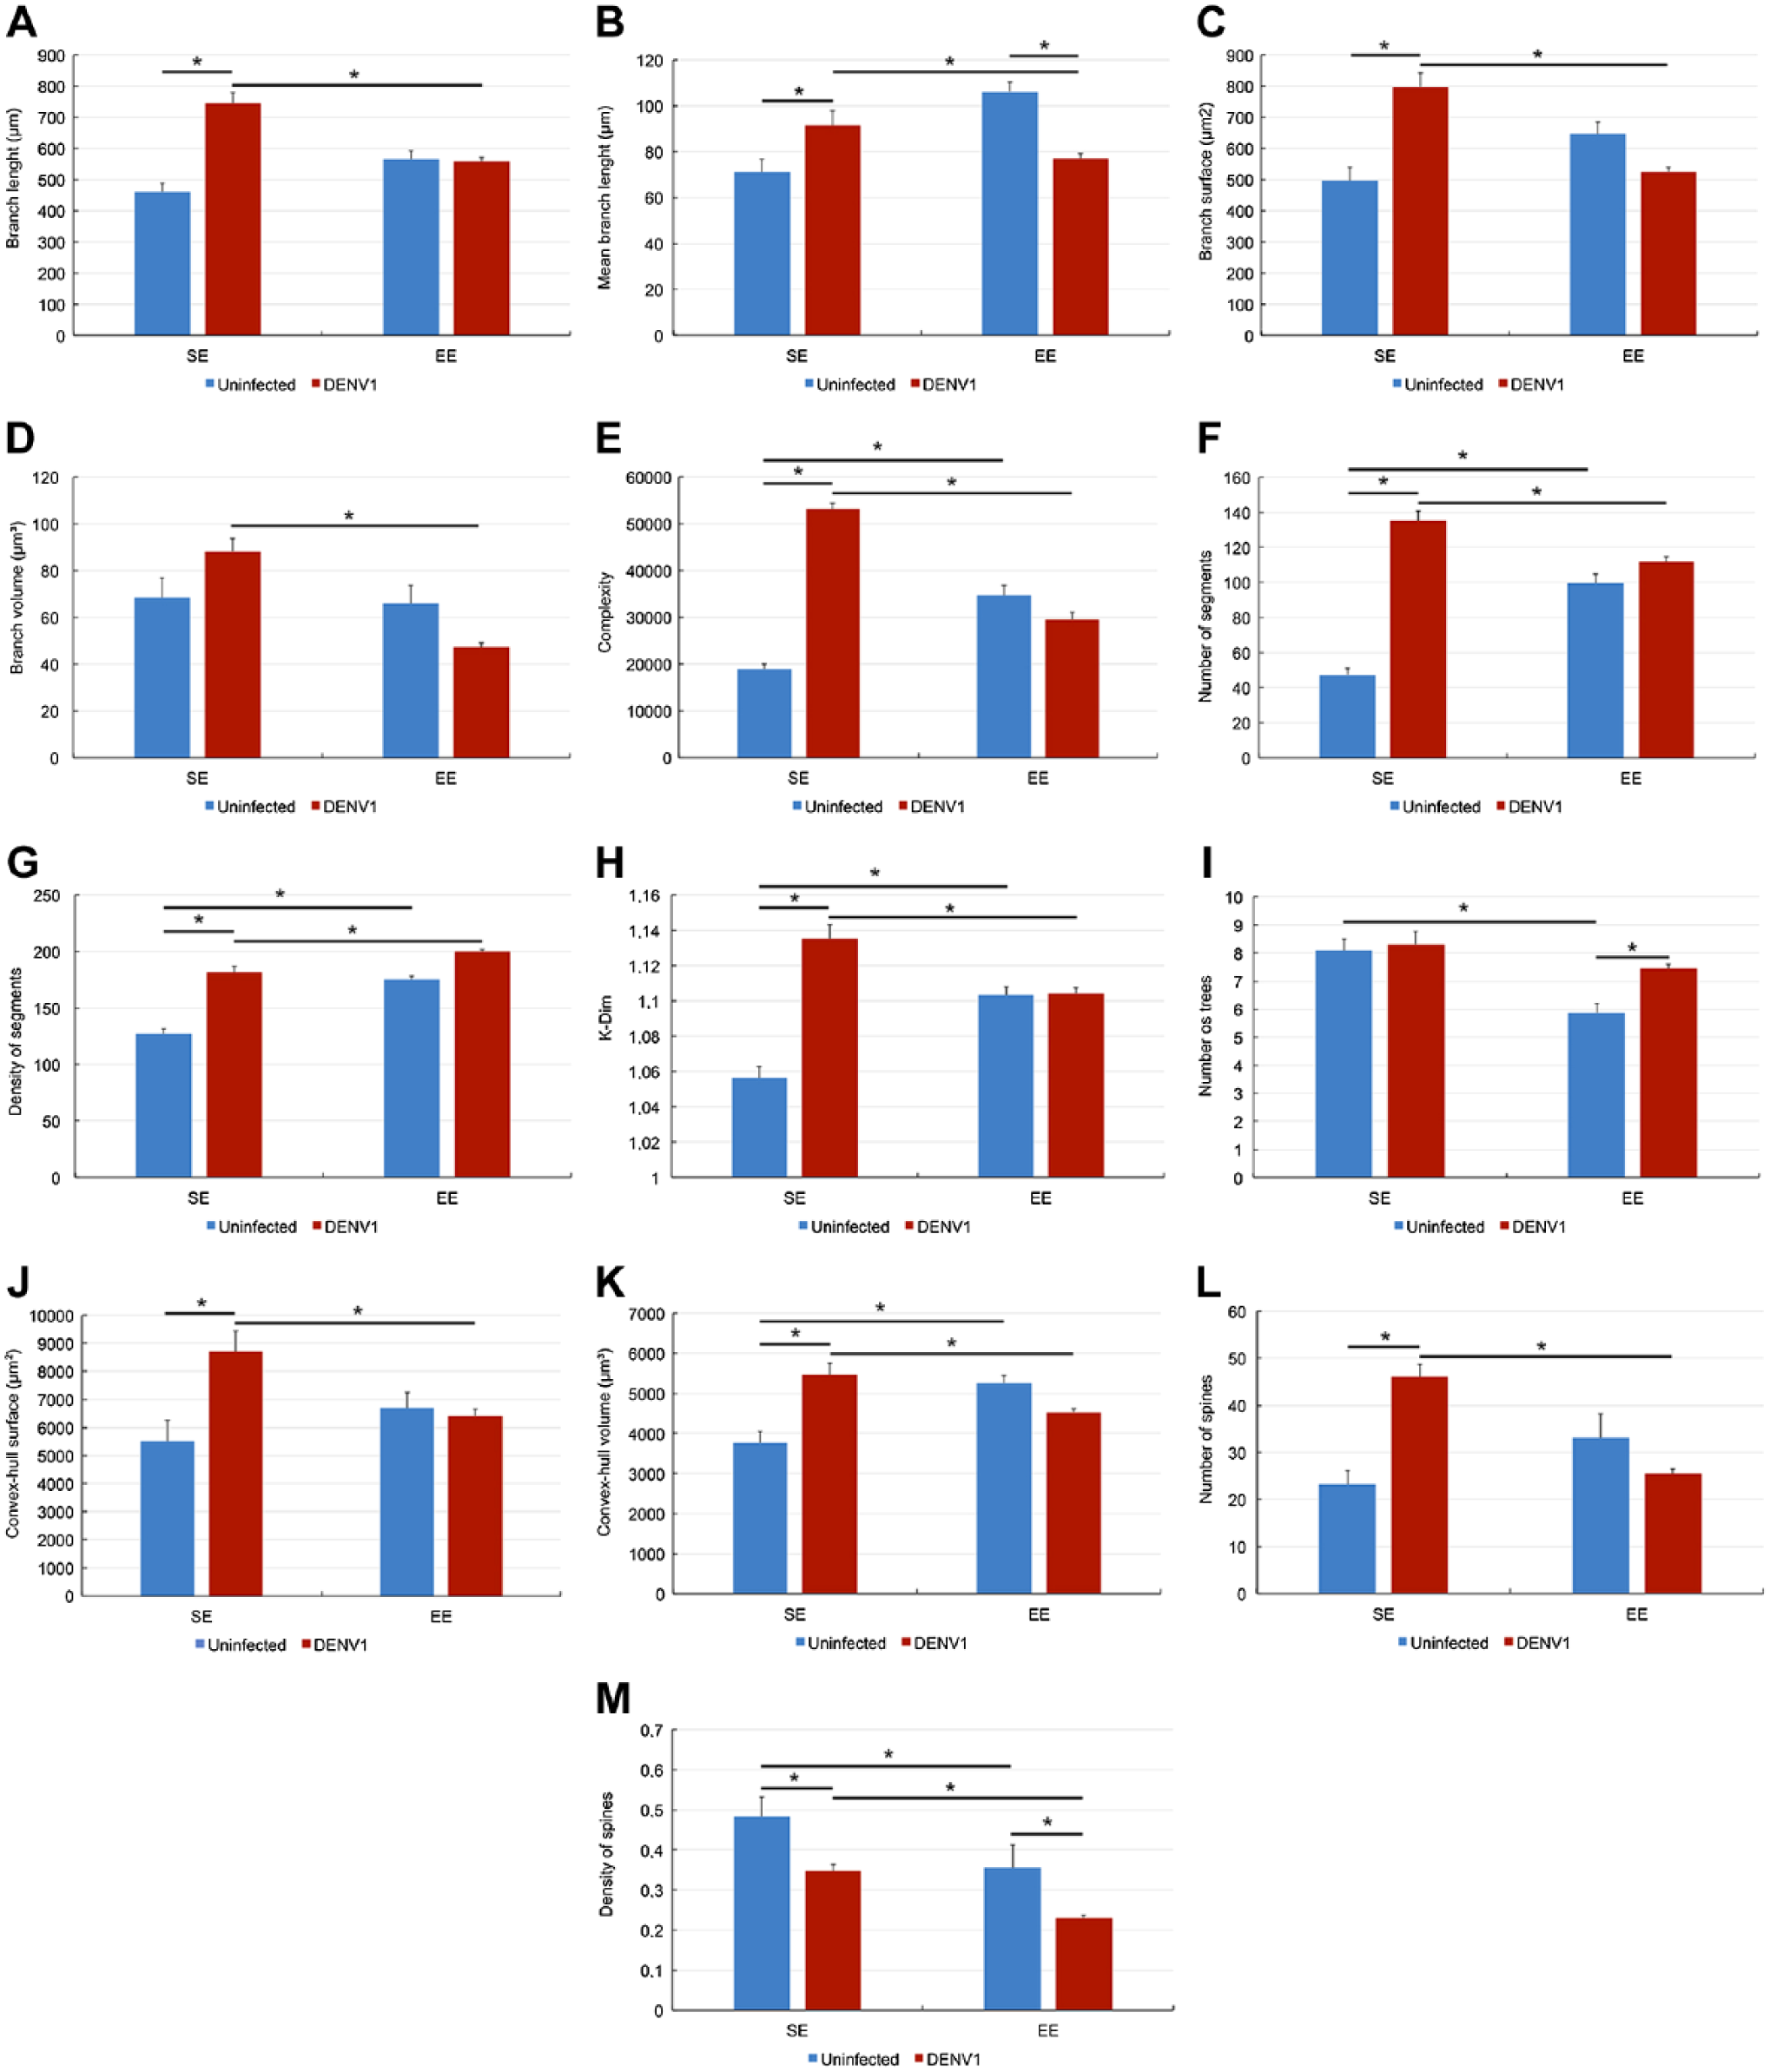
Graphic representations to illustrate significant differences between lateral septum microglia morphometric features of uninfected (blue bars) and infected (red bars) mice. Two-way ANOVA demonstrated that environment and infection contributed to the differences indicated by bar connectors. Abbreviations: SE, standard environment; EE, enriched environment. *p<0.05 or less.
Figure 7 shows spine-like details of a microglia taken from SE D1 lateral septum infected mouse. Microglia from the lateral septum of infected mice showed smaller density values and volume of spindly processes than control subjects. Notice that the volume of spine-like (spindly processes) microglia from SE infected mice is smaller than that of control mice and the magnitude of this reduction is higher (three times) in DENV1 SE than in DENV1 EE infected mice (twice).
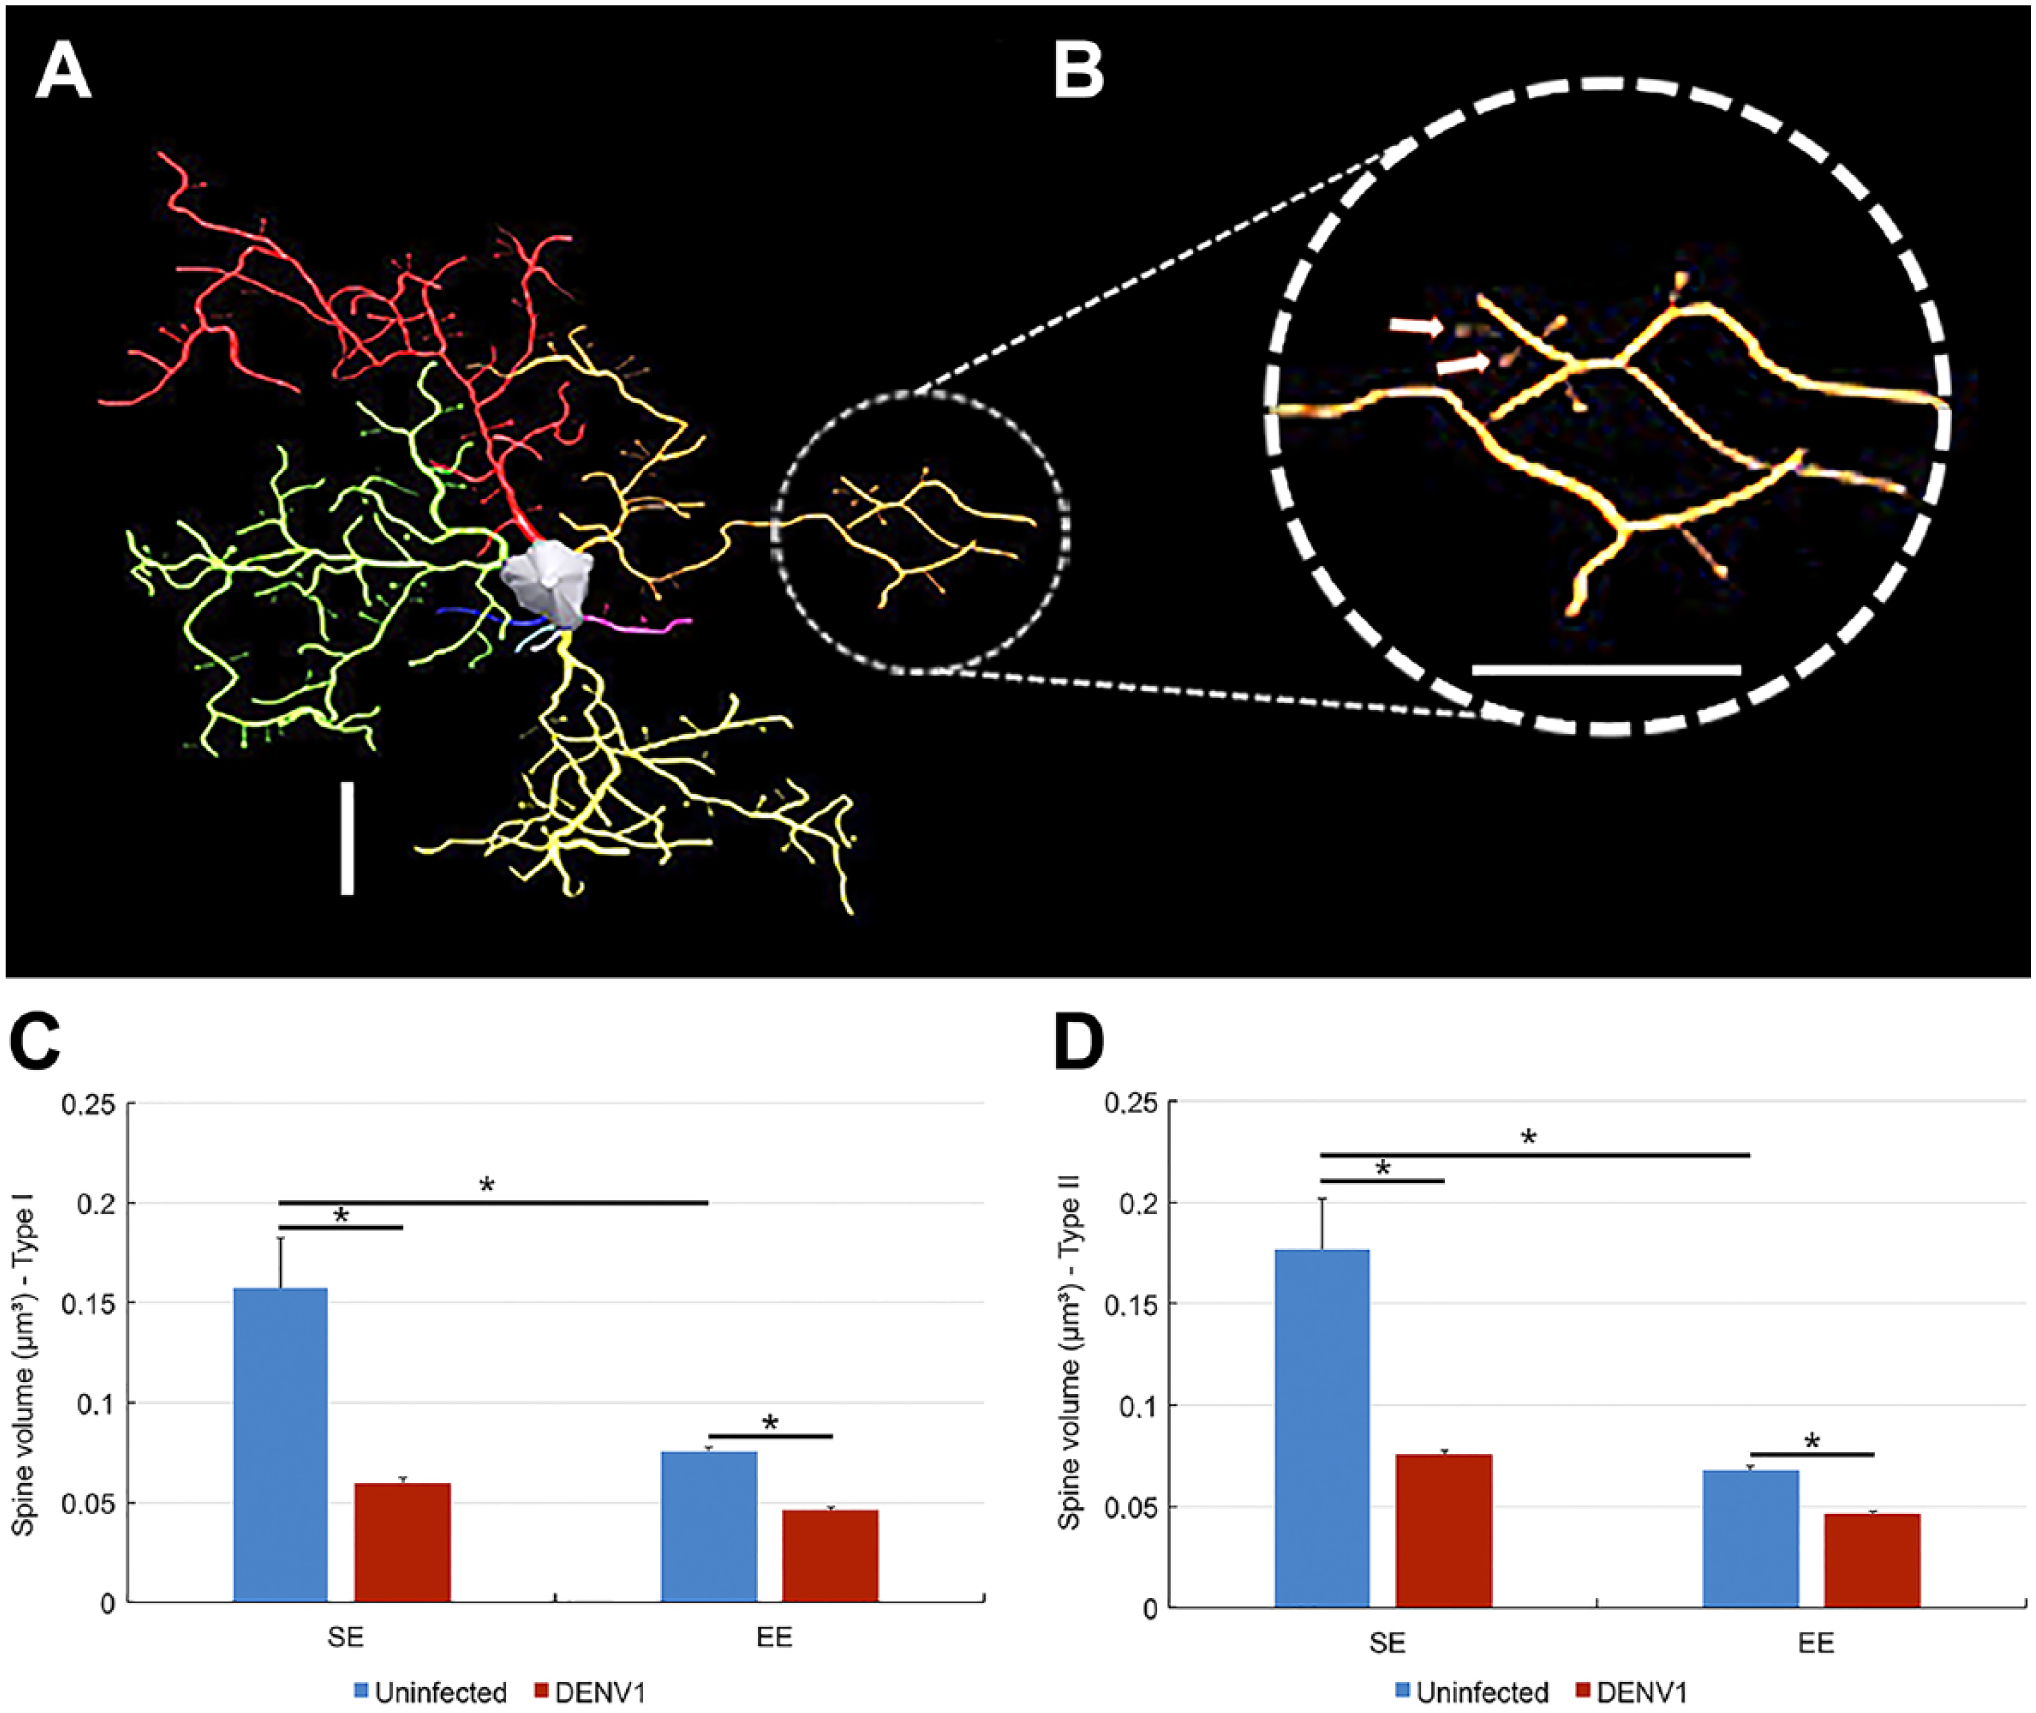
(Top A) Three-dimensional reconstruction of a lateral septum microglia from SE D1 infected mice. (B) Spindly processes are shown in higher power (arrows indicate spindly processes). (Bottom C and D) Graphic representations of spindly volumes for type I (left) and type II (right) for uninfected (blue) and infected (red) mice to illustrate the reduction of spiny-like protrusions due to virus infection. Similarly, the density of spine-like processes decreased. Scale bars = 10 µm. Abbreviations: SE, standard environment; EE, enriched environment.
Non-neurotropic Dengue Virus Infections Induced More Intense Morphological Changes in Both Type I and Type II Microglia From SE and This Is Correlated to Peripheric TNFα Gene Expression
Figure 8 illustrates microglial morphological complexities of type I and type II microglia from SE mice and of unclassified microglia from infected EE mice, viral load expressed as genomics copies of DENV1, the TNFα gene expression from infected and uninfected SE and EE mice, as well as the test results for linear correlations between TNFα blood concentration and complexity. Notice that correlation between type II microglia from SE and TNFα gene expression showed by linear regression (Fig. 4E–F) was highly significant, suggesting that microglial morphological changes may be associated with the degree of inflammatory peripheral response. Viral load was higher in EE infected than in SE infected mice and we attributed this effect to the fact that the number of T-cells (one of the target Dengue virus to escape of immune response) of voluntary exercised mice (EE) is usually higher than sedentary (SE) mice.
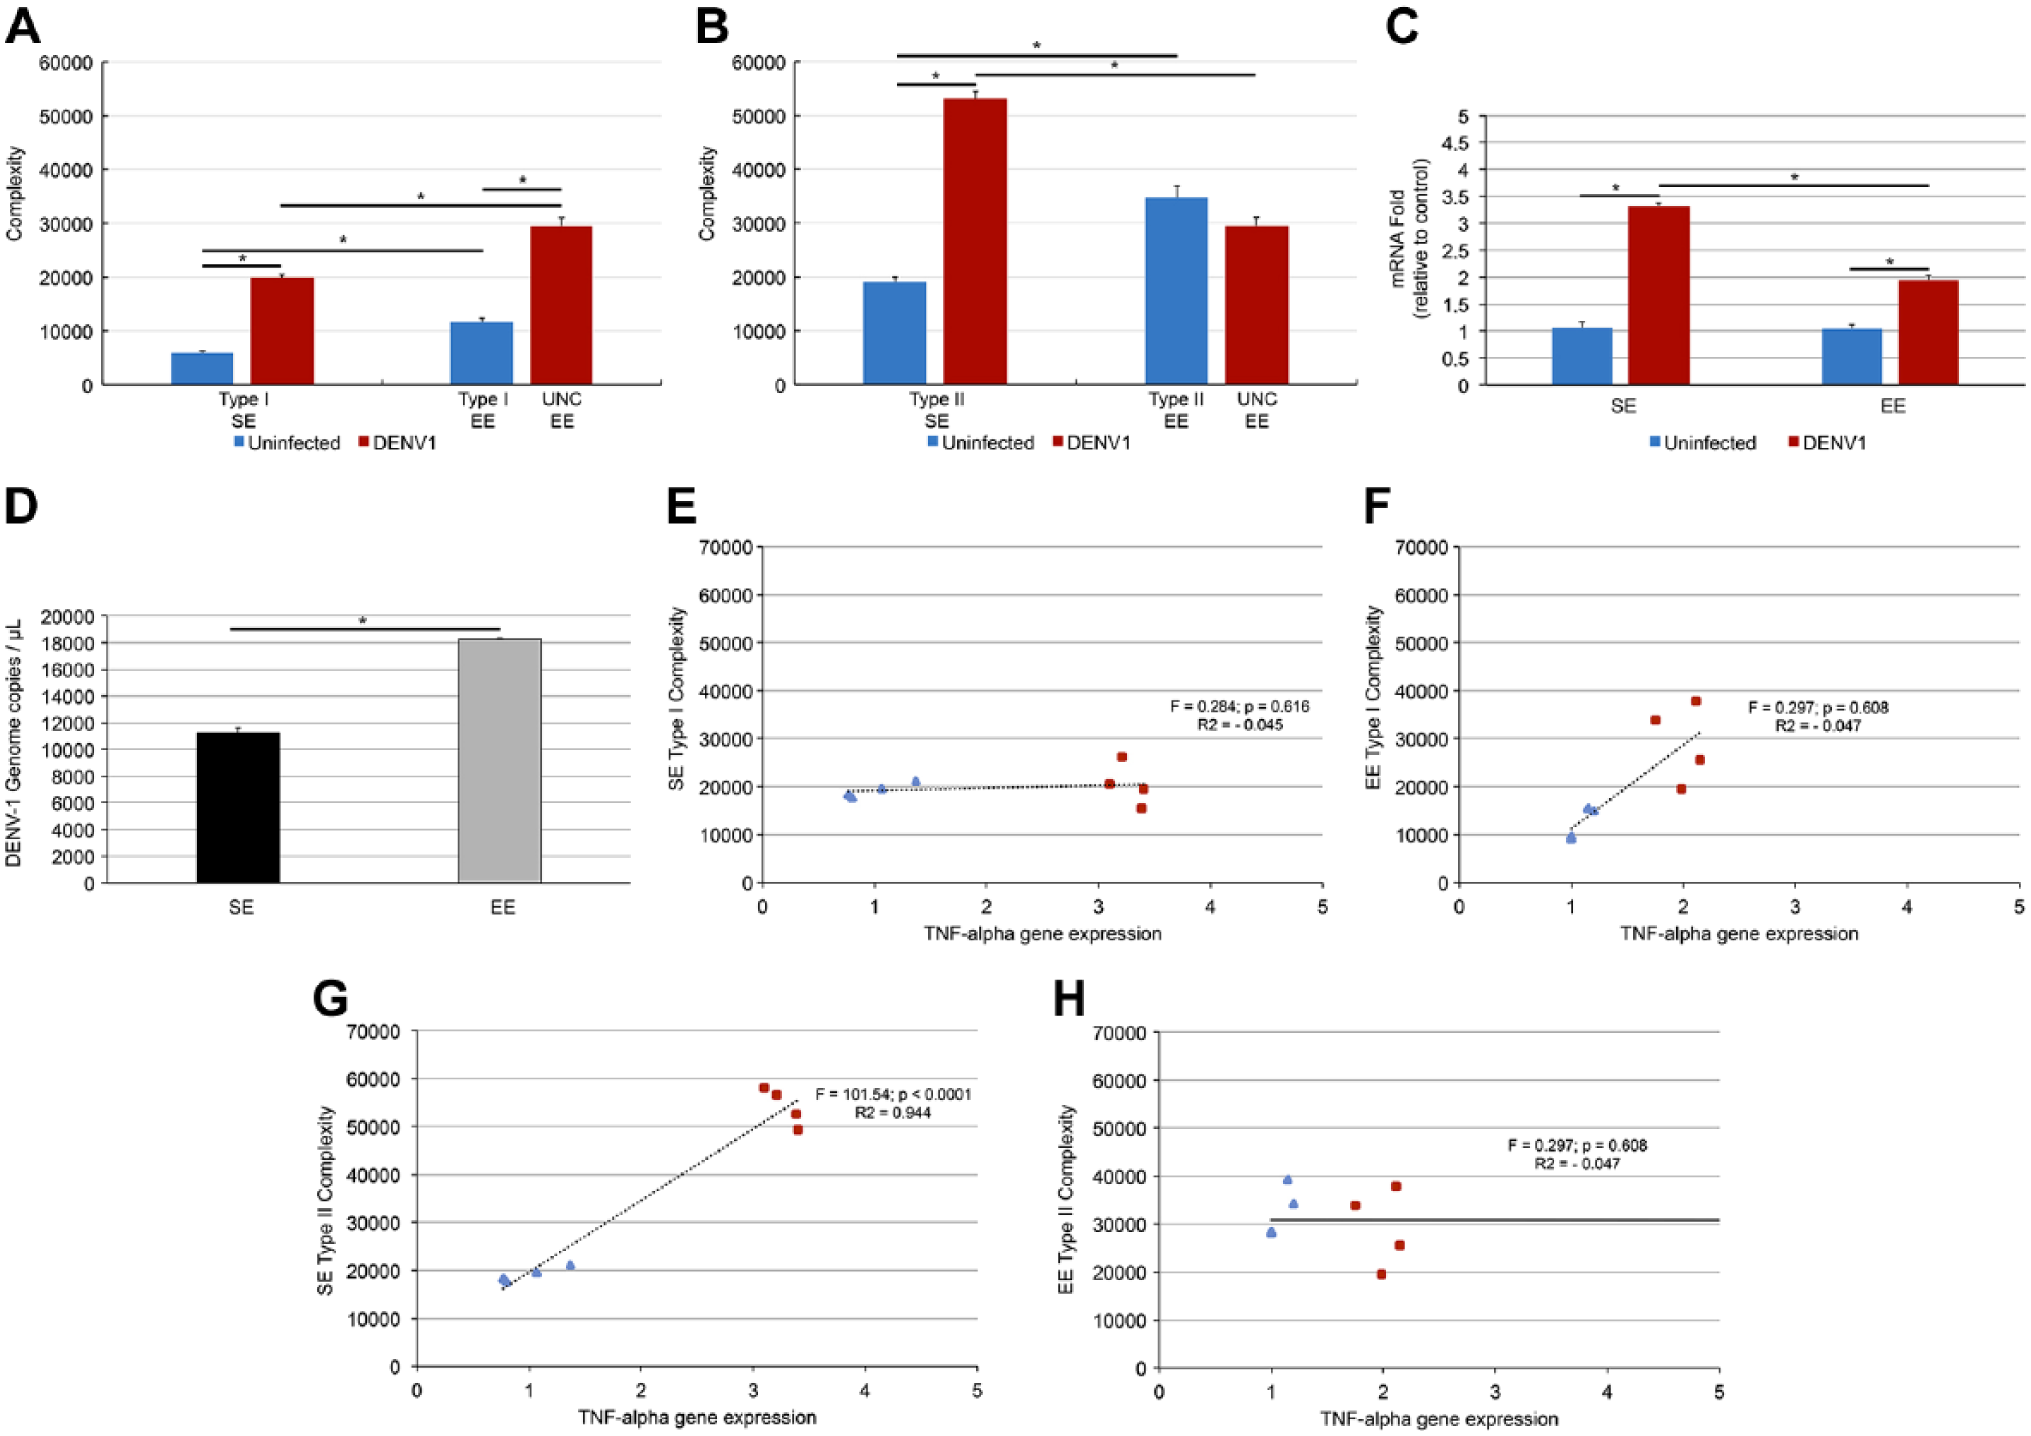
Microglial morphological complexities of type I, type II, and Unclassified microglia from control and infected mice (A and B), TNFα gene expression (C), viral load (D), and linear correlations test results between TNFα blood concentration and morphological complexity (E–H). Notice highly significant linear correlation between TNF blood concentration and morphological complexity of type II microglia (p<0.0001 R2 = 0.94). Abbreviations: SE, standard environment; EE, enriched environment; TNF, Tumor necrosis factor.
Non-neurotropic Dengue Virus Infections Induced an Increase of Type II Microglia Percentage in the Lateral Septum in Mice Housed in SE
Finally, we estimated the total number of microglial cells and the percentages of type I and type II microglia in lateral septum samples from control and infected mice. Control animals from SE and EE showed significantly higher percentages of type I microglia (85%) compared with mice infected with a single serotype DENV1 in the SE (65%). In contrast, EE infected mice showed reduced microglial diversity to a point that morphological distinctions could no longer be made (Fig. 9A). Control mice from either SE or EE conditions showed similar proportions of type I and type II microglia. Infected SE mice exhibited a reduction of type I microglia and an increase of type II microglia. The infected EE mice exhibited a significant reduction of morphological diversity, and this was reflected by the fact that only a single morphometric variable exhibited MMI > 0.55 and this precluded classification by cluster analysis.
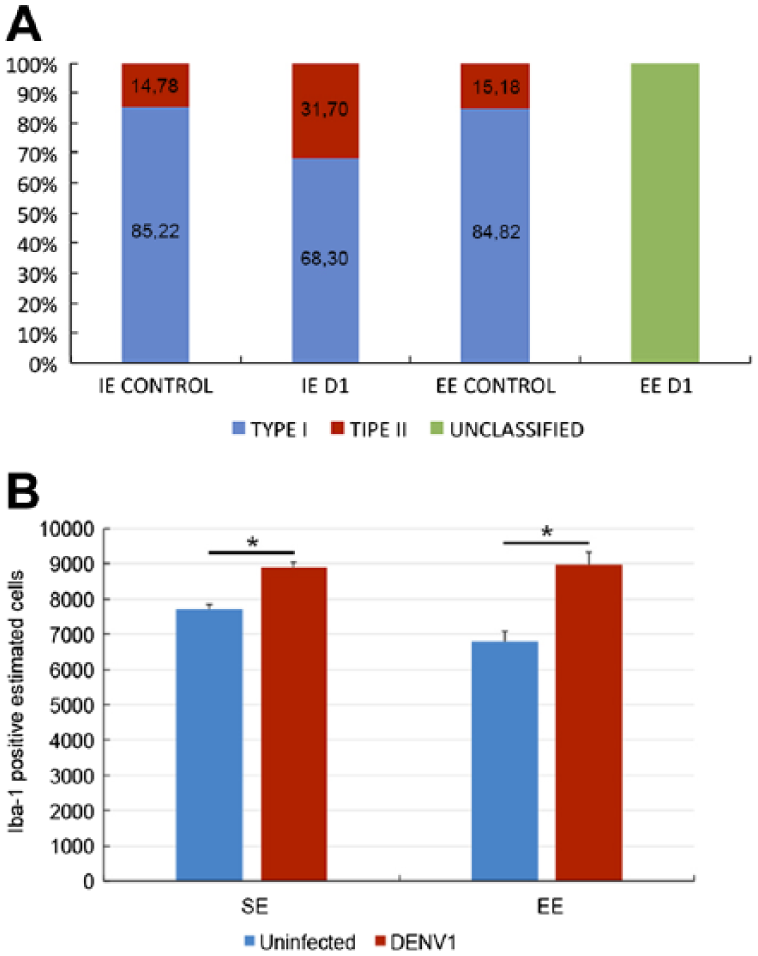
Relative percentage of microglial types (A) and absolute values of IBA-1-immunolabeled cells (B) on the lateral septum of different experimental groups. Type I percentage values are indicated in blue, type II in red, and unclassified microglia in green. Notice that type II represents a smaller proportion of the total microglia. As expected, the total number of microglia is higher in infected mice. Abbreviations: EE, enriched environment; SE, standard environment. *Significant statistical differences.
We also observed an increase in the number of microglial cells in both SE and EE DENV1 infected mice and the magnitude of the microgliogenesis was higher in EE than SE infected mice (Fig. 9B).
Discussion
Our findings demonstrated that peripheral infection with the single serotype DENV1 infection induced a differential microglial morphological response in the lateral septum of a murine model, and this co-exists with an increase of the total number of lateral septum microglia in the absence of virus antigens in the brain parenchyma. Moreover, we identified two morphological microglia phenotypes (designated type I and type II) under homeostatic conditions in mice from both SE and EE cages, which responded differentially to infections with single DENV1 serotype. As compared with controls, DENV1 infection led to an increase of the morphological complexities of both type I and type II microglia from SE individuals. In contrast, EE DENV1 infected mice reduced microglial morphological diversity to a point that distinctions between type I and II were no longer detectable. Interestingly, the changes in morphological complexity observed in type II microglia in infected SE mice were associated with TNFα gene expression in the peripheral blood. Based on these findings, we suggest that the type-I and type-II morphological phenotypes may play distinct roles in both homeostatic and pathological conditions and that environmental changes may influence host inflammatory response.
Dengue Virus and CNS Host Response
A few reports have explored immunocompetent murine models of non-neurotropic dengue infections in mice models mimicking contrasting lifestyles.26,27 Here we used these models to study microglial morphological host responses in correlation with peripheral inflammatory cytokines gene expression. We compared microglial responses and TNFα gene expression after non-neurotropic single serotype DENV1 infections in mice raised in SEs or EEs. Environmental conditions showed a vigorous influence on microglial morphological responses, which were correlated to TNFα inflammatory responses in the peripheral blood. Our findings suggest that an active lifestyle may strongly influence the intensity of peripheral inflammation following DENV1 non-neurotropic infections, which may contribute to reduce CNS impairment in single serotype infections.
Morphometry and Stereological Sampling Approach to Microglia Classification
Several reports have employed microscopic 3D reconstruction of microglia to describe morphological changes under homeostatic and neuropathological conditions.46,47 However, no previous investigations endeavored to quantify subtle microglial morphological and numerical changes using unbiased methods, after arbovirus infection in immunocompetent mice models, subjected to environmental influences. Here we established this experimental model to test the hypothesis that environmental changes may influence the outcomes of inflammatory response in adult mice. In the adult rodent brain, damage can induce microglial morphological changes, including a transition between a process-bearing or more ramified appearance to a rounded or amoeboid morphology, with a continuum of multiple intermediate stages. 44 This subject has been reviewed by Harry and Kraft. 69 To detect and quantify details of changes along this continuum of morphological possibilities, here we used a stereological random and systematic sampling approach, combined with 3D microglia reconstructions. To our knowledge, this is the first report using an unbiased sampling approach along with 3D microscopic reconstructions to assess the subtleties of morphological microglial phenotypes 44 in dengue infections. We selected this approach to guarantee that all regions from the area of interest would have the same probability of inclusion in the sample (systematic and randomized sample), and that we could quantify the fine anatomical details (from 3D reconstructed microglia) in both control uninfected and infected mice using unbiased methods. We subsequently used cluster analysis to identify possible morphological groups of microglia, followed by discriminant analysis to identify which morphometric features significantly contributed to distinguish between microglial morphological families in both control uninfected and infected mice. Using this approach, we learned that a few morphological parameters—branch volume, complexity, and varicosities—were enough to distinguish two microglial families in our sample. We observed that the morphological changes associated with microglial response in infected mice from the EE were less conspicuous than the changes in infected mice from the SE. This suggests that environmental enrichment may modulate the microglial host response after non-neurotropic dengue infection.
We also used the optical fractionator to estimate the total number of microglia and found, as expected, that microgliogenesis is evident in infected mice, independent of the environment where they were maintained.
Systemic Inflammation, Environmental Enrichment, and Microglial Morphology
It has previously been suggested that qualitative assessments of microglia morphology cannot reliably predict function.70-74 However, recent studies demonstrate that the form-function model is a good starting point for examining the influences of multivariate factors that affect microglial morphology and function.23,29,44,45,75,76 We explored the influence of contrasting environments on the lateral septum morphological microglial response to single and crossed secondary serotype dengue infections. Our results indicated that contrasting environments, mimicking sedentary-like and active lifestyles, had differential effects on microglial morphology depending on the microglial phenotype. Indeed, type I, type II, and unclassified microglia seemed to change in complexity in accordance with TNFα gene expression in the peripheral bloodstream. This is in agreement with previous data suggesting that peripheral inflammation is reflected by microglia response1,32 and that EE decreases microglia inflammatory phenotypes in mice and rat adult brain.77,78 In addition, Zhang and coworkers recently demonstrated that EE attenuated the expression of the CD68 inflammatory marker, and TNFα and IL-1β concentration in hippocampus after TNFα peripheral injection, suggesting that this housing condition increased resistance to inflammation induced by TNFα. 79 Thus, we suggest that environmental enrichment may provide some protective effect against the inflammatory response to a non-neurotropic dengue virus.
Branch analysis demonstrated that complexity was the morphological feature that contributed most to the cluster formation. Complexity was defined as previously reported, 80 using the following equation: Complexity = (Sum of the terminal orders + Number of terminals) × (Total branch length / Number of primary branches). Based on this equation, which was previously applied to neuronal morphology, high complexity values reflect greater ramification and longer processes. When applied to microglial morphology, this index was found to be associated with hyper-ramified and longer processes even in the absence of inflammation or neurodegeneration 81 in the prefrontal cortex of rats subjected to chronic stress. Chronic stress significantly increases the branching complexity of microglia and enhances ramification maintaining the area occupied by the cell. Notably, mice subjected to chronic stress express TNFα, albeit at relatively low levels, and exhibit activation and pro-ramifying microglia effects in the prefrontal cortex. 82
Our findings reproduced a pattern that was more similar to the one previously demonstrated in monkeys and rats subjected to a lipopolysaccharide challenge 83 or to a viral challenge. 23 Our results showed an increased inflammatory response associated with a conspicuous pro-ramifying effect in the microglia of mice maintained in the standard cages. It was previously suggested that increased expression of β1-integrin (CD29) after a lipopolysaccharide injection could cause alterations in microglial branches. That hypothesis was supported by the observation that lipopolysaccharide exposure led to increased integrin immunoreactivity in ramified microglia in the mouse brain. 83 The changes that we observed in the microglia of infected mice from an SE were correlated with increased TNFα gene expression in peripheral blood, suggesting that these cells might be phenotypically classified as M1 like cells.
Different microglial subpopulations can assume a diversity of responses to a damaging stimulus. For example, IFN-gamma can induce the expression of major histocompatibility complex (MHC) II in antigen presenting cells, and microglia can respond in this way in both in vivo or in vitro. 84 However, microglia from different regions of the brain can respond in different manner 85 and only part of these cell population is able to induce this response. 84 In addition, even though there is no difference in TLR4 expression between microglial subpopulations, some use the TLR4 pathway with inflammatory profile while others do not do so. 81 Therefore, it is reasonable to suggest that type I and type II microglia do not respond in the same way to an inflammatory stimulus generated by DENV infection. Thus, we propose that the highly branched type II microglia frequently found in infected animals from the SE are more responsive to inflammatory stimuli than the type I morphotype. This can indicate that these microglia underwent an early stage of activation in response to infection, probably in a proinflammatory way. However, the absence of a hyper-ramified pattern in mice from an EE may suggest that the inflammatory host response is downregulated in the murine model mimicking an active lifestyle.
We also find a reduction in the number and volume of spine-like processes. Spine-like process is one of the two apparent morphological phenotypes of microglia protrusions detected at the ultrastructural level. 87 Some processes appeared very large and thick (bulky), while others exhibit many short, thin fingers, and appeared “spindly.” 87 Spine-like processes of the present report (spindly) was one of the multimodal variables which was used to perform cluster analysis (Table 2). Note that different from neurons where spines are targeted by synapses, we do not know yet the contributions of microglia spindly processes. The bulky processes usually contain cellular inclusions suggesting phagocytic activity. 87
MMIs of Lateral Septum Microglia Morphometric Features From Uninfected and Infected Groups.
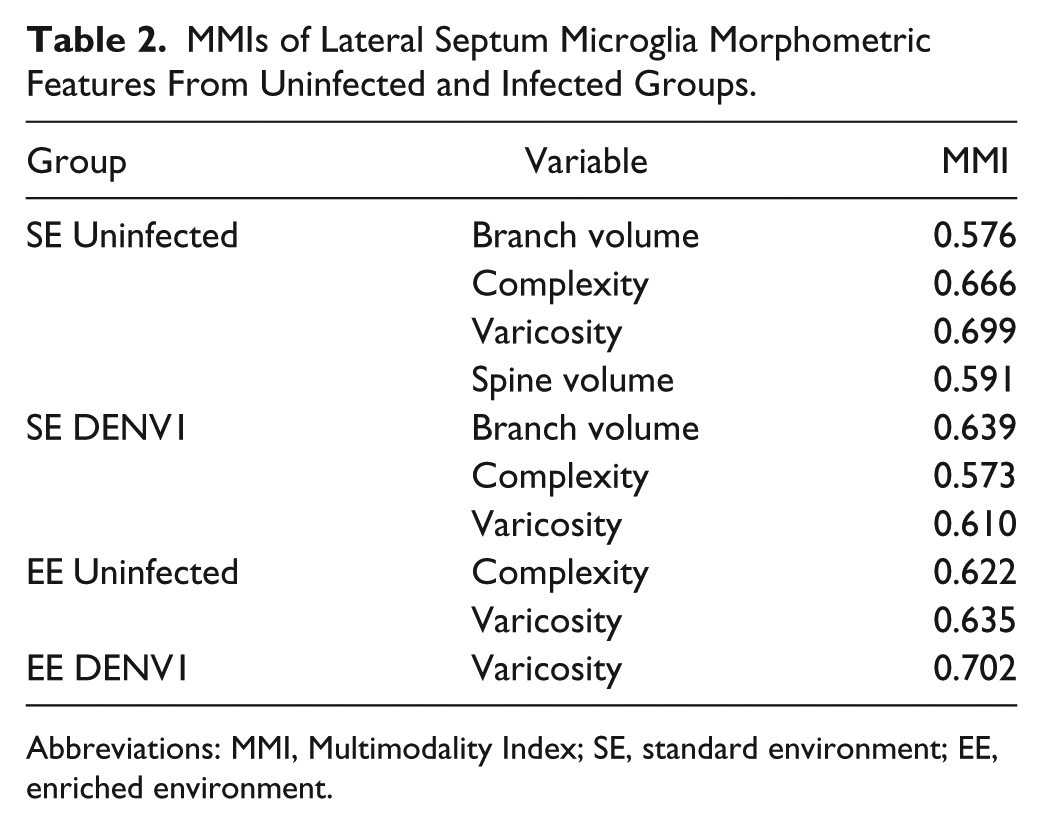
Abbreviations: MMI, Multimodality Index; SE, standard environment; EE, enriched environment.
It is important to highlight, however, that to induce adjuvant effect and increase virus titration, previous and present reports used infected brain homogenate to induce peripheral infection in both neonate and adult mice.23,26,36 Although the brain homogenate can confound results especially with outbred mice, where brain homogenates could have different MHC tissue types, it became apparent from previous studies that normal brain homogenate did not produce morphological changes on microglia and did not increase peripheral cytokine levels, at least to the time window explored in the present report.
Taken together, our findings demonstrated that sedentary-like and active murine models exhibited differential microglial responses to systemic non-neurotropic infections with dengue virus, and the morphological complexity of type II microglia of the lateral septum of infected mice showed a linear correlation with TNFα mRNA expression in the periphery. Future studies should investigate microglial host response to other non-neurotropic pathogens and explore how microglial activation is associated with markers and degrees of CNS integrity.
Supplemental Material
DS_10.1369_0022155419835218 – Supplemental material for Differential Microglial Morphological Response, TNFα, and Viral Load in Sedentary-like and Active Murine Models After Systemic Non-neurotropic Dengue Virus Infection
Supplemental material, DS_10.1369_0022155419835218 for Differential Microglial Morphological Response, TNFα, and Viral Load in Sedentary-like and Active Murine Models After Systemic Non-neurotropic Dengue Virus Infection by Giovanni Freitas Gomes, Railana Deise da Fonseca Peixoto, Brenda Gonçalves Maciel, Kedma Farias dos Santos, Lohrane Rosa Bayma, Pedro Alves Feitoza Neto, Taiany Nogueira Fernandes, Cintya Castro de Abreu, Samir Mansour Moraes Casseb, Camila Mendes de Lima, Marcus Augusto de Oliveira, Daniel Guerreiro Diniz, Pedro Fernando da Costa Vasconcelos, Marcia Consentino Kronka Sosthenes and Cristovam Wanderley Picanço Diniz in Journal of Histochemistry & Cytochemistry
Footnotes
Competing Interests
The author(s) declared no potential conflicts of interest with respect to the research, authorship, and/or publication of this article.
Author Contributions
GFG, TNF, CCA, SMMC, MAO, DGD, PFCV, MCKS, and CWPD conceived the study, participated in the experiment design, and drafted the manuscript. GFG, RDFP, BGM, KFS, LRB, PAFN, TNF, CCA, SMMC, MAO, DGD, PFCV, MCKS, and CWPD performed the experiments and analyzed and interpreted the data. DGD, PFCV, MCKS, and CWPD participated in the data analysis, were involved in drafting the manuscript, and made important intellectual contributions. All authors read and approved the final manuscript.
Funding
The author(s) disclosed receipt of the following financial support for the research, authorship, and/or publication of this article: This study was supported by CAPES (Pró-Amazônia Process 3311/2013) and had research funds from the Fundação de Amparo e Desenvolvimento da Pesquisa (FADESP) and the Pró-Reitoria de Pesquisa e Pós-Graduação (PROPESP/UFPA) covering proofreading, editing, and publication fees.