
Abstract
Selection of decalcification agents is an essential consideration when processing mineralized tissues because the integrity and immunohistochemical characteristics of the tissues may be affected. Here, we report results obtained from the decalcification of rat mandibles using 10% ethylenediaminetetraacetic acid (EDTA) at room temperature (RT), 10% EDTA at 37C, 5% nitric acid, and 10% formic acid at RT. Decalcification endpoints were determined by microcomputed tomography. Morphological preservation and antigenicity were evaluated by hematoxylin and eosin staining and immunohistochemistry. Decalcification of the anterior and posterior portions of the mandible took 220 and 191 hr in 10% EDTA RT, 102 and 73 hr in 10% EDTA 37C, 13.5 and 4.3 hr in 5% nitric acid, and 140 and 36 hr in 10% formic acid, respectively. Decalcification in 10% EDTA at 37C was accelerated, but 10% EDTA at RT provided optimal results for immunohistochemistry and cellular and structural details. Decalcification using 5% nitric acid was accomplished in the shortest time and exhibited good cellular and architectural morphology, whereas 10% formic acid was suboptimal with respect to tissue and cellular morphology. Despite being the slowest method, EDTA at RT is still the recommended method for decalcifying mineralized tissues; however, if rapid decalcification is needed, 5% nitric acid is the best option, yielding acceptable tissue integrity and speed.
Introduction
Histological analyses of calcified biological tissues, such as teeth and bone, remain difficult due to the hardness of these tissues. Teeth are a complex tissue, composed of both a soft organic component, such as the dental pulp, and a surrounding hard inorganic mineralized component, including alveolar bone, dentin, cementum, and enamel. 1 Choosing the optimal histological processing techniques to process such complex tissues is paramount to ensure reproducible morphology preservation with the minimum of technical artifacts. Histological assessment of highly mineralized tissues typically requires decalcification as an initial step to remove any calcium ions/salts in the calcified tissue to embed it into paraffin to section and stain the tissues for histopathology analysis. Traditional decalcification methods involve immersing the mineralized tissues in solutions containing acids (mineral or organic), and chelating agents.2,3 However, the morphology of calcified tissue is often difficult to preserve following decalcification with these agents, because exposure to harsh chemicals is reported to damage the soft tissue structure and negatively affect cellular integrity.2,4
The effects of decalcifying agents are influenced by solution concentration, temperature, exposure time, and penetration rate. Acid decalcification acts through a diffusion system forming soluble calcium salts, whereas ethylenediaminetetraacetic acid (EDTA) decalcification acts by binding calcium ions that form stable EDTA-Ca reactions.2,5 Inappropriate use of a decalcifying agent can damage the tissue structure, often observed by the loss of cytoplasmic and nucleic staining.3,6,11 It is, therefore, crucial to determine the decalcification endpoint specific to commonly used agents. Several approaches have been employed for testing completeness of decalcification endpoint, including physical testing by probing or bending to detect hardness, mechanical testing by needling, chemical detection of calcium ions in the decalcification solution, bubble tests, and radiographic detection of calcium in the specimen. 2 However, disadvantages such as generation of artifacts, destruction of cellular detail, and false-positive readings can be encountered while using physical and chemical tests. 2 Although very expensive and not readily available in most histology laboratories, X-ray microcomputed tomography (µCT) is the most accurate and precise method for quantifying bone mineral density7,8 and, therefore, the extent of decalcification. µCT has the advantage of producing a three-dimensional (3D) image from X-ray absorption while not damaging the material. The attenuation and penetration coefficient of a material is affected by its atomic number, density, thickness, and by the energy of the X-ray. The X-ray source emits photons that pass through the material, and the multiple projected cross-sectional slices are recorded in a two-dimensional (2D) device and reconstructed into a 3D digital image. The 3D image created is related to the attenuation and penetration of the X-ray beam within the tissue, thus providing information regarding the mineral density throughout an object.10,11
The aim of this study was to critically assess the efficacy of different decalcification agents on rat mandible tissue. To achieve this, we used four different decalcification methods and recorded the rate of decalcification, followed by a comprehensive analysis of tissue morphology and antigen preservation in the resultant tissue. We compared each method with the 10% EDTA at room temperature (RT)—considered the “gold standard”—which is the technique most commonly cited in the literature but carries the associated disadvantage of prolonged decalcification time. Qualitative assessment was undertaken through stained histological sections and immunohistochemistry (IHC) in combination with µCT, allowing for assessment of the decalcification time for each solution. The intention was to ascertain an appropriate decalcification method that was both rapid and provided optimal tissue preservation. This has implications for all histology users who wish to shorten the often-lengthy decalcification time while at the same time retain tissue morphology and integrity.
Materials and Methods
Sample Preparation and Decalcification
Sprague-Dawley rat mandibles (aged 60 weeks) were used from existing excess tissue obtained from a previous study (Queensland University of Technology ethics approval number 1200000565). Rat mandibles (approximately 40 mm × 3 mm × 25 mm) were dissected from the surrounding tissue and fixed in 10% formaldehyde (Sigma-Aldrich; Castle Hill, Australia) for 1 week. After fixation, the mandibles were grossly bisected along the symphysis of the mandible using an EXAKT 310 Diamond Band Saw (EXAKT Apparatebau GmbH & Co.KG; Norderstedt, Germany), and then sectioned along the teeth resulting in an anterior (approximately 23 mm × 3 mm × 10 mm) and posterior portion (approximately 28 mm × 3 mm × 16 mm) (Fig. 1A, B, and C). Anterior and posterior mandible portions were then allocated into four groups (n=4) for processing: (1) 10% EDTA (Ajax Finechem, Thermo Fisher Scientific; Taren Point, Australia) at RT; (2) 10% EDTA at 37C using a rapid decalcifier at an input voltage 230 V (59 Hz), 8 A, and 450 rpm (Kos Milestone microwave model 67051; ABACUS, Brisbane, Australia); (3) 10% formic acid (Sigma-Aldrich; Castle Hill, Australia) at RT; and (4) 5% nitric acid (Merck, Bayswater, Australia) at RT. For a total of 100 ml of 10% EDTA, 10 g of EDTA powder was dissolved in 80 ml of distilled water (DI). The solution pH was brought to 7.4 by adding NaOH pellets and topped up with DI water. Five percent nitric acid was prepared by mixing 5.3-ml of nitric acid 69% with 94.7 ml of DI water for a total volume of 100 ml. To prepare 10% formic acid, 8.4 ml of formic acid 98%–100% was diluted with 91.6 ml of DI water for a total of 100 ml. Fixed samples were then placed in a ratio of 20:1 of the decalcifying agent solution to sample volume. Ten percent EDTA at RT and at 37C groups were replaced weekly, whereas 10% formic acid and 5% nitric acid were not replaced because their endpoints were less than a week. All samples were rinsed in tap water for 24 hr once the endpoint had been achieved.2,11
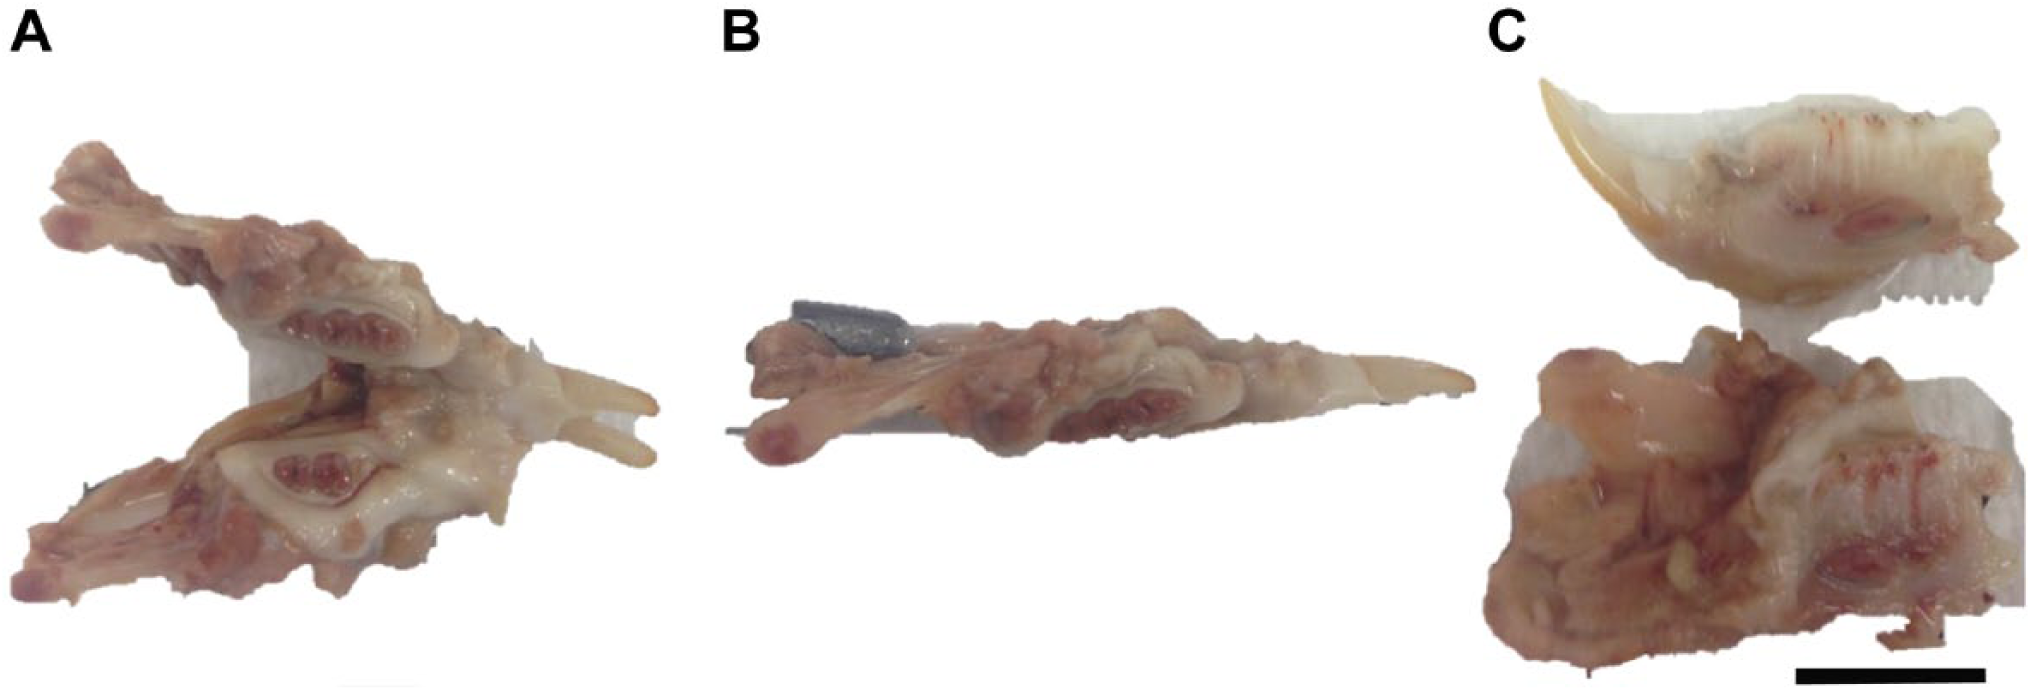
Macroscopic images of rat mandible. (A) Explanted whole rat mandible. (B) Rat hemi-mandible sectioned through the mandibular symphysis. (C) Rat hemi-mandible sectioned sagittal through the occlusal plane of the hemi-mandible, resulting in an anterior (top) and posterior (bottom or lower) portion. Scale bar 10 mm.
µCT Imaging
The decalcification progress was assessed by µCT (μCT 40; Scanco Medical, Bruttisellen, Switzerland), with samples being scanned regularly to determine the amount of mineral remaining with each decalcification method. Both the anterior and posterior portions of the mandible were scanned at a source voltage of 70 kV, current of 114 µA (µCT), and using a voxel size of 30 µm. The frequency of testing had been determined based on a previous pilot study. The RT and 37C EDTA groups were tested daily, whereas the 10% formic acid samples were tested approximately every 10 hr and the 5% nitric acid samples every 2 hr until no more mineral was detectable by µCT. To understand how rapidly each decalcifying agent demineralized the tissue, the slices were then reconstructed to create a 3D image of each sample using the Scanco reconstruction software (Scanco Medical).
Processing, Embedding, and Sectioning
After decalcification was deemed to be complete, the specimens were processed overnight in an Excelsior ES Tissue Processor (Thermo Scientific; Brisbane, Australia), prior to embedding in molten paraffin wax at 60C (Thermo Shandon Histocentre 3 Embedding Station; Thermo Scientific). Sections were cut at 5 µm with a Leica RM2235 rotary microtome (Leica Biosystems; Nussloch, Germany). Paraffin ribbons were flattened in a water bath (Labec, Marrickville, Australia) at 40C and collected onto polysine microscope slides (Thermo Scientific) prior to drying at 60C for 16 hr.
Histology Staining
Morphological tissue structure preservation was evaluated by hematoxylin and eosin (H&E) staining (HD Scientific Supplies; Wetherill Park, Australia) using a Leica Autostainer XL (Leica Biosystems). Three stained slides with two tissue sections each from the anterior and posterior portions of the mandible from each decalcifying treatment were scanned using a Leica SCN 400 slide scanner (Leica Microsystems; Wetzlar, Germany) at 40× magnification and assessed for the quality of staining and preservation of tissue structure.
Immunohistochemistry
IHC was performed on sections using antibodies to von Willebrand factor (vWF; Ready to Use, rabbit polyclonal, IR527; DAKO, Glostrup, Denmark), type I collagen (Col-1; 1:500 dilution, rabbit polyclonal, Abcam 34710; Cambridge, UK), osterix (Osx; 1:1000 dilution, rabbit polyclonal, Abcam 22552) and Runt-related gene 2 (Runx2; 1:200 dilution, mouse monoclonal, Abcam 76956).
Immunohistochemical staining optimization of Col-1, vWF, Osx, and Runx2 was performed on the tissue decalcified using 10% EDTA at RT. A series of antibody dilutions ranging from 1:200 to 1:2000 was used to evaluate the optimal antibody dilution which provided specific staining with minimal background. The antigen retrieval solution used for each antibody was determined from previous optimization trials within our research group.
In brief, slides were first dewaxed in xylene, followed by serial dehydration in alcohol solutions for subsequent antigen retrieval using either Proteinase K (DAKO; Carpinteria, CA) for 5 min at RT (vWF and Col-1) or heat-mediated antigen retrieval with citrate buffer (pH 6) at 95C for 5 min (Osx and Runx2). Slides were then incubated with 3% hydrogen peroxide (Sigma-Aldrich; St. Louis, MO) solution for 10 min to block endogenous peroxidase activity and blocked using 2% bovine serum albumin (Sigma-Aldrich; St. Louis, MO) for 1 hr 10 min. The sections were incubated with primary antibody solutions diluted in 2% bovine serum albumin at RT for 1 hr, followed by 30-min incubation at RT with EnVision + Dual Link System-HRP Rabbit/Mouse (DAKO; Carpinteria, CA). Color development was performed with liquid diaminobenzidine (DAB) chromogen (DAKO; Carpinteria, CA) for 5 min, and sections were counterstained with Mayer’s hematoxylin (Sigma-Aldrich; St. Louis, MO). The stained sections were then scanned using a Leica SCN 400 slide scanner (Leica Microsystems) at 40× magnification and assessed to determine each antibody immunolocalization.
Results
Rate of Decalcification
The rate of decalcification for 10% EDTA at RT and 37C, 10% formic acid, and 5% nitric acid at RT was assessed using µCT (Fig. 2). With all four methods, the decalcification of the anterior portions was slower compared with the posterior portions. More specifically, with each method, the overall sequence of demineralization for the anterior portion of the mandible showed a progressive demineralization from the posterior region of the mandible to the lower incisor (Fig. 2A). The incisors appeared to be more resistant to the action of the decalcifying solutions. By contrast, there was a faster rate of decalcification observed in the posterior portion of the mandible—most of the enamel and surrounding bone was generally demineralized when exposed to the decalcifying agents (Fig. 2A).
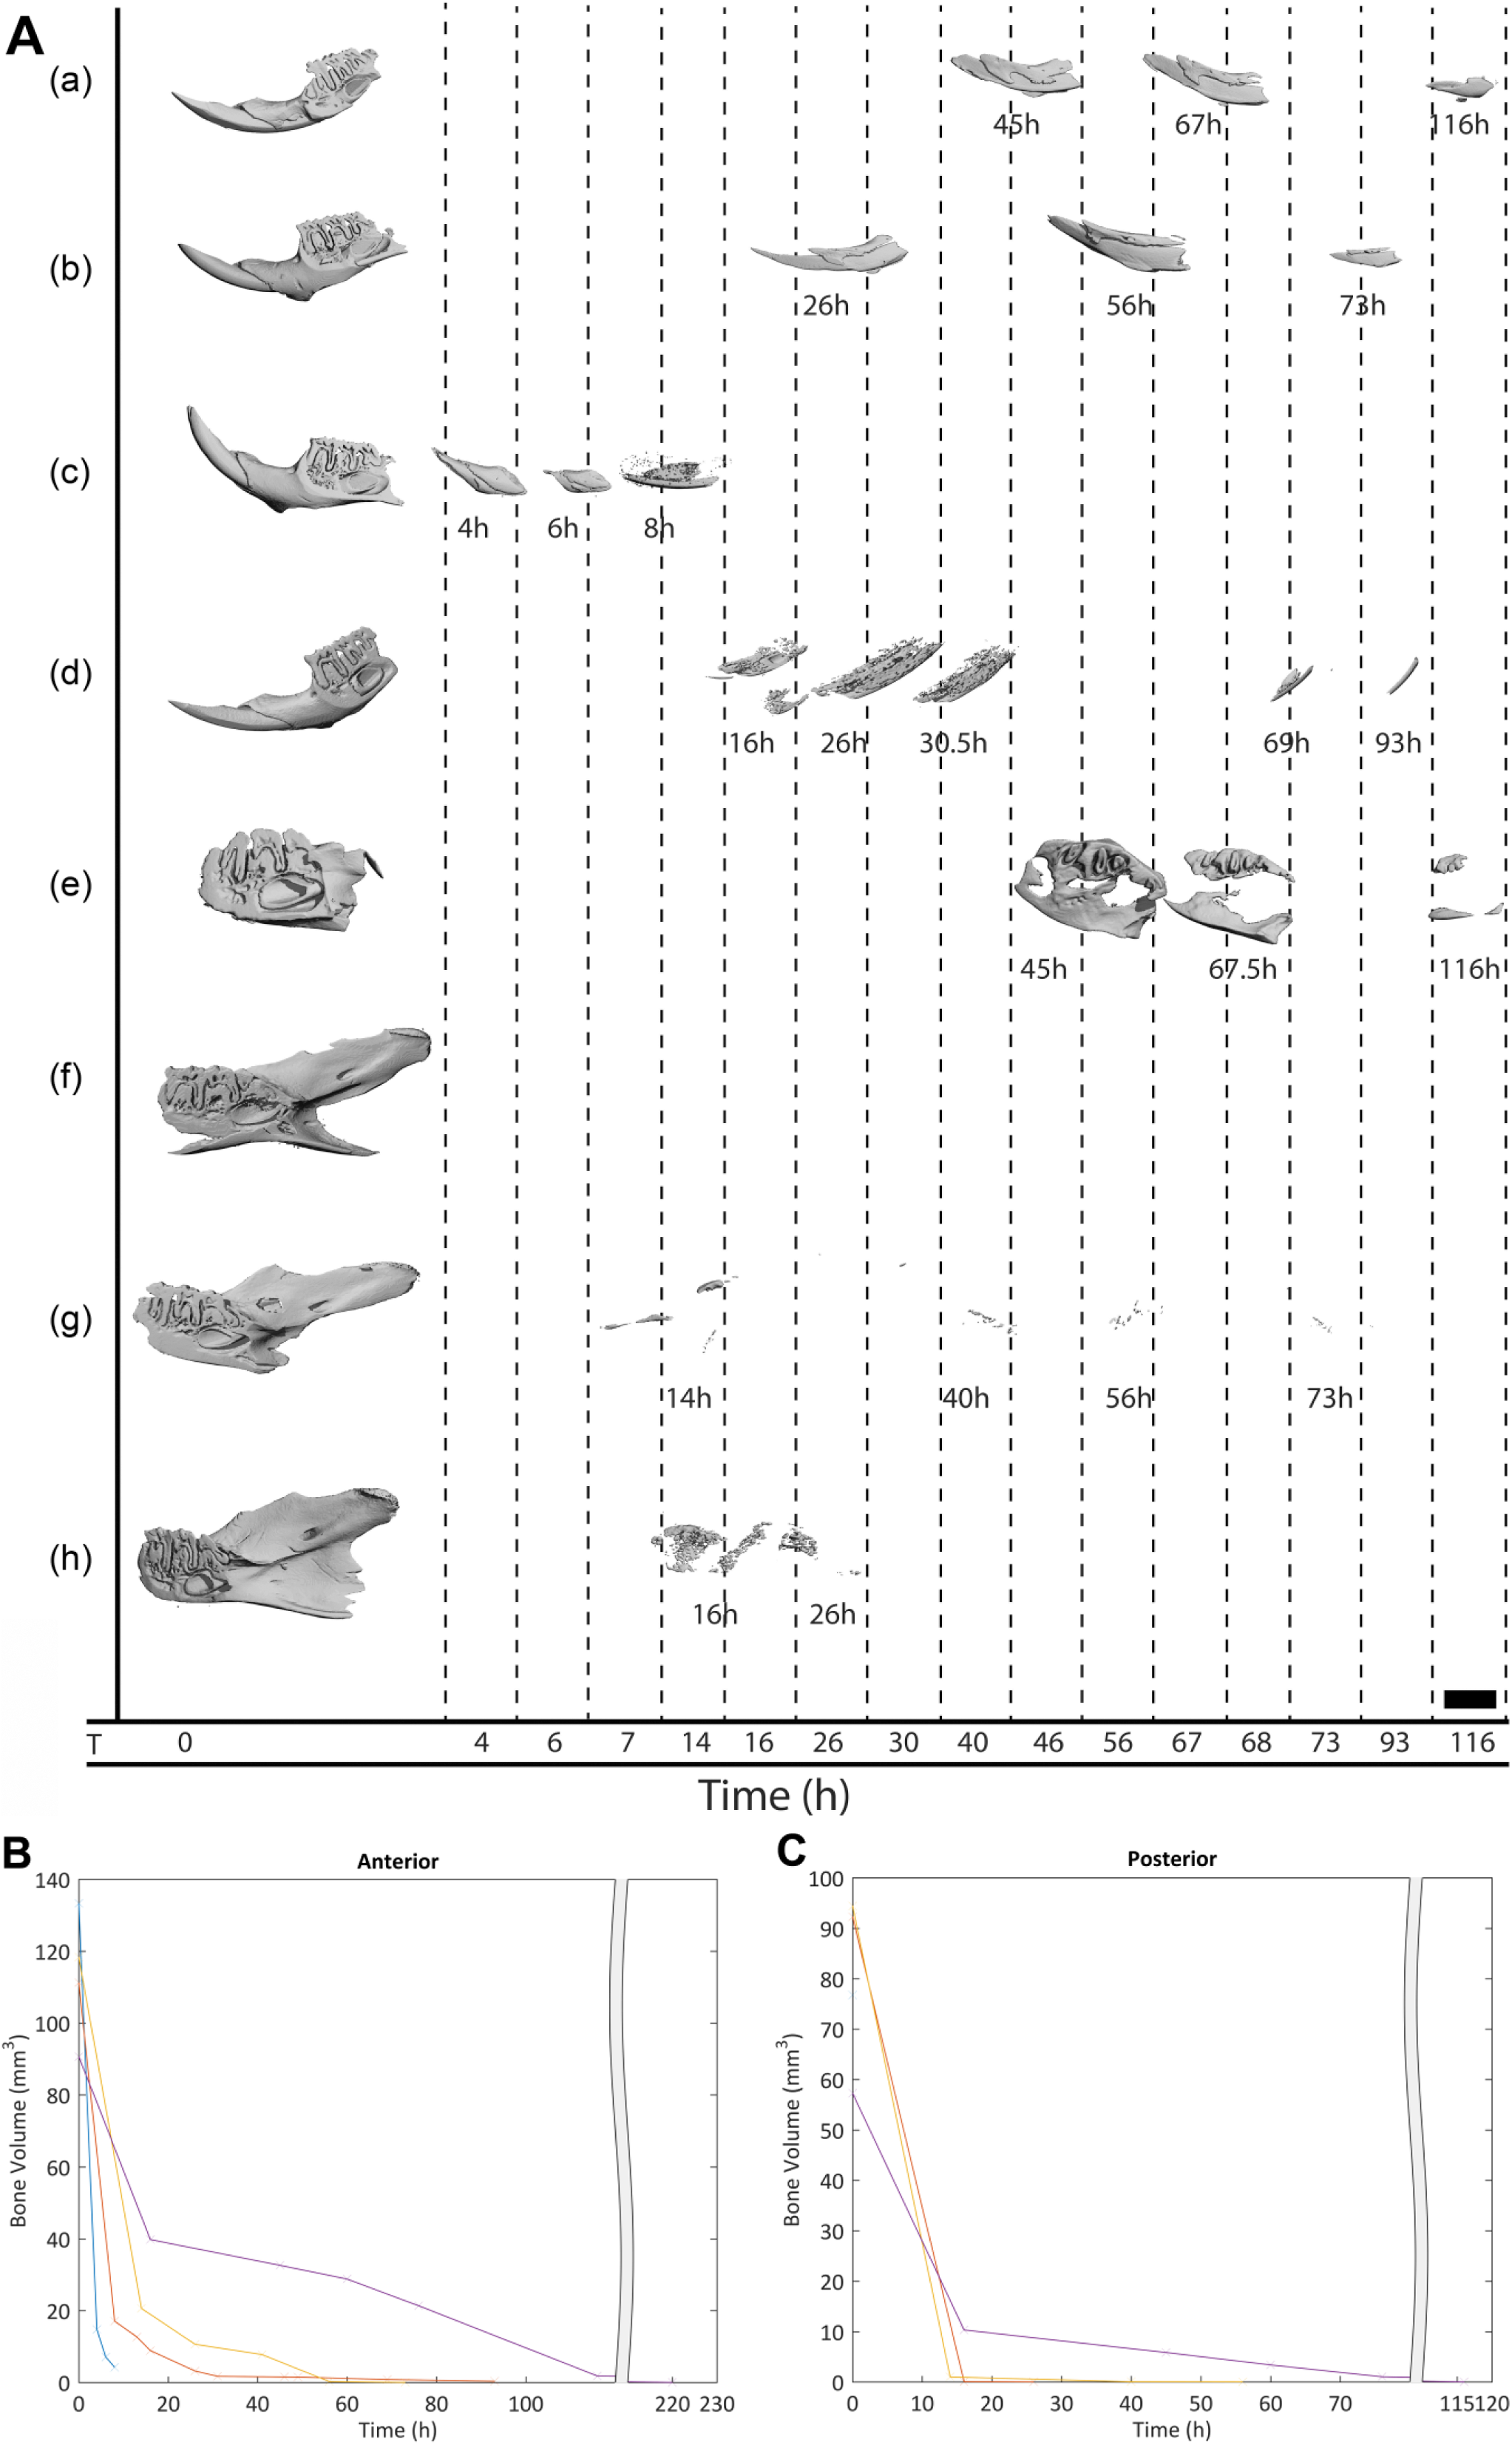
Three-dimensional microcomputed tomography (µCT) reconstructions of anterior and posterior portions of the rat mandible following different decalcification methods over time. (A) (a) 10% ethylenediaminetetraacetic acid (EDTA) room temperature (RT) anterior portion; (b) 10% EDTA 37C anterior portion; (c) 10% formic acid anterior portion; (d) 5% nitric acid anterior portion; (e) 10% EDTA RT posterior portion; (f) 10% EDTA 37C posterior portion; (g) 5% nitric acid posterior portion; and (h) 10% formic acid posterior portion. Scale bar: 1 mm. (B) Rate of decalcification of the anterior portions of the mandibles by bone volume (mm3) and time (hr). (C) Rate of decalcification of the posterior portions of the mandibles by bone volume (mm3) and time (hr).
µCT scans revealed that it took 220 hr for the anterior portion and 191 hr for the posterior portion of the mandibles to decalcify completely in 10% EDTA at RT—considered the “gold standard” for decalcification. The endpoint was reached when there was no more mineralized material detectable by µCT. By contrast, with 5% nitric acid, the anterior and posterior portions decalcified within 13 hr 30 min and 4 hr 20 min, respectively. With 10% formic acid, complete decalcification was achieved in 140 hr for the anterior portion and 36 hr in the posterior portion. Decalcification with 10% EDTA at 37C took 102 hr for the anterior portion and 73 hr for the posterior portion (Table 1).
Total Time Taken for Decalcification of the Rat Mandibles.
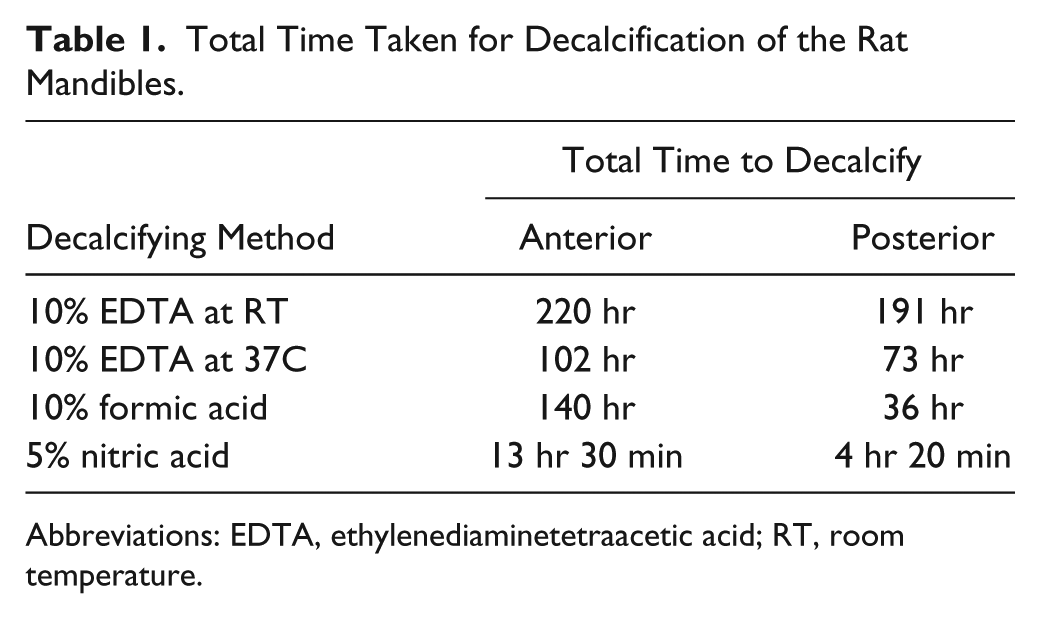
Abbreviations: EDTA, ethylenediaminetetraacetic acid; RT, room temperature.
Interestingly, µCT data demonstrated that the highest demineralization activity appeared to occur in the first day of decalcification with chelating chemistries (EDTA), whereas when acids were used, the decalcification was much faster with most of the activity occurring in the first few hours (Fig. 2B and C).
Evaluation of Ease of Sectioning
Samples that had been decalcified using 10% EDTA at RT, 10% EDTA at 37C, 5% nitric acid, and 10% formic acid were equally easy to section, producing continuous 5-µm-thick ribbons to a depth of 50 µm. However, rougher sectioning occurred deeper toward the core of the paraffin block. There was some crumbling and tearing occurring with all four treatments especially on the labial side of the anterior and posterior portions of the mandible.
The Role of Decalcification on Tissue Morphology and Antigen Preservation
Cellular and Structural Morphology Integrity
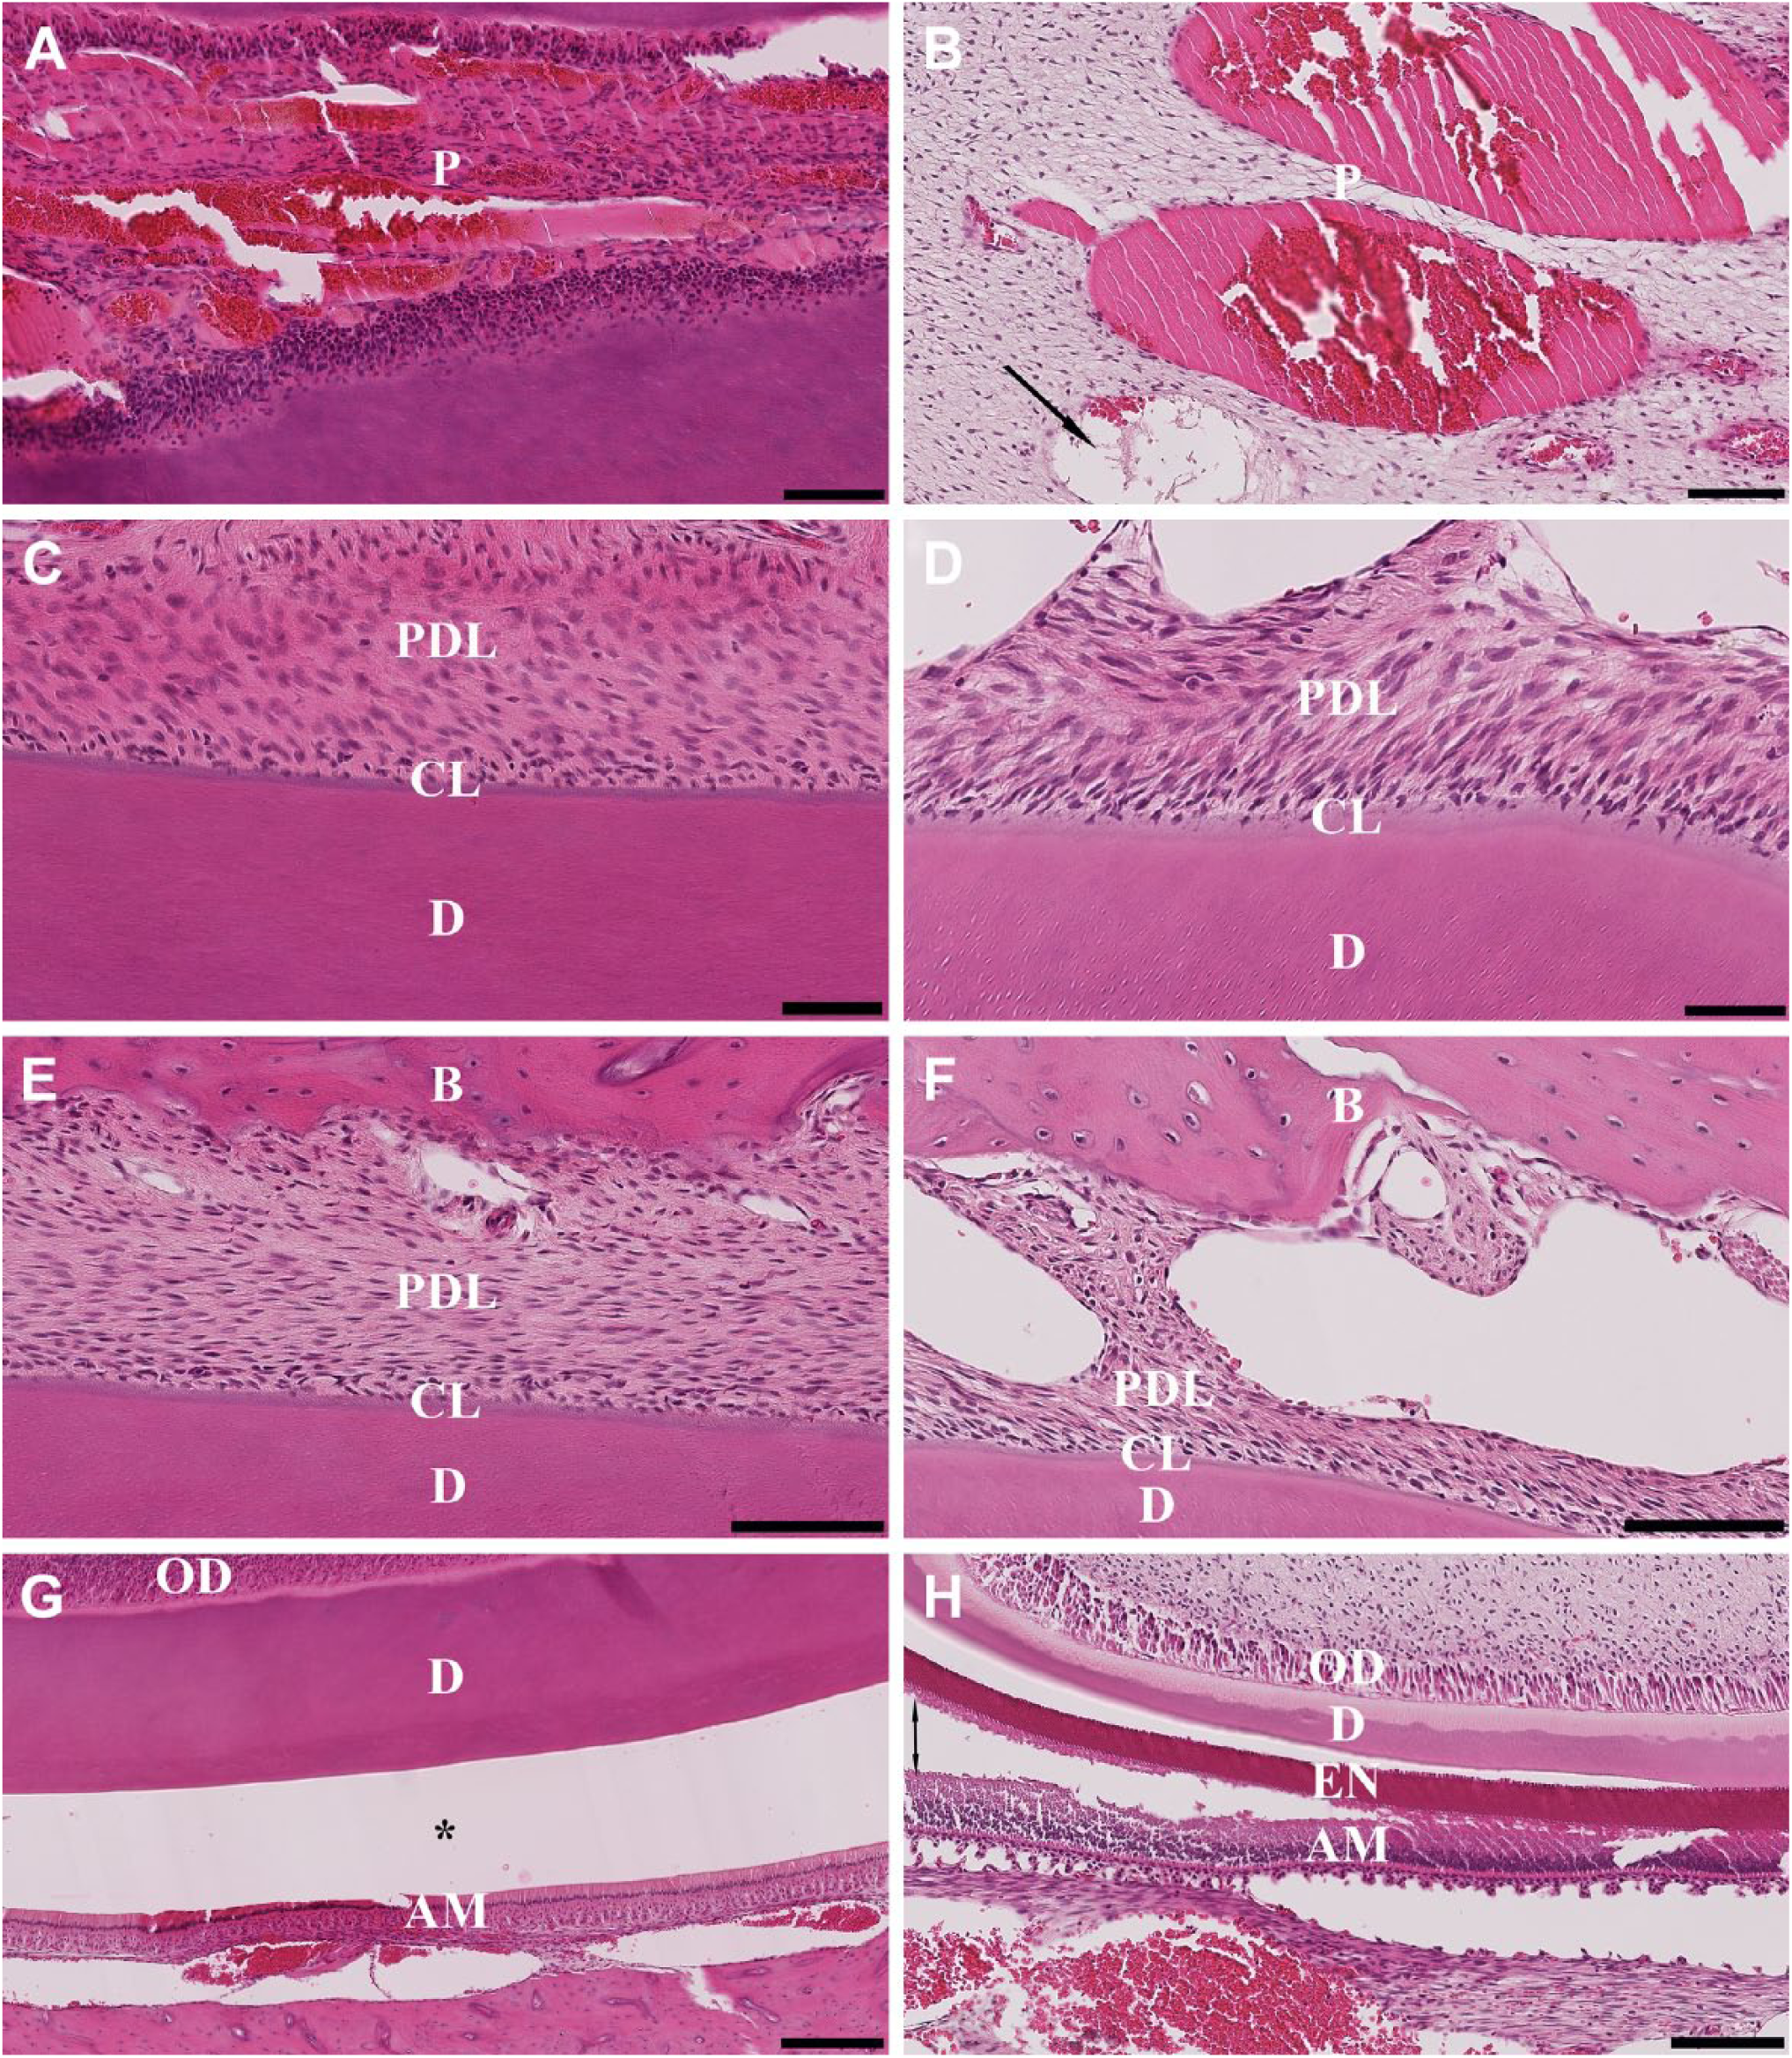
H&E staining was used to assess tissue preservation in terms of cellular and structural morphology and to compare the quality of staining resulting from the four decalcification methodologies. For the anterior portion of the mandible decalcified in 10% EDTA at RT, the current “gold standard” for bone decalcification, the structural morphology, seen as attachment of pulp, dentin, and periodontal ligament, was clearly distinct, as was the presence of a continuous and intact cementum line (Fig. 3A, C, and E). The cellular morphology, seen as the presence of ameloblast and odontoblast layers, was well preserved (Fig. 3G). Decalcification of the enamel from the incisor was seen as an empty space between dentin and inner enamel epithelium, also known as the dentinoenamel junction (Fig. 3G).
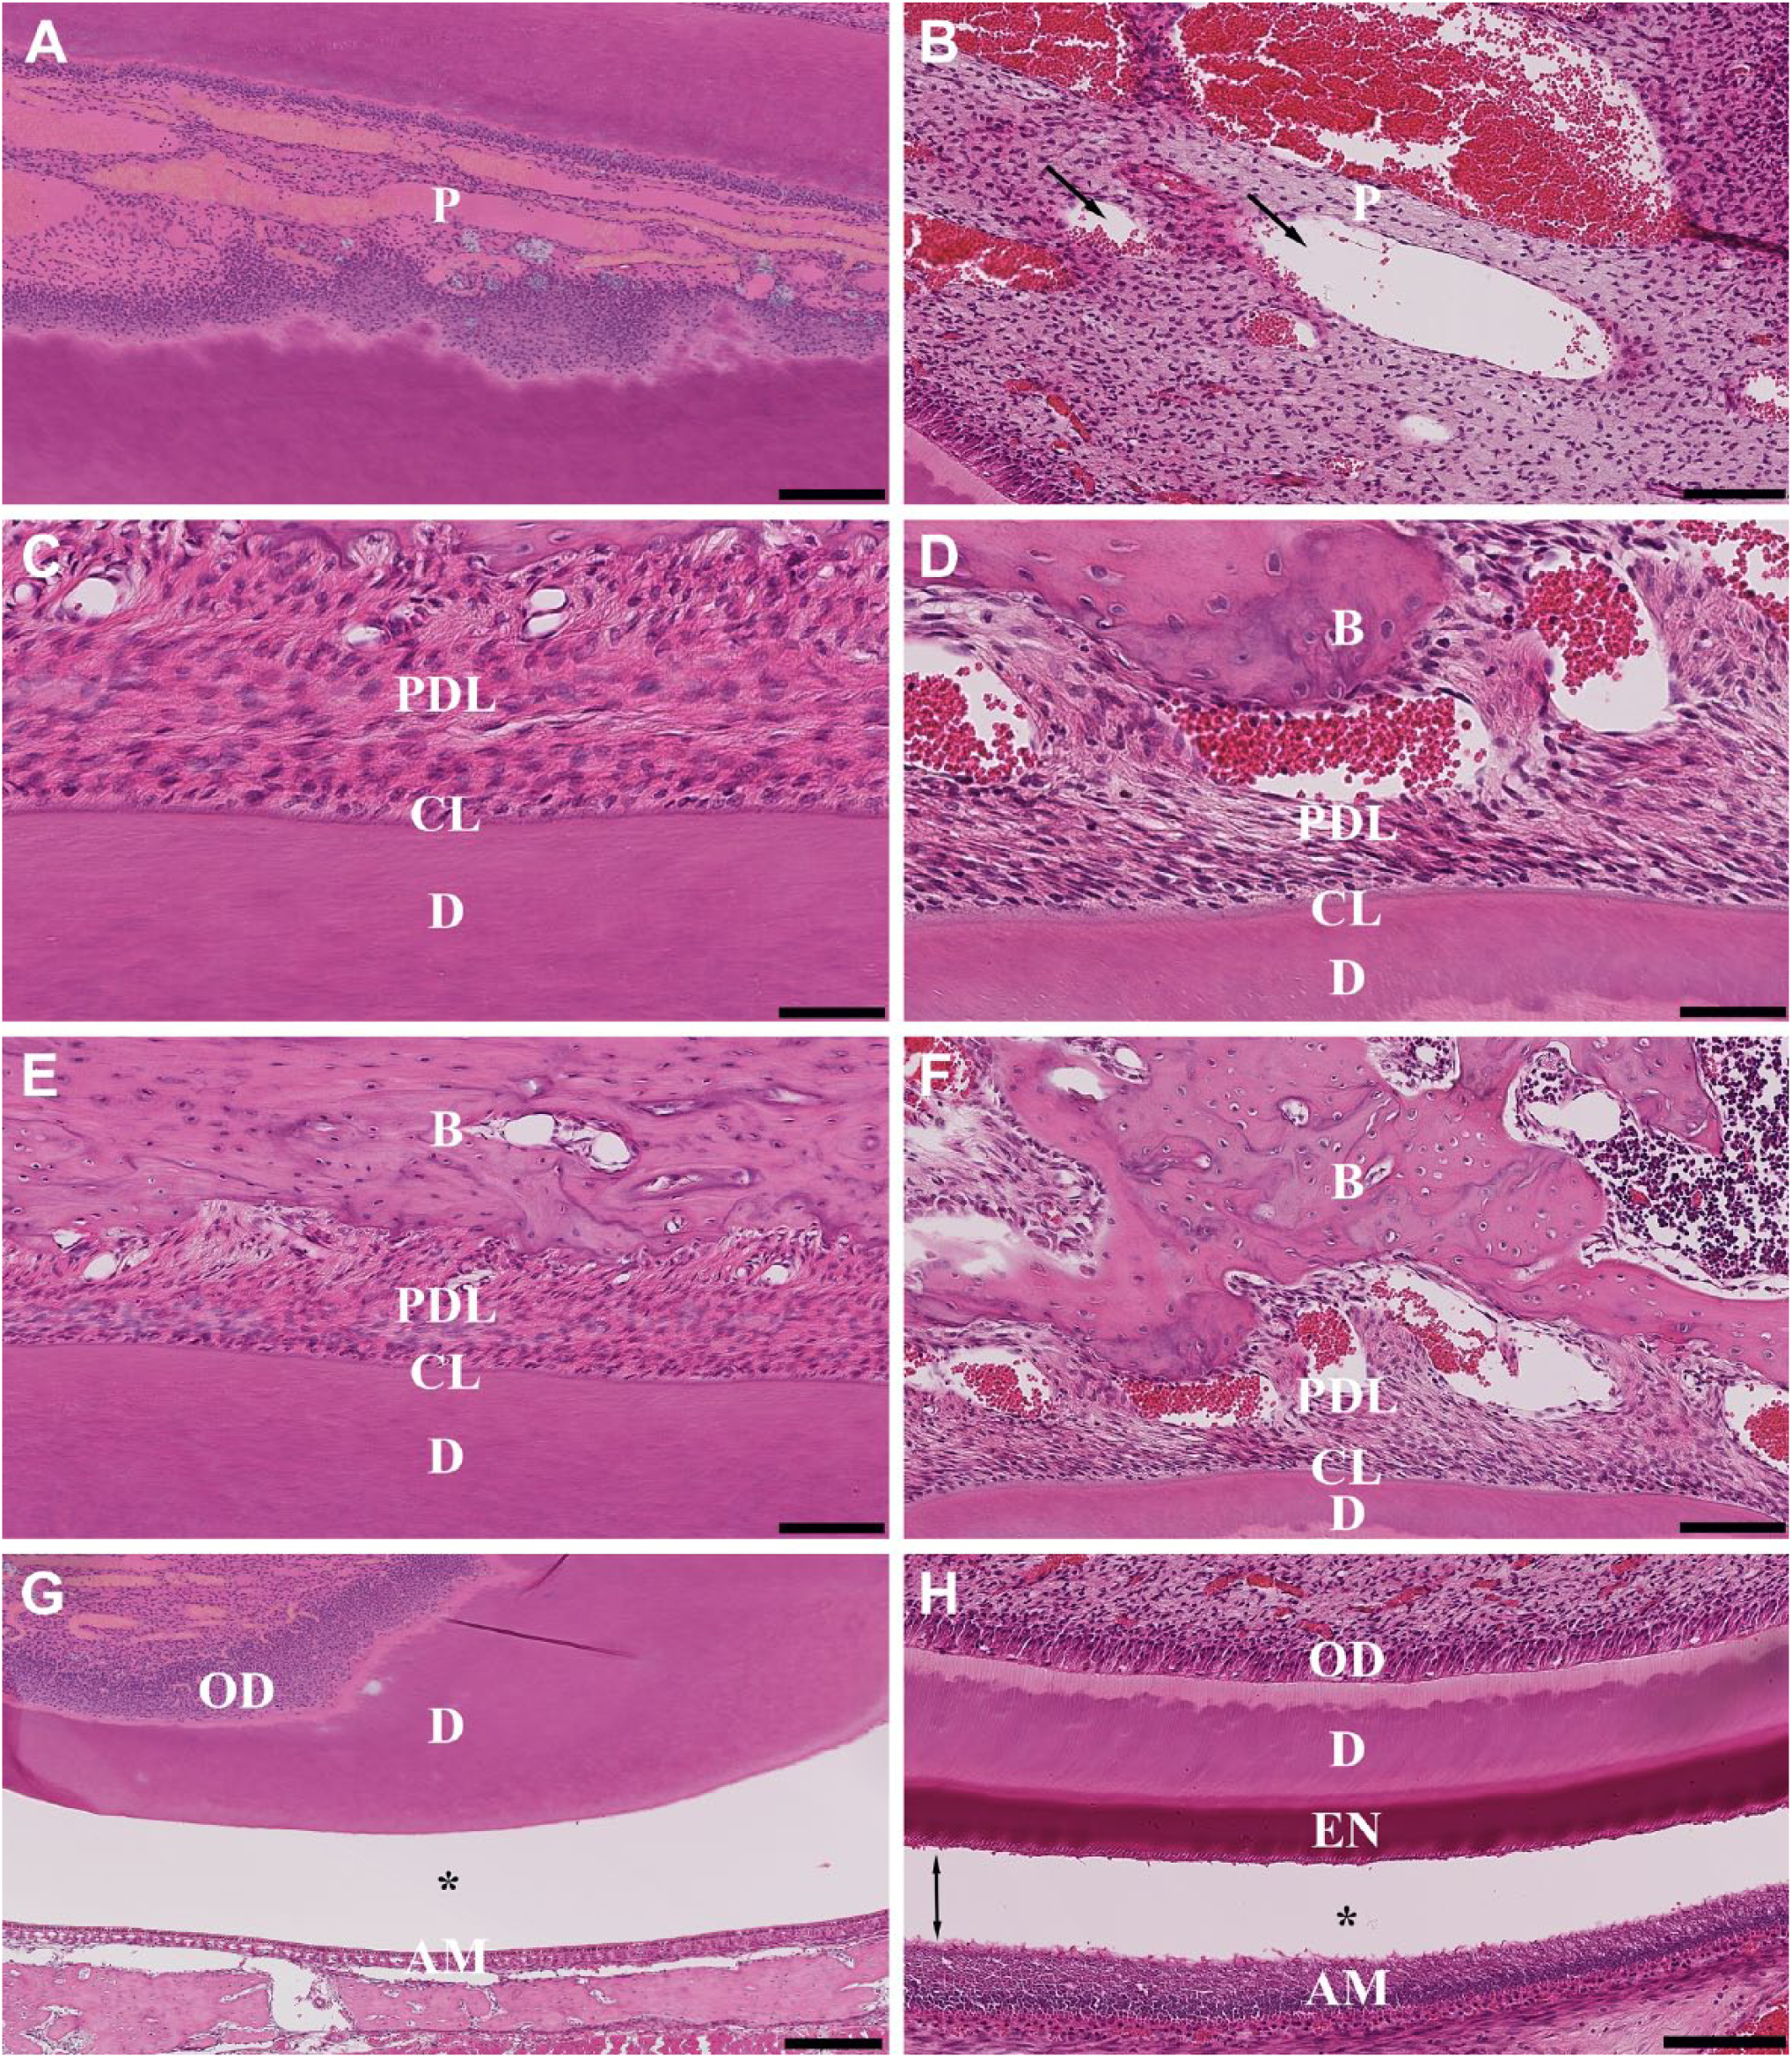
Hematoxylin and eosin–stained sections of the anterior (left column) and posterior (right column) portions of the rat mandible after decalcification with 10% EDTA RT. (A, B) Pulp dentinal zone (PDZ); (C, D) cementum line (CL); (E, F) periodontal ligament (PDL); (G, H) dentinoenamel junction (DEJ). Scale bars: A = 100 μm; B, E, F = 100 μm; C, D = 50 μm; G = 250 μm; H = 125 μm. Abbreviations: EDTA, ethylenediaminetetraacetic acid; RT, room temperature; P, pulp; D, dentin; B, bone; OD, odontoblast layer; AM, ameloblast layer; EN, enamel; one-head arrows, vacuolation; two-head arrows, disruption of the enamel layer from surrounding ameloblast layer; asterisk (*), artifactual space marking the dentinoenamel junction with ameloblast layer.
The posterior portion of the mandible decalcified in 10% EDTA at RT showed a loss of structural integrity as evidenced by visible vacuolation of the pulp zone and periodontal ligament (Fig. 3B, D, and F); however, odontoblast and ameloblast layers were preserved showing excellent cellular features (Fig. 3H). The presence of continuous cementum lines adherent to dentin and periodontal ligament also indicated that the tissue was well preserved (Fig. 3D). However, the presence of the enamel layer disrupted from the ameloblast layer was seen in this portion of the mandible (Fig. 3H).
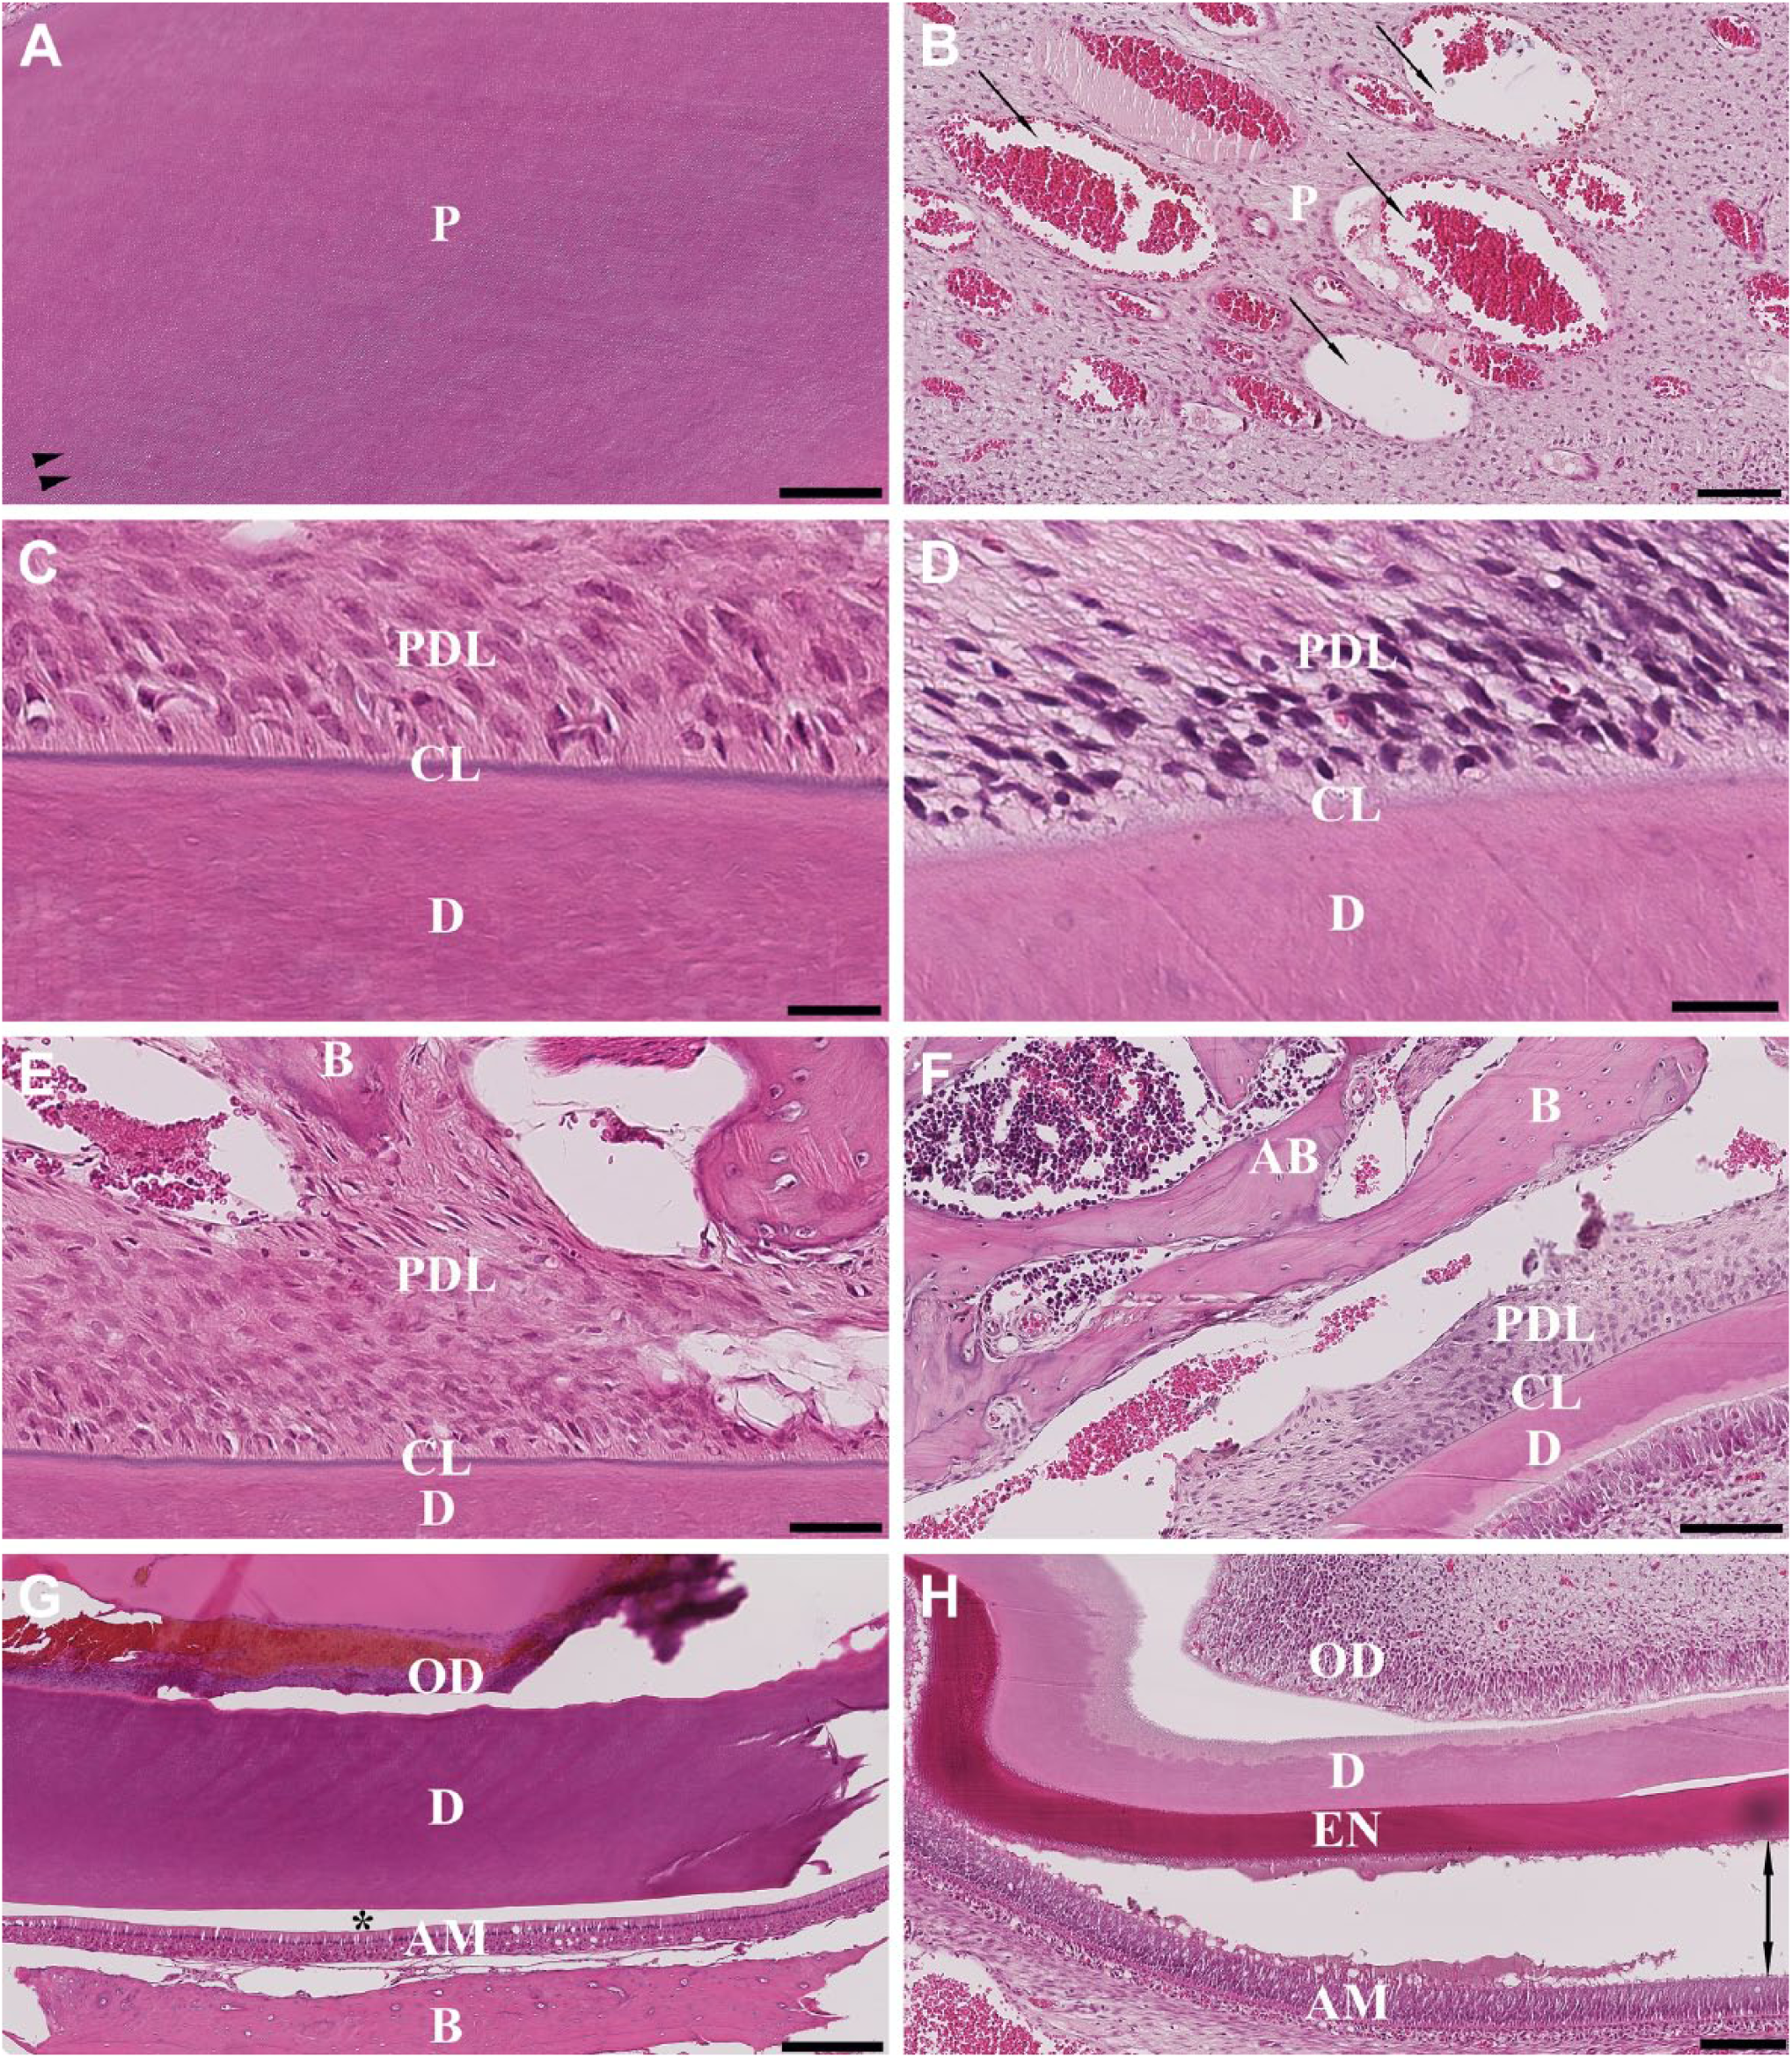
The anterior portion of the mandible decalcified in 10% EDTA at 37C showed some negative effects on cellular morphology which was evident by the ameloblast and odontoblast layers being slightly damaged (Fig. 4A and G). Maceration of the pulp (seen as a tissue digestion as a result of long exposure to the decalcifying solution) was observed (Fig. 4A), as well as vacuolation (seen as round medium/large vacuoles) of the periodontal ligament (Fig. 4E and G). Complete decalcification of the incisor enamel was observed as an artifactual space marking the dentinoenamel junction with ameloblast layer (Fig. 4G).
Hematoxylin and eosin–stained sections of the anterior (left column) and posterior (right column) portions of the rat mandible after decalcification with 10% EDTA at 37C. (A, B) Pulp dentinal zone (PDZ); (C, D) cementum line (CL); (E, F) periodontal ligament (PDL); (G, H) dentinoenamel Junction (DEJ). Scale bars: A, B = 100 μm; C, D = 50 μm; E, F = 100 μm; G = 250 μm; H = 125 μm. Abbreviations: EDTA, ethylenediaminetetraacetic acid; P, pulp; PDL, periodontal ligament; CL, cementum line; D, dentin; B, bone; OD, odontoblast layer; AM, ameloblast layer; EN, enamel; one-head arrows, vacuolation; two-head arrows, disruption and cluster of separation of the enamel layer from ameloblast layer; asterisk (*), artifactual space marking the dentinoenamel junction with ameloblast layer.
The posterior portion of the mandible decalcified with 10% EDTA at 37C demonstrated some negative effects on cellular and tissue structure. Separation of the ameloblast layer from the enamel layer and periodontal ligament could be seen (Fig. 4H). The structural morphology of dentin showed a widening of the dentinal tubules; however, the cementum line was maintained (Fig. 4D). There were a displacement of tissue components and vacuolation of the pulp and periodontal ligament (Fig. 4F), and the enamel layer appeared to disrupt from the dentinoenamel junction. Furthermore, cluster separation of the ameloblast layer from the enamel layer was observed (Fig. 4H).
The anterior and posterior portions of the mandible decalcified with 5% nitric acid showed excellent structural morphological quality compared with the other decalcification methods. There was no visible destruction of the incisors pulp and dentin; however, there was a widening of dentinal tubules in the anterior portion of the mandible (Fig. 5A). Integrity of the attachment unit (comprising the cementum line and periodontal ligament) was maintained (Fig. 5C and E). Severe vacuolation and degeneration of the periodontal ligament towards the ameloblast layer could be seen, and there was also a fraying of the dentinoenamel junction within the pulp (Fig. 5G). Complete decalcification of the incisor enamel was achieved (Fig. 5G).
Hematoxylin and eosin–stained sections of the anterior (left column) and posterior (right column) portions of the rat mandible after decalcification with 5% nitric acid. (A, B) Pulp dentinal zone (PDZ); (C, D) cementum line (CL); (E, F) periodontal ligament (PDL); (G, H) dentinoenamel junction (DEJ). Scale bars: A = 200 μm; B, F = 100 μm; C, D = 25 μm; E = 50 μm; G, H = 125 μm. Abbreviations: P, pulp; PDL, periodontal ligament; CL, cementum line; D, dentin; B, bone; AB, alveolar bone; OD, odontoblast layer; AM, ameloblast layer; EN, enamel; one-head arrows, vacuolation; two-head arrows, disruption and cluster of separation of the enamel layer from ameloblast layer; asterisk (*), artifactual space marking the dentinoenamel junction with ameloblast layer; ►►, dentinal tubules.
The posterior portion of the mandible decalcified in 5% nitric acid exhibited some negative effects on the structural morphology. For example, there were visible vacuolation and disruption of the pulp from surrounding dentin tissue, as well as rupture of the ameloblast layer from the enamel layer (Fig. 5B and H). The presence of a dark hematoxylin stain on the alveolar bone zone (Fig. 5F) and opening of dentine tubules with cluster separation of the enamel layer from the ameloblast layer were evident (Fig. 5H). However, good cellular morphology preservation was seen in the form of clearly distinguishable odontoblasts, pre-dentin, dentin, pre-enamel, enamel, and ameloblasts (Fig. 5H) and an absence of any adverse effects on the cementum line (Fig. 5D).
The anterior portion of the mandible decalcified in 10% formic acid exhibited well-preserved structural morphology and exhibited a pristine ameloblast layer with discrete cytoplasmic vacuoles (Fig. 6G). Formic acid appeared to have a slight negative effect on tissue morphology as seen as opening of dentinal tubules in the pulp (Fig. 6A). There was good preservation of the attachment unit, as seen by the presence of the cementum line being connected to the dentin and intact and continuous periodontal ligament (Fig. 6C and E). However, there was a slight vacuolization of the periodontal ligament (Fig. 6E). The incisor enamel was completely decalcified as could be seen as a remnant artifactual space (Fig. 6G).
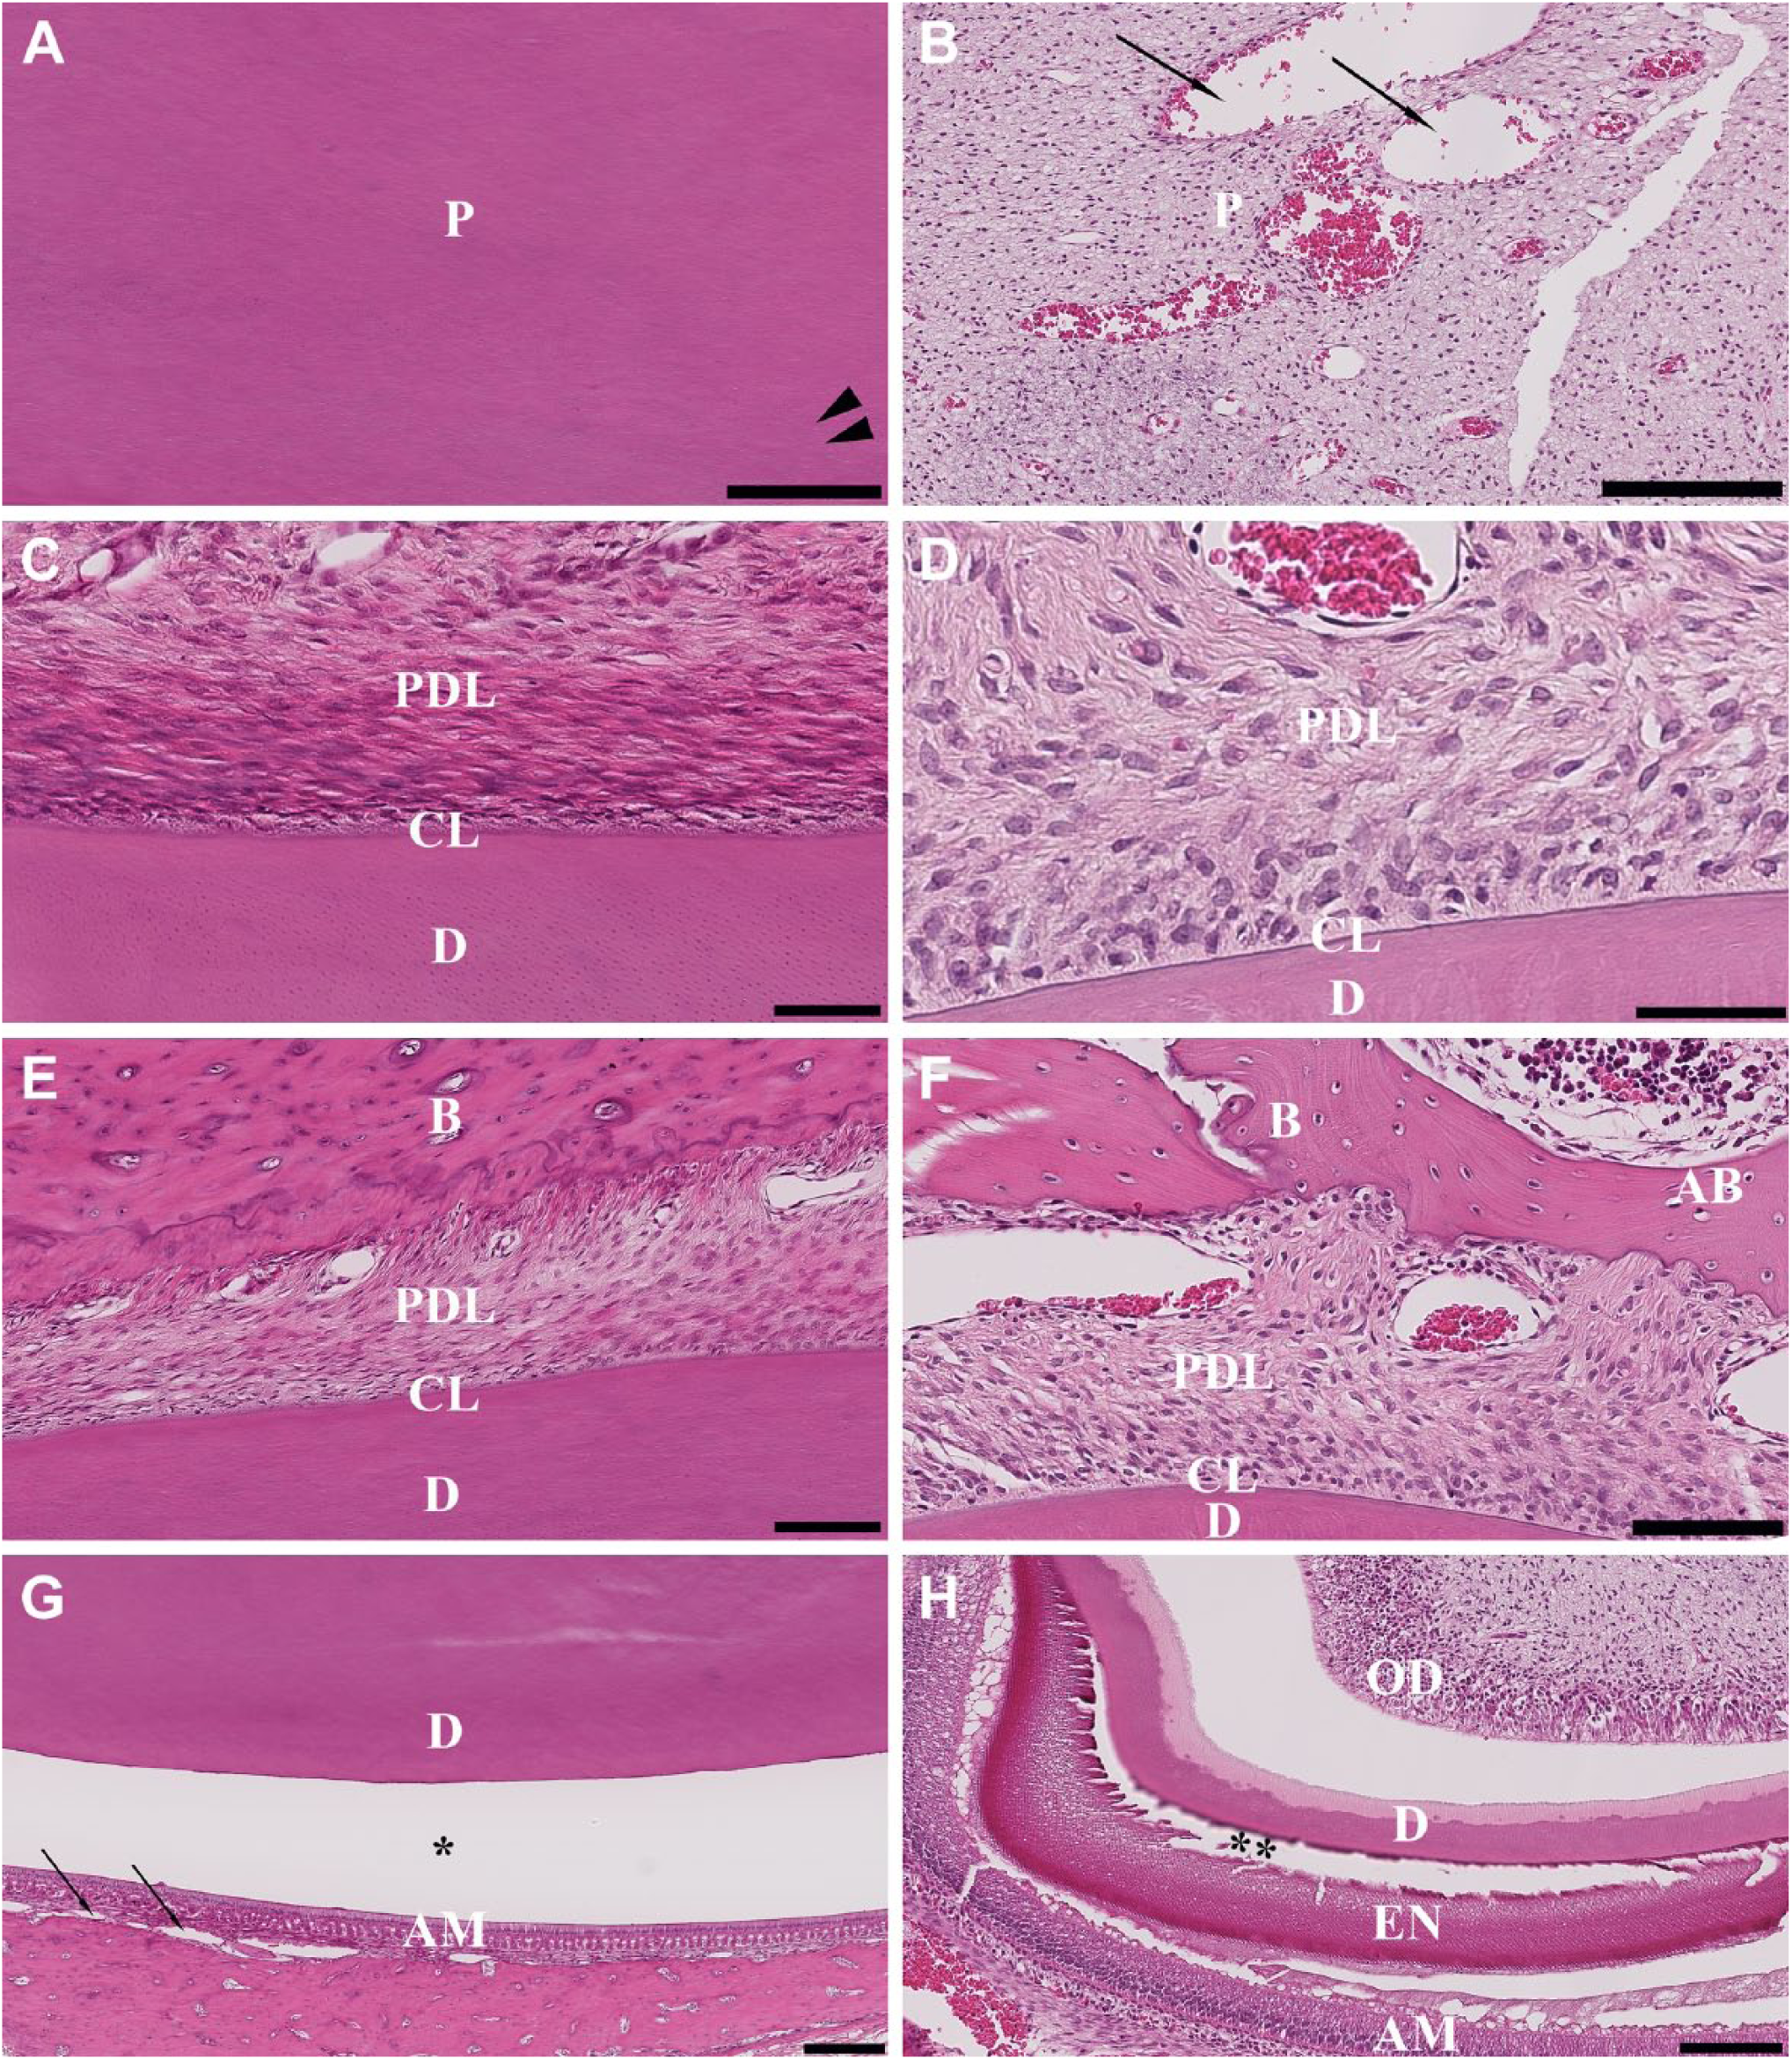
Hematoxylin and eosin–stained sections of the anterior (left column) and posterior (right column) portions of the rat mandible after decalcification with 10% formic acid. (A, B) Pulp dentinal zone (PDZ); (C, D) cementum line (CL); (E, F) periodontal ligament (PDL); (G, H) dentinoenamel junction (DEJ). Scale bars: A, B = 200 μm; C, D = 50 μm; E, F = 100 μm; G = 250 μm; H = 125 μm. Abbreviations: P, pulp; PDL, periodontal ligament; CL, cementum line; D, dentin; B, bone; AB, alveolar bone; AM, ameloblast layer; OD, odontoblast layer; EN, enamel; one-head arrows, vacuolation; asterisk (*), artifactual space marking the dentinoenamel junction with ameloblast layer; ►►, dentinal tubules; double asterisk (**), fraying of the dentinal border and enamel granular aspect.
The posterior portion of the mandible decalcified with 10% formic acid exhibited acceptable preservation of cellular morphology. Vacuolation of the pulp as well as disruption of the surrounding odontoblast layer from dentin could be seen (Fig. 6B and H). H&E staining revealed clearly distinguishable odontoblasts, ameloblasts, pre-dentin, dentin, pre-enamel, and enamel (Fig. 6H). However, there were a fraying of the dentinal border with a granular aspect and loss of cohesion of the enamel tissue on the dentinoenamel junction with resultant maceration and separation of the ameloblast layer from enamel layer (Fig. 6H). A dark hematoxylin stain of the alveolar bone zone can be seen (Fig. 6F). Nevertheless, the enamel appeared to be reasonably damaged (Fig. 6H). Tables 2 and 3 summarize the evaluation of cellular and morphological staining characteristics between the four decalcifying methods used.
Evaluation of Cellular and Morphological Staining Characteristics Between the Decalcifying Solutions for the Anterior Portion of the Mandibles.
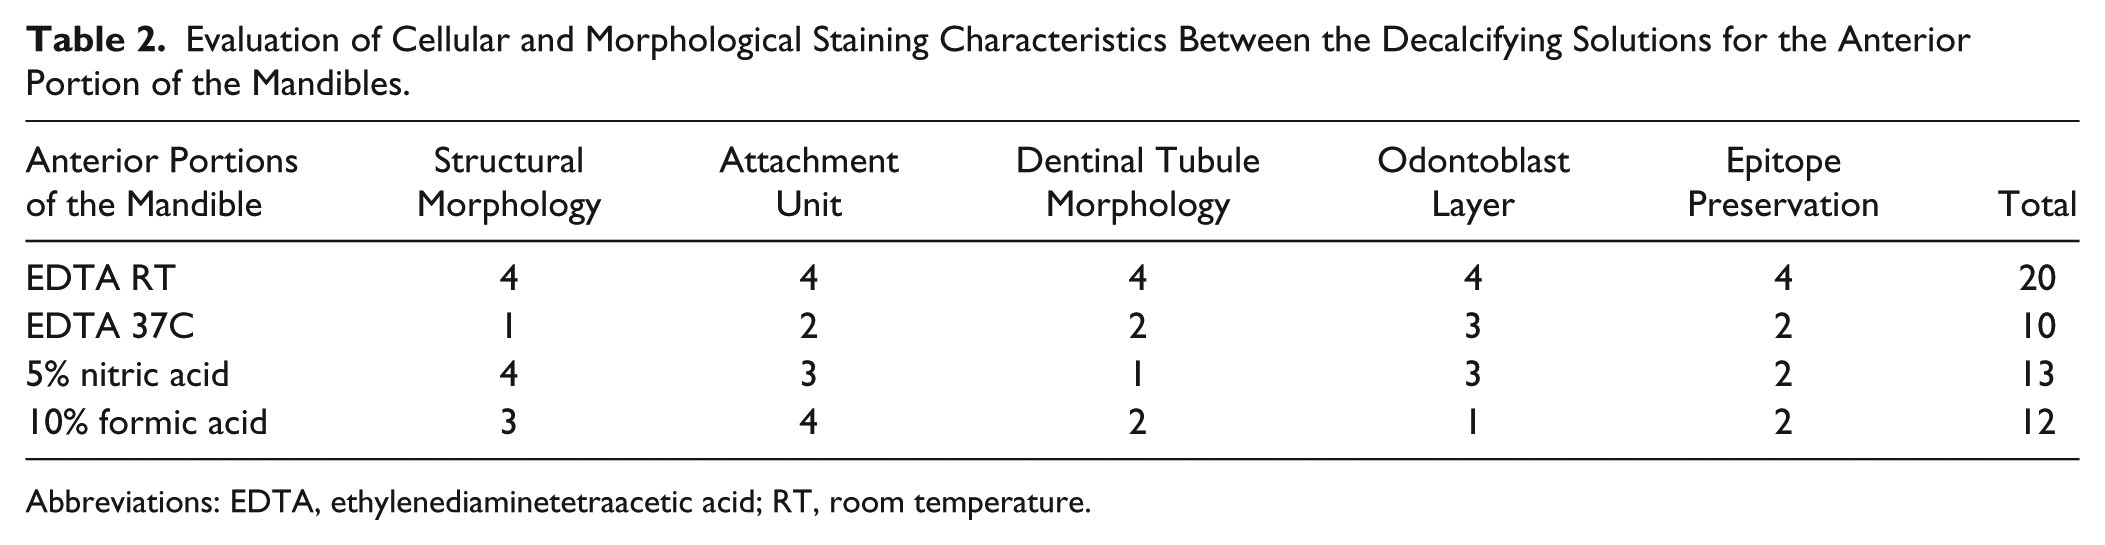
Abbreviations: EDTA, ethylenediaminetetraacetic acid; RT, room temperature.
Evaluation of Cellular and Morphological Staining Characteristics Between the Decalcifying Solutions for the Posterior Portion of the Mandibles.
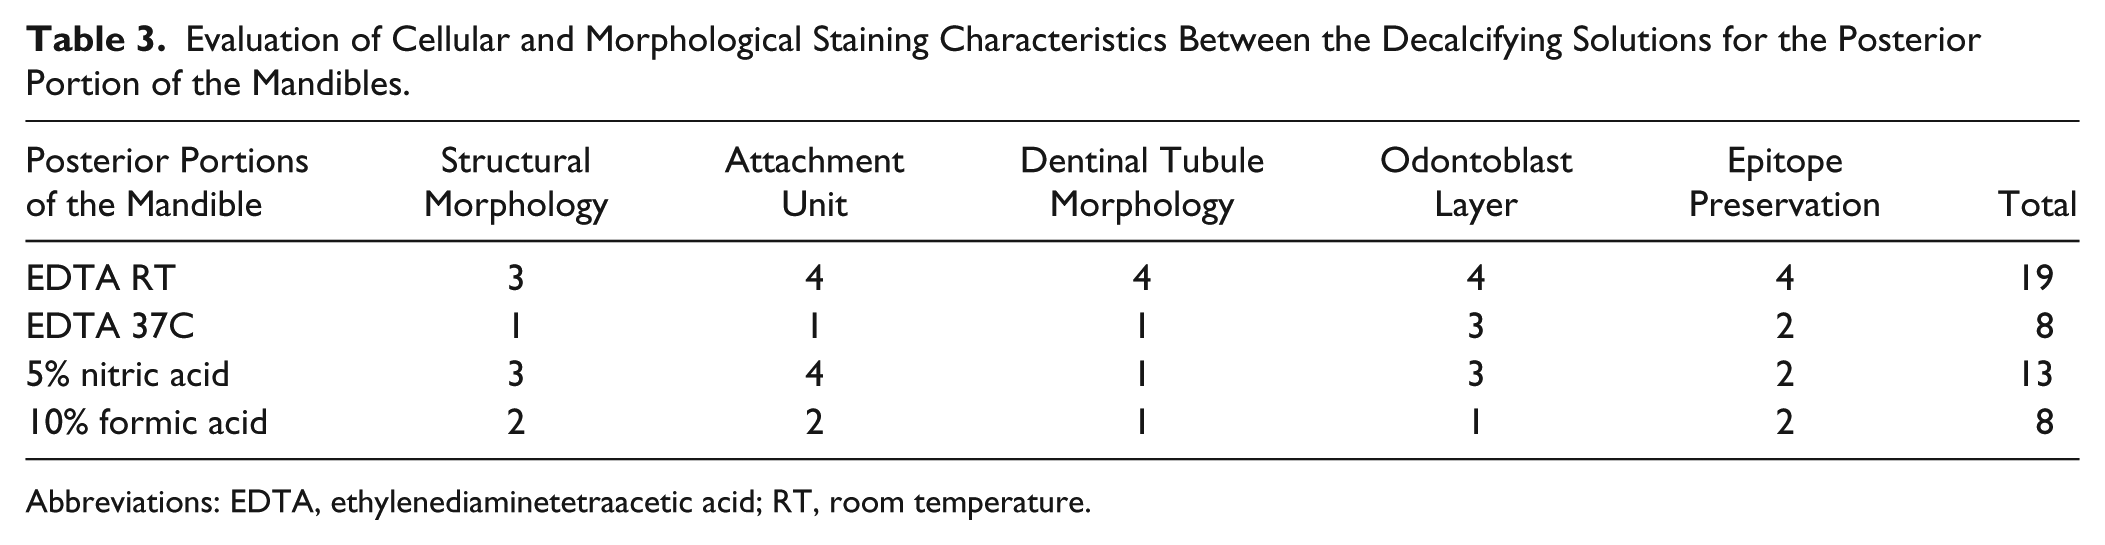
Abbreviations: EDTA, ethylenediaminetetraacetic acid; RT, room temperature.
Antigen Preservation
The immunoreactivity of paraffin-embedded bone tissues was tested to determine which decalcification method gave optimal epitope preservation and therefore produced optimal IHC results. For this purpose, we used four well-characterized cell-specific markers: vWF, an endothelial cell marker used to determine blood vessel formation; Col-1, an abundant fibrous protein in the extracellular matrix of bone; Osx and Runx2, specific transcription factors in mesenchymal cells differentiating into osteoblasts.
The incubation time and dilution of each antibody were first optimized on the tissue decalcified using 10% EDTA at RT, and once these parameters had been established, they were then used to compare the four decalcification groups. Immunolocalization of vWF can be seen as strong staining of the endothelial cells lining the blood vessels (Fig. 7). In the 10% EDTA RT treatment, the staining was more intense in the anterior portion (Fig. 7A) than in the posterior portion (Fig. 7B), which exhibited little or no staining of endothelial cells. The bone marrow regions showed immunoreactivity to vWF in the form of megakaryocytes which had an intense staining (Fig. 7B). Tissue decalcified in 10% EDTA at 37C (Fig. 7C and D) and 10% formic acid (Fig. 7G and H) exhibited a staining pattern similar to that in the 10% EDTA at RT group. However, the tissue in the EDTA at 37C group exhibited a more intense vWF signal in the endothelial cells (Fig. 7C) than that seen in the EDTA at RT group (Fig. 7A). The vWF staining was less intense in either portions of the mandible decalcified with 5% nitric acid and 10% formic acid (Fig. 7E–H). There was no staining in any of the tissues regardless of decalcification method when a rabbit IgG isotype was used in conjugation with secondary antibody as a negative control (Supplementary Fig. 1A–H).
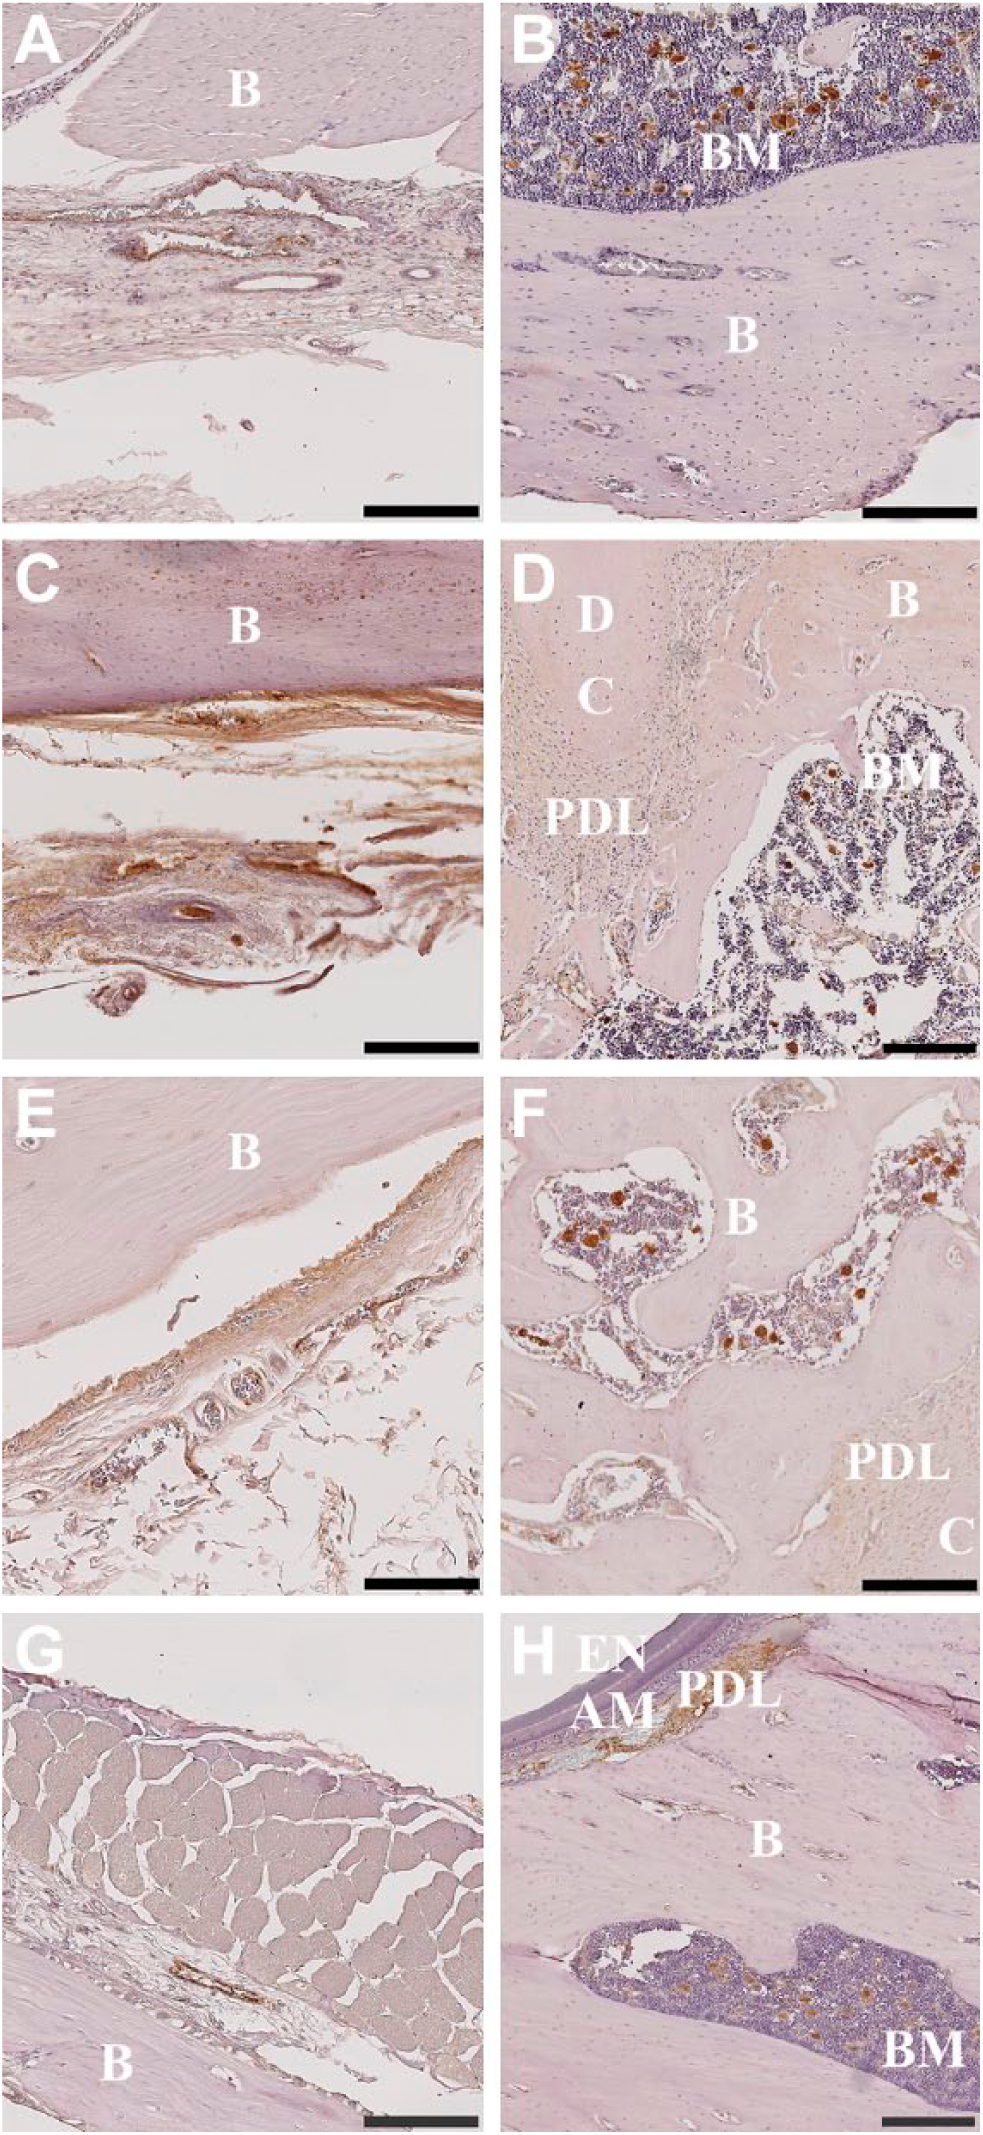
Immunolocalization of vWF in the anterior (left column) and posterior (right column) portions of the rat mandible following the use of varying decalcification agents. Decalcification with 10% EDTA at room temperature (A, B); 10% EDTA at 37C (C, D); 5% nitric acid (E, F); 10% formic acid (G, H). Negative control rabbit IgG was used to label adjacent tissue sections for each decalcification agent (Supplementary Fig. 1A, C, E, G [anterior]; B, D, F, H [posterior]). Scale bars: A–D, F, H = 200 μm; E, G = 100 μm. Abbreviations: vWF, von Willebrand factor; EDTA, ethylenediaminetetraacetic acid; B, bone; BM, bone marrow; D, dentin; C, cementum; B, bone; PDL, periodontal ligament; EN, enamel; AM, ameloblast layer.
Immunolocalization of Col-1 was observed in varying intensities throughout the different tissue types in either portion of the rat mandible when decalcified with 10% EDTA at RT (Fig. 8A and B). More specifically, Col-1-positive immunostaining was seen within the mineralized matrix, the osteoid, and osteoblasts, and cementum lines. Cell nuclei are distinctly stained with hematoxylin and are seen throughout the tissue. The Col-1 signal is more intense in tissue decalcified with 10% EDTA at 37C than at RT (Fig. 8C and D). However, the tissue portions decalcified in 10% formic acid exhibited less intense Col-1 staining compared with 10% EDTA at RT (Fig. 8G and H). There was no staining in tissue decalcified with 10% EDTA at RT and 10% formic acid with a rabbit IgG isotype negative control which was used in conjunction with the secondary antibody (Supplementary Fig. 2A, B, G, and H). There was, however, some nonspecific staining in the periodontal ligament and soft tissue for the posterior portion of the samples decalcified with 5% nitric acid (Supplementary Fig. 2F), and for the anterior and posterior portions of the samples decalcified with 10% EDTA at 37C (Supplementary Fig. 2C and D).
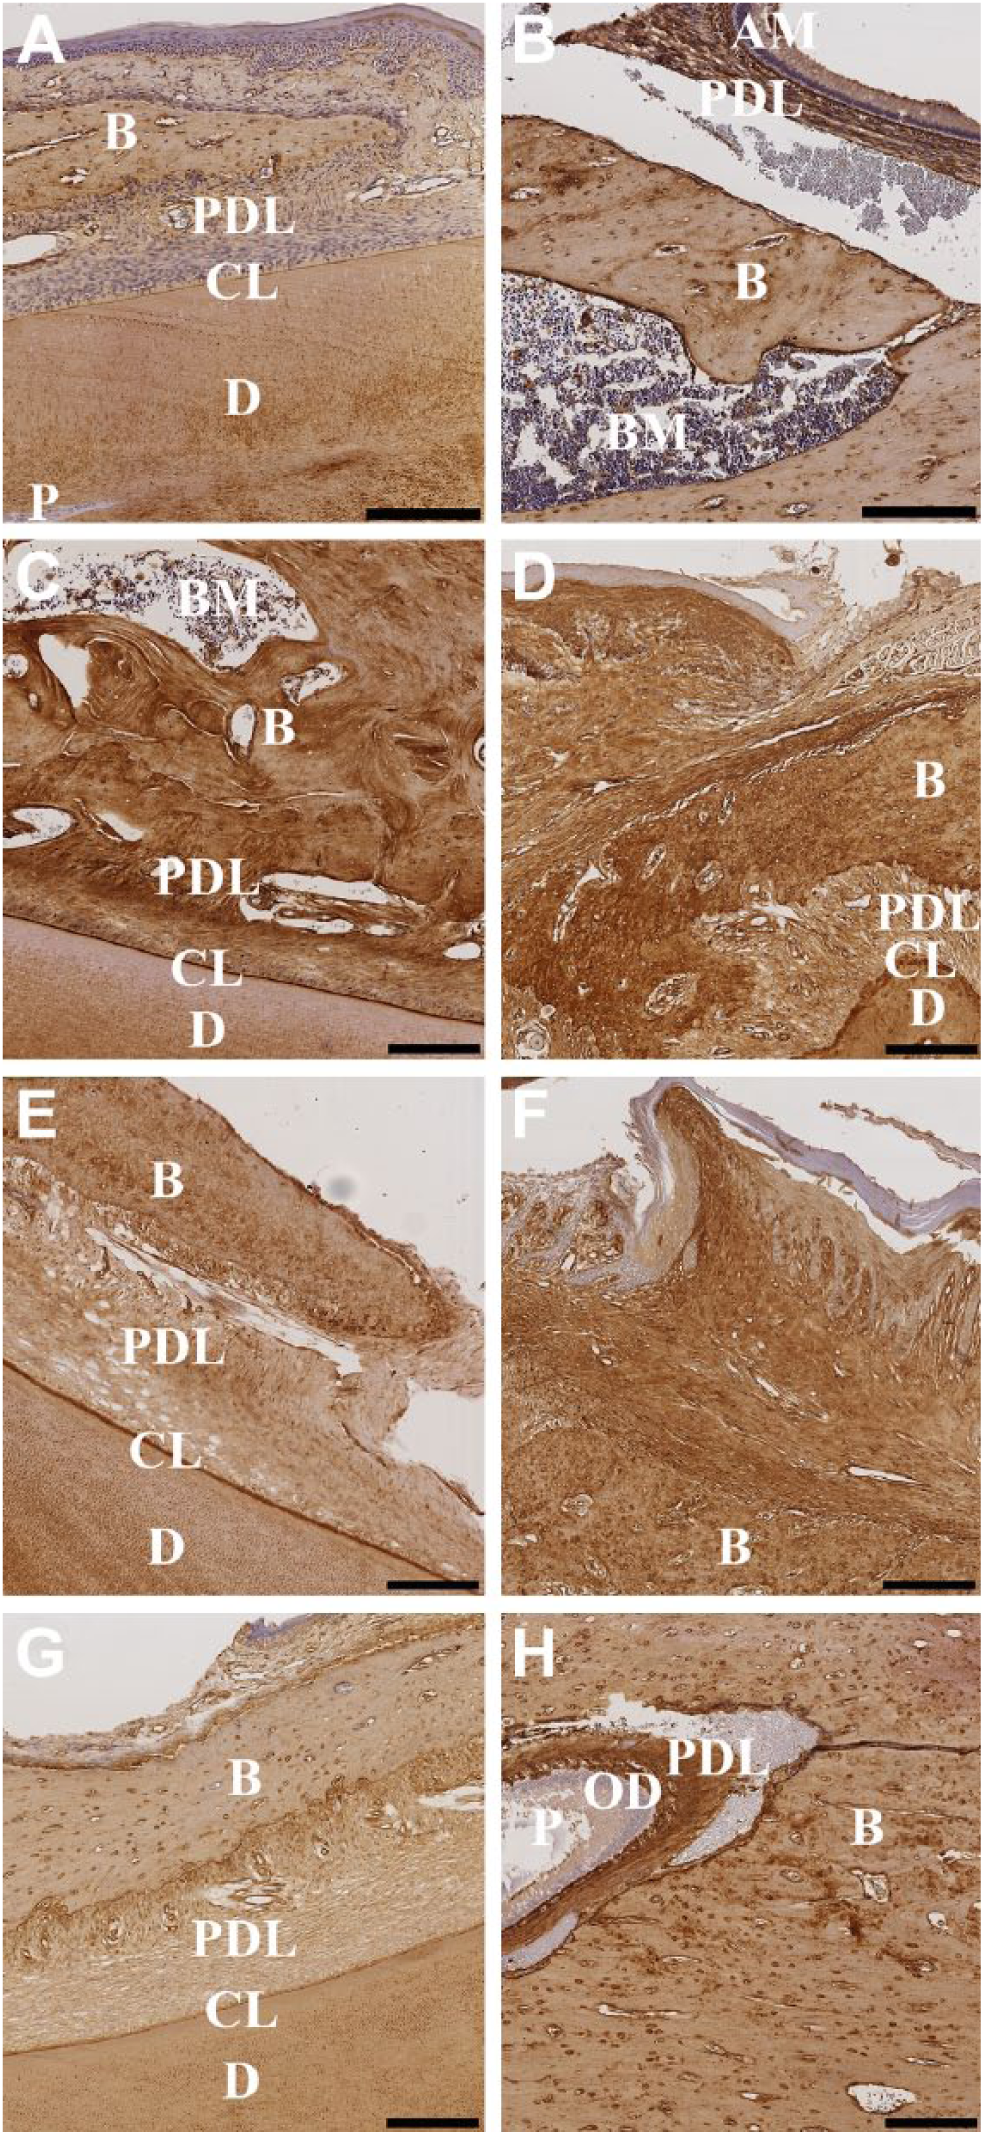
Immunolocalization of collagen I in the anterior (left column) and posterior (right column) portions of the rat mandible following the use of varying decalcification agents. Decalcification with 10% EDTA at RT (A, B); 10% EDTA at 37C (C, D); 5% nitric acid (E, F); 10% formic acid (G, H). Negative control rabbit IgG was used to label adjacent tissue sections for each decalcification agent (Supplementary Fig. 2A, C, E, G [anterior]; B, D, F, H [posterior]). Scale bars: A–H = 200 μm. Abbreviations: EDTA, ethylenediaminetetraacetic acid; RT, room temperature; B, bone; PDL, periodontal ligament; CL, cementum line; D, dentin; P, pulp; AM, ameloblast layer; BM, bone marrow; OD, odontoblast layer.
Osx-positive immunostaining was seen only within the ameloblast layer of the dentinoenamel junction of the anterior portion of the mandibles decalcified in 10% EDTA at RT (Fig. 9A). Also, Runx2 immunostaining was observed only in the ameloblast layer of the anterior portion of the mandibles (Supplementary Fig. 4A). However, there was some nonspecific staining in the ameloblast layer of the rabbit IgG isotype negative control (Supplementary Fig. 3A). The posterior portions of the mandibles decalcified in 10% EDTA at RT showed positive Osx staining in the cementoblast and osteoblast cells of the periodontal ligament, as well as in the bone tissue cavity of the molar root complex (Fig. 9B). Runx2 immunostaining (Supplementary Fig. 4B) and rabbit IgG isotype negative control (Supplementary Fig. 3B and 4B) did not show any reactivity for the posterior portions of the mandibles decalcified in 10% EDTA at RT.
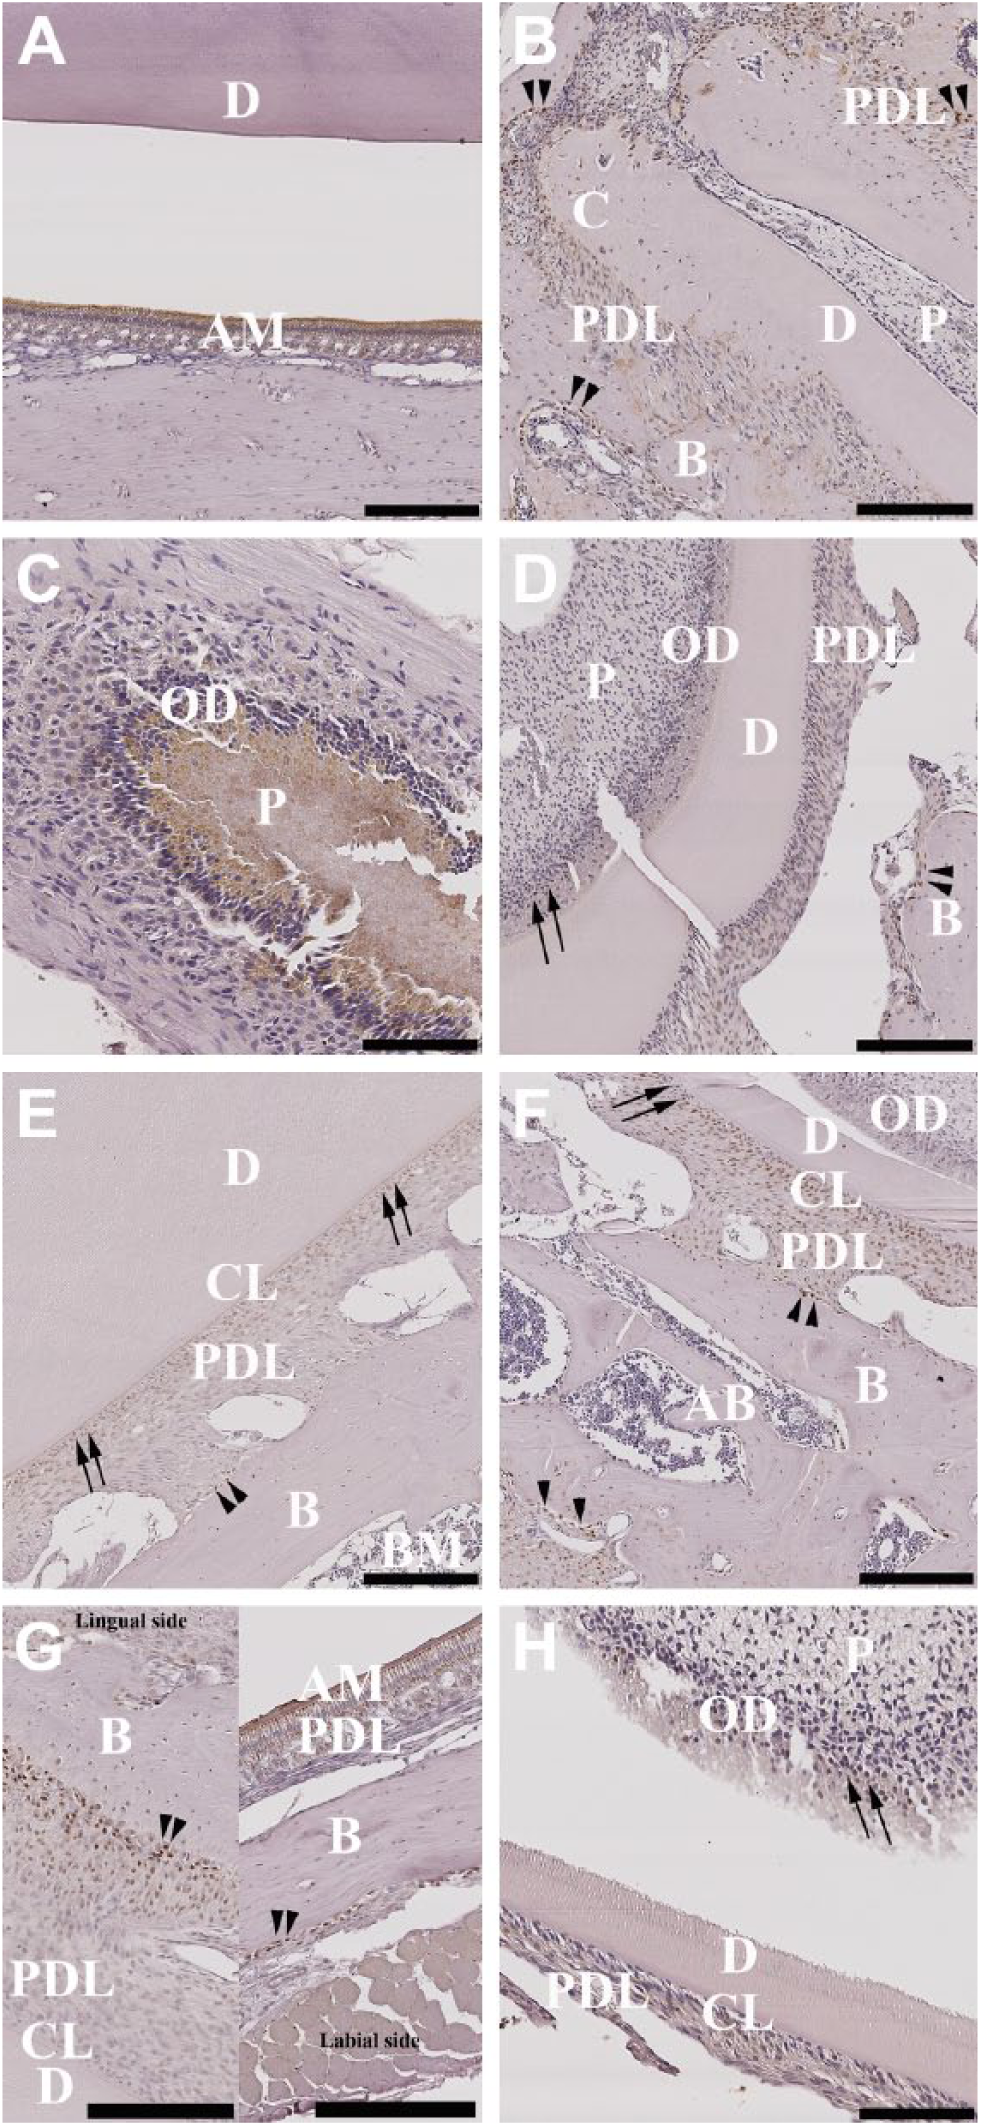
Immunolocalization of Osx in the anterior (left column) and posterior (right column) portions of the rat mandible following use of varying decalcification agents. Decalcification with 10% EDTA (A, B); 10% EDTA at 37C (C, D); 5% nitric acid (E, F); 10% formic acid (G, H). (A) Dentinoenamel junction (DEJ); (B) molar’s root complex; (C, D, H) pulp dentinal zone (PDZ); (E, F) periodontal ligament complex (PDL); (G) periodontal ligament complex (PDL) and dentinoenamel junction (DEJ). Negative control rabbit IgG was used to label adjacent tissue sections for each decalcification agent (Supplementary Fig. 3A, C, E, G [anterior]; B, D, F, H [posterior]). Scale bars: A–F, H = 200 μm; C, G = 100 μm. Abbreviations: Osx, osterix; EDTA, ethylenediaminetetraacetic acid; D, dentin; AM, ameloblast layer; C, cementum; PDL, periodontal ligament; P, pulp; OD, odontoblast layer; B, bone; CL, cementum line; BM, bone marrow; AB, alveolar bone; one-head arrows, odontoblasts (D,H) and cementoblasts (E,F); ►►, osteoblasts.
The anterior portions of the mandibles decalcified in 10% EDTA at 37C showed Osx immunoreactivity within the pulp dentinal zone; however, no staining was observed in the odontoblast cells of the pulp (Fig. 9C).
The posterior portion of the mandible decalcified in 10% EDTA at 37C exhibited positive Osx staining in the odontoblast cells lining the pulp wall, in the cementum line, and in the osteoblast and fibroblast cells of the periodontal ligament, as well as slight staining in the osteoblast cells lining bone in the bone tissue in the cervical loop of the posterior portions of the mandibles (only on the mesenchymal cells) (Fig. 9D). Also, positive staining could be seen in megakaryocytes (data not shown) in the alveolar bone area. No immunolocalization reaction was visible in the rabbit IgG isotype control (Supplementary Fig. 3C and D) or samples stained with Runx2 regardless of the portion of the mandible (Supplementary Fig. 4C and D).
The osteoblast and cementoblast cells of the periodontal ligament covering the incisor tooth of the anterior portions of the mandibles decalcified in 5% nitric acid showed a stronger staining reactivity in the labial side of the cervical loop of the mandible, gradually diminishing intensity toward the incisors tip (data not shown). However, the cementum line covering the dentin surface exhibited positive staining all along the incisor tooth (Fig. 9E).
The posterior portion of the mandibles decalcified with 5% nitric acid showed a positive Osx staining in the odontoblasts cells lining the pulp wall and in the cementoblast and osteoblast cells of the periodontal ligament of the incisor. Positive signals could also be seen in the osteoblast cells lining the alveolar bone and bone marrow (Fig. 9F). No reactivity was observed in the rabbit IgG isotype negative control (Supplementary Fig. 3E and F) and in the samples stained with Runx2 regardless the portions of the mandible (Supplementary Fig. 4E and F).
Immunolocalization of Osx staining in the anterior portion of mandible decalcified in 10% formic acid exhibited positive signal in the ameloblast cell layer of the dentinoenamel junction (Fig. 9G, labial side). In addition to that, the odontoblast cells of the interface of the periodontal ligament with alveolar bone tissue also showed positive staining for Osx antibody (Fig. 9G, lingual side). However, no staining was seen in the cementum line (Fig. 9G, Lingual side). The posterior portions of the mandibles decalcified in 10% formic acid showed a slight positive staining in the odontoblast layer of the pulp dentinal zone and in the osteoblast cells in the interface of the periodontal ligament with surrounding alveolar bone of the incisor dentinoenamel junction (Fig. 9H). Once again, no staining was seen in the negative controls (Supplementary Fig. 3G and H) and for the samples stained with Runx2 in the anterior and posterior portions of the mandibles decalcified with 10% formic acid (Supplementary Fig. 4G and H).
Discussion
Preparing calcified tissues for histology analyses by decalcification is a time-consuming procedure, and the quality of the tissue and thus the data obtained is dependent on the speed with which decalcification occurs, as well as the chemistry of the decalcification agent. The current gold standard method is to use 10% EDTA at RT, which provides the best results with respect to cellular and structural morphological details—this in spite of the fact that this method took the longest time to decalcify, at 220 hr for the anterior and 191 hr for the posterior portions of the mandible. Increasing the temperature to 37C effectively halved the time taken to decalcify the same tissues in 10% EDTA at 102 hr for the anterior and 73 hr for the posterior portions of the mandibles. However, this rendered some negative effects on tissue morphology, especially on soft tissue and the collagen matrix. Five percent nitric acid was the fastest decalcifying agent, requiring only 13 hr 30 min for the anterior and 4 hr 20 min for the posterior portions of the mandibles, and still exhibiting good results for architectural integrity and with respect to distinguishability of cellular and tissue morphology. Decalcification with 10% formic acid was reasonably fast, taking 140 hr to completely decalcify the tissues but had adverse effects on structural and cell morphologies.
The integrity of cellular morphology and tissue structure of tissue sections depends on the correct performance of each single step employed during sample preparation and processing. It is essential that the specimen is well preserved by fixation and is processed and embedded in a solid medium that provides sections free from artifacts generated during microtome sectioning. Rough sectioning occurred when samples were trimmed deeper toward the core of the paraffin block, which may be related to poor wax infiltration. If not carried out adequately, poor infiltration caused by insufficient tissue processing cycles can impair impregnation of the specimen with paraffin, thus introducing histological artifacts and loss of architectural structure.9,12 Moreover, structural framework, size, thickness, hardness, and density of tissue can greatly affect rates of decalcification and subsequent procedures.9,13
To discuss the IHC results, several key tooth development transcription factors must be explained. Tooth development is an intricate process that is regulated by specific transcription factors. Osx and Runx2 are transcription factors that promote mesenchymal and epithelial cell differentiation. 14 It is believed that Osx and Runx2 participate in the regulation mechanism of osteogenesis and odontogenesis.14,15
Root development starts with the formation of an epithelial root sheath—the Hertwig’s epithelial root sheath (HERS). HERS induces the mesenchymal cells of the pulp to differentiate into odontoblast cells followed by pre-dentin deposition.14,16 Also, mesenchymal cells from the periodontal ligament differentiate into odontoblasts, fibroblasts, and specialized cells such as cementoblasts which in turn mediate cementum deposition.17,18
Osteoblast differentiation pattern has been reported to be similar to cementoblast differentiation pattern in the process of cementogenesis.14,19 During early stages of crown formation, Osx and Runx2 are highly expressed in the mesenchymal cells of the dental papilla. Later at postnatal stages, when the root is already developed but still elongating, Runx2 expression declines while Osx expression continues to be present in the alveolar bone and in the dental pulp. 20 These findings would account for the results in the present study, in which Osx expression was identified in the osteoblast cells of the alveolar bone and in the odontoblast cells of the pulp dentinal zone of the molar teeth of the posterior samples of the mandibles treated with all decalcification methods. Interestingly, within the same samples, no Runx2 expression was visible regardless of decalcification treatment. However, as the rat mandibles were in the late postnatal stage of development, it is possible that the Osx expression is in response to the initiation of repair and maintenance of the periodontal ligament, cementum, and surrounding tissue as a result of masticatory stimulation.
As expected, we observed excellent preservation of cellular tissue morphology and antigenicity with 10% EDTA at RT. The only drawback with this method is the length of time taken to achieve full demineralization. This is likely related to the formation of a physical buffer system in which calcium ions are removed from the outer layer to the inner layer by depletion of the size of the hydroxyapatite crystal. Overall, decalcification with 10% EDTA at RT best preserves cellular and structural tissue integrity2,21–23 and also retains the antigenicity of important marker proteins in bone histology.24–28 It is common knowledge that increased temperature29–31 speeds up the rate by which calcium is leached out of a mineralized tissue, which accounts for the increased decalcification attained when using 10% EDTA at 37C. However, we did see some adverse effects on the integrity of cellular layers and pulp zone, and there was also an increase in staining intensity with vWF and Col-1 after subjecting the samples to 10% EDTA at 37C.
Sanjeet and Keya 21 reported that the time taken for decalcification of calcified tissues depends on the extent to which the tissue is mineralized. Tooth enamel exhibits higher mineral concentration toward the end of incisors, 32 which may explain the displacement and disruption of tissue occurring with the 10% EDTA at RT and 5% nitric acid samples while sectioning. Moreover, in all four conditions, the H&E results of the anterior portions of the mandibles showed that the mature layer of the incisor enamel was completely decalcified. However, there was some remaining enamel at the proximal end on the labial side of the posterior portions of the mandibles. These findings may be related to the incisor’s continuous growth with permanent formation of enamel by ameloblast cells being present only at the proximal end of the labial side of the mandible. During the early phase of its formation, immature enamel is insoluble in acids which would account for our results where the enamel layer of the posterior portion of all mandibles remained after decalcification. This characteristic is lost after the enamel finishes maturating,33–37 corroborating our finding in the anterior portions in every mandible, where an artifactual empty space was left after decalcification with all treatments.
Chelating solutions act by binding calcium ions, whereas acids act by forming soluble calcium salts. The speed by which calcium salts/ions are removed from tissue depends on factors such as temperature, agitation, strength, and concentration of the decalcifying reagent. 2 While heat is known to accelerate the rate of decalcification for chelating agents by increasing the diffusion and chemical reaction within the tissue, acids act through a rapid acid diffusion reaction.30,23 The speed of the decalcification with acids is reported to be directly associated with the integrity of cellular and structural morphology and preservation of antigen reactivity.1,23,38,39 Tissue protein hydrolysis can result in maceration of non-mineralized tissue, as seen in the present study when rat mandibles were decalcified using 10% EDTA at 37C or 10% formic acid. Decalcification in acids must, therefore, be closely monitored as overexposure of tissue to acids can greatly affect the staining quality of cellular structures, especially nuclei and soft tissues.
If tissue surfaces are modified by the decalcifying acids, antigen specificity and sensitivity may be compromised.40,35 Contrary to other studies, which found that 5% nitric acid was a good decalcifying solution for the detection of other common markers for bone,41,42 we found that the use of 5% nitric acid for rapid decalcification resulted in inferior reactivity for vWF and little or no immunostaining. However, Col-1 and Osx retained a stain as good as that of the 10% EDTA at RT treatment.
The results of our experiment when using 10% EDTA at 37C (posterior portion), 10% formic acid (posterior portion), and 5% nitric acid (anterior and posterior portions) showed widening of dentinal tubules. Destruction and vacuolation of the pulp were seen in the same specimens as well as in the posterior portion with 10% EDTA at RT. Specimens treated with 10% formic acid showed fraying dentinal borders and loss of cohesion of the enamel tissue. Prasad and Donoghue 38 described similar findings when comparing various decalcification techniques. Dentin is a permeable tissue containing tubules leading from the dentinoenamel junction to the pulp. Higher temperatures and acid decalcifying soften the dentin collagen matrix, therefore widening the dentinal tubules and exposing the pulp tissue to the action of the decalcification solution.38,43 However, as the posterior portions of the mandibles were directly exposed to the reagent, a stronger interaction between the tissue and the surrounding reagent may be the reason for vacuolation observed in the pulp while using 10% EDTA at RT and the granular and fraying appearance of enamel tissue when using 10% formic acid, despite the posterior portions being larger in size.
While testing the effect of three chelating decalcification agents including EDTA, both Kiviranta et al. 44 and Bhatnagar et al. 45 reported that the calcium ion extraction rate is greatest early during the process. Accordingly, Verdenius and Alma 30 reported that the rate of decalcification is proportional to the amount of calcium within the tissue. The mechanism of the demineralization of calcium may involve a dissolution and diffusion process conditioned by pH. In neutral pH, EDTA binds to calcium dissociated from the bone matrix, thus diffusing to the bulk solution.5,46 As the amount of calcium within the tissue decreases and the calcium concentration of the bulk solution increases, the decalcification solution becomes saturated, resulting in a decline in the decalcification process due to the equilibrium of the diffusion gradient. These findings were in agreement with our µCT data results in which decalcification appeared to be higher on the first day when using chelating agents.
In addition, the trend observed in the demineralization of the anterior portion of the mandibles—the incisors appear to be more resistant to the action of the decalcification solutions—may be attributed to the incisor enamel composition, which is the most mineralized tissue found in the teeth in its mature stage.1,47 By contrast, the demineralization trend observed for the posterior portion of the mandibles—most of the enamel and surrounding bone was generally demineralized when exposed to the decalcifying agents—may be attributed to the diffusion coefficient of the decalcifying solution, which may be increased when the enamel content is directly exposed to the decalcifying fluid, thus leading to better penetration.
Microtomy difficulties arose when sectioning deep within the tissue of the anterior and posterior portions of the mandibles. It is thought that these may be related to remaining calcium not detected by µCT within the parameters used in this study. When analyzing small samples, such as rat mandibles, resolution must be considered as the ratio of the sample size to the voxel size.48,49 The use of a voxel size of 30 µm with high-energy settings such as 70 kV would lead to partial volume effects as lower micron density distinction in the center of the sample occurs due to low interaction of photon energy with the sample; hence, changes in order of micron would be limited by the 30-µm voxel size resolution. In addition, given that µCT pixel value (density of hydroxyapatite) is known to be a function of segmentation technique, all voxels below this threshold will not be measured as mineralized tissues, impairing accurate measurement while scanning small specimens such as rat mandibles. This might lead to the presence of tiny hydroxyapatite particles not detectable by µCT, leading to issues with sectioning. To overcome these sectioning issues, we recommend a slightly longer time of decalcification to enable all tissues to be purged of even the most minute mineral residues.50,48 Larger voxel size can also be a constraint, as lower resolution scans can jeopardize the quality of the object being imaged. Thus, determining the optimal µCT parameters, such as µCT voxel size, as well as the X-ray energy settings relative to the size of the specimen, is an essential step to be considered to ensure accuracy of measurements. Alternatively, simply increasing the decalcification time by 5% should be sufficient to decalcify the samples completely.
The choice of a decalcifying solution depends on the purpose of the study; therefore, a number of factors must be considered when deciding which method to use. If tissue structure and morphology is critical, we recommend using 10% EDTA at RT, whereas if time is a constraint, 5% nitric acid is the fastest option while still preserving structural integrity; however, the staining of blood vessels could be compromised. The choice of a decalcifying agent can alter the detection of particular antigens; therefore, if rapid decalcification is required, it is essential to optimize IHC protocol for each antigen.
Footnotes
Acknowledgements
The authors thank Mr Kristofor Bogoevski and Dr Vaida Glatt for providing the rat specimens used in this study and Dr Thor Friis for editing and proofing of the final document. They also thank the Histology Facility Central Analytical Research Facility (CARF), Institute of Health and Biomedical Innovation (IHBI) at Queensland University of Technology (QUT).
Competing Interests
The author(s) declared no potential conflicts of interest with respect to the research, authorship, and/or publication of this article.
Author Contributions
FMS analyzed data and wrote the main paper, GIB provided substantial contributions to the experiment, CT revised the article and performed immunohistochemistry, JB performed immunohistochemistry, MAW devised the experiment and revised and approved the final version of the article. All authors discussed the results and commented on the manuscript at all stages.
Funding
The author(s) disclosed receipt of the following financial support for the research, authorship, and/or publication of this article: This work was supported by funding from the Australian Research Council (ARC) Linkage grant LP130100461.
References
Supplementary Material
Please find the following supplemental material available below.
For Open Access articles published under a Creative Commons License, all supplemental material carries the same license as the article it is associated with.
For non-Open Access articles published, all supplemental material carries a non-exclusive license, and permission requests for re-use of supplemental material or any part of supplemental material shall be sent directly to the copyright owner as specified in the copyright notice associated with the article.