
Abstract
Decalcification is routinely performed for histological studies of bone-containing tissue. Although DNA in situ hybridization (ISH) and comparative genomic hybridization (CGH) have been successfully employed on archival material, little has been reported on the use of these techniques on archival decalcified bony material. In this study we compared the effects of two commonly used decalcifiers, i.e., one proprietary, acid-based agent (RDO) and one chelating agent (EDTA), in relation to subsequent DNA ISH and CGH to bony tissues (two normal vertebrae, six prostate tumor bone metastases with one sample decalcified by both EDTA and RDO). We found that RDO-decalcified tissue was not suited for DNA ISH in tissue sections with centromere-specific probes, whereas we were able to adequately determine the chromosomal status of EDTA-decalcified material of both control and tumor material. Gel electrophoresis revealed that no DNA could be successfully retrieved from RDO-treated material. Moreover, in contrast to RDO-decalcified tumor material, we detected several chromosomal imbalances in the EDTA-decalcified tumor tissue by CGH analysis. Furthermore, it was possible to determine the DNA ploidy status of EDTA-but not of RDO-decalcified material by DNA flow cytometry. Decalcification of bony samples by EDTA is highly recommended for application in DNA ISH and CGH techniques.
Keywords
B
Interphase ISH applied to archival tissue sections with centromeric or region-specific probes (e.g., onco-gene-specific) has been established as a useful technique for recognition of chromosomal alterations in a histological background (reviewed by Alers and van Dekken 1996; Jenkins et al. 1997; van Dekken et al. 1997). More recently, comparative genomic hybridization (CGH) has been introduced as a new technique for global analysis of the entire genome for loss or gain of chromosomal regions. One of the main advantages of CGH is that it can be performed on archival material (Isola et al. 1994). At present, genetic data on tumors in bone, e.g., osteosarcomas, as assessed by molecular genetic and ISH techniques, have been obtained by using fresh material or soft tissue but not decalcified archival material (e.g., McManus et al. 1995; Tarkkanen et al. 1995,1996).
Our laboratory is interested in the identification of genetic events that underlie metastasis of prostate cancer to bone. Recurrent failure of the interphase ISH applied to bone metastases prompted the question of whether the routine decalcification of bone-containing samples could interfere with ISH techniques. Therefore, we compared the effect of two different decalcification agents, i.e., RDO vs EDTA, on the quality of ISH and CGH applied to formalin-fixed, paraffin-embedded specimens of bony tissues.
Materials and Methods
Tissue Specimens
Our panel consisted of five archival, routinely RDO-decalcified bone metastases of prostate adenocarcinoma (three biopsy specimens and two derived from autopsy). To compare different decalcification methods, we selected osseous material, derived from autopsy, of the vertebral column of three more patients, one bone metastasis of prostate adenocarcinoma to the lumbar spine and two normal control cases (one male, one female). Autopsy was performed between 8 and 24 hr after death. These tissue specimens were routinely fixed in buffered formalin and subsequently divided into halves. One half of each vertebra was decalcified according to a routine protocol; the other half was decalcified according to an experimental procedure.
Decalcification
Two different methods of decalcification were used. At our department, decalcification of bone-containing material is routinely performed using RDO, a multipurpose decalcifier (Apex Engineering Products; Plainfield, IL). The active ingredient in RDO is hydrochloric acid. RDO stock solution was diluted 1:1 in distilled water. Decalcification in RDO was routinely performed for a period of 6-16 hr at room temperature (RT).
The other vertebral halves were decalcified using the chelating agent EDTA. We used a 10% EDTA solution in distilled water, pH 7.4, for a period of 2-3 weeks at 4C, depending on degree of mineralization, with renewal of EDTA every week. After decalcification, samples were routinely processed and embedded in paraffin.
DNA In Situ Hybridization (ISH)
ISH with a biotin-labeled DNA probe set specific for chromosomes 1, 6, 7, 8, and Y was performed as described by van Dekken et al. (1992). Briefly, to facilitate DNA probe accessibility to the cellular DNA, sections were digested with 0.4% pepsin (Sigma; St Louis, MO) in 0.2 M HCl at 37C for 5-60 min. Cellular DNA was heat-denatured for 2 min in 70% formamide in 2 × SSC (pH 7.0) at 72C. The chromosome-specific repetitive DNA probes were denatured for 10 min at 72C in a hybridization mixture containing 2 μg/ml probe DNA, 500 μg/ml sonicated herring sperm DNA (Sigma), 0.1% Tween-20, 10% dextran sulfate, and 60% formamide in 2 × SSC at pH 7.0. The slides were then incubated overnight at 37C in a moist chamber and subsequently washed. Histochemical detection of the biotinylated DNA probes was performed by the standard avidin-biotin complex (ABC) procedure and immunoperoxidase staining. Sections were counterstained with hematoxylin.
Evaluation of ISH Results
The DNA probe set was analyzed for each sample on consecutive 4-μm sections in a previously defined area. A section size of 4 μm was chosen after evaluating the degree of nuclear overlap (= countability) and section thickness. For each of the probes, 100 “intact” (= spherical) and nonoverlapping 4-μm nuclear slices were counted by two independent investigators (100 nuclei each) and the number of solid diaminobenzidine (DAB) spots per nuclear fragment was scored (0, 1, 2, 3, 4, >4 spots per nuclear slice). The individual DNA probe spot distributions were then compared and totaled when no significant counting differences between the investigators were found. In our experiments, no discrepancies emerged using this approach. The probe spot distributions were statistically evaluated by the Kolmogorov-Smirnov test. Overrepresentation of a specific chromosome was seen as a shift to the right of the DNA probe distribution compared with nonaberrant probe distributions. This method is described in detail in previous studies (Alers and van Dekken 1996; Alers et al. 1997).
Comparative Genomic Hybridization (CGH)
Isolation of DNA from the formalin-fixed, decalcified, paraffin-embedded normal and tumor material was performed as described by Alers et al. (1997). Briefly, the same tissue blocks used for ISH analysis were counterstained in 4,6-diamidino-2-phenyl indole (DAPI; 0.1 μg/ml in distilled water) for 5 min and placed under a fluorescence microscope, enabling precise selection of the (tumor) area. Microdissection of the (tumor) areas was performed using a hollow bore coupled to the microscope. Lower boundaries were checked for the presence of tumor on hematoxylin-eosin-stained tissue sections. Excised material was minced using a fine scalpel, deparaffinized in xylene and ethanol series, and dried. Samples were digested in 1 ml of extraction buffer (10 mM Tris-HCl (pH 8.0), 100 mM NaCl, 25 mM EDTA, 0.5% SDS, and 300 μg/ml proteinase K) and incubated at 55C for 3-4 days (Isola et al. 1994). Fresh proteinase K (300 μg/ml) was added every 24 hr. Samples were treated with RNase (1:25 of 10 mg/ml) for 1 hr at 37C. DNA was isolated according to standard protocols using phenol:chloroform extraction at least four times, followed by chloroform twice. Concentration, purity, and molecular weight of the DNA were estimated using both a fluorometer (DyNA Quant 200; Hoefer Biotech, San Francisco, CA), UV spectrophotometry (Genequant; Pharmacia Biotech, Uppsala, Sweden), and ethidium bromide-stained agarose gels with control DNA series.
Tumor DNA was labeled with biotin by nick-translation (Nick Translation System; Gibco BRL, Gaithersburg, MD). Likewise, male reference DNA (Promega; Madison, WI) was labeled with digoxigenin (Boehringer Mannheim; Indianapolis, IN) by nick-translation. The reaction time and the amount of DNAse were adjusted to obtain a matching probe size for reference DNA and tumor DNA. Molecular weight of both tumor and reference DNA was checked by gel electrophoresis. Probe sizes were between 300 and 1.5 KB.
CGH was performed essentially according to the procedure described by Kallioniemi et al. (1992). In brief, normal male metaphase chromosomes were denatured, dehydrated, and air-dried; 200 ng of each labeled tumor DNA and reference DNA and 15 μg of unlabeled Cot-1 DNA were ethanol-precipitated and dissolved in 10 μl of hybridization mixture (50% formamide, 0.1% Tween-20, and 10% dextran sulfate in 2 × SSC, pH 7.0). The probe mixture was denatured and hybridized to normal metaphase chromosomes. After washing of the slides, fluorescent detection of the biotin- and digoxigenin-labeled DNA probes was accomplished with avidin-fluorescein isothiocyanate and anti-digoxigenin rhodamine, respectively, for 1 hr at 37C. Samples were counterstained with DAPI in antifade solution.
For image acquisition, an epifluorescent microscope (Leica DM; Rijswijk, The Netherlands) equipped with a cooled CCD camera (Photometrics; Tucson, AZ) and a triple bandpass beam splitter and emission filters (P-1 filter set; Chroma Technology, Brattleboro, VT) was used. Gray level images of each of the three fluorochromes were collected and a three-color image was built up by overlay of the three images in pseudo-colors selected to match the original color of the fluorochromes, using an algorithm implemented in SCIL image (TNO; Delft, The Netherlands) on a Power Macintosh 8100. Image analysis was performed with the use of QUIPS XL software (version 2.0.3; Vysis, Downers Grove, IL), using reversed DAPI banding to identify the chromosomes. Loss of DNA sequences was defined as chromosomal regions in which the mean green:red ratio is below 0.8, and gain was defined as chromosomal regions in which the ratio was above 1.2. These threshold values were based on series of normal controls.
DNA Flow Cytometry
DNA content of the paraffin material was measured as described by Hedley et al. (1983). Three to five 50-μm slices of the three vertebrae were selectively cut out of the paraffin blocks. Flow cytometry and analysis of the ethidium bromide (Sigma)-stained nuclei from these areas was performed using a Facscan (Becton Dickinson; Mountain View, CA). Tissue from a normal lymph node served as a diploid control. A DNA index between 0.8 and 1.2 was considered diploid.
Results
Histology and DNA Flow Cytometry (FCM)
Routinely processed hematoxylin and eosin (H&E) sections of the three archival bone specimens appeared to show a better histology and more detail in the EDTA-decalcified tissues than in the RDO-treated samples (Figures 1A, 1C, 1E, and 1F).
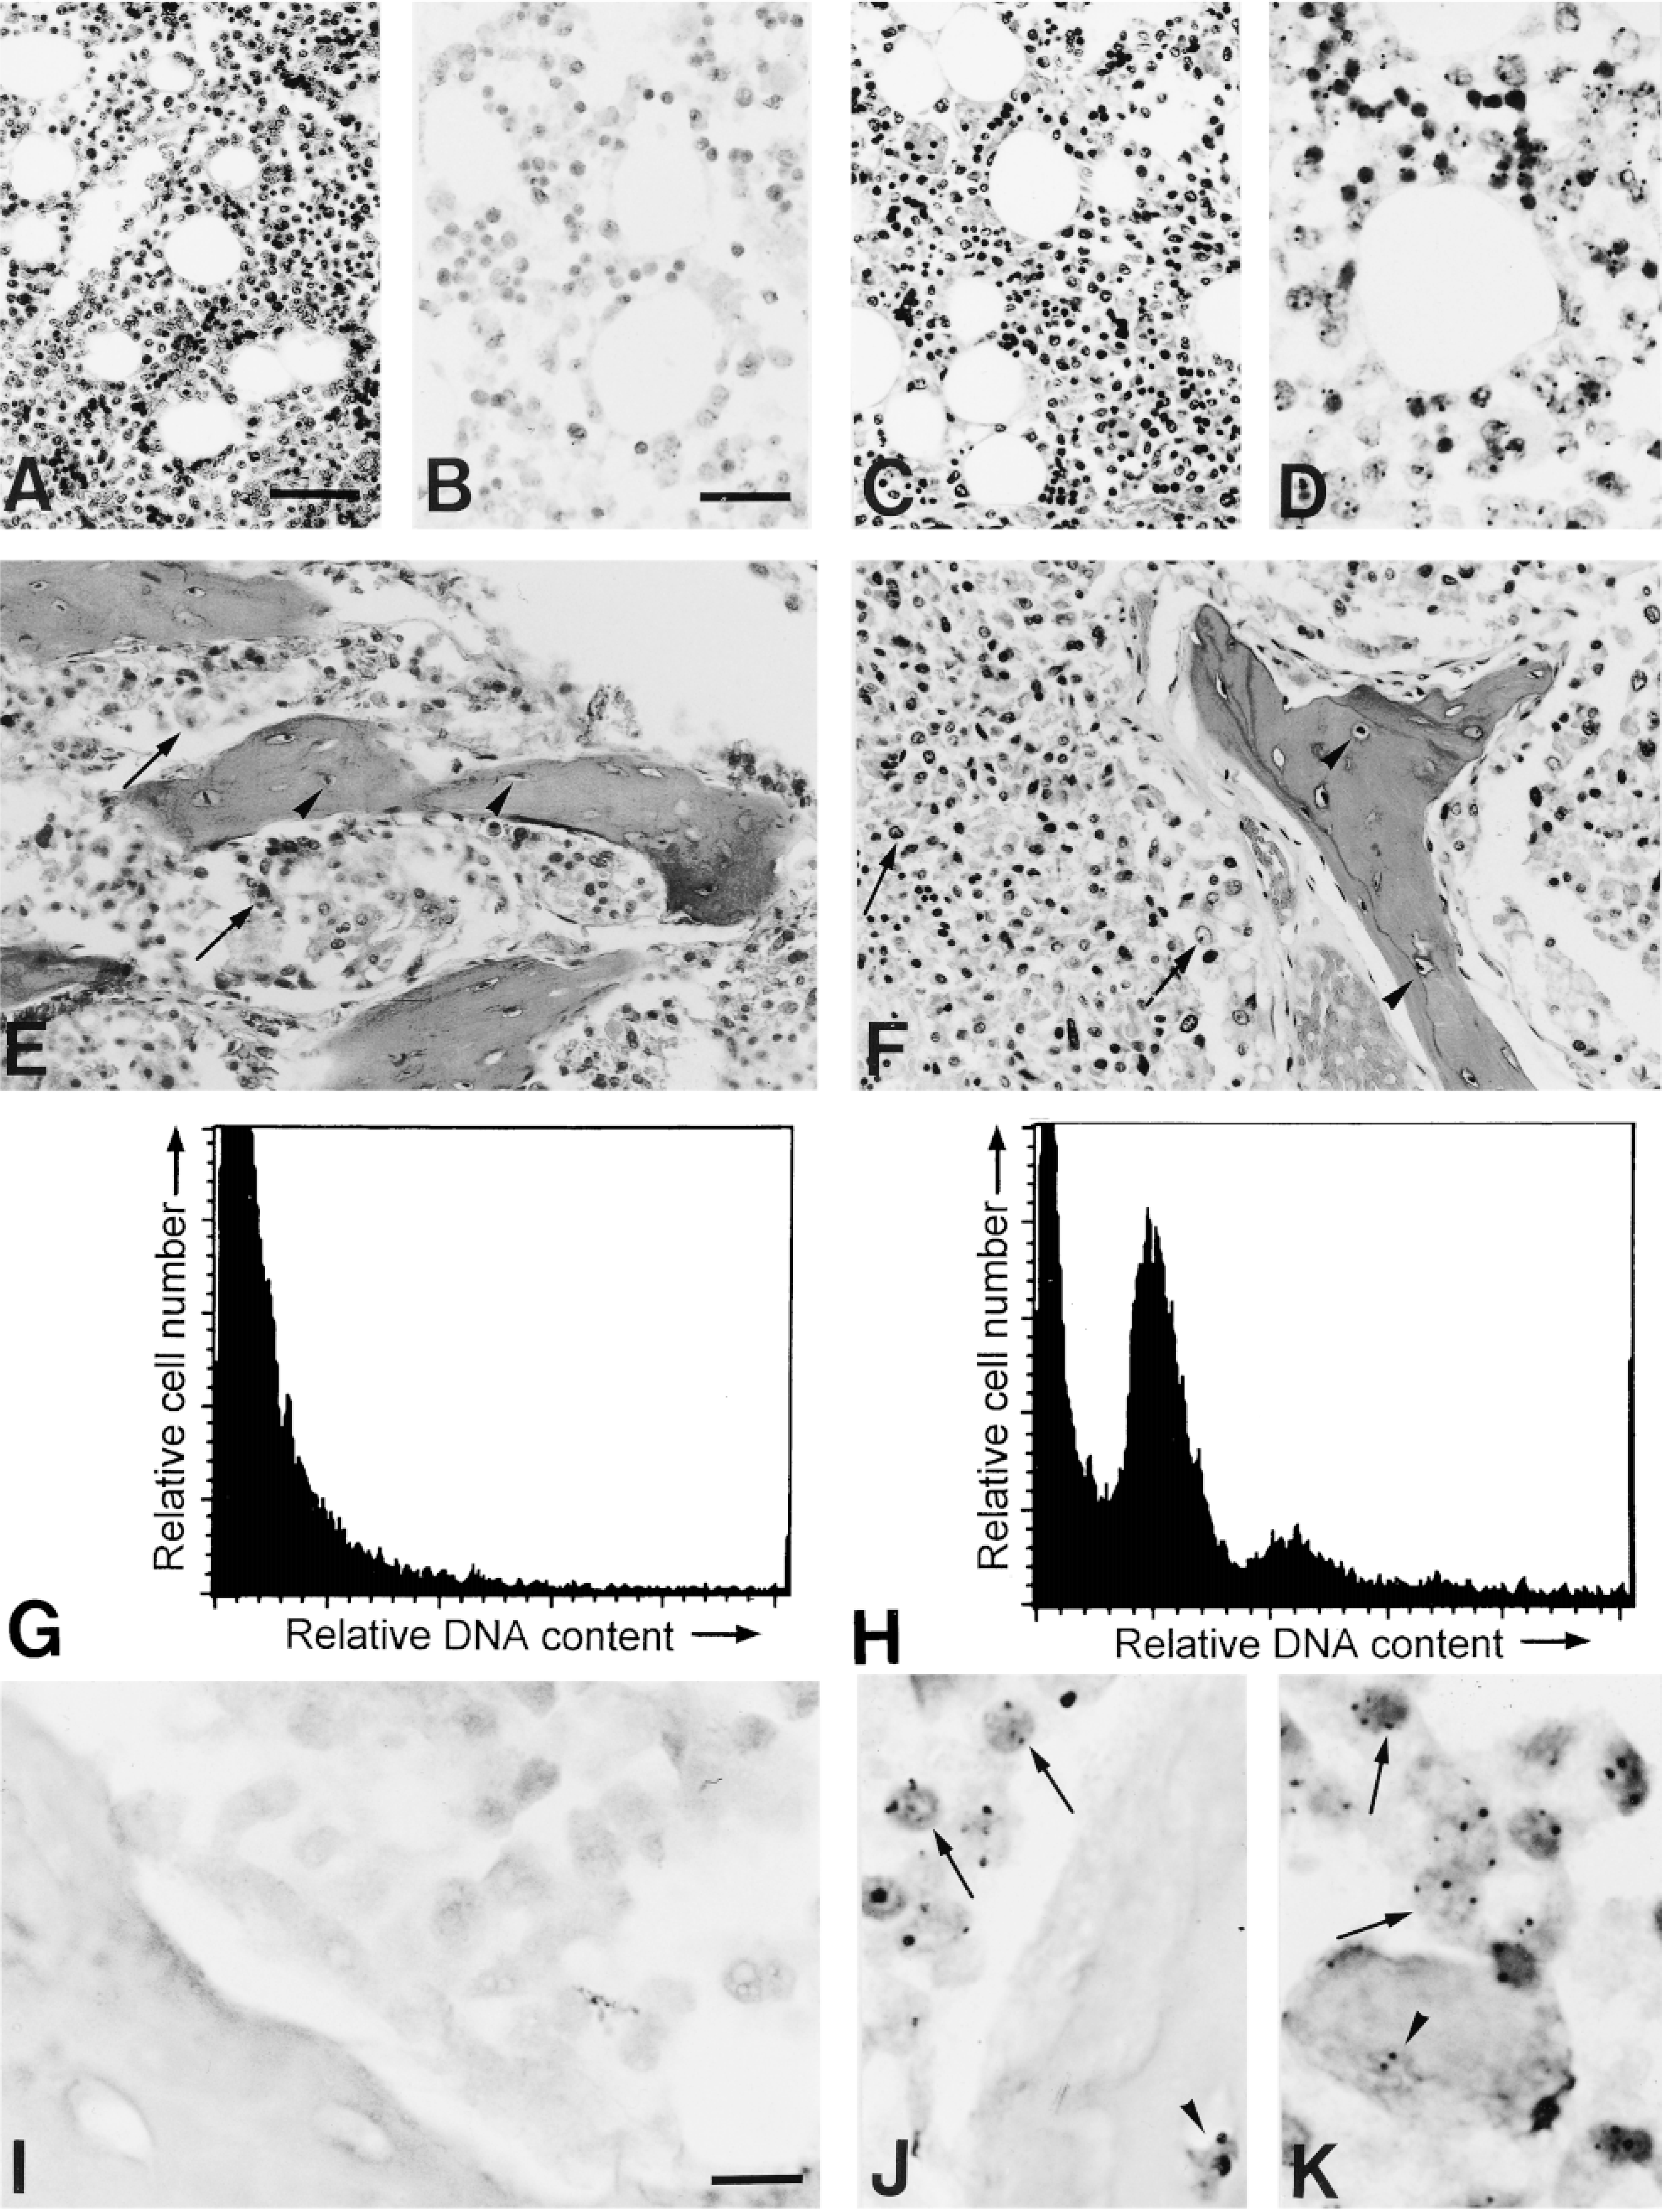
Comparison of the effect of decalcification of bony material by RDO (left) or EDTA (right) on DNA in situ hybridization (ISH) and DNA flow cytometry (FCM). The ISH-related signals were visualized with immunoperoxidase-DAB (black); Mayer's hematoxylin was used as a counterstain. (A,B) Hematoxylin and eosin (H&E)-stained tissue section of RDO-decalcified normal bone marrow (A). Corresponding ISH with the chromosome 1-specific probe. No ISH signals were seen in the nuclei (B). (C,D) H&E section of the EDTA-decalcified part of the same bone marrow (C). The general morphology of the cells is much better compared to A, even at low magnification. Corresponding ISH with a probe specific for chromosome 1 shows strong ISH signals in the nuclei. A normal diploid spot distribution for ISH to 4-μm tissue sections with an autosomal probe is seen, with most nuclei displaying two spots (D). (E,F) H&E section of a bone metastasis of prostate adenocarcinoma, decalcified with RDO (E). The morphology of both tumor cells (arrows) and osteocytes in the bone trabeculae (arrowheads) is much better appreciated when decalcified with EDTA (F). (G,H) DNA flow cytometry (FCM) of the prostatic tumor bone metastasis. DNA FCM of RDO-decalcified material showed only nuclear debris (G), whereas in the EDTA-decalcified specimen both a diploid and a tetraploid peak could be distinguished (H). (I-K) ISH with the chromosome 1-specific probe to RDO-decalcified material of the same metastasis. No ISH-related signals could be visualized in the nuclei (I), whereas in the EDTA-decalcified material ISH signals were easily identified in both tumor cells (arrows) and osteocytes (arrowhead, J). Moreover, ISH with the chromosome 8-specific probe to the same area detected gain of chromosome 8, visible as many nuclei with three or more spots (arrows). The osteocytes show a normal diploid pattern (arrowhead, K). Bars: A,C,E,F = 50 μ; B,D = 25 μm; I-K = 10 μm.
DNA FCM of RDO-decalcified samples of the two normal vertebrae revealed mainly nuclear debris; no DNA index (DI) could be determined. However, DNA FCM of the EDTA-treated specimens displayed a diploid profile in both samples (DI 0.8 in both cases). DNA FCM of the RDO-decalcified archival prostate tumor metastases to the bone rendered only nuclear debris (Figure 1G), whereas the EDTA-decalcified material showed a distinct diploid and a tetraploid peak (DI = 2.1; percentage non-2C peak = 15%; Figure 1H). The coefficient of variation (CV) values of the EDTA-treated samples were comparable to those of undecalcified, paraffin-embedded material derived from autopsy.
In Situ Hybridization (ISH)
The failure to detect any signals with interphase ISH in five routinely RDO-decalcified bony tumor metastases (data not shown), whereas non-osseous metastases in the same experiments showed excellent ISH, prompted us to investigate the effects of decalcification on interphase ISH. ISH with the chromosome 1-specific DNA probe to paraffin-embedded tissue sections of the RDO-decalcified parts of both the normal bone marrow samples, as well as the prostate tumor metastases, failed to detect ISH signals (Figures 1B and 1I). Even prolonged pepsin digestion incubation times, as well as higher pepsin concentrations, did not render any improvement. Moreover, after the ISH procedure the tissue showed a fuzzy appearance, with overflowing of the nuclei (Figures 1B and 1I). ISH with the probes specific for chromosomes 1, 6, 7, 8, and Y to the EDTA-decalcified normal bone specimens revealed strong hybridization signals for all probes (Figure 1D) with normal (diploid) distribution patterns.
ISH with the same probe set applied to the prostate tumor metastases distinguished overrepresentation of chromosome 8 compared to the other autosomal probes (Figures 1J and 1K). Furthermore, the sample was slightly hyperdiploid, with 11% of the nuclei showing more than two hybridization dots for the other nonaberrant probes.
Comparative Genomic Hybridization (CGH)
DNA was isolated from eight RDO- and three EDTA-decalcified archival (tumor) samples. No DNA could be retrieved from the RDO-decalcified samples, whereas DNA ranging in sizes up to 10 KB could be extracted from both normal and tumor EDTA-treated materials. The latter is exemplified by Figure 2A, showing DNA from an EDTA- and an RDO-decalcified tumor sample in Lanes 2 and 3, respectively. Gel electrophoresis of the other samples showed a similar pattern, with no detectable DNA isolated from the RDO-treated material and a DNA smear comparable to Lane 2 for the two normal EDTA-decalcified samples (bulk DNA fragment size around 400 BP). Subsequent CGH of the tumor sample showed loss and gain of several sequences (Figure 2B). Loss was seen on chromosome regions 5q12-q22, 6q16-q21, 8p12-p21, 10q21-q24 (interpretation). Gain was found of 7p15-pter, 7q32-q33 and 8q11.2-qter sequences. Furthermore, the combination of 8p loss and 8q gain, together with the over-representation of the centromeric region of chromosome 8, as detected by ISH (Figures 1J and 1K) is suggestive for isochromosome formation of 8q. In addition, loss of 10q, found by CGH, was confirmed by loss of heterozygosity (LOH) study, illustrating the suitability of the EDTA decalcification method for in vitro DNA studies (Figure 2C).
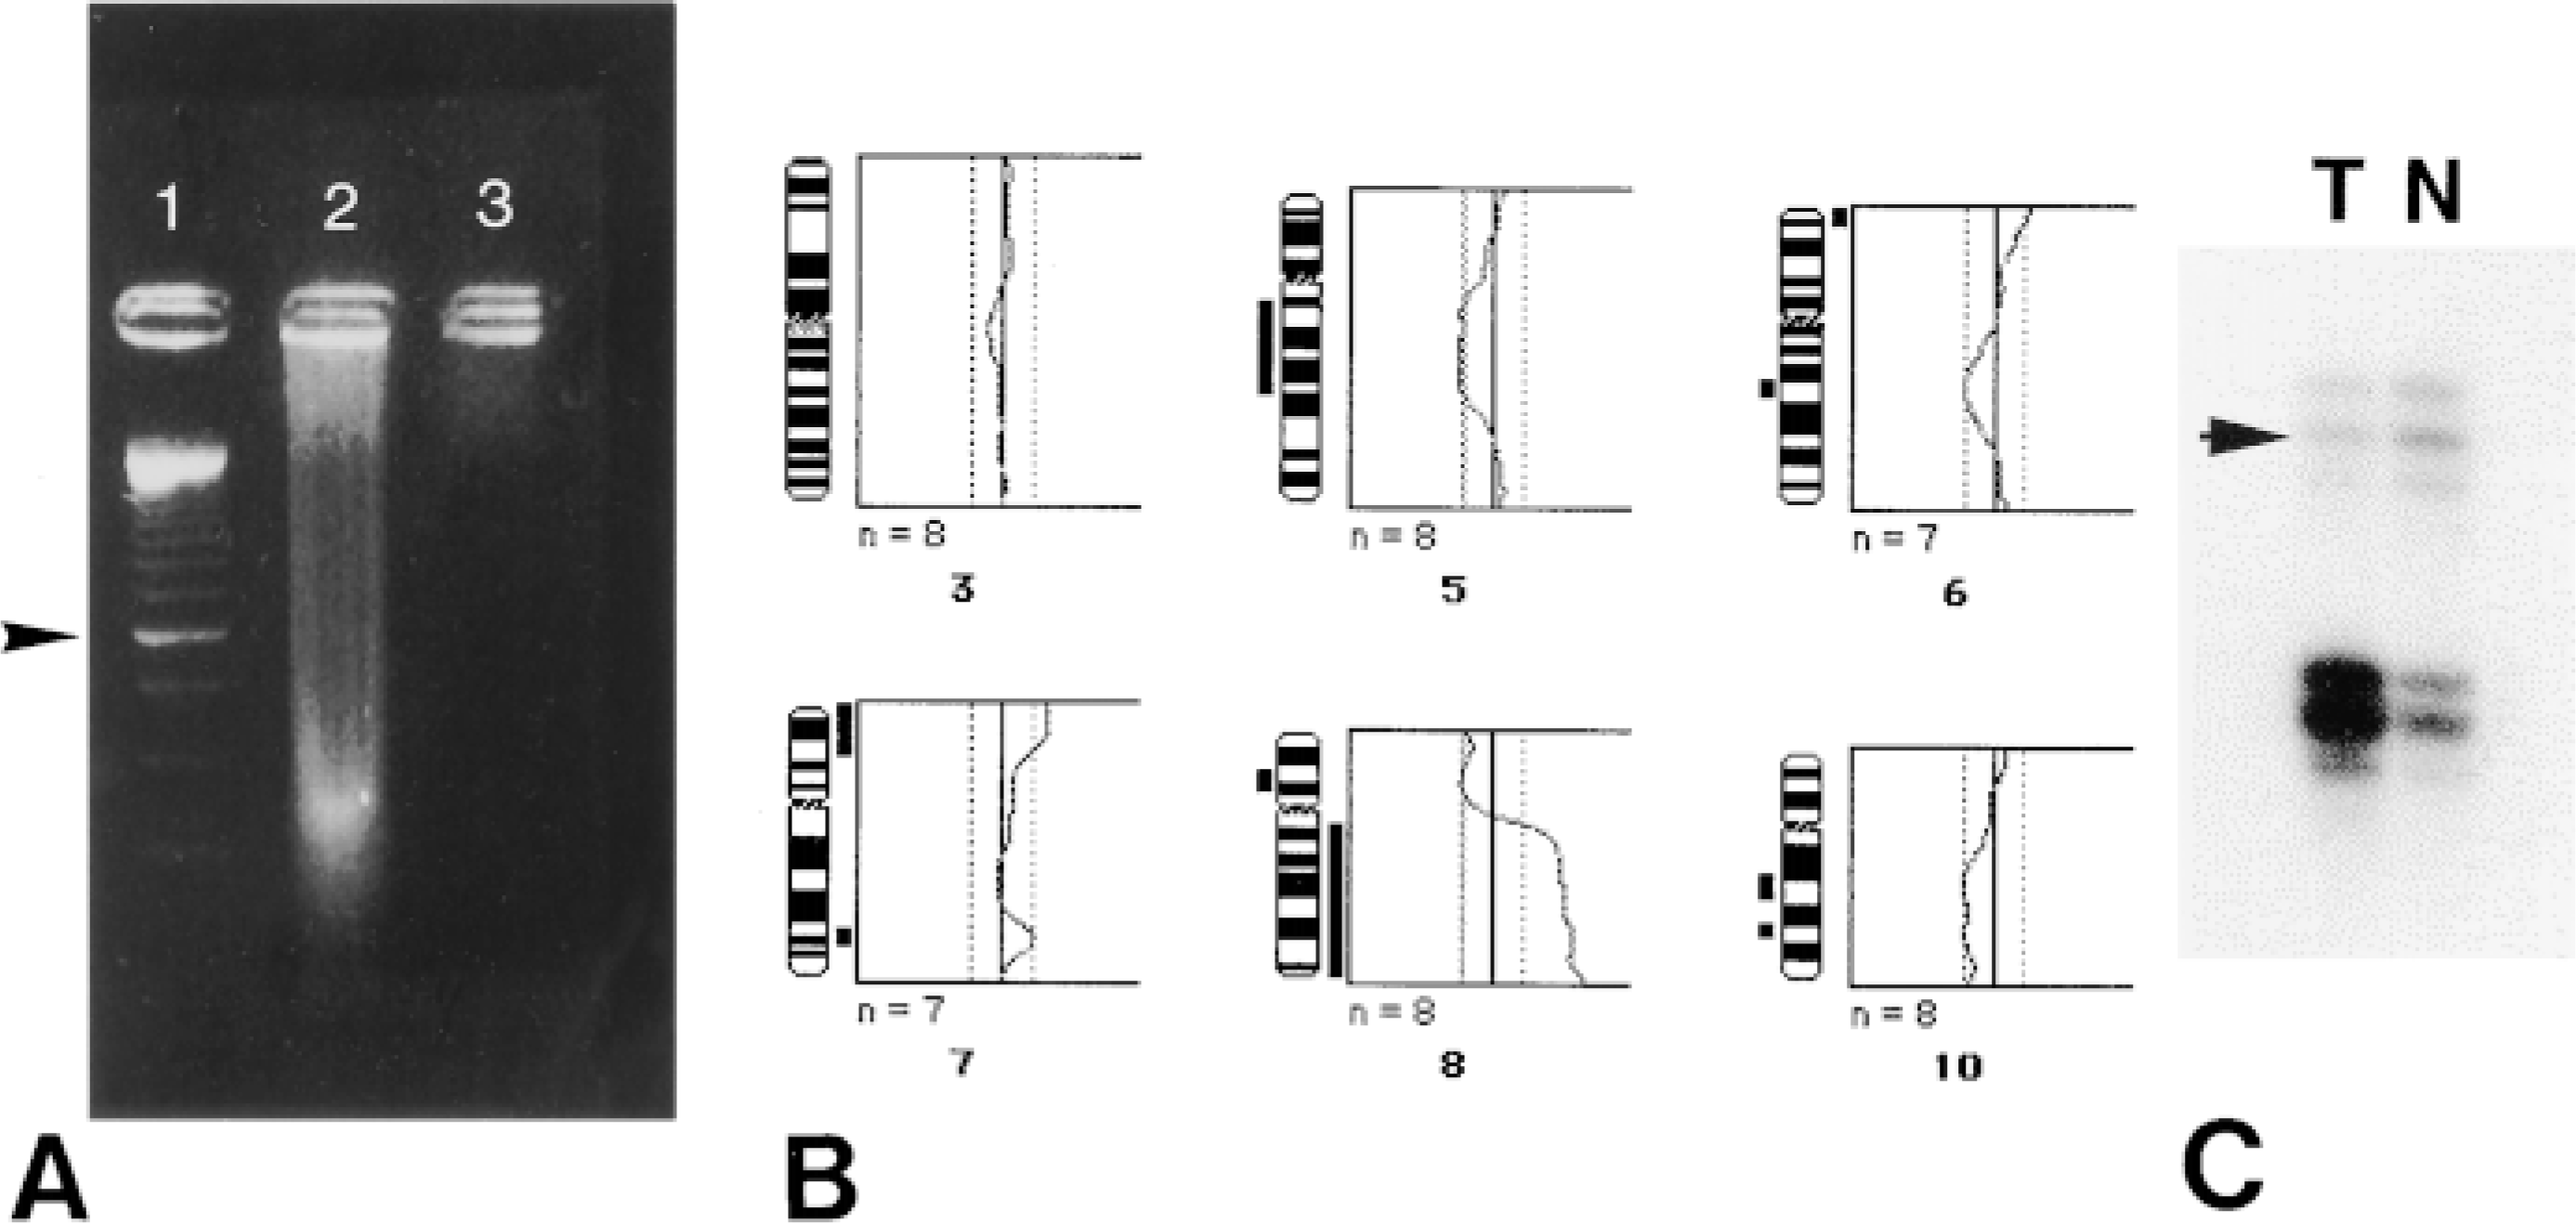
(A) Ethidium bromide-stained agarose gel. Lane 1, 250-BP DNA ladder. The 1-KB band is marked. Lane 2, DNA isolated from EDTA-decalcified material of an archival prostate tumor metastasis to the bone. The DNA smear is characteristic for routinely formalin-fixed, paraffin-embedded material. Lane 3, DNA isolation of RDO-decalcified material of the same case rendered no detectable DNA. (B) Comparative genomic hybridization (CGH) of the archival prostate tumor metastasis to the bone using the same DNA. The chromosomal ideograms are shown along with the mean ratio profiles of chromosomes 3, 5, 6, 7, 8, and 10 (number of chromosomes analyzed is seven or eight, lower/upper thresholds at ratios 0.8/1.2). Telomere ends are excluded from CGH analysis. Deleted regions are displayed as a black bar at left of the ideogram; gains are depicted along the right side. Loss was seen of 5q12-q22, 6q16-q21, 8p12-p21, 10q21-q24 (interpretation); gain was detected of 7p15-pter, 7q32-q33, and 8q11.2-qter sequences. An example of a chromosome without inbalances is shown by the normal ratio profile for chromosome 3. (C) PCR-mediated loss of heterozygosity (LOH) analysis of the EDTA-decalcified bone metastasis, using a microsatellite marker D10S2491 (PTEN CA repeat) located in the 10q23 region. Loss of the upper allele (arrowhead) is seen in the tumor (T) compared to the normal tissue (N).
Discussion
The aim of this study was to compare the effect of two different decalcification agents, i.e., RDO and EDTA, on the quality of interphase in situ hybridization (ISH) and comparative genomic hybridization (CGH), applied to formalin-fixed, paraffin-embedded tissue of bone-containing samples. The results unequivocally show that routinely processed RDO-decalcified tissue is not suitable for DNA-involving techniques, like DNA ISH and CGH. In addition, the utility of DNA FCM appeared notably reduced. This is in marked contrast to EDTA-decalcified tissues, in which we were able to determine the ploidy status of all bony samples and to demonstrate the presence of gain of chromosome 8 in a prostate osseous metastasis by interphase ISH. Moreover, CGH analysis of the same sample showed loss and gain of several sequences, most importantly concomitant loss of 8p and gain of 8q. The latter combination is suggestive of an i(8q) formation, a chromosomal abnormality that may be related to prostate tumor metastasis to the bone (Alers et al. 1997). In addition, loss found by CGH was confirmed by LOH analysis. This indicates that, after EDTA-decalcification, the samples are also suitable for PCR analysis. Our data are in concordance with other (limited) data on prostate tumor metastases using ISH and CGH techniques (Cher et al. 1996; Jenkins et al. 1997).
Prolonged treatment of tissue with strong acids, such as in RDO, apparently causes acid hydrolysis of DNA. Completely degraded DNA in nuclei of RDO-decalcified tissue would explain the absence of fluorescence in DNA FCM, as well as the inability to perform successful ISH with DNA-specific probes. This is supported by the fact that it was not possible to isolate DNA from RDO-decalcified bony tissue specimens. Hydrolysis of DNA is circumvented by decalcification in EDTA, because this procedure is performed at near neutral pH. Our findings are in agreement with limited data reported by others. For example, Arber and co-workers (1997) compared three commercially available decalcifying agents, including one EDTA-based solution (Versenate) and two hydrochloric acid-based solutions (S/P Decal, RBD). The agents were tested for mRNA ISH using a biotinylated poly d(T)oligonucleotide probe in paraffin-embedded tissue sections of (non)-neoplastic specimens. Versenate showed generally excellent reactivity compared to undecalcified controls, but less reactivity was seen with S/P Decal and especially with RBD. Similar findings were observed by Walsh et al. (1993) in a comparison of the effect of decalcification on mRNA ISH, using nitric acid, formic acid, and EDTA. Furthermore, Michaels et al. (1994) attributed the partially negative results with DNA ISH for cytomegalovirus in temporal bones of patients with AIDS to prolonged decalcification in formic acid. Moreover, fluorescent ISH with a chromosome 8-specific probe applied to bone marrow biopsy samples that were rapidly decalcified in another acid agent, Carbag solution, was unsuccessful in 40% of cases (Miranda et al. 1994). In contrast, several groups reported successful nonisotopic mRNA expression in paraffin sections of EDTA-decalcified rat bones (e.g., Hirakawa et al. 1994; Kabasawa et al. 1998).
At present, the application of EDTA as a decalcifying agent in a routine setting is hampered by the long time required for incubation. However, new methods, such as decalcification in EDTA using a microwave oven (Hellström and Nilsson 1992), addition of ammonium hydroxide to the EDTA solution (Sanderson et al. 1995), electrolytic decalcification (Loyson et al. 1997), or a one-step fixation-decalcification in Lowy formalin mercuric chloric acid solution, which also appears suitable for mRNA ISH (Gaulier et al. 1994), might reduce the time of decalcification considerably. Moreover, antigenic sites, DNA, and mRNA are preserved. Recent developments in plastic technology, especially the introduction of new resins that can be removed after sectioning, as well as new methods for antigen retrieval, indicate that DNA and mRNA ISH on plastic-embedded tissue will become more feasible in the near future (McCluggage et al. 1995; Church et al. 1997; Warren et al. 1998).
Footnotes
Acknowledgements
Supported by the Dutch Cancer Society, grant nos. EUR 92-35 and EUR 97-1404.
We are indebted to Hein Sleddens and Winand Dinjens (Department of Pathology, University Hospital Dijkzigt, Rotterdam) for performing the LOH analysis. We would also like to thank Pieter Derckx (Department of Pathology, University Hospital Dijkzigt, Rotterdam) and Carla Rosenberg and Hans Tanke (Laboratory for Cytochemistry and Cytometry, Department of Molecular Cell Biology, LUMC, Leiden) for support in this study.