
Abstract
The renal biopsy is a dynamic way of looking at renal disease, and tubular elements are an important part of this analysis. The mitochondria in 20 renal biopsies were examined by immunohistochemical (electron transport chain enzyme: cytochrome C oxidase IV [COX IV]) and enzyme histochemical methods (COX), both by light and electron microscopy. The distal convoluted tubules and thick ascending limbs showed the greatest intensity in the COX immunostains and enzyme activity in controls. The degree of mitochondrial COX protein and enzyme activity diminished as the tubules became atrophic. With proximal hypertrophic changes, there was great variation in both COX activity and protein expression. In contrast, in three cases of systemic lupus erythematosus, biopsied for high-grade proteinuria, the activity was consistently upregulated, whereas protein expression remained normal. These unexpected findings of heterogeneous upregulation in hypertrophy and the dyssynchrony of protein expression and activity may indicate mitochondrial dysregulation. Functional electron microscopy showed COX activity delineated by the intense mitochondrial staining in normal or hypertrophic proximal tubules. With atrophic changes, residual small mitochondria with diminished activity could be seen. With mitochondrial size abnormalities (enlargement and irregularity, adefovir toxicity), activity persisted. In the renal biopsy, mitochondrial analysis is feasible utilizing immunohistochemical and enzyme histochemical techniques.
Keywords
Introduction
Cytochrome C oxidase (COX) is a hetero-oligomeric enzyme consisting of 13 subunits localized to the inner mitochondrial membrane.1–3 It is the terminal enzyme complex in the respiratory chain, catalyzing the reduction of molecular oxygen to water coupled to the translocation of protons across the mitochondrial inner membrane to drive ATP synthesis. Deficiency in COX activity has been correlated with a number of human genetic diseases, 4 among them metabolic disorders (mutations of nuclear encoded mitochondrial enzymes) in methylmalonic and propionic acidemia.5,6 However, COX deficiency and accompanying mitochondrial dysfunction can also be seen in diseases such as transplant nephropathy (ischemia-reperfusion injury), 7 experimental ischemia-reperfusion injury, 8 and drug-induced nephrotoxicity (retroviral drugs used in HIV, hepatitis B infection, chemotherapeutics-induced nephrotoxicity),9–13 which are not genetic diseases rather secondary effects on the mitochondria.
The goal of the present study is to assess mitochondrial function in kidney diseases using COX assays. Initial assessment is done by COX enzyme histochemistry. One of the first studies published was from Janigan et al. 7 who described various enzyme histochemical assays, among them COX, to study enzyme function in canine renal transplants and showed loss of COX activity in proximal tubular cells which they contributed to developing tubular ischemia. More recently, COX and succinate dehydrogenase enzyme histochemistry has been used to define mitochondrial dysfunction in drug-induced—cyclosporine, adefovir, and doxorubicin—nephrotoxicity.9,14,15 COX enzyme histochemistry can be also imaged by transmission electron microscopy. This method was developed in the early 1960s by Seligman et al., 16 which was followed by others,17–19 as well as by our laboratory,5,20,21 and will serve to delineate enzyme activity at a single-cell level.
Materials and Methods
Clinical and Molecular Studies
The renal tissue specimens used in these studies were biopsy materials, and our studies were approved by the Institutional Review Board at the Beth Israel Deaconess Medical Center. The biopsies were processed as usual for diagnostic studies.
Histology
The kidney was processed as unfixed frozen preparation for enzyme histochemistry, formalin-fixed paraffin embedding for immunohistochemistry, or 2% glutaraldehyde fixed for electron microscopy. A separate preparation was used for functional electron microscopy, described below.
Definitions
Atrophic Tubules
About 70% of cortical tubules are proximal type. These are relatively large and have eosinophilic granular cytoplasm. The distal tubules are intermingled somewhat smaller and without a brush border in periodic acid-Schiff staining preparations. With overt degrees of atrophy, the number of larger tubules decreases (loss of proximal tubular mass) and the number of smaller tubules (atrophic) in conjunction with fibrosis predominates.
Regenerating Tubules
Regenerating tubules maintain their size and basement membrane, but the epithelium becomes attenuated, brush border is lost, and there is considerable variation in nuclear size.
Hypertrophic Tubules
Hypertrophic tubules are evident when the proximal tubules become enlarged with abundant cytoplasm. Admittedly, there is a continuum between normal and hypertrophic change that might be difficult to define. However, when the disease is advanced, the remaining proximal tubular mass is extensively hypertrophic and there is no problem in interpretation.
In Table 1, interstitial fibrosis and tubular atrophy was evaluated using a three-tiered scale, mild, approximately 5% of renal parenchyma involved, moderate 25% and severe greater than 50%. Glomerular sclerosis was evaluated by percent of glomeruli involved of the total number in biopsy. The percent of atrophy, hypertrophy, and normal was stated in a given biopsy.
Summary of Morphological Data and Results of COX Enzyme Histochemistry and Immunohistochemistry in Human Kidney Biopsies.
Abbreviations: IFTA, interstitial fibrosis and tubular atrophy; PT, proximal tubular; COX, cytochrome C oxidase; IHC, immunohistochemistry; AKI, acute kidney injury; SLE, systemic lupus erythematosus; CAN, chronic allograft nephropathy; DM, diabetes mellitus; HTN, hypertensive nephropathy; ANCA, antineutrophil cytoplasmic antibodies; CKD, chronic kidney disease; ESRD, end-stage renal disease.
These numbers (1–4) illustrate the variation of grades in a given biopsy.
Immunohistochemistry
Paraffin sections (2 µm) on poly-L-lysine-coated slides (Thermo Fisher Scientific, Atlanta, GA) were deparaffinized and rehydrated. Optimal staining was achieved with an antigen retrieval method that was performed in 10 mmol/l citric acid, pH 6.00 for 15 min. Endogenous peroxidase was quenched with 3% H2O2 in ddH2O for 15 min. Sections were blocked with 2.5% normal horse serum at room temperature for 40 min and incubated 40 min with 1:200 dilution of primary COX IV antibody (Cell Signaling Technology, Danvers, MA). Specific labeling was detected with an ImmPRESS HRP Anti-Rabbit IgG (Peroxidase) Polymer Detection Kit (Vector Laboratories, Burlingame, CA). The enzymatic reaction product was achieved by using diaminobenzidine substrate to give a brown precipitate, and the sections were counterstained with hematoxylin, dehydrated, and mounted in Permount (Thermo Fisher Scientific, Atlanta, GA). Sections with no primary antibody were used as negative control slides.
Enzyme Chemistry—Light Microscopy
The biopsied kidney tissue was fresh frozen. Tissues were cryosectioned (6 µm thick) and stained for COX enzyme activities, as described previously.13,15 Semiquantitative scoring system was used to evaluate staining intensity of COX enzyme and immunohistochemistry. The COX activity and immunostaining in proximal tubules were categorized on the scale of 1 to 4. Normal controls were in 1 to 2 range. Distal tubules served as positive controls always being in the 4+ range.
Enzyme Chemistry—Electron Microscopy
Fresh-frozen kidney tissues were cryosectioned at 60 µm and were fixed in 2.5% glutaraldehyde in 0.1-M sodium cacodylate buffer (Tousimis Research Corp, Rockville, MD) for 20 min. Sections were washed in several changes of 0.05-M PBS (pH 7.4) for 1.5 hr. The sections were treated for enzyme chemistry as described previously16–19 and then processed for EPON embedding by standard protocols. Sections (0.5 µm) were examined with JEOL 1011 transmission electron microscope (JEOL USA, Inc., Peabody, MA), with a Hamamatsu Orca-HR digital camera (Hamamatsu Corporation, Bridgewater, NJ), and AMT (Advanced Microscopy Techniques Corporation, Woburn, MA) image capture system.
Morphometric Quantification by Electron Microscopy
Measurements were generated from transmission electron microscopy images with a magnification of ×10,000. Representative digital images of proximal tubular epithelium (cortical labyrinth) were acquired (positioned to minimize nucleus or brush border within the image). Morphometric measurements were performed in two stages, using ImageJ software (Center for Information Technology National Institutes of Health, Bethesda, MD). First, to determine mitochondrial volume, non-cytoplasmic area was manually excluded from analysis. The optical density threshold was manually set to include all mitochondria, and mean intensity was calculated. In the second stage, for measurements of COX activity per mitochondrial area, the identical JPEG images were used, but the threshold was manually set to include only COX enzyme histochemical product, and the mean optical density of the reaction product was calculated.
Results
Twenty renal biopsies were studied using immunohistochemical and enzyme histochemical staining for COX. Table 1 presents a summary of all the data, including patient information, morphological data, and results of COX enzyme histochemistry and immunohistochemistry. The criteria for selection were random, but an effort was made to find various degrees of kidney injury. In Table 1, the cases are categorized by degree of fibrotic change. They are further characterized by the degree of hypertrophy, atrophy and maintained normal parenchyma. With more limited degrees of chronic changes, differentiating between hypertrophy and normal became difficult. As the extent of chronicity became greater, proximal tubular hypertrophy was evident, as expected. In normal controls, tubular COX activity and immunostaining was very even without great variation (Fig. 1A and B). In most cases, there were correlation between COX activity and protein expression.
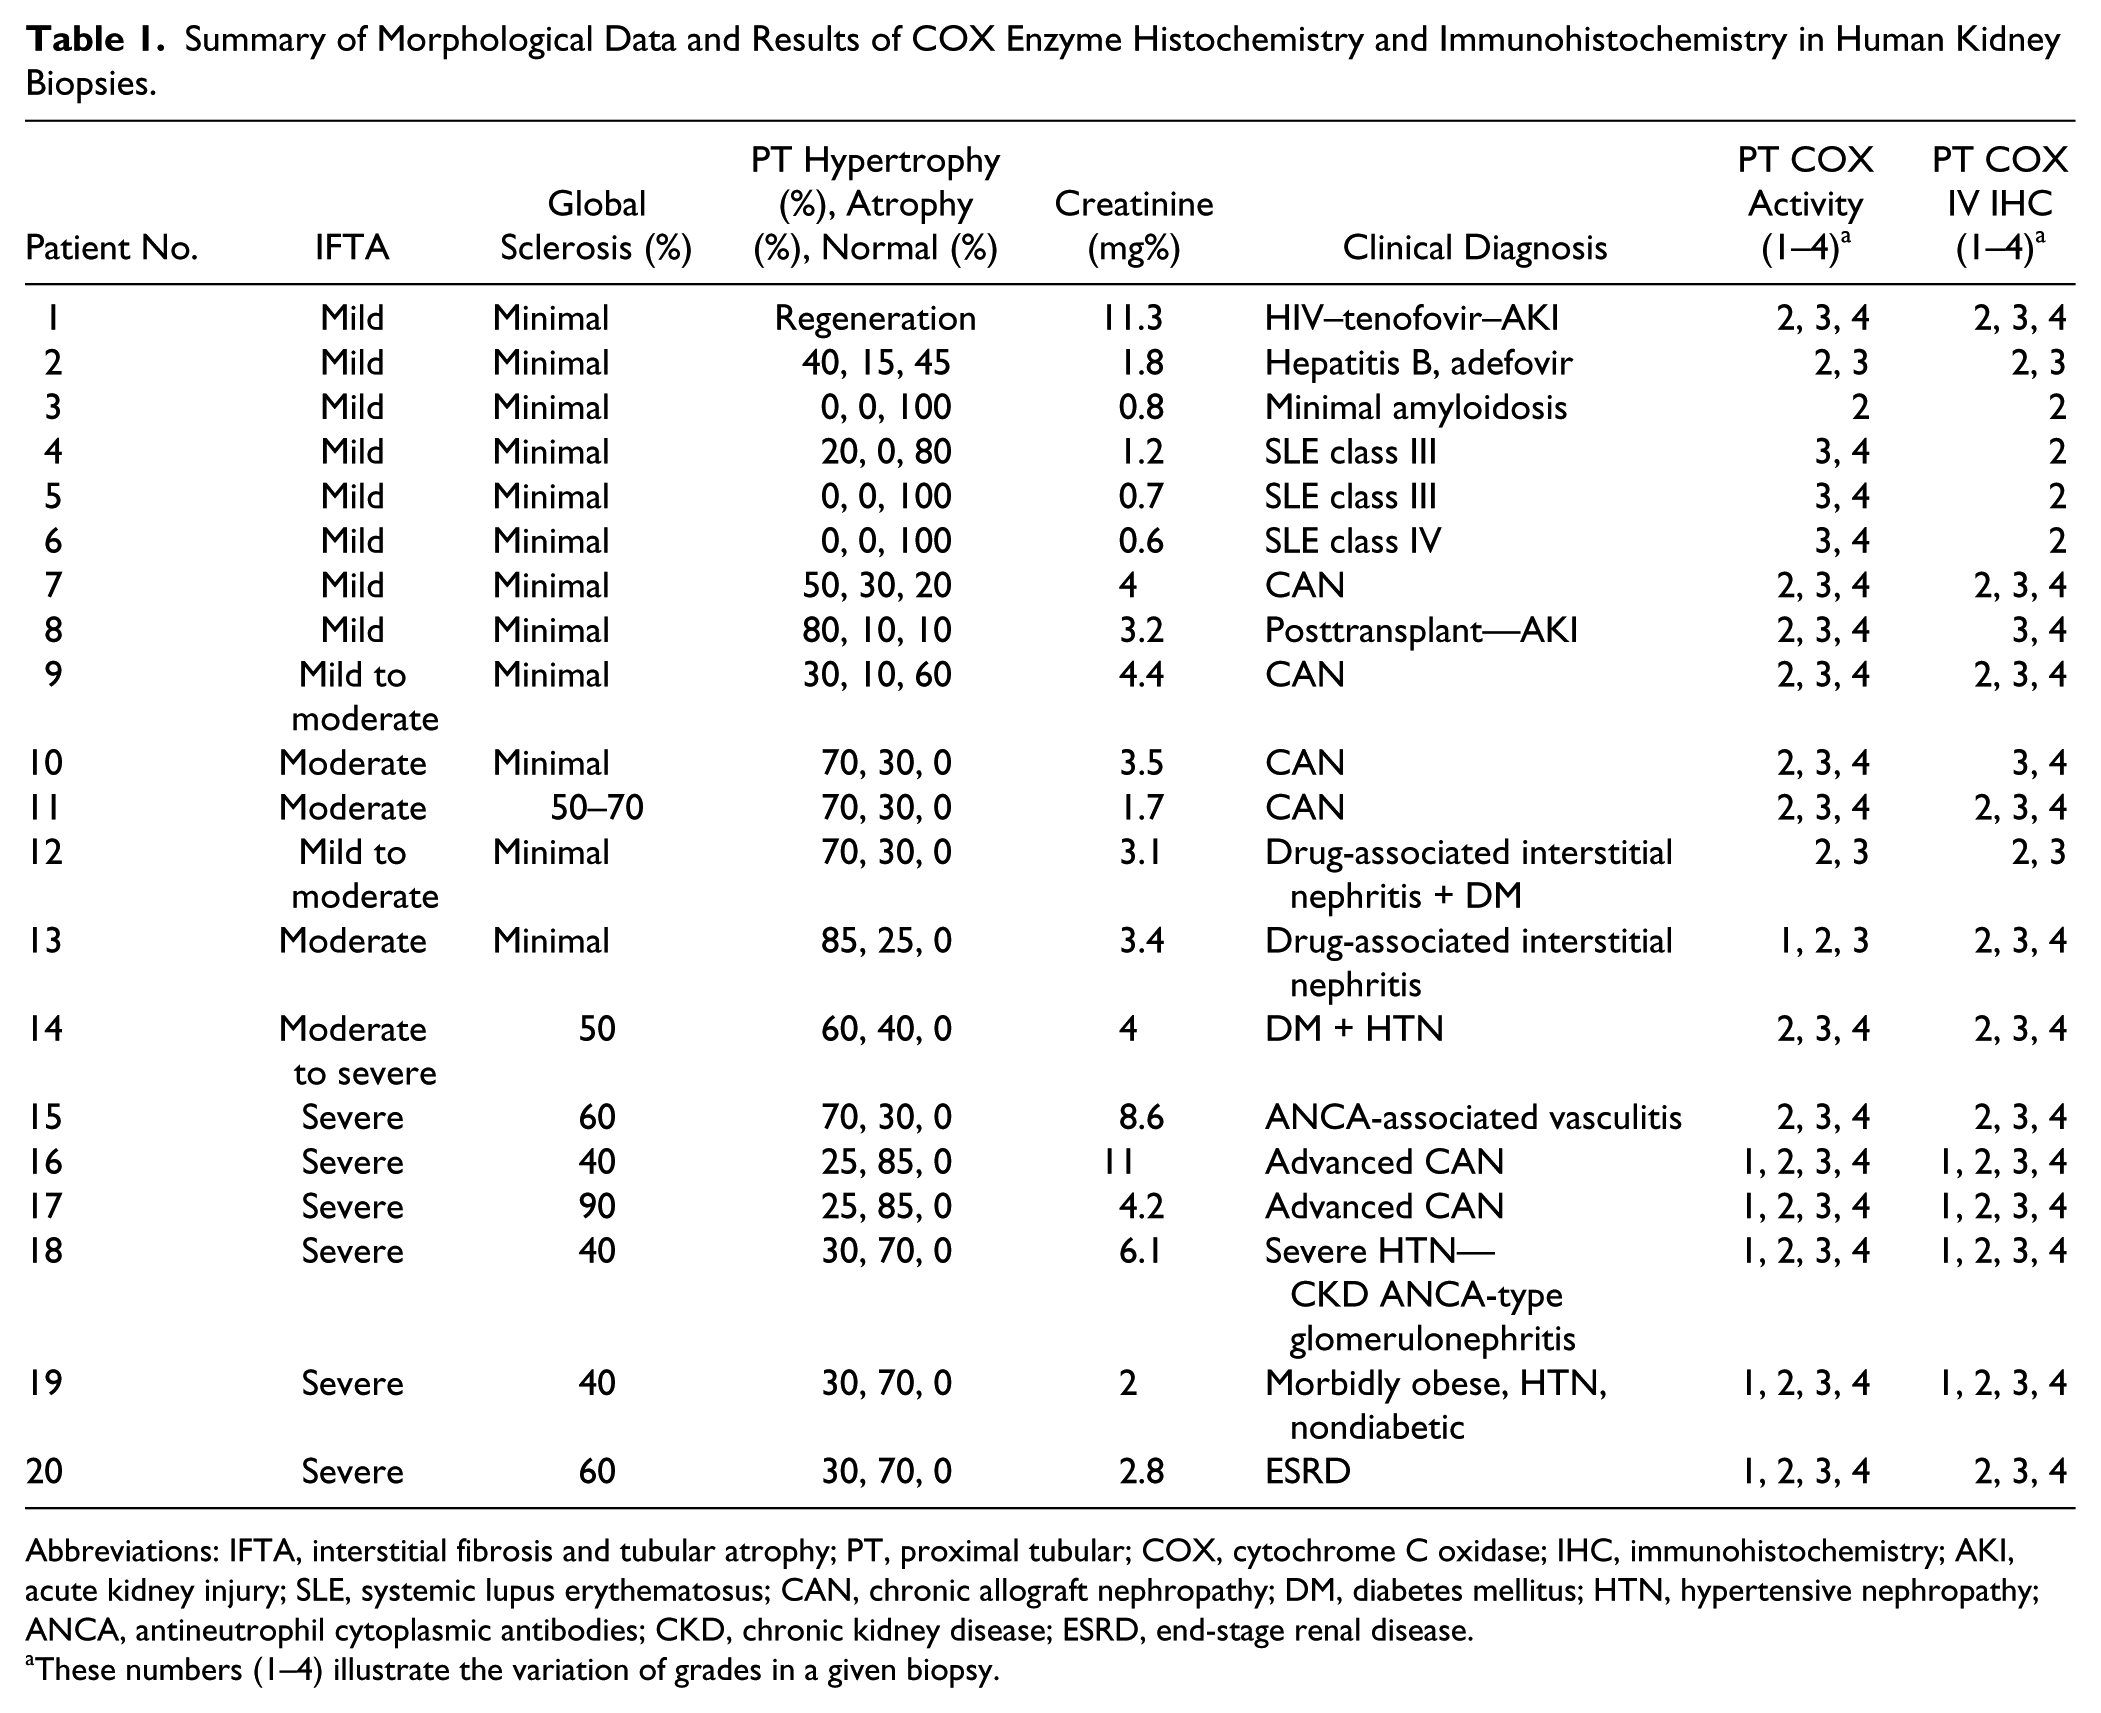
Cytochrome C oxidase (COX) enzyme (A) and COX IV immunohistochemistry (B) in the human control kidney. A, In the cortex, the distal tubules stain most intensely (staining score: 4), and proximal tubules stain as well, but to a lesser degree (staining score: 2). B, Similarly, COX IV immunostain shows higher protein expression in distal tubules than in proximal tubules. C and D, Functional electron microscopy (EM) images of the control kidney showing proximal (C) and distal (D) convoluted tubular COX enzyme activity. Scale bars: A and B = 100 µm; C and D = 2 µm.
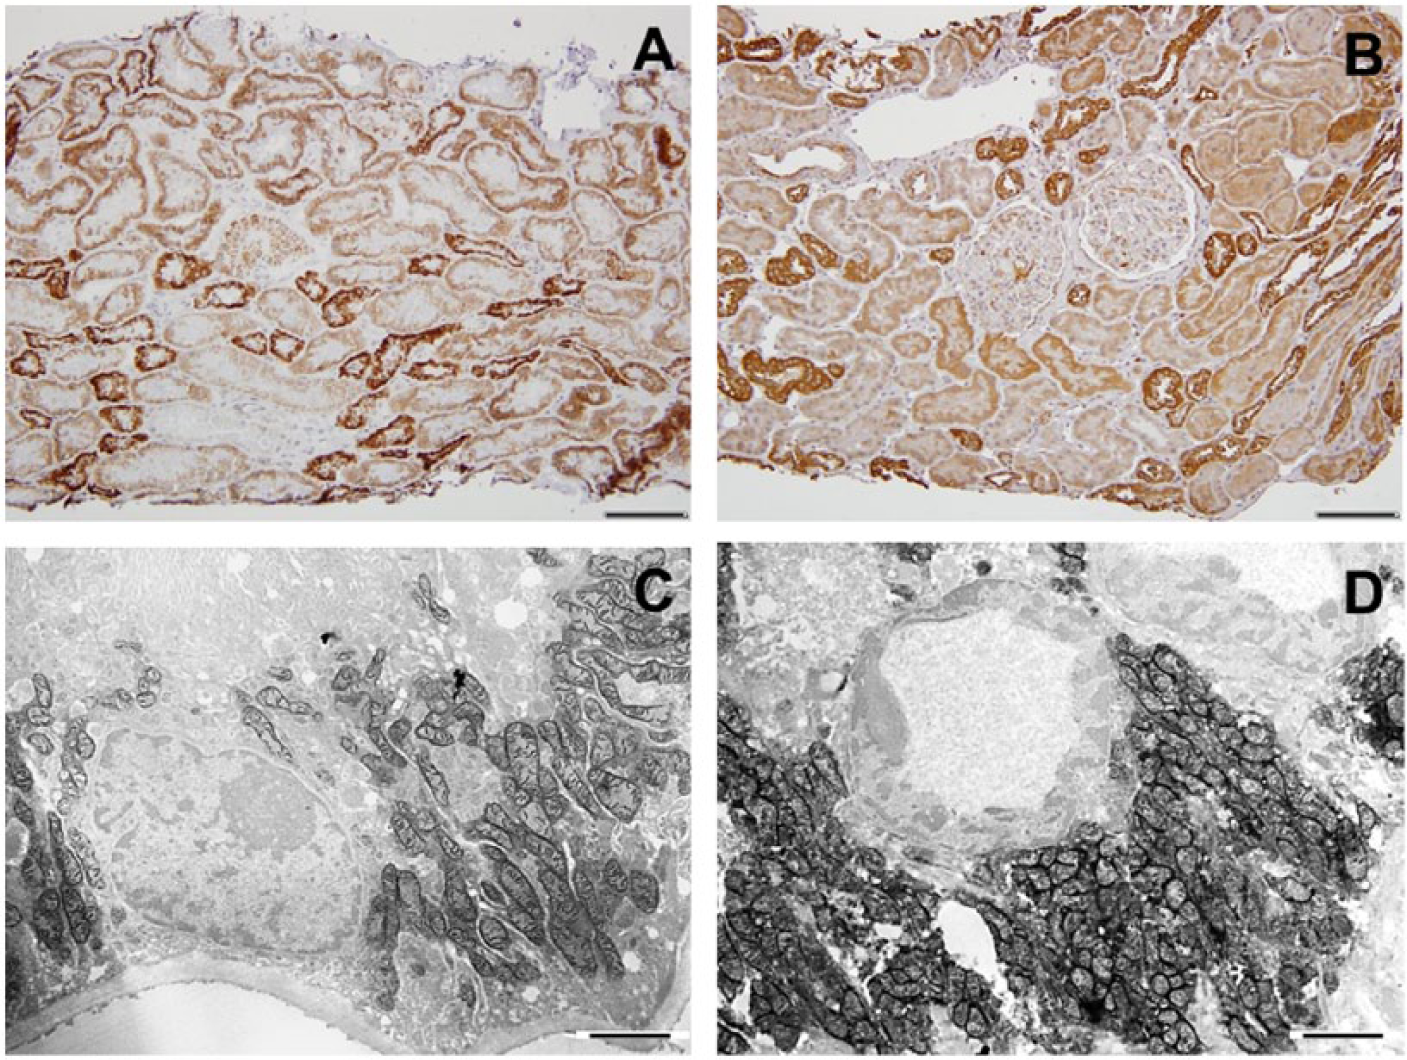
With moderate chronic allograft nephropathy (CAN), the biopsy shows focally normal areas with the appropriate proximal tubular (PT) to distal tubular (DT) ratio of intensity (DT > PT), and areas of hypertrophy can be seen as well in which the COX activity is equivalent to the distal nephron (Fig. 2A and B). With more severe CAN, the remaining intact parenchyma is hypertrophic and the COX activity in these proximal tubules varies from equivalent to distal tubules to almost negligible staining (Fig. 2F and G). This is also seen in functional electron microscopy studies (Fig. 2C and H). COX IV immunohistochemistry correlates with enzyme activity assay (Fig. 2D and I).
Chronic allograft nephropathy (CAN). Comparison of an early (A–E) and an advanced (F–J) CAN case. A, Normal COX enzyme activity pattern (DT > PT) is maintained in left portion of biopsy, whereas in the right side (and higher magnification in B), hypertrophic tubules exhibit increased proximal tubular COX activity. C, Functional EM demonstrates high COX activity in proximal tubular epithelium. D, COX IV immunohistochemistry shows normal pattern of protein expression (DT > PT) in most of the biopsy; only some hypertrophic tubules on the upper right of the image have increased COX protein stain, which is in concordance with activity assay. E, MT stain shows mostly intact tubular epithelium. F and G, COX enzyme histochemistry, showing great loss of tubular COX activity; only some hypertrophic tubules exhibit COX enzyme stain. H, Functional EM shows atrophied tubule with greatly decreased mitochondrial mass and COX activity. I, COX IV protein expression is maintained in remaining tubular epithelial cells. J, MT stain shows severe interstitial fibrotic change and atrophy. Abbreviations: COX, cytochrome C oxidase; EHC, enzyme histochemistry; LM, light microscopy; DT, distal tubular; PT, proximal tubular; EM, electron microscopy; MT, Masson’s trichrome; IHC, immunohistochemistry. Scale bars: A and F = 200 µm; B, D, E, G, I, and J = 100 µm; C and H = 2µm.
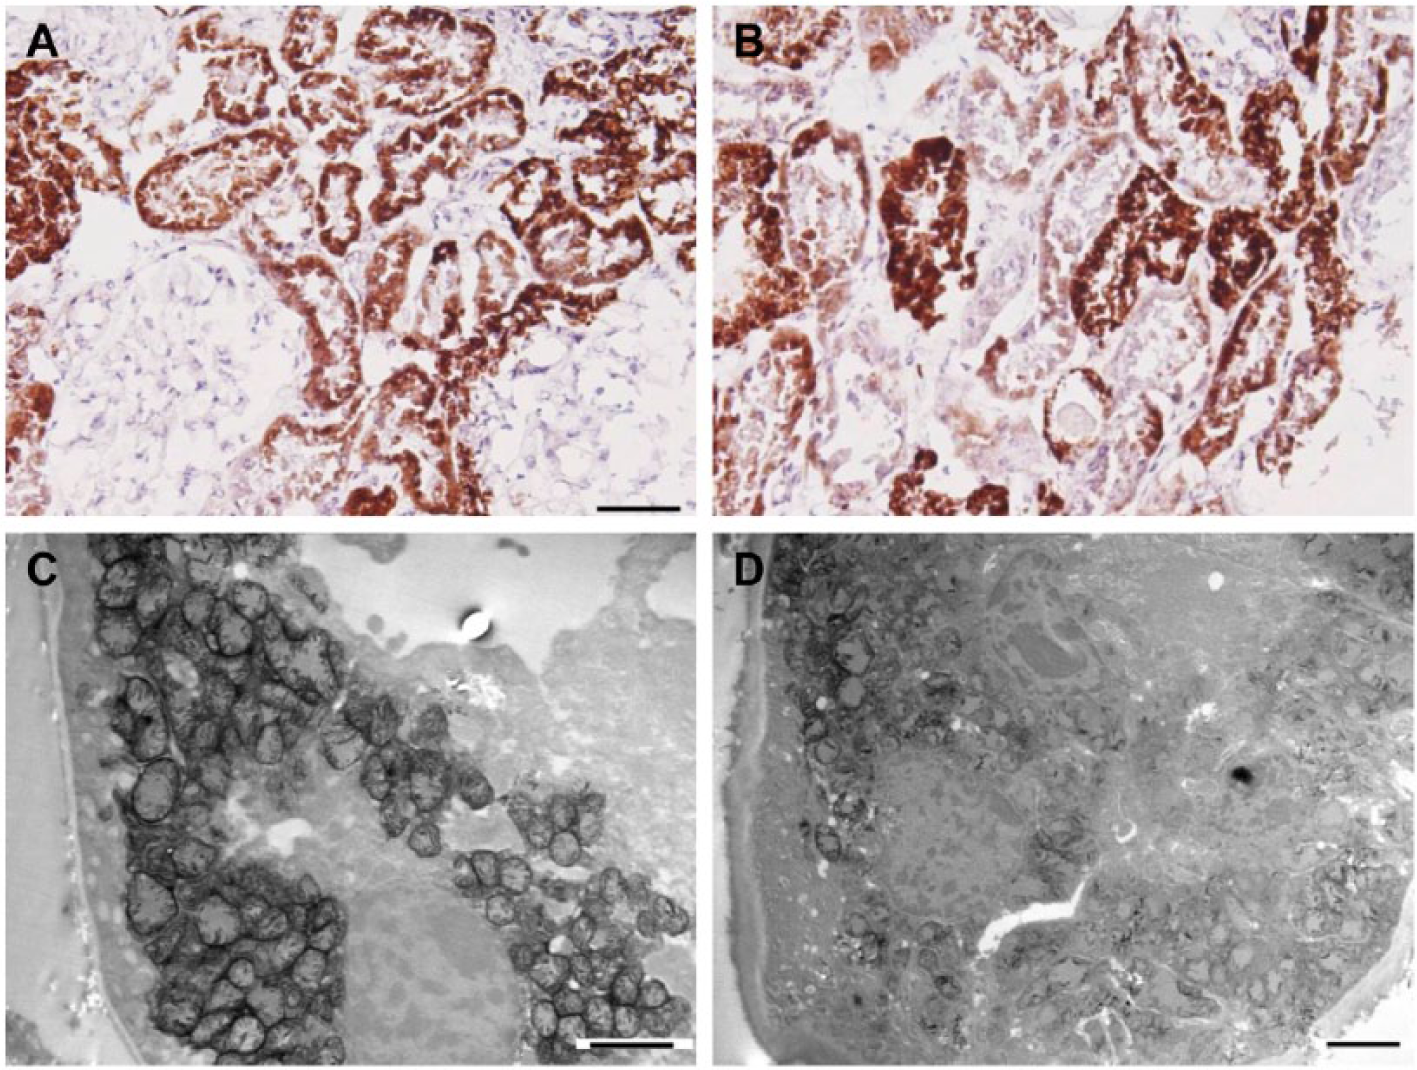
In three cases of systemic lupus erythematosus with limited fibrosis, the hypertrophy was minimal; however, the COX activity of the proximal tubules was equivalent to distal tubule type (Fig. 3A and B). Surprisingly, the immunostains ratio of DT > PT was normal (Fig. 3C and D).
Lupus erythematosus. A and B, Light microscopy images of cytochrome C oxidase (COX) enzyme histochemistry in two different lupus cases; both show uniformly increased proximal tubular COX activity. C and D, In contrast, COX immunohistochemistry reveals normal COX IV protein expression pattern, distal tubular (DT) > proximal tubular (PT). Scale bars: A–D = 100 µm.
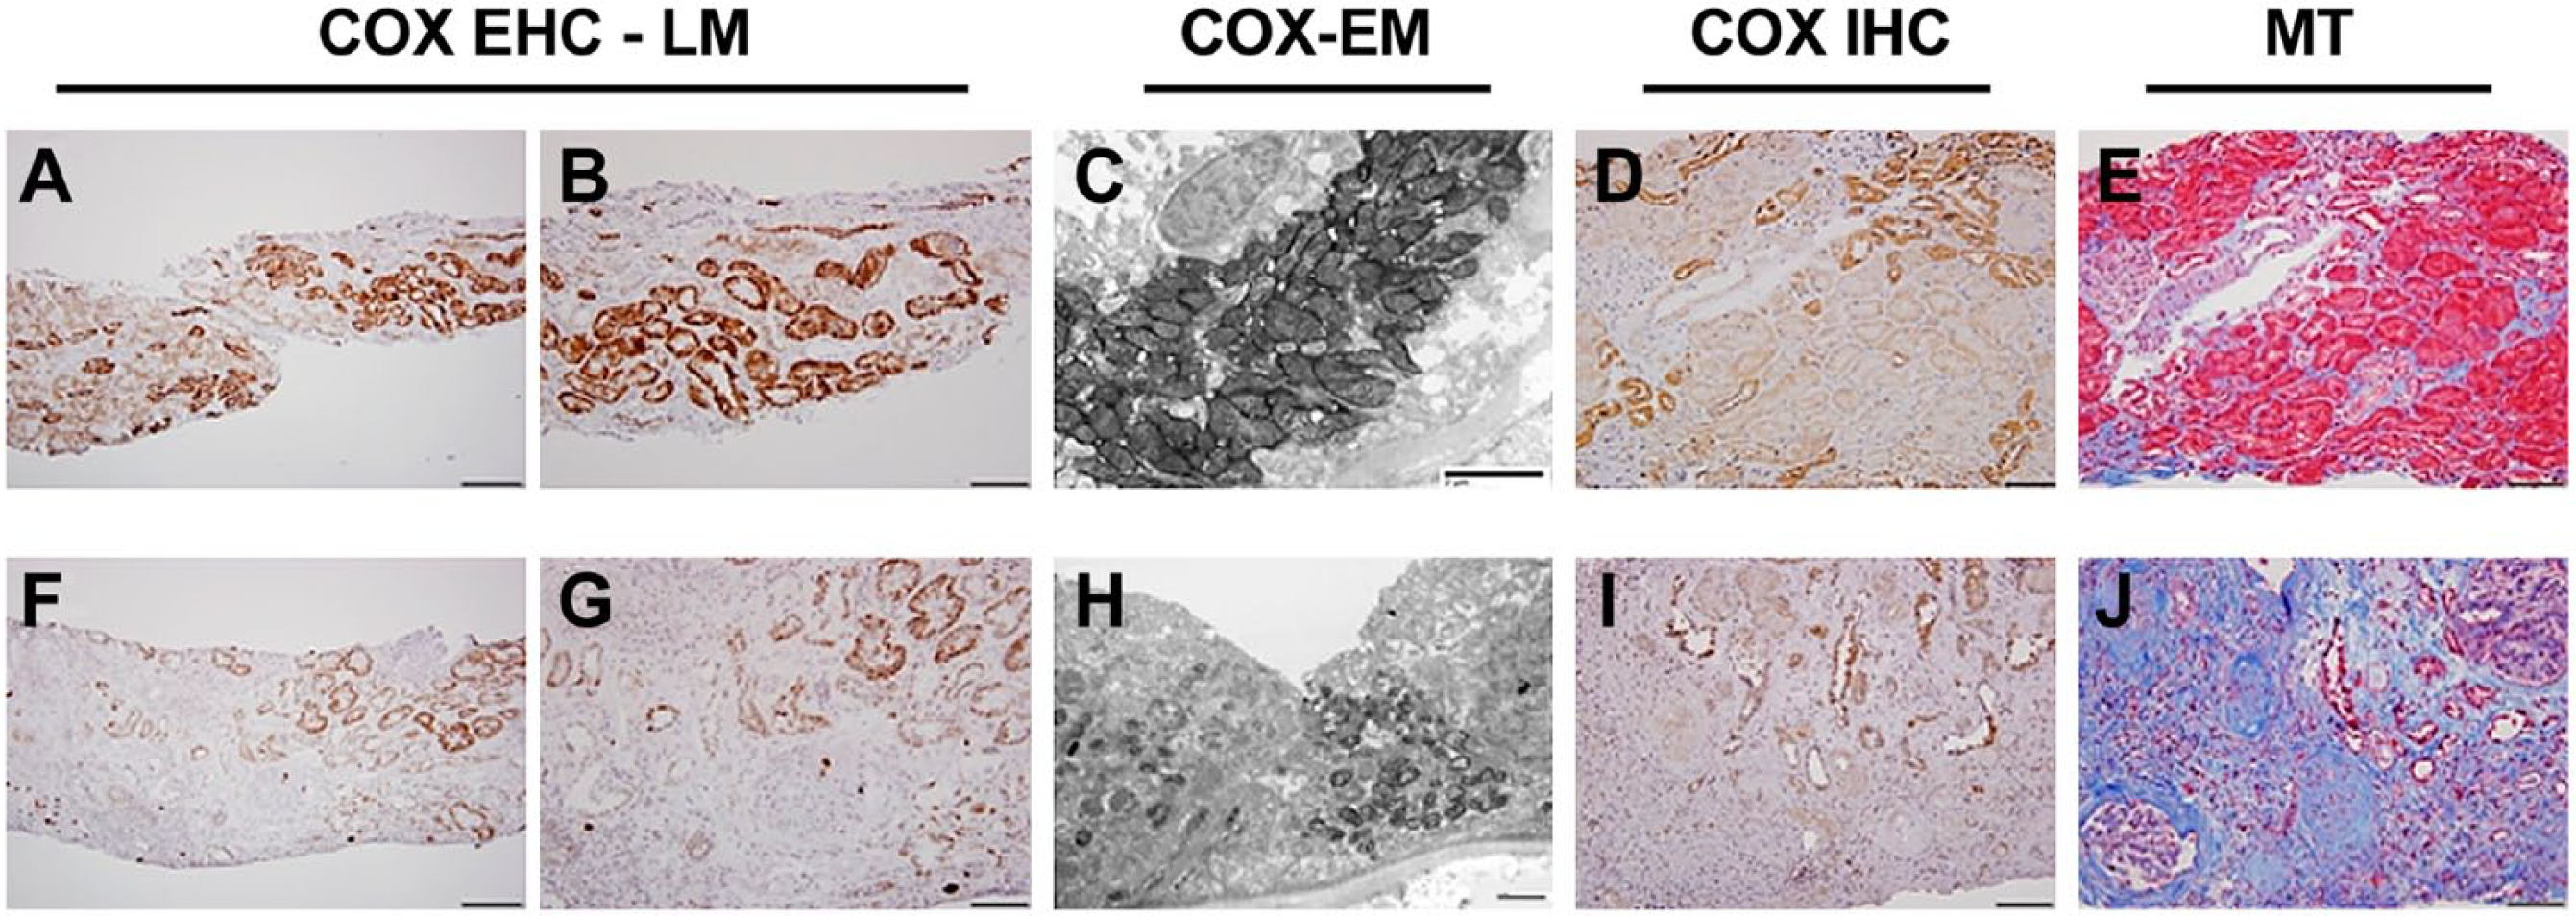
Two patients with adefovir/tenofovir toxicity are presented, one with extensive regenerative changes and the other with general parenchymal maintenance, both with typical proximal tubular mitochondrial changes (enlargement/cristae loss). In the case with parenchymal intactness, there was a great deal of variation in COX activity (Fig. 4A and B), but functional electron microscopy showed maintenance in injured mitochondria (Fig. 4C and D). The other tenofovir case showed only a few intact proximal tubules with similar mitochondrial findings and intense COX activity in the regenerating tubules (Table 1, Patient 1).
Adefovir toxicity. A and B, Light microscopy images of cytochrome C oxidase (COX) enzyme histochemistry. A, An area with uniformly intense COX activity, and B, showing variations in tubular enzyme activity. C and D, Functional electron microscopy (EM) images. C, Represents a proximal tubule with enlarged mitochondria and with still present COX activity. D, Tubular epithelium with injured mitochondria and loss of enzyme activity. Scale bars: A = 100 µm; B = 50 µm; C and D = 2 µm.
We performed morphometric quantification of COX activity (electron microscopy) in the adefovir toxicity case using NIH ImageJ software in Fig. 5. The mitochondrial mass is depicted by setting a higher threshold (threshold, 89), and the specific COX activity is depicted by setting a lower threshold (threshold, 70), and mean intensity and percent area are measured per total image area. The COX activity in image B is clearly decreased compared with image A, whereas mitochondrial mass is similar in the two images.
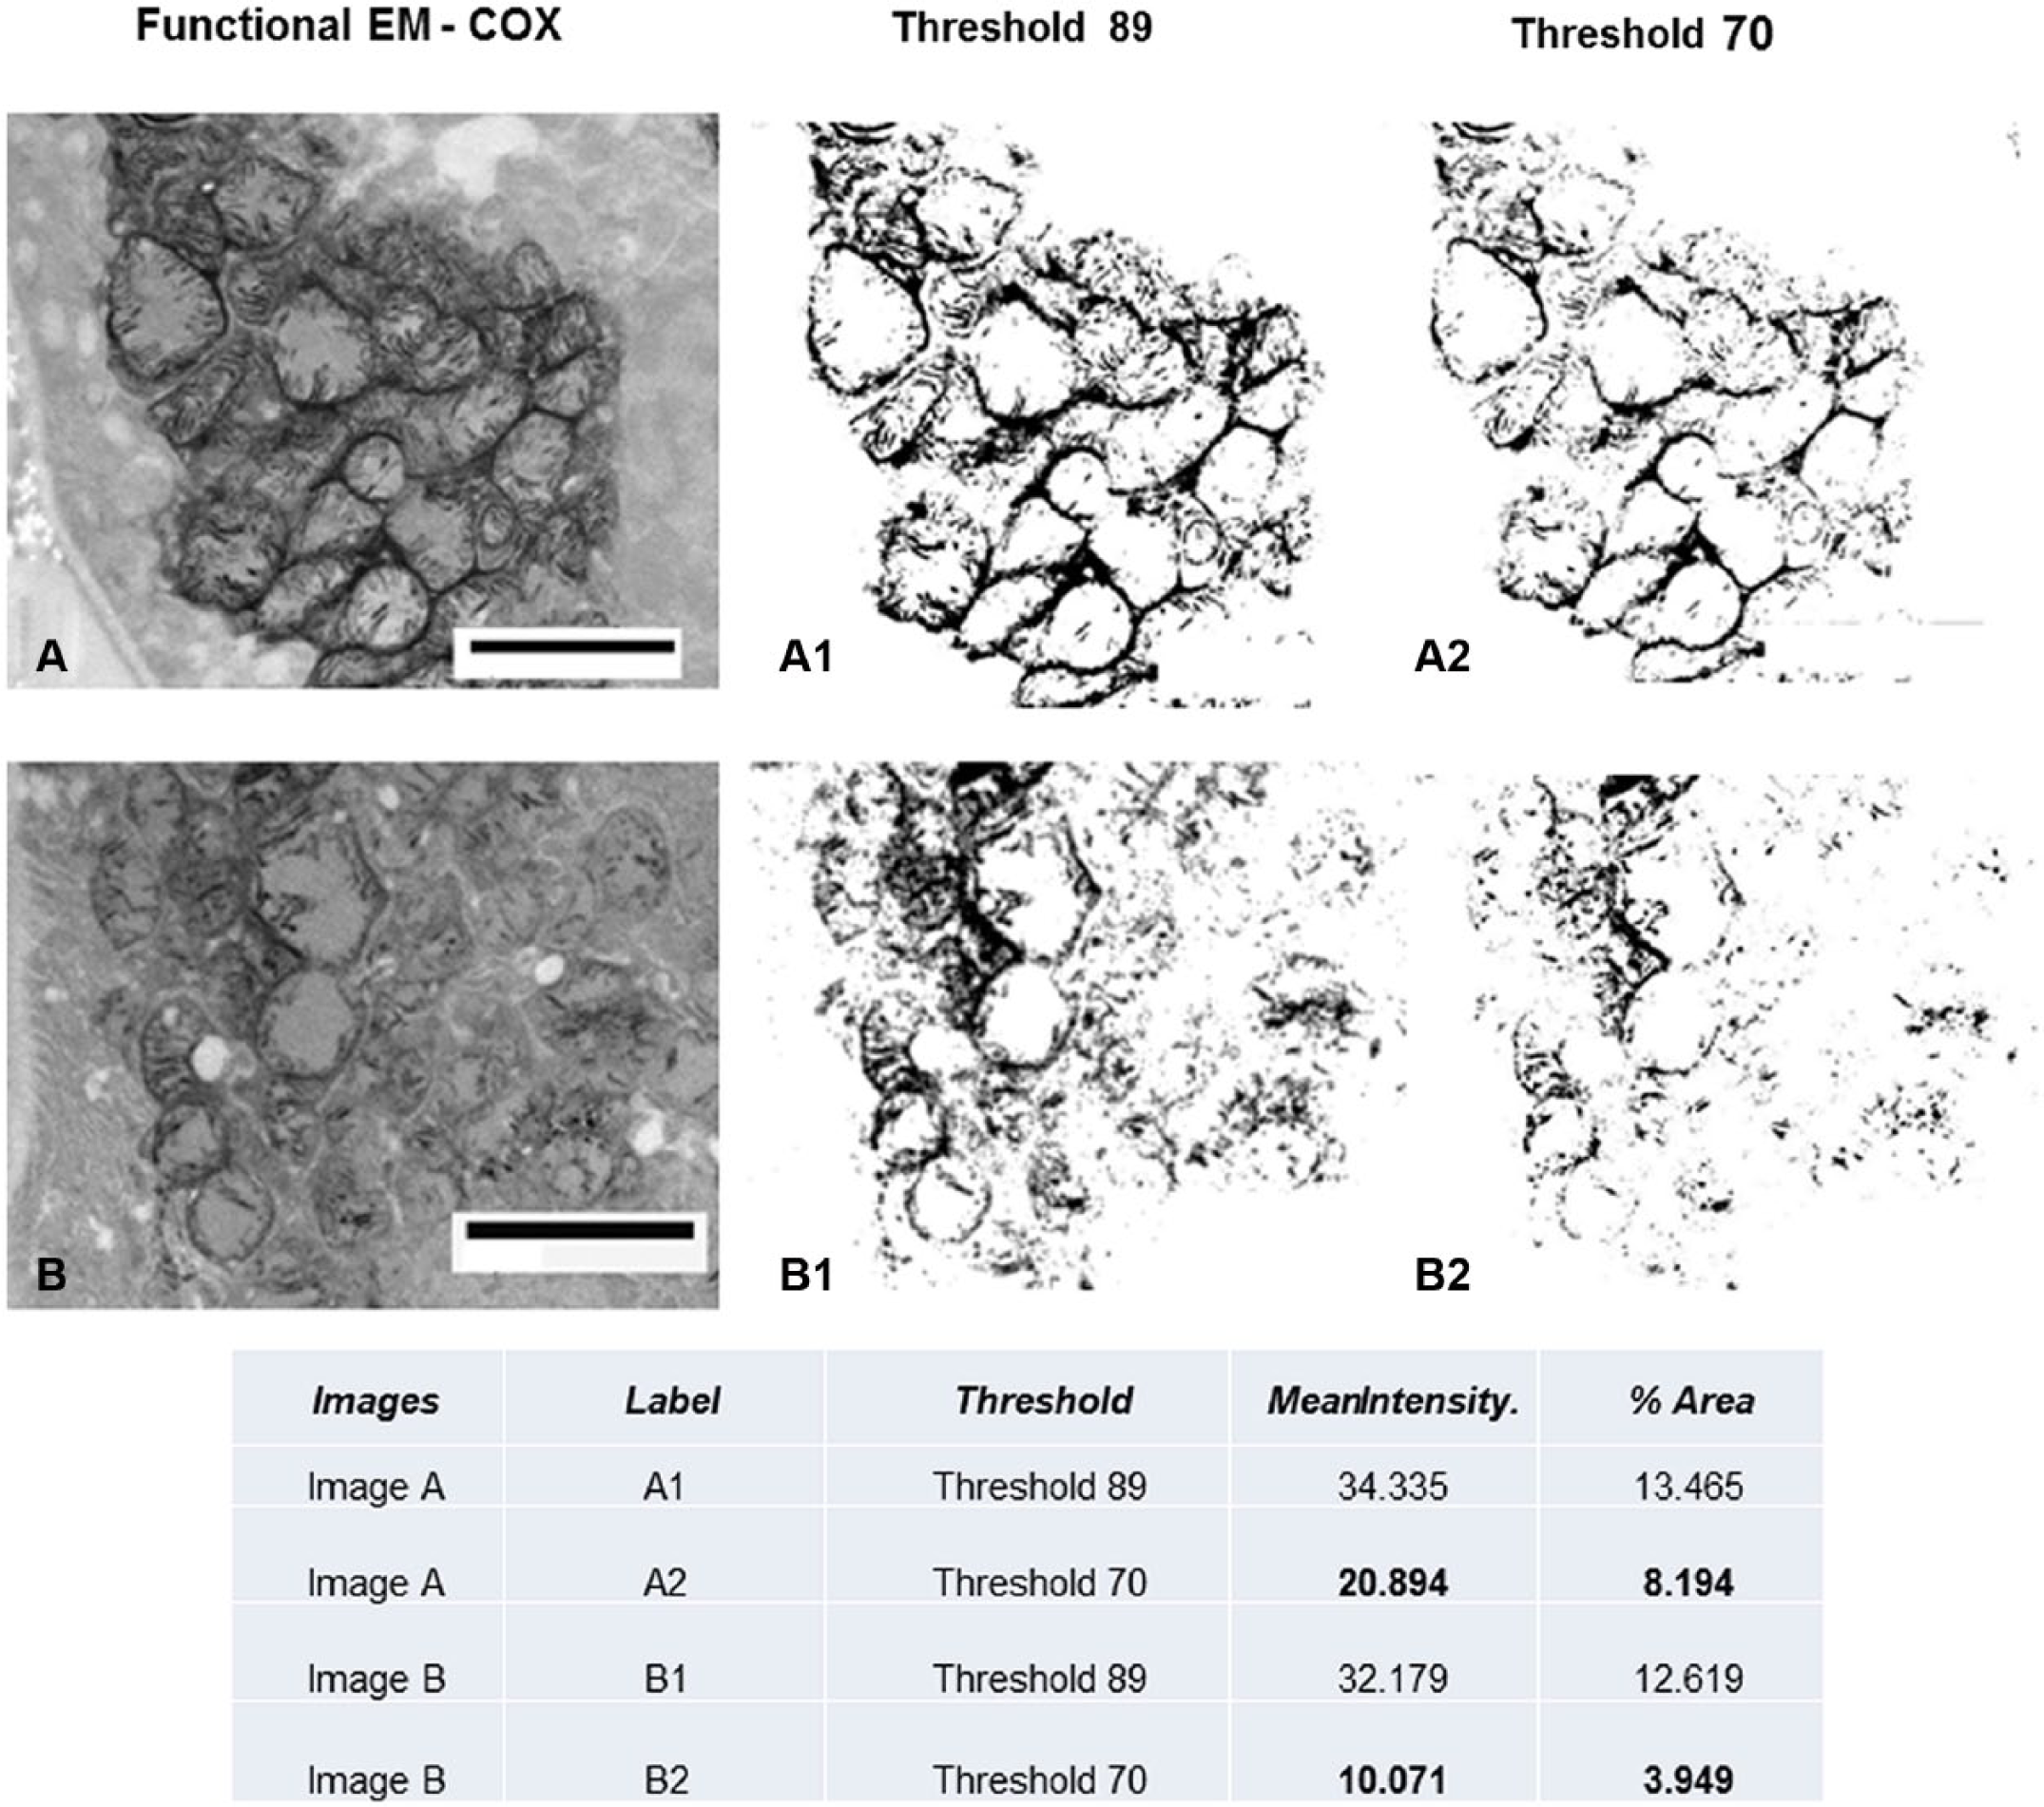
Quantitative measurement of functional EM. See Fig. 4C and D for original figures. Using NIH ImageJ software, the mitochondrial mass is depicted by setting a higher threshold (threshold, 89) and the specific COX activity is depicted by setting a lower threshold (threshold, 70); mean intensity and percent area are measured per total image area. The COX activity in image B is clearly decreased compared with image A, whereas mitochondrial mass is similar in the two images. Abbreviations: COX, cytochrome C oxidase; EM, electron microscopy. Scale bars: A and B = 2.5 µm.
Discussion
COX represents the terminal portion of the respiratory chain and thus reflects and defines the ongoing synthesis of ATP. In this article, we have demonstrated this protein both by its recognition as a molecular structure (immunostain) and its activity (enzyme histochemistry/functional electron microscopy). Both these techniques clearly define the mitochondrial mass.
It was surprising that COX immunostaining and activity showed heterogeneous expression in the hypertrophic proximal tubules; that is, not all hypertrophic change is equivalent. The degree of heterogeneity was extreme and varied from no or limited staining to an intense expression. It is particularly interesting that with extreme degrees of hypertrophic change (seen in more severe CAN), this variation is more evident. Indeed, Wolf considers chronic kidney disease as venue in which hypertrophy of the tubular epithelium occurs in remnant nephrons as an adaptive response. However, it is likely that these hypertrophic tubules are joined into the process of maladaptation of renal function leading to tubular atrophy.22–24 In these studies, the role of angiotensin II is described in mediating production of TGF-β and the progression to fibrotic processes.
Increased mitochondrial mass is important if not a critical process of proximal tubular hypertrophic change. This change in mitochondrial mass comes at an expense of the normal cell conformation, likely causing shifts in intracellular oxygen gradients. The oxygen concentration required for mitochondrial function in the kidney is affected by mitochondrial distribution within the cell as well as by the functional demands imposed on the cell. 25 The mitochondrial clusters are in sites of high ATP demand to maximize supply in limited areas, and the clusters are restricted by the magnitude of the oxygen gradient needed for their function.26,27
One can speculate that the intense COX activity and presumed increased mitochondrial functions can lead to exaggerated free radical expression which is deleterious for these hypertrophic cells. It is particularly notable that in three lupus cases, enzyme activity was diffusely upregulated but hypertrophy was limited, and the immunostains for COX were in the normal range, suggesting that this upregulation of enzyme activity could be related to protein reabsorption/proteinuria and in itself could represent an injurious process. Indeed, Wagner et al. 28 directly addressed such metabolic consequences of proximal tubular protein reabsorption and found alteration of proteins involved in ATP synthesis. 28 We realize this information especially the latter is based on small number of cases, which needs further studies.
Tubular atrophy has been considered simply as an end-stage process, but recent studies have demonstrated that such tubules, which initially provided growth factors and cytokines that would be required for regenerative activity, become a source of fibrogenic cytokines.29–31 While other parameters have such tubules to be basically negative for COX, functional electron microscopy shows that these tubules have a limited, but still active mitochondrial mass. Their capacity to transport seems to be negligible as evidenced by their overall loss of mitochondria, basolateral membranes, and brush border. However, our present study data suggest that these tubules do retain a functional capacity and are consistent with the notion that they are capable of synthesis of such fibrogenic cytokines.
It is interesting that substances (adefovir) known to be putatively mitochondrial toxic both experimentally 32 and morphologically in human biopsies9,33 are still consistent with some degree of maintenance of oxidase activity.
In summary, we presented integrated methodology capable of analyzing mitochondria to demonstrate COX on both immunohistochemical and enzyme activity basis in human renal biopsies. This is particularly important in evaluating drug-related mitochondrial toxicity, delineating mutational disorders directly related to or secondarily involving mitochondria and simply understanding the process of hypoxic injury, hypertrophic changes, and tubular atrophy.
Footnotes
Acknowledgements
We thank Ms Lena Ellezian for cryosectioning and electron microscopy processing at Department of Pathology at Beth Israel Deaconess Medical Center (BIDMC). We also thank Ms Andrea Calhoun at the Electron Microscopy Core Laboratory of BIDMC for her assistance with cytochrome C oxidase (COX) electron microscopy in this study.
Author Contributions
ZKZ had substantial contributions to the conception and design of the work; the acquisition, analysis, and interpretation of data for the work; revising it critically for important intellectual content; final approval of the version to be published; and agreement to be accountable for all aspects of the work in ensuring that questions related to the accuracy or integrity of any part of the work are appropriately investigated and resolved. SR had substantial contributions to the conception and design of the work; manuscript writing and final approval of the version to be published; and agreement to be accountable for all aspects of the work in ensuring that questions related to the accuracy or integrity of any part of the work are appropriately investigated and resolved.
Competing Interests
The author(s) declared no potential conflicts of interest with respect to the research, authorship, and/or publication of this article.
Funding
The author(s) disclosed receipt of the following financial support for the research, authorship, and/or publication of this article: Intradepartmental funding was used at Beth Israel Deaconess Medical Center (BIDMC) Pathology Department.