
Abstract
Matrix extracellular phosphoglycoprotein (MEPE) is an extracellular matrix protein found in dental and skeletal tissues. Although information regarding the role of MEPE in bone and disorders of phosphate metabolism is emerging, the role of MEPE in dental tissues remains unclear. We performed RNA in situ hybridization and immunohistochemistry analyses to delineate the expression pattern of MEPE during embryonic and postnatal development in craniofacial mineralizing tissues. Mepe RNA expression was seen within teeth from cap through root formation in association with odontoblasts and cellular cementoblasts. More intense expression was seen in the alveolar bone within the osteoblasts and osteocytes. MEPE immunohistochemistry showed biphasic dentin staining in incisors and more intense staining in alveolar bone matrix and in forming cartilage. Analysis of Mepe null mouse molars showed overall mineralized tooth volume and density of enamel and dentin comparable with that of wild-type samples. However, Mepe-/- molars exhibited increased thickness of predentin, dentin, and enamel over controls and decreased gene expression of Enam, Bsp, Dmp1, Dspp, and Opn by RT-PCR. In vitro Mepe overexpression in odontoblasts led to significant reductions in Dspp reporter activity. These data suggest MEPE may be instrumental in craniofacial and dental matrix maturation, potentially functioning in the maintenance of non-mineralized matrix.
Introduction
The craniofacial complex contains numerous mineralized tissues, including bone, cartilage, cementum, dentin, and enamel. In particular, bone and dentin are extremely similar in composition and mechanism of formation, consisting of a predominantly collagenous matrix containing mostly type I collagen and a number of non-collagenous proteins (NCPs) that are involved in mineralization (Butler 1998; Bleicher et al. 1999). The majority of these dentin/bone NCPs share common structural and molecular features and have been classified as members of the small integrin-binding ligand, N-linked glycoprotein (SIBLING) family of proteins (Fisher and Fedarko 2003), which are located in a cluster on human chromosome 4q21 (MacDougall 2003). The SIBLING family contains five members: dentin sialophosphoprotein (DSPP), dentin matrix protein 1 (DMP-1), bone sialoprotein (IBSP), osteopontin (SPP1), and matrix extracellular phosphoglycoprotein (MEPE). Three SIBLINGs have been associated with the pathogenesis of a human genetic disease that alters mineralization: 1) DSPP with autosomal dominant dentin structural diseases (dentinogenesis imperfecta types II and III, and dentin dysplasia type II); 2) DMP-1 with an autosomal recessive form of hypophosphatemic rickets (ARHR1 OMIM #24152, Lorenz-Depiereux et al. 2006) and chronic kidney disease (Pereira et al. 2009); and 3) MEPE with oncogenic hypophosphatemic osteomalacia (OHO) (Rowe et al. 2000; Imanishi et al. 2012). SIBLING proteins are also referred to as acidic secretory calcium-binding phosphoproteins (SCPPs) and are predominated associated with the collagenous mineralized tissue of bone and dentin (Kawasaki 2011). However, the synthesis and secretion of SIBLING proteins has also been found in other mineralized tissues, such as cartilage and enamel. MEPE was the last SIBLING protein identified and is the least well-characterized, especially with relation to its role in tooth formation and mineralization.
MEPE (also known as osteocyte/osteoblast factor 45, OF45) was initially cloned as a secreted protein from a OHO tumor (Rowe et al. 2000) and is highly expressed in bone (Petersen et al. 2000). MEPE exhibits high homology among species (mouse, rat, monkey, and human) and major structural features similar to SIBLING proteins (Rowe et al. 2000; Argiro et al. 2001; MacDougall et al. 2002), including: a putative signal peptide, an Arg-Gly-Asp (RGD) cell attachment motif, a glycosaminoglycan attachment site (SGDG), and several phosphorylation motifs. A specific feature of MEPE protein is the presence of a serine-rich sequence near the C-terminus, which displays homology with DSPP and, to a lesser extent, DMP-1 and OPN (Rowe et al. 2000). The cleaved C-terminal serine-rich peptide fragment of MEPE, known as ASARM-peptide or Dentonin, has been shown to down-regulate odontoblast differentiation in vitro (Liu et al. 2004), whereas the RGD motif of MEPE appears to enhance proliferation of dental pulp stem cells (Wang et al. 2010). These studies corroborate previous observations in bone that show that MEPE suppresses mineralization. An analysis of the long bones of Mepe-/- mice revealed their increased density, indicating that MEPE is critical in inhibiting bone formation (Gowen et al. 2003). As a regulator of phosphate metabolism, MEPE has a role in renal physiology (Kiela and Ghishan 2009) and has been implicated in disrupted systemic phosphate levels (White et al. 2006).
Whereas a substantial body of literature has investigated the role of MEPE in bone, knowledge of its expression pattern and activity in dental tissues remains limited. Here, we demonstrate the expression pattern of MEPE in the craniofacial complex and teeth at the RNA and protein levels. We investigate the interactions and potential effect of MEPE on other SIBLING dentin matrix proteins. Our data shows that MEPE is present during the development of mineralized tissues of the craniofacial complex: teeth, bone, and cartilage. Ablation of Mepe results in increased dentin collagen matrix volume; although, overall tooth mineral density remains unchanged as compared with the control. Mepe overexpression causes a decrease in the expression of Dspp, a critical component of matrix mineralization and a marker of odontoblast cytodifferentiation. Based on its developmental expression by cells involved in the synthesis of mineralized matrices of teeth, bone, and cartilage, MEPE may not only have similar roles with other bone/dentin matrix proteins, but could also function as a specific early matrix-forming marker related to the non-mineralized phases of dentinogenesis, osteogenesis, and chondrogenesis.
Materials & Methods
Animals and Procedures
This study was approved by the Committee on Animal Care at the University of Texas Health Science Center at San Antonio. Pregnant ICR Swiss mice were purchased (Harlan Laboratories; Indianapolis, IN) or Mepe-null animals were bred and allowed to give birth. Pups were sacrificed at postnatal day (PN) 1, 2, and 3 for immunohistochemistry in wild-type (WT) mice and at embryonic day (E) 20, PN1, -2, and -3 for Mepe-/- mice. For in situ hybridization and tooth measurement studies, C57/BL6 mice (The Jackson Laboratory; Bar Harbor, ME) were purchased and bred. Animals were housed in a temperature- and humidity-controlled room with a 12-hr light/12-hr dark cycle and were provided with food and water ad libitum.
In Situ Hybridization
Histological sections for in situ hybridization and antisense and sense RNA probes for Mepe were prepared as previously described (Gluhak-Heinrich et al. 2007). Mouse mandibular tissues sectioned at 6–8-μm thickness were prepared from animals at E16 and PN-3, -5, and - 9.
Sections were deparaffinized with xylene and 100% ethanol, treated with proteinase K solution (Proteinase K, 5 mg/ml in 50 mM Tris, 5mM EDTA pH 7.6) for 10 min at 37°C, re-fixed in 4% formaldehyde in PBS (0.2 M phosphate buffer, 3 M NaCl), acetylated (100 mM triethanolamine, 0.25% acetic anhydride), and dehydrated through ethanol. Hybridization was carried out at 55°C overnight in a humid chamber with 50 μl of hybridization mixture. The hybridization mixture contained 50% formaldehyde, 20 mM Tris-HCl (pH 8.0), 1 mM EDTA, 0.3 M NaCl, 10% dextran sulfate, 1× Denhardt’s solution, 100 μg/ml denatured SS-DNA, 500 μg/ml tRNA and 2 × 10⁷/ml 32P rUTP-labeled RNA probe. After hybridization, slides were rinsed in 2× SSC at room temperature, then incubated with RNase solution (40 mg/ml RNase A1, 10 U/ml RNase T1, 0.3 M NaCl, 10 mM Tris, 5 mM EDTA) at 37°C for 1 hr. Consecutive 5-min washes at 57°C were done twice with 2× SSC, four times in 0.5× SSC, and three times in 0.1× SSC. A final dehydration in ethanol containing 0.3 M ammonium acetate was performed before autoradiography. Air-dried slides were dipped in emulsion (Kodak NTB 3) diluted 1:1 with 0.6 M ammonium acetate at 42°C. After exposure (1–3 weeks), the emulsion was developed in a Kodak D-19 developer. The slides were counterstained with hematoxylin, dehydrated, and mounted with Permount (SO-P-1.5; Fisher Scientific, Hampton, NH).
Immunohistochemistry
Histological sections (5 μm) of PN3 mice tissue samples were prepared for immunohistochemistry, as previously described (MacDougall et al. 1998). MEPE immunostaining was performed using a MEPE polyclonal C-peptide antibody (Rowe et al. 2004). All rinsing and incubations were performed using 0.05 M Tris NaCl (pH 7.6) at room temperature. After dehydration, sections were pretreated with 0.3% H2O2 for 10 min to inhibit endogenous peroxidase activity. After rinsing, the sections were incubated for 30 min with a 1:10 dilution of pre-immune goat serum (Dako Corporation; Carpinteria, CA). Sections were then incubated for 1 hr with the MEPE antibody diluted 1:100 in 0.05 M Tris NaCl (pH 7.6), containing 1% bovine serum albumin and 1% normal goat serum, followed by washing. Next, a 1:100 dilution of anti-rabbit goat IgG conjugated to peroxidase was incubated for 40 min and detected using rabbit anti-peroxidase IgG conjugated to peroxidase, diluted 1:100 (PAP system, Dako) for 30 min. Immunoreactive sites were visualized with 3-3’ tetrachloride diaminobenzidine oxidization in 0.1 M Tris NaCl (pH 7.6) with 0.03% H2O2. Sections were rinsed in Tris NaCl, dehydrated, and mounted in Cytoseal XYL (Stephens Scientific; Kalamazoo, MI). Sections were counterstained with Harris hematoxylin solution (Sigma-Aldrich; St Louis, MO) and photographed using an Axioplan photomicroscope (Zeiss; Jena, Germany). Normal mouse serum (Sigma-Aldrich; 1:200) and non-specific IgGs (Sigma-Aldrich, 1:100) served as negative controls.
Radiographic Analysis and Microcomputed Tomography
Radiography of WT and Mepe-/- PN3 mouse heads was performed using the MX-20 Cabinet X-ray System for 10 s at 18 kV (Faxitron X-Ray Corporation; Lincolnshire, IL). To examine three-dimensional tooth structure, the specimens were scanned by a Scanco μCT40 desktop cone-beam scanner (Scanco Medical AG; Brüttisellen, Switzerland) using 20-mm specimen tubes. Scans were performed at the following settings: 10 μm resolution, 70 kVp, 114 µA with an integration time of 200 ms. Scans were automatically reconstructed into 2-D slices, and the region of interest was outlined in each slice using the μCT Evaluation Program (v5.0A, Scanco Medical).
Molar Tooth Matrix Analysis
The thicknesses of predentin, dentin, and enamel layers were determined using H&E-stained histological sections of PN3 WT and Mepe-/- mouse mandibles. NIS-Elements microscope imaging software (Nikon; Melville, NY) was used to perform measurements of dentin and enamel layers in triplicate at the mesial and distal cervical aspects, as well as lengths of each layer at the peak of the mesial and distal cusps of first molars.
Quantitative Reverse Transcription PCR (qRT-PCR)
Mepe-/- and WT mice (PN3) mandibular first molars were dissected and used for qRT-PCR analysis of tooth matrix gene expression profiles. Total mRNA was isolated using RNA STAT-60 (TEL-TEST, Inc.; Friendswood, TX), converted to cDNA with TaqMan Reverse Transcriptase Reagents (Applied Biosystems; Foster City, CA), and used for real time PCR amplification of tooth transcripts using an ABI PRISM 7000 Sequence Detection System (Applied Biosystems). Each reaction well contained 12.5 μl of 2× SYBR Green mix (Applied Biosystems), 10.5 μl of primer mix (5 pmoles of each primer), and 2 μl of template (cDNA or control) for a total volume of 25 μl. Thermal cycle parameters were 50°C for 1 sec, 95°C for 10 min, 40 cycles of 95°C for 15 sec, and 60°C for 1 min. Raw data were normalized against cyclophilin-A mRNA levels in each corresponding sample, and results are shown as relative quantities of cycle changes during steady-state transcription of a gene.
Dspp Promoter-reporter and Mepe cDNA Expression Constructs
A mouse 2.6 kb (XbaI/HindIII) Dspp promoter segment in the pGL-3 luciferase (LUC) basic expression vector was used for this study (Feng et al. 1998). Mouse Mepe primers (S-5’CACCATGAAGATGCAGGCTGTGT and AS-5’CTAGTCACCATGACTCTCACT) were used to amplify the full-length mouse Mepe cDNA, which was subcloned into the pcDNA 3.1/V5-His TOPO vector (Invitrogen; Carlsbad, CA) according to manufacturer’s instructions, and confirmed by DNA sequence analysis.
Co-transfection and Luciferase Assay
Both vectors, with the control Renilla TK, were transiently co-transfected into the mouse odontoblast cell line MD10-A2 (MacDougall et al. 1995; Gonzales et al. 2010). One day before transfection, mouse odontoblast MD10-A2 cells were seeded into the wells of 12-well plates and grown to 70% confluence. The Mepe cDNA construct or empty construct, Dspp-Luc promoter, and Renilla luciferase vector (Promega, Madison, WI) were complexed with the PLUS reagent (BRL) in serum-free Opti-MEM (Gibco-BRL Life Technologies; Carlsbad, CA) and incubated. Lipofectamine reagent (Life Technologies) was then added and incubated. While the DNA/PLUS complexes were forming, the media on cells was replaced with serum-free Opti-MEM media (Life Technologies). Each culture was then incubated at 37°C with 5% CO2 for 3 hr in DNA–PLUS–Lipofectamine mixture, followed by α-MEM with 20% fetal bovine serum (FBS). Cells were harvested after 48 hr, treated with passive lysis buffer (Promega), centrifuged, and the supernatant was transferred to a new tube. Firefly reagent (Promega) was added and the pGL3 activity was measured with a luminometer. This was directly followed by the addition of Stop and Glow to measure Renilla activity. Luciferase activity was normalized using the Renilla luciferase values. Statistical analysis was performed using a one-way ANOVA.
Results
Localization of Mepe RNA in the Developing Molar
RNA in situ hybridization with Mepe anti-sense probes revealed that Mepe is expressed throughout tooth formation, from cap formation through to root formation, during mouse mandibular molar development (Fig. 1). Initially, at E16, Mepe was uniformly expressed in both epithelial and mesenchymal components of the tooth organ (Fig. 1B). At PN3, the Mepe signal intensity decreased and became more restricted to the alveolar bone (Fig. 1D). The odontoblasts were less intensely labeled than the osteoblasts in the surrounding bone. At PN5, an increase in the intensity of the Mepe signal was evident in odontoblasts and within the dental pulp, with further expansion of the signal within the bone cells surrounding the tooth (Fig. 1F). At PN10, the signal could be detected within the developing roots, with major positive signal found in the bone (Fig. 1H). The same pattern was also seen at PN14. However, at the bifurcation of the roots, positive signal was seen in the odontoblasts and in late maturation-stage ameloblasts in the crown region (Fig. 1J). Within the root apex region at PN70, strong signal was seen in the osteoblasts and osteocytes. Within the tooth root, strong signal was seen in the cementoblasts of the cellular cementum. No signal was evident in the acellular cementum lining the coronal two-thirds of the root (Fig. 1K–1L).
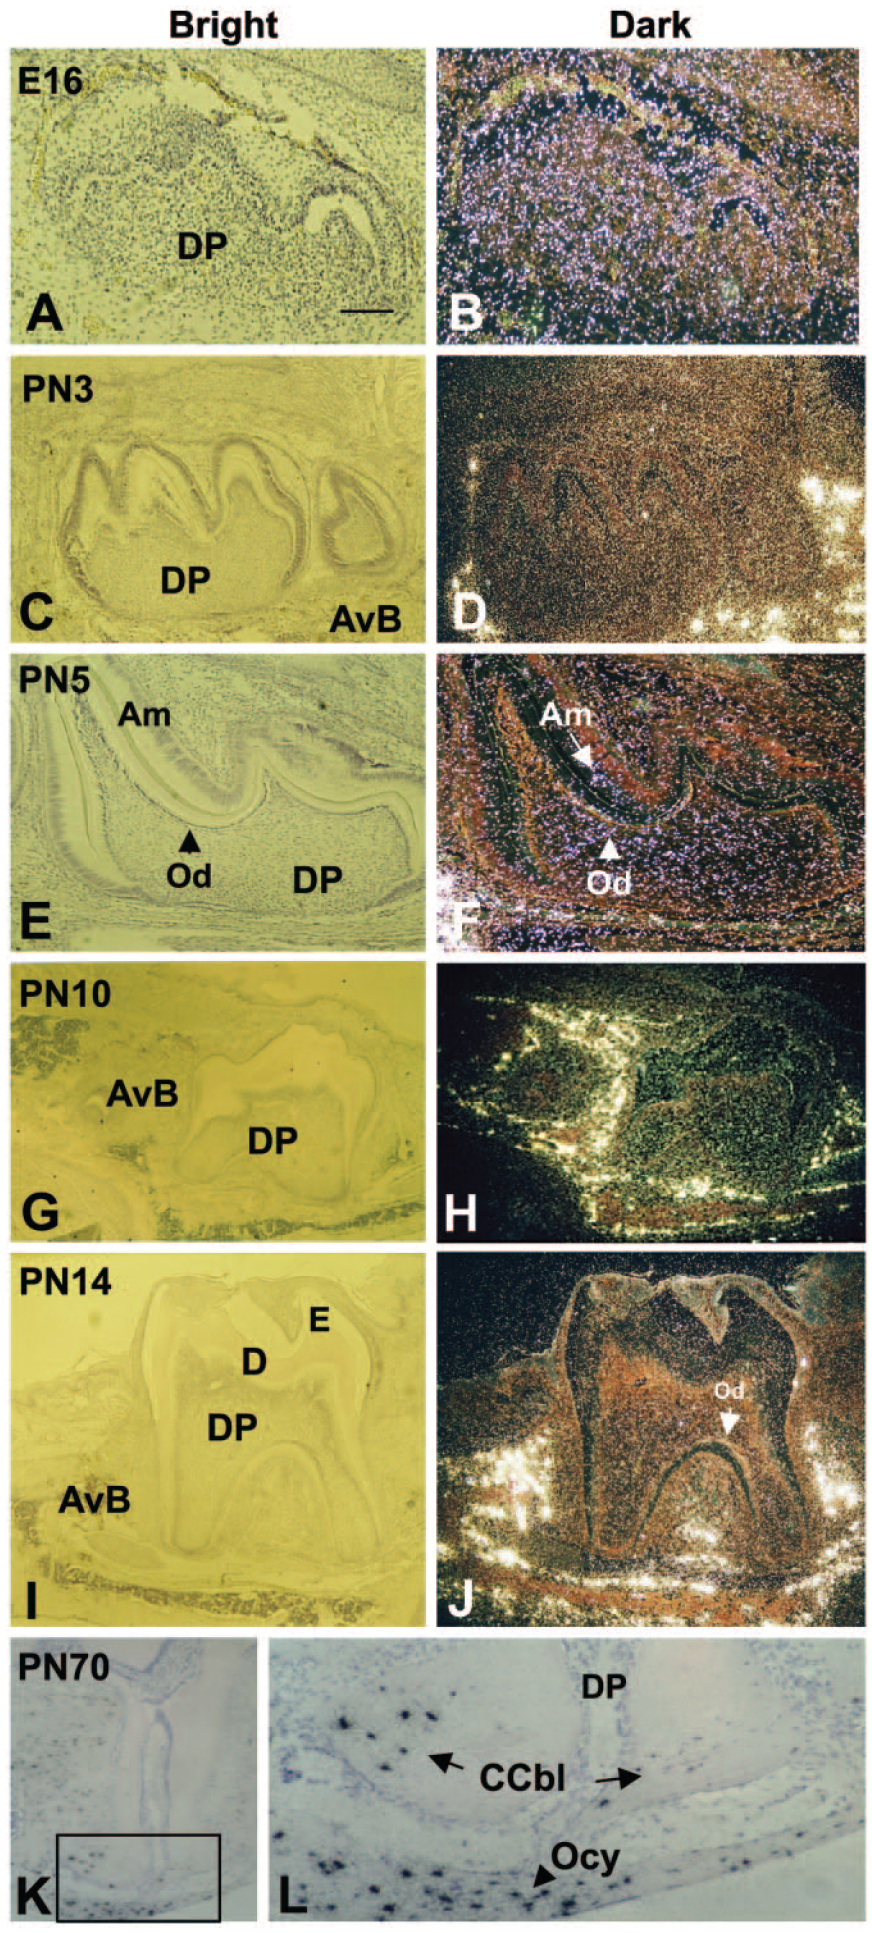
In situ hybridization of Mepe expression in molar crown and root development. Panels A, C, E, G, I, K and L are shown in bright-field microscopy, and panels B, D, F, H and J in dark field. (B) Late cap/early bell stage sections showing the general expression of Mepe within the tooth; (D) Intense Mepe expression in the forming alveolar bone surrounding the molar; (F) Generalized Mepe expression at 5PN in the dental pulp, with more intense signal in the odontoblast layer (arrowhead). The generalized expression pattern in the tooth continues through to root formation (G–J), with intense foci of Mepe expression in the alveolar bone. At the root apex (K–L), strong Mepe expression is seen in the cellular cementoblasts (arrows) on the dentin matrix surface and within osteocytes (arrowhead) also embedded in the bone (K and L). CCbl: cellular cementoblasts; Am: ameloblast layer, AvB: alveolar bone, D: dentin; DP: dental pulp mesenchyme; E: enamel, Od: odontoblast layer; and Ocy: osteocytes. Scale (A), 200 μm.
Immunohistochemistry in Developing Mouse Craniofacial Tissues
Immunohistochemistry was performed to characterize the spatial expression pattern of MEPE during the development of the craniofacial mineralized tissues, including tooth, bone, and cartilage. The expression pattern of MEPE was investigated during early post-natal mouse development to allow investigation of cell differentiation, extracellular matrix (ECM) deposition and biomineralization during odontogenesis, osteogenesis, and chondrogenesis. The alveolar bone surrounding the forming teeth and craniofacial bones served as a positive control for IHC studies, as bone is known to express MEPE. The expression of MEPE by cells involved in the synthesis of mineralized matrices of tooth, bone, and cartilage was shown to differ in both developmental and spatial patterns.
In the tooth, the expression of MEPE was continuously observed from day 1 through to day 3 of postnatal development within the predentin layer, whereas enamel was only slightly stained above background (Fig. 2A–2B; 2E–2J). Similar MEPE cellular and ECM distribution patterns were seen in both molar (Fig. 2A) and incisor (Fig. 2E) teeth. MEPE localization in incisor teeth showed an inverse gradient, with increasing MEPE protein found towards the mineralization front within the dentin. MEPE protein was generally concentrated within the predentin layer, becoming biphasic with stronger signals detected adjacent to the odontoblasts and distally at the dentin mineralization front (Fig. 2F–2G). Furthermore, whereas polarized odontoblasts were positive, the enamel-free area at the cusp tips of the molar teeth was not immunopositive for MEPE (Fig. 2B). MEPE labeling appears in differentiated osteoblasts (Fig. 2A; inset B). IHC for MEPE showed an intense reaction within the dentin (Fig. 2A) and the surrounding alveolar bone. Similar to its expression pattern in the molar teeth, MEPE was detected in incisor teeth (Fig. 2E), in both mesenchymal and epithelial cells. Within the dentin, labeling became biphasic, with strong staining close to the odontoblast cell body as well as distally at the dentin mineralization front (Fig. 2F). The immunoreaction was generally concentrated within the predentin layer (Fig. 2G). Young odontoblasts, as well as the later, mature odontoblasts facing dentin showed strong expression for MEPE (Fig. 2F inset; 2G: arrowhead). Intense staining was also detected in the alveolar bone, formerly the dental follicle (Fig. 2H). Contrary to odontoblasts, young presecretory ameloblasts were immunopositive (Fig. 2I), whereas mature ameloblasts failed to show positive staining (Fig. 2J).
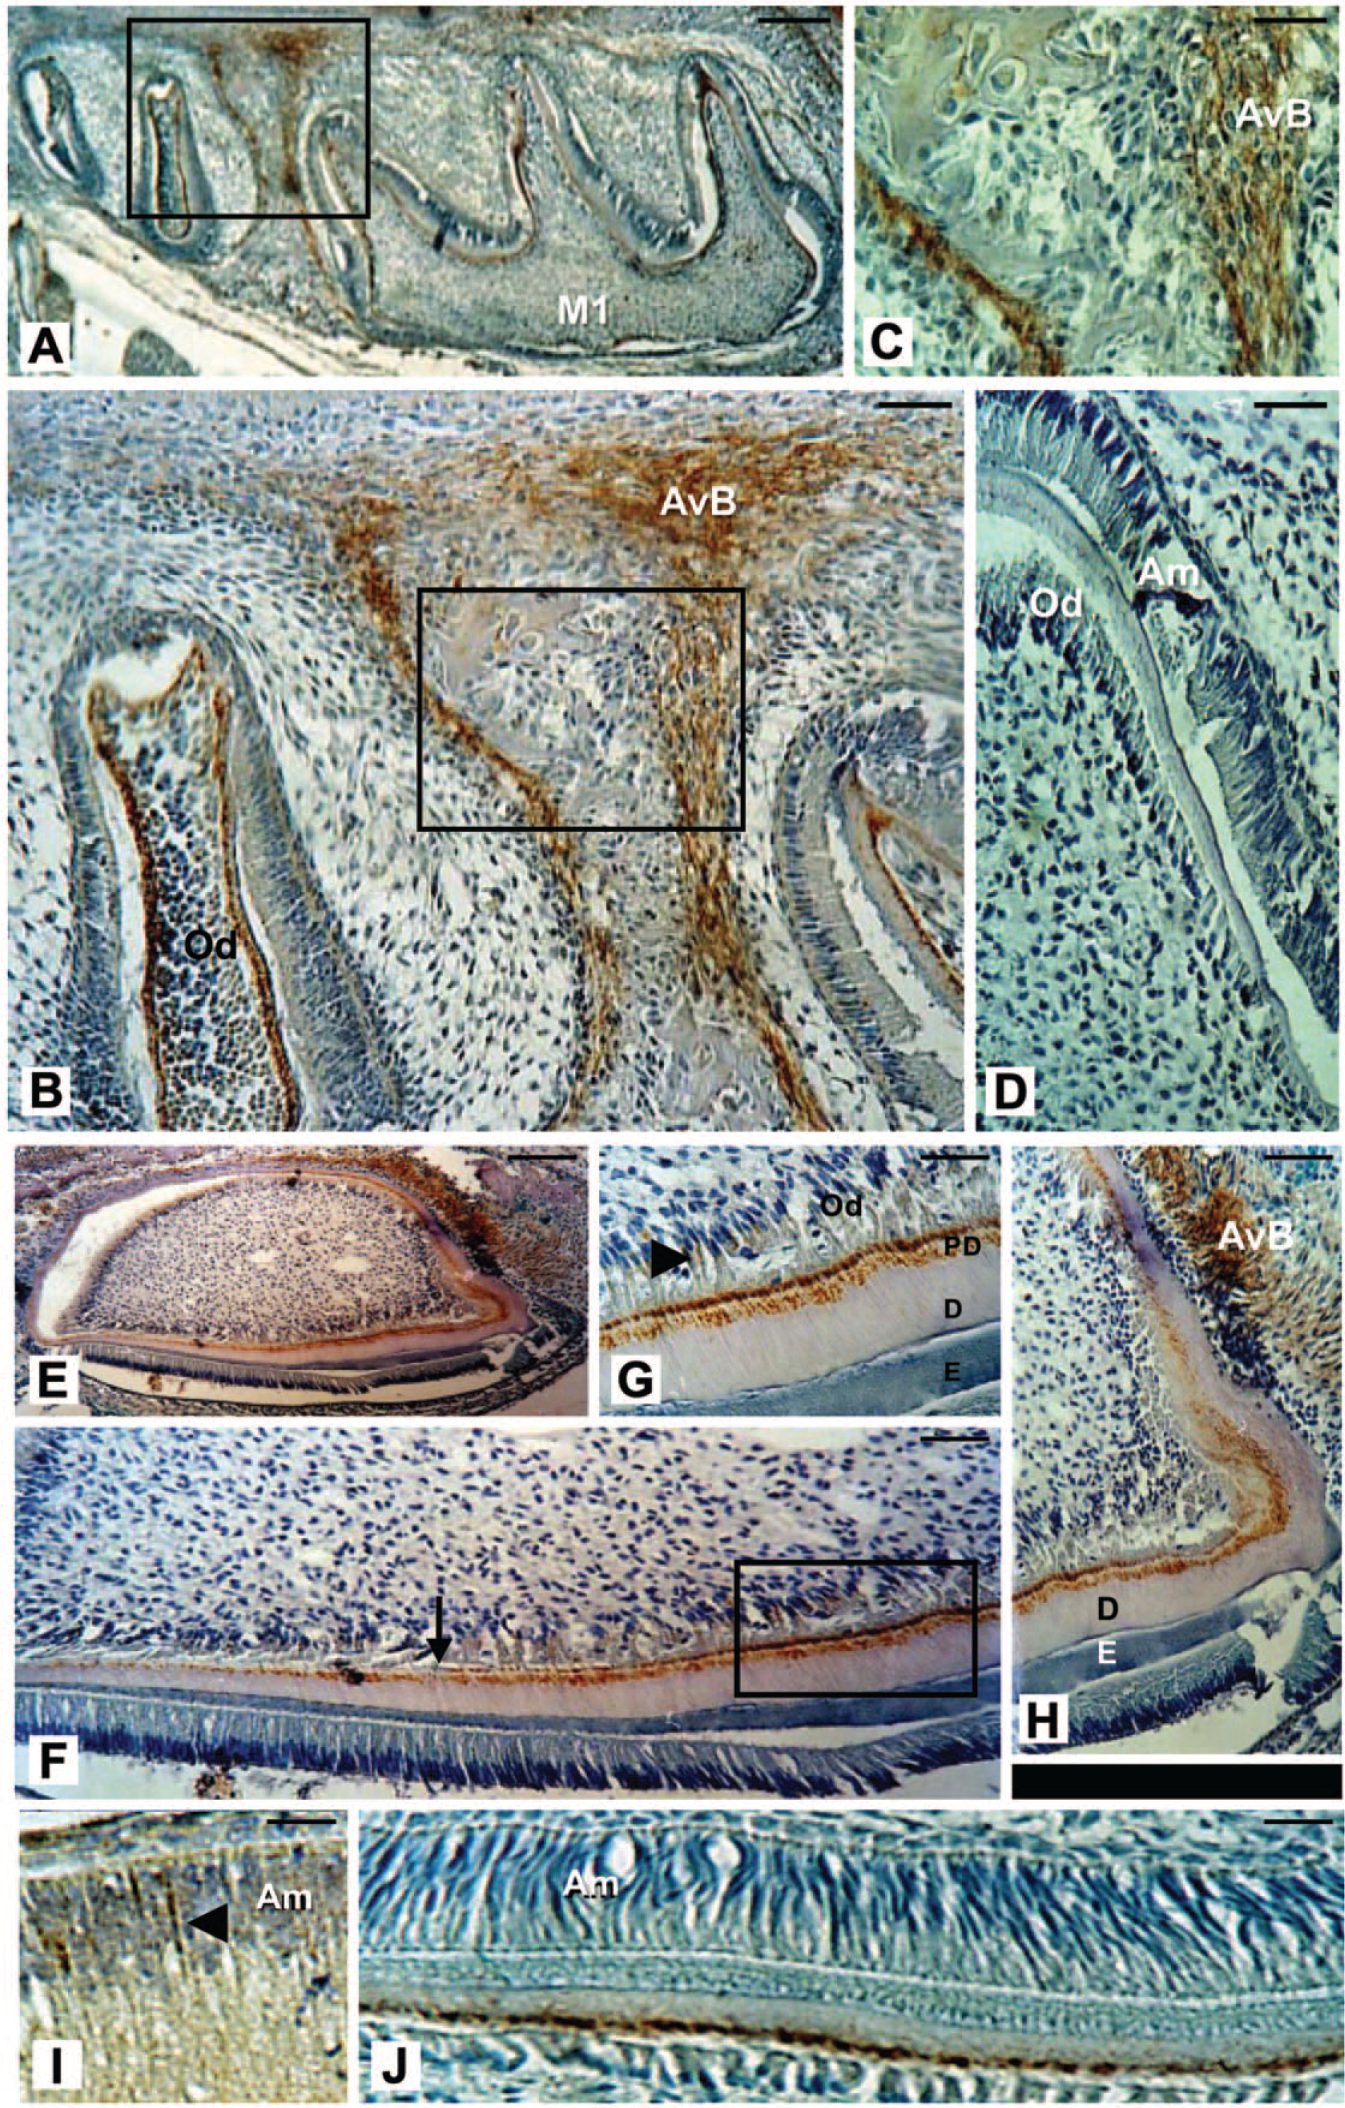
Immunohistochemical analyses of MEPE in 3PN mouse dental tissues and alveolar bone of undecalcified mandibular sections. (A–C) MEPE labeling appears in bone-forming cells, which are morphologically undifferentiated, as well as in differentiated osteoblasts. Labeling for MEPE is also seen in the dentin (A–B) and in polarized odontoblast cells (B); but there is a lack of immunolabeling for MEPE is observed in the enamel-free area of the molar. (C) and (B) are enlargements of the areas boxed in (B) and (A), respectively. (D) Immunocontrol on a serial section. MEPE immunostaining in a mouse mandibular incisor. Similar to its expression pattern in molars, MEPE protein was detected in incisor teeth (E), in both the mesenchymal and epithelial cells. The immunoreaction was generally concentrated within the predentin layer, whereas mineralized dentin stained only slightly. (F) Biphasic labeling within the forming dentin matrix (arrow), with intense staining seen close to the odontoblast cell body and distally closer to the dentin mineralization front. (G) Young odontoblasts as well as later stages of the odontoblast lineage are positive (arrowhead). (G) is an enlargement of the area boxed in (F). (H) Intense staining in the alveolar bone. (I–J) Within the incisor, presecretory ameloblasts are immunopositive (I) whereas no signal is detected in the mature ameloblasts (J). Abbreviations: AvB: alveolar bone; Am: ameloblasts; D: dentin; E: enamel; Od: odontoblasts; and PD: predentin. Scale, 200 μm.
MEPE was detected in the mandibular alveolar bone surrounding forming teeth during early postnatal development (PN3, Fig. 2A). MEPE was present in early committed bone cells lining the bone surface (Fig. 2A–C, 3A). Similarly, differentiated osteoblasts (Fig. 3A, 3C) and osteocytes (Fig. 3D), as well as the surrounding mineralized bone matrix (Fig. 3B), contained significant amounts of MEPE, as seen in serial cross-sections. Similar to MEPE expression in bone, the cartilage matrix appeared heavily stained during early cartilage formation as compared with its expression in the mature matrix (Fig. 3E–3I). In contrast, at the same stage, the hypertrophic chondrocytes were only sporadically immunopositive for MEPE (Fig. 3E–3F). During later development of the facial cartilage, the highest level of MEPE expression remained localized to the matrix, whereas chondrocytes are completely immunonegative. Immunochemistry controls using pre-immune or non-specific IgGs appeared negative in all tissues investigated, including tooth (Fig. 2D, 4C), mesenchymal undifferentiated osteoprogenitor cells, osteoblasts, osteocytes and in developing bone ECM (Fig. 2D). Negative controls on serial samples, in regions where the MEPE immunolabeling in cartilage was significant (matrix and cells), were devoid of any detectable labeling (Fig. 3I).
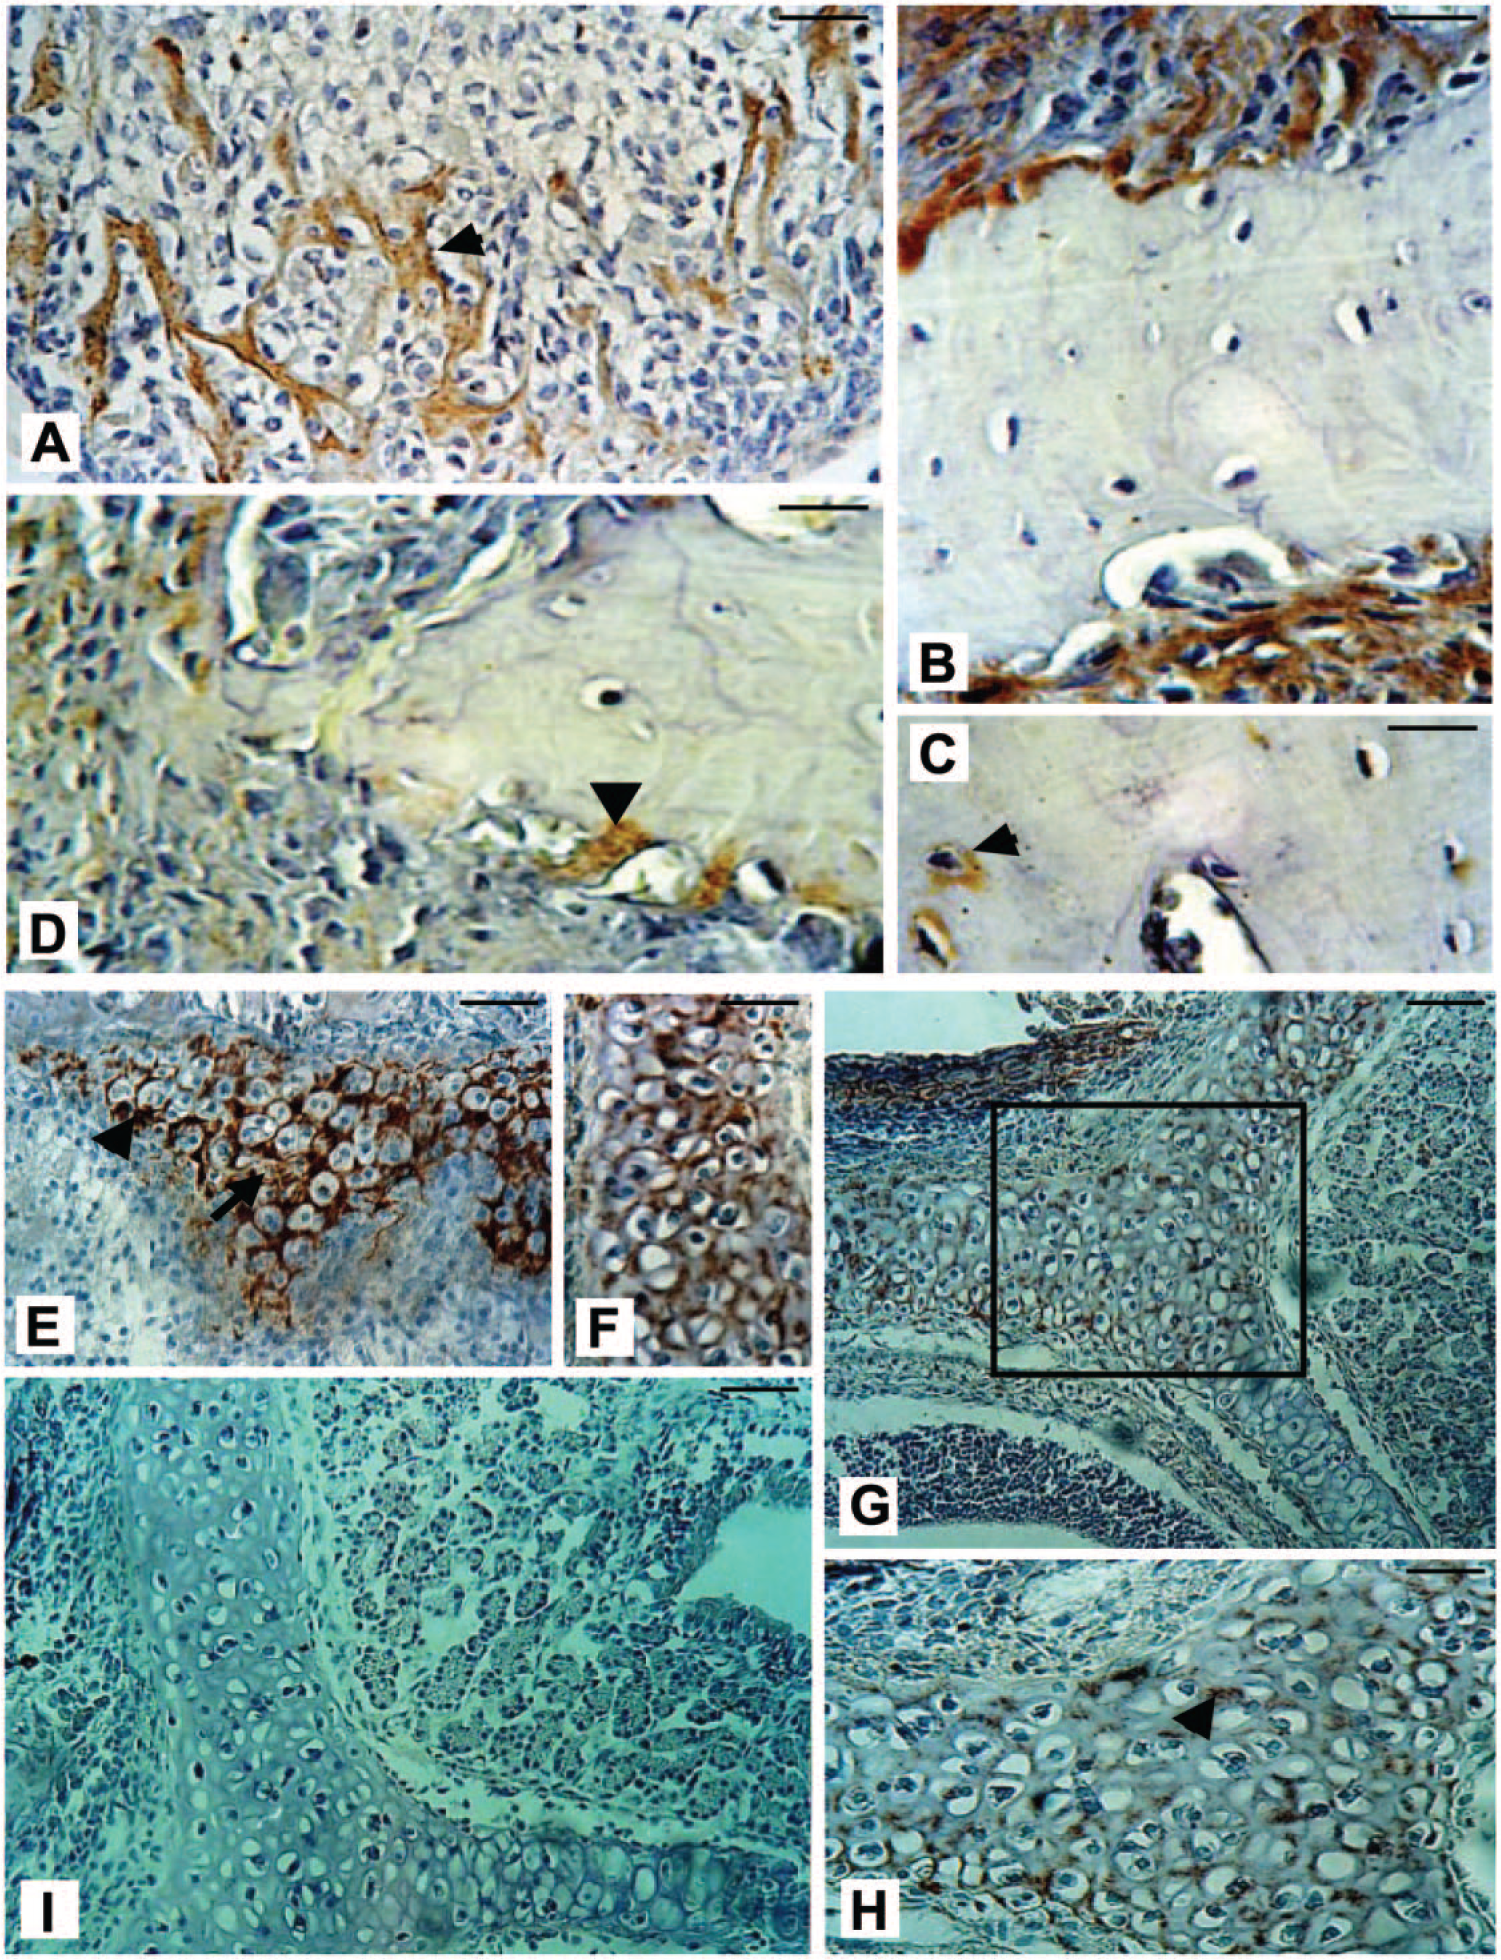
Immunolabeled bone cells and matrix in undecalcified sections of mouse calvarial bone. (A) Bone matrix appears to contain a high level of MEPE (arrowhead, pointing to matrix spiculi), with staining also present in the osteoblast cytoplasm. (B) Immunopositive signals detected inside the osteon. (C–D) Intense labeling in osteoblasts lining the bone (C) as well as in some osteocytes (D). (E–I) Immunohistochemistry with the MEPE antibody in mouse craniofacial cartilage. During early cartilage formation, the matrix is heavily stained (E, arrowhead), whereas hypertrophic chondrocytes have modest levels of MEPE (arrow). During further development of facial cartilage (G–H), the highest level of MEPE remains localized in the matrix (arrowhead), whereas chondrocytes appear completely immunonegative (H). H is a magnification of the boxed region in G. (I) Negative control of cartilage on a serial section showed no detectable staining. Scale, 200 μm.
Radiographic and Micro-CT Analysis of Mepe-/- Mouse Cranium and Molars
Radiographic analysis of PN3 WT and Mepe-/- mouse craniums revealed that the Mepe-/- mouse heads are smaller in size and less mineralized (Fig. 4A–4B). Furthermore, whereas incisors of Mepe-/- mice are grossly visible, they appear truncated on radiographs, possibly due to tooth density not detected at the radiographic parameters utilized. The absence of the protein in Mepe-/- teeth was tested by IHC using the polyclonal peptide MEPE antibody. No detectable staining for MEPE was detected in any of the tissues, including those of the developing tooth in null mice (see Fig. 6C). In micro-CT analysis of molars from PN3 WT and Mepe-/- mice, sagittal cross-sections through the middle of the tooth indicated a greater thickness of dentin and enamel in Mepe-/- specimens (Fig. 4C–4D). Three-dimensional (3D) reconstructions of first molars were generated using the entire sequence of 2D cross-sections of Mepe-/- mouse molars (Fig. 4E–4F). Interestingly, densitometric analysis of 3D reconstructions demonstrated that Mepe-/- mouse molars have not only very similar mean density of dentin and enamel as compared with that of WT, but also comparable ratios of dentin and enamel volume as a proportion of the total volume, which consists of the predentin, dentin, and enamel layers.
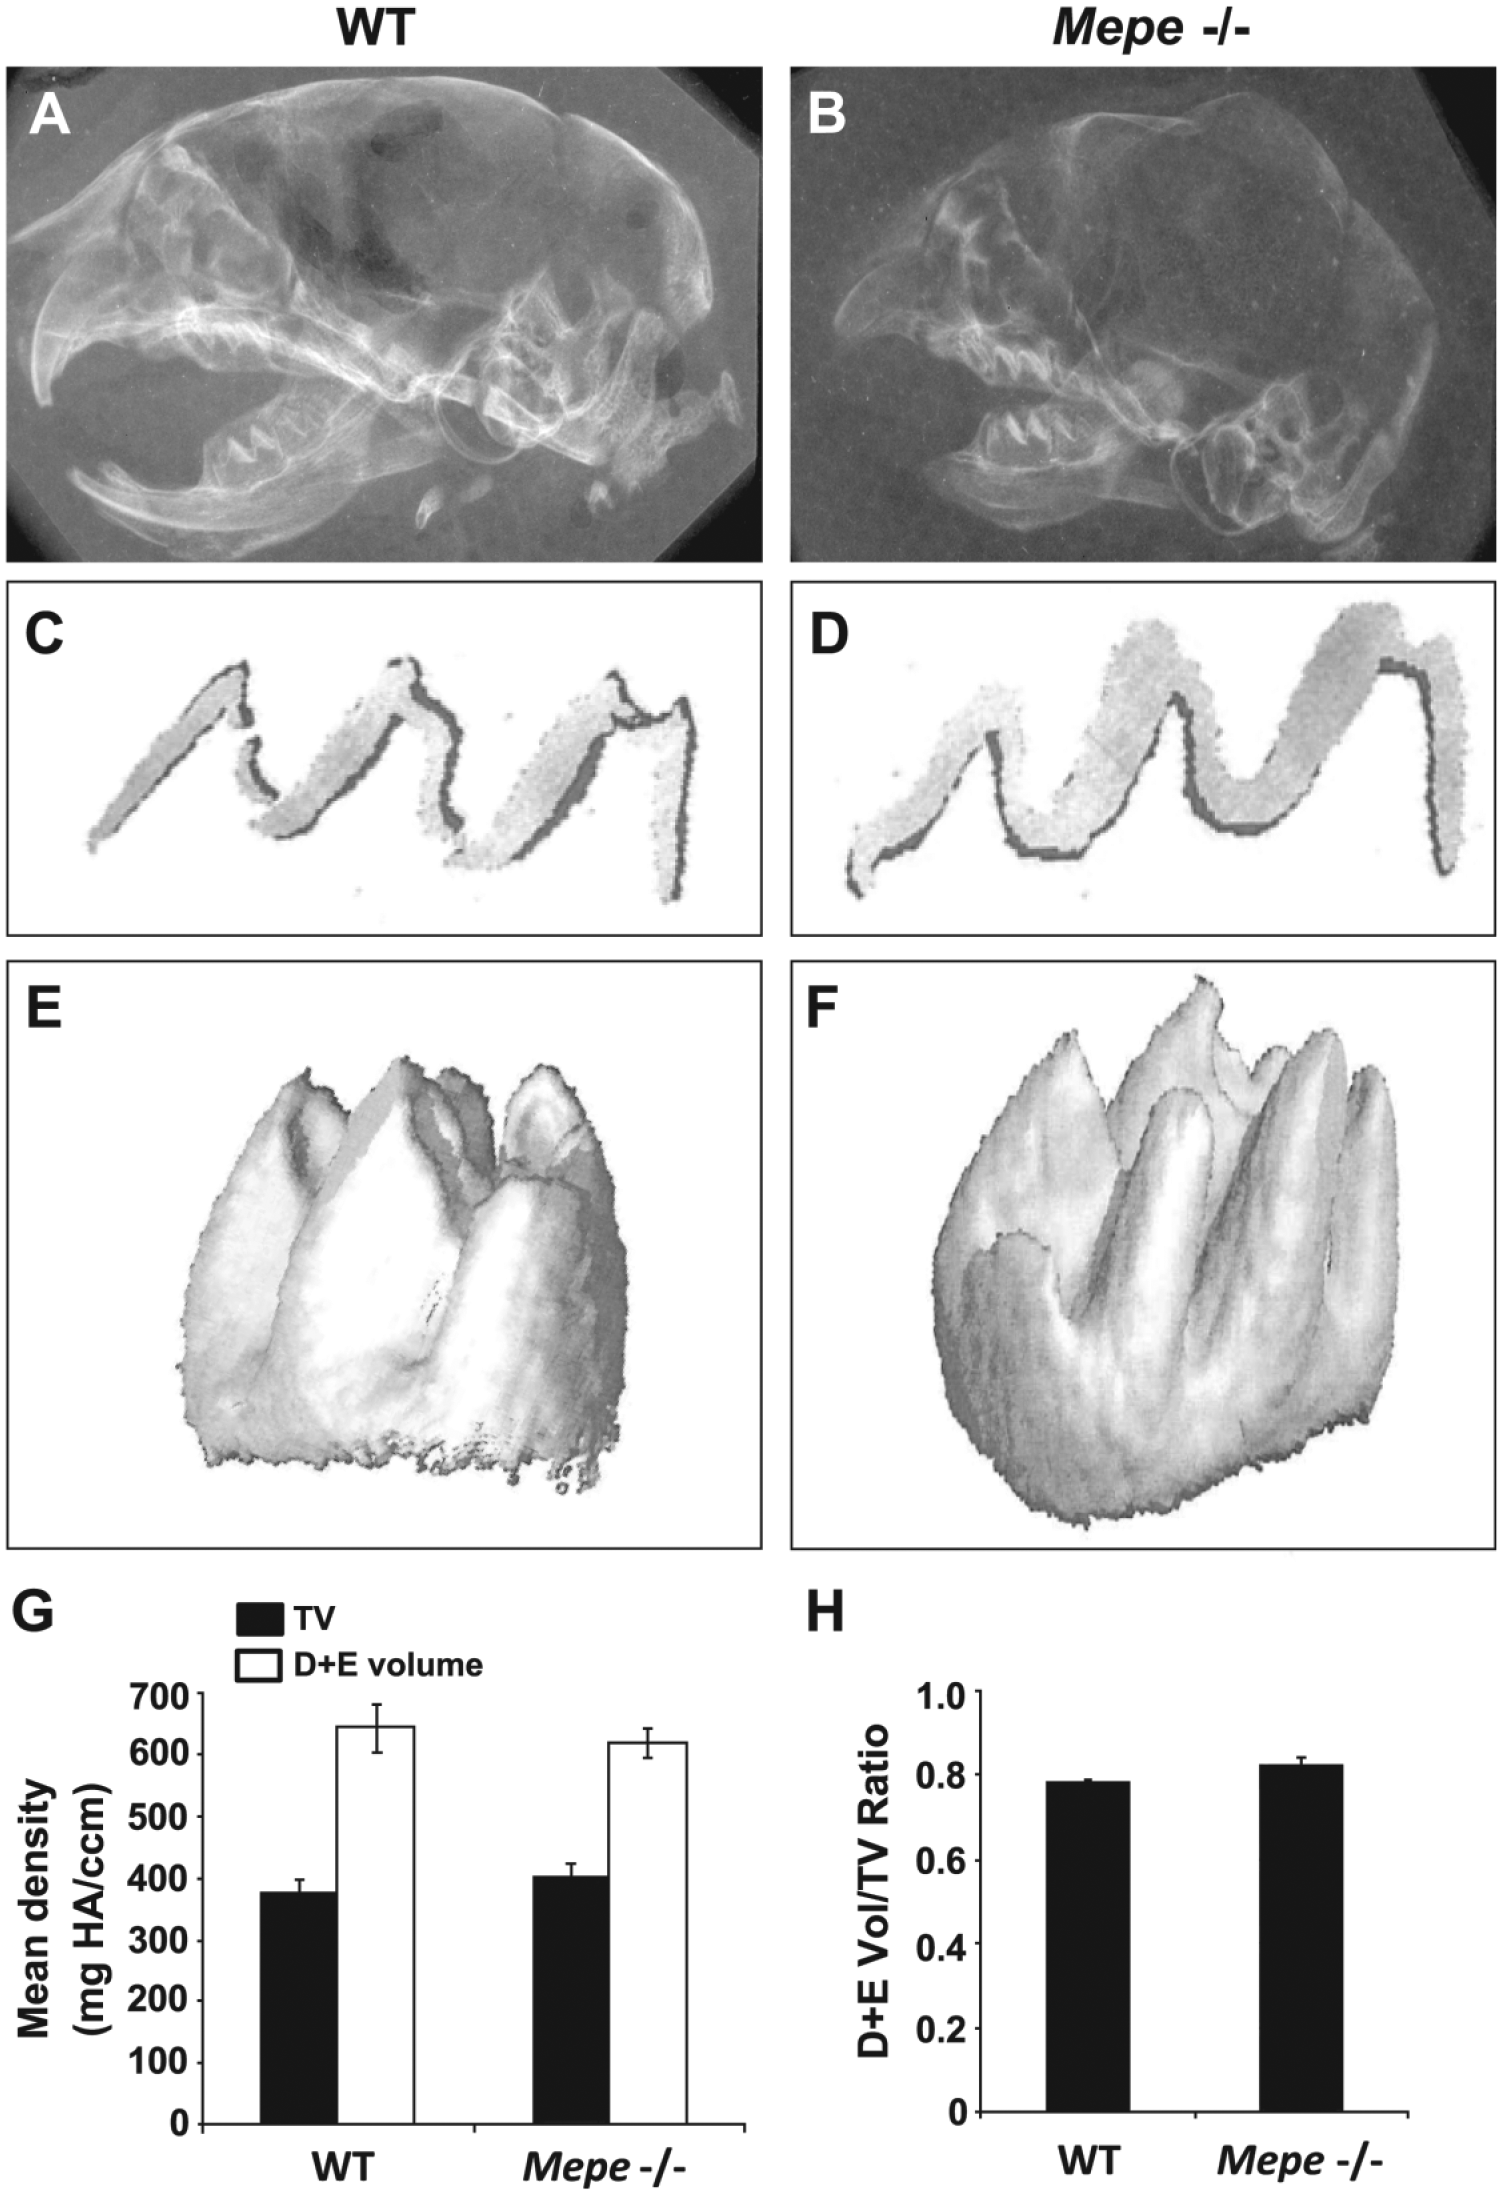
Radiographic analysis of day 3PN WT and Mepe-/- cranial halves. (A–B) Mepe-/- specimen bone appears to be overall less mineralized as compared with that of WT. (C–D) Cross-sectional micro-CT analysis of day 3PN WT and Mepe-/- first molars showing pre-dentin, dentin, and enamel layers. (E–F) 3D reconstructions of 2D micro-CT images of day 3PN WT and Mepe-/- first molars. (G) Mean density of dentin and enamel (D+E) volume and total volume (TV) of day 3PN Mepe-/- first molars as compared to WT (n=3). TV refers to the predentin, dentin, and enamel layers depicted as seen in panels C and D. (H) Comparable ratios of dentin and enamel volume/total volume in Mepe-/- and WT specimens. The data presented as representative of three sets of specimens.
Histological Analysis of Mepe-/- Mouse Molars
Histological analysis of 3PN Mepe-/- first molars was performed in order to measure the thickness of the enamel, dentin (black layer), and predentin (black arrowhead) layers (Fig. 5A). These measurements were performed at the mesial and distal cusps (red arrows) to represent the greatest extent of tooth mineralization, as well as at the mesial and distal cervical regions (red arrowheads) of the crown to represent the least tooth mineralization. Low and high magnification (Fig. 5B and 5C, respectively) of 3PN Mepe-/- first molar shows hypermineralization of the enamel, as suggested by shearing of the enamel due to sectioning. The predentin, dentin, and enamel all demonstrated increased thickness at cervical (Fig. 5D) and cuspal (Fig. 5E) aspects of the molars in Mepe-/- specimens. The greatest percentage increase in thickness (>600%) occurred in enamel of both cervical (Fig. 5F) and cuspal (Fig. 5G) aspects of Mepe-/- specimens. Conversely, the lowest percentage increase in thickness was found for the predentin region at the cuspal aspect of the Mepe-/- mouse molar (Fig. 5G).
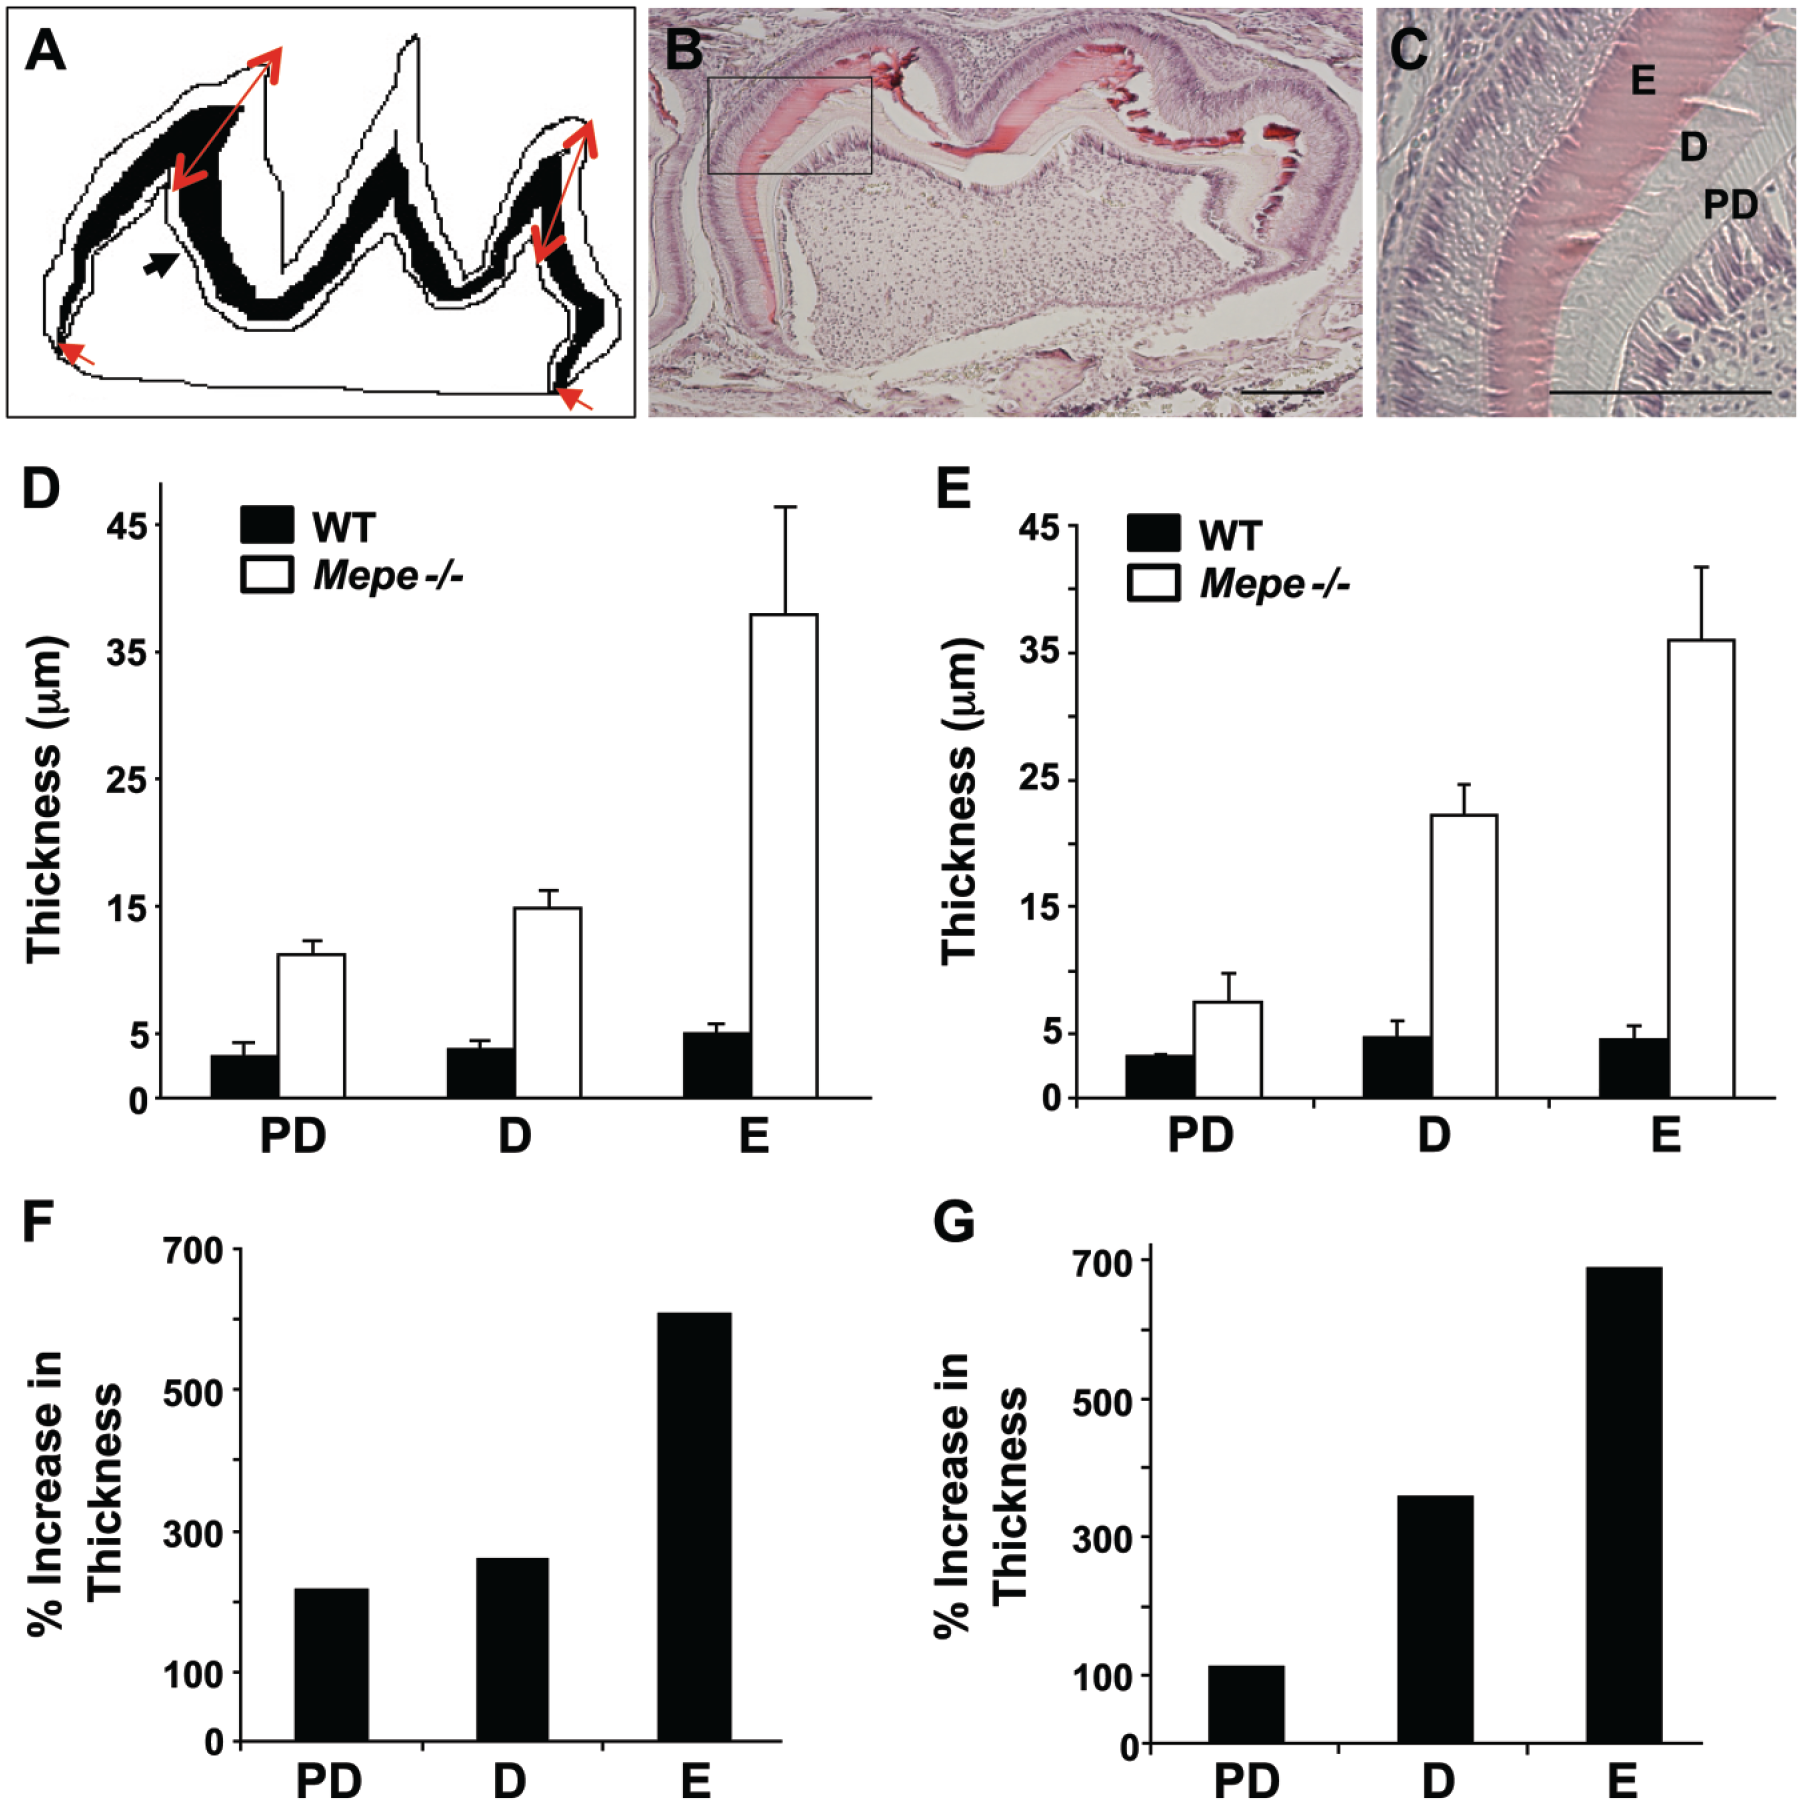
Histological analysis of day 3PN Mepe-/- first molars. (A) Diagram showing regions where the measurements were obtained for enamel, dentin (black layer), and predentin (black arrowhead) at two cusps (red arrows) and mesial and distal cervical regions (red arrowheads) of mineralized tooth structure. Low (B) and high (C) magnification of 3PN Mepe-/- first molar showing hypermineralization with expansion of dentin layer concurrent with increased predentin thickness. Increased thickness of predentin, dentin, and enamel at cervical (D) and cuspal (E) aspects of molars in Mepe-/- specimens. Percentage increase in thickness at cervical (F) and cuspal (G) aspects of Mepe-/- specimens as compared with that of WT. Abbreviations: D: dentin; E: enamel; and PD: predentin. Scale, 200 μm.
Expression of Odontoblast and Ameloblast Markers in Mepe-/- Mice
qRT-PCR using cDNA obtained from 3PN WT and Mepe-/- mouse molars was performed to compare the expression of odontoblast and ameloblast marker genes (Fig. 6A). Ameloblast markers Ambn and Enam, major structural proteins of enamel matrix, exhibited no change and a 30% decrease, respectively. The levels of SIBLING genes Ibsp and Dmp1 were approximately 50% that of WT levels, whereas Dspp and Spp1 levels were decreased by 20% in Mepe-/- specimens as compared with the control. These findings suggest a general down-regulation of mineralization-associated transcripts correlating with the increased hypermineralization for the ECM.
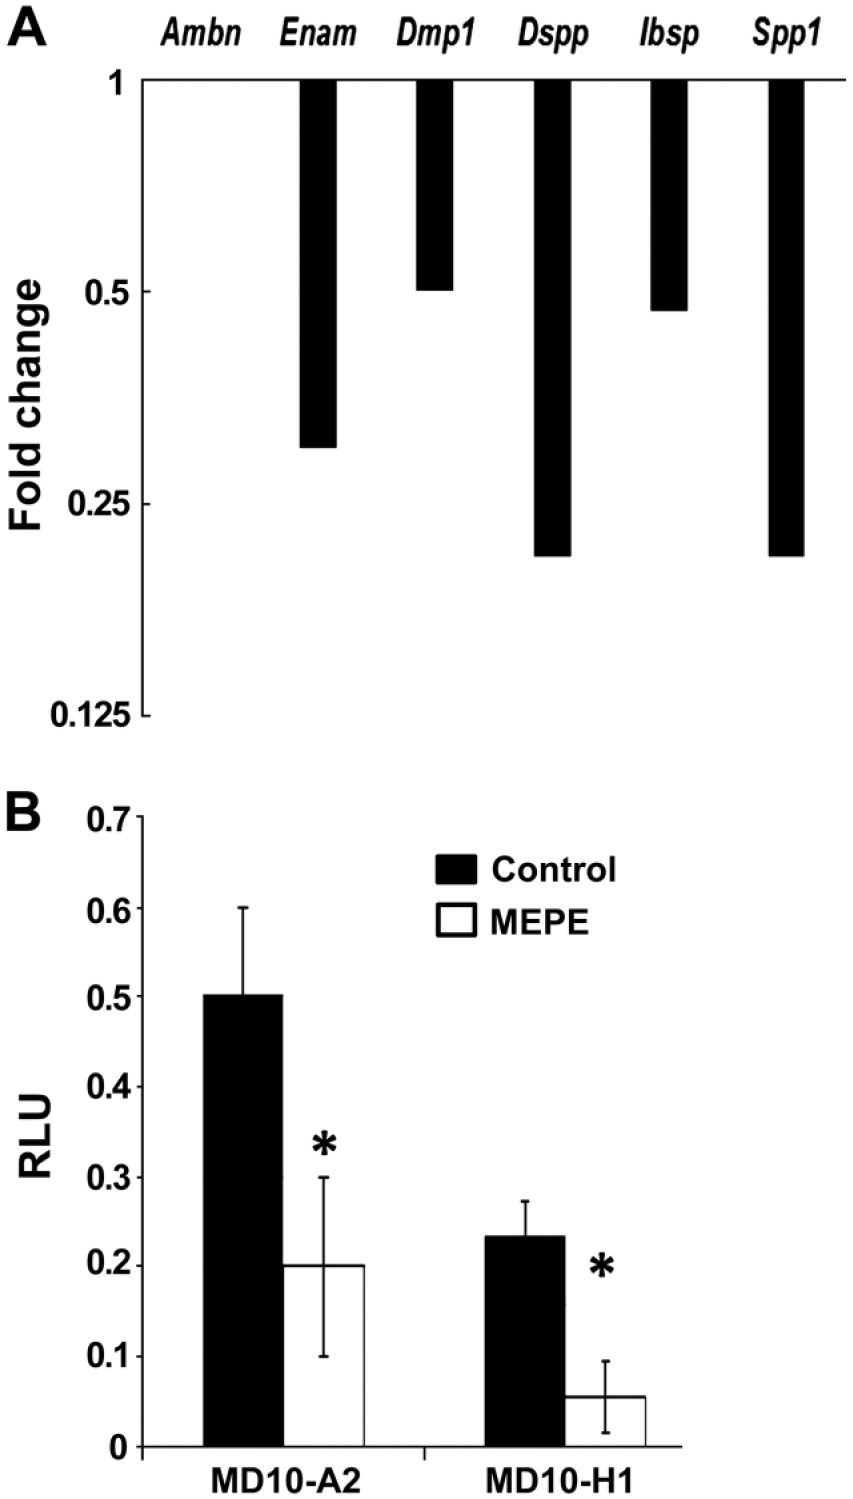
(A) qRT-PCR analysis of the fold change in gene expression in Mepe-/- mouse whole tooth cDNA as compared with that of WT mandibular first molars from 3PN mice. Ameloblast marker genes Ambn and Enam showed no change and 30% decrease, respectively. Levels of SIBLING genes Ibsp and Dmp1 were approximately 50% of WT levels; Dspp and Spp1 levels were decreased by 20% in Mepe-/- specimens as compared with the control. (B) Influence of Mepe over-expression on Dspp gene expression in MD10-A2 mouse odontoblast-like cells and MD10-H1 mouse dental pulp cells. Cells were transiently transfected for 48 hr, after which Luc/Renilla activity was quantified. Luciferase activity of Dspp 2.6-kb promoter construct co-transfected with an empty vector or Mepe expression construct. Activity was normalized using Renilla luciferase values. RLU = relative luciferase units; *p≤ 0.005.
In vitro Regulation of MEPE on Dspp Expression
Promoter studies were performed to analyze the effect of Mepe over-expression on Dspp expression in MD10-A2 mouse odontoblast-like cells and in MD10-H1 mouse dental pulp cells. We observed a significant reduction in Dspp levels after 48-hr transient transfection of Mepe in both cell lines.
Discussion
The data presented shows the broader expression pattern of MEPE in craniofacial tissues and the first documentation of a Mepe-/- mouse dental phenotype. We confirm that Mepe mRNA is expressed in the developing tooth germ and that its expression is primarily localized in the differentiated odontoblasts and surrounding alveolar bone, with transient expression in the pre-ameloblasts. Our studies expand upon the studies of Hou and colleagues (2012) showing the presence of MEPE regionally in mature ameloblasts. Our results indicate that the C-terminal region encompassing the MEPE ASARM (acidic serine-aspartate rich motif) (Rowe et al. 2000) is an early marker related to the non-mineralized phase of matrix formation. The reduction in staining as ameloblasts undergo cytodifferentiation suggests that the ASARM peptide of MEPE may function to prevent enamel mineralization until establishment of the initial enamel extracellular matrix (Rowe et al. 2004; Addison et al. 2008; Atkins et al. 2011). Later, as the enamel proteins are removed from the matrix through the ameloblasts, MEPE may inhibit mineralization of the enamel polypeptide fragments. MEPE has been shown to be expressed in vivo by osteoblasts and osteocytes within trabecular and cortical bone, and its expression is increased during in vitro osteoblast-mediated matrix mineralization (Petersen et al. 2000; Argiro et al. 2001). Studies have demonstrated that, depending on the peptide processing of MEPE, this protein can function as either an inhibitor or stimulator of mineralization. However, MEPE is mostly thought to behave as an inhibitor of mineralization, being down-regulated during osteoblast differentiation (Siggelkow et al. 2004). The differences in Mepe mRNA and MEPE protein expression patterns in tooth are probably due to proteolytic processing and an accumulation of the protein. Also, they likely indicate a distinct, functional role for MEPE and/or processed peptides, including the C-terminal ASARM-motif/epitope, in mineralized tissue homeostasis.
MEPE has been extensively studied in the context of endochondral ossification, rather than intramembranous ossification. We show MEPE expression in calvarial tissue, expressed by both bone-lining osteoblasts and embedded osteocytes. The most intense staining occurs within the osteoblast-secreted matrix, indicating that MEPE has a supporting role during the mineralization of calvarial osteoid.
MEPE expression in the hypertrophic zone of craniofacial cartilage was in concordance with recent studies that have shown Mepe mRNA and MEPE protein localization in the growth plates of proximal tibiae in 3- to 4-week-old mice (Staines et al. 2012). As the transition is made from the hypertrophic zone to the calcifying zone, MEPE expression was shown to be reduced, implying the importance of post-translational modifications, specifically the cleavage of MEPE to the ASARM peptide and its subsequent phosphorylation to inhibit mineralization (Addison et al. 2008; Boskey et al. 2010).
Bone and dentin share molecular components and developmental aspects; therefore, because Mepe null mice have a bone phenotype, an investigation of a potential tooth phenotype is warranted. Mepe-/- mice present with increased bone formation due to increased osteoblast activity (Gowen et al. 2003), whereas overexpression of MEPE causes a decrease in bone density and osteoclast number, as well as a reduction in calvarial mineralization as compared with WT mice (David et al. 2009). By measuring predentin, dentin, and enamel from histological sections of PN3 Mepe-/- molars, it was evident that all three layers are at least 100% thicker than those in the WT control sections. Because the densitometry of whole Mepe-/- molar crowns was performed using 3D reconstructions of micro-computed tomography scans, it was likely that the increased tissue thickness and density was cancelled out and any differences minimized because the entire crown was proportionally greater in volume and density as compared with the WT samples. The enlarged crowns may be due to larger pulp chambers in Mepe-/- molars as compared to that in the control. Via histological analysis, the individual matrix layers were distinguishable and quantified. Increased thickness of mineralized tissue in the Mepe-/- molar teeth implies augmented odontoblast activity, with aberrant conversion of the predentin to dentin. Altered SIBLING protein profiles in the null mice may be regulating the ameloblasts and resulting in the increased enamel thickness. Furthermore, these data reveal that the highly regulated mechanisms controlling predentin and immature enamel layers were not functional.
Closer examination of skull radiographs from PN3 Mepe-/- mice revealed that cranial bones were less mineralized than their WT counterparts. While this observation is contradictory to previous studies demonstrating increased bone density in 4-month- and 1-year-old Mepe-/- mouse femurs (Gowen et al. 2003), it should be noted that, although the femur ossifies through endochondral ossification, the calvaria undergoes intramembranous ossification. Perhaps the absence of a cartilaginous template, particularly the absence of hypertrophic chondrocytes that normally express MEPE, confers a contrasting biochemical environment for intramembranous bone formation in the Mepe-/- cranium. Additionally, investigation of osteoclast activity in Mepe-/- mice might offer greater insight into these events.
Several signaling mechanisms active during tooth development ensure appropriate mineralized tissue formation. We have shown that mouse molars with ablated Mepe exhibited reduced levels of other SIBLING transcripts as well as decreased levels of Enam, suggesting dysregulation of critical dentin and enamel matrix proteins that are essential for normal mineralization. These findings support previous in vitro studies where the overexpression of MEPE in dental pulp cells caused increased levels of odontoblast markers BSP, DSP (DSPP), and collagen type I and Enam (Wei et al. 2012). Interestingly, Enam is a member of the SCPPs, which are rich in Pro and Gln (P/Q) and associated with enamel mineralization, located on 4q21 adjacent to the SIBLING gene cluster (Kawasaki 2011). MEPE potentially plays a key role in mediating tooth matrix formation and mineralization including that of both dentin and enamel.
Our in vivo studies suggest that Dspp, a marker of odontoblasts and a critical protein for dentin mineralization, and other SIBLING genes may be partially dependent on Mepe expression levels. Previous in vitro studies have revealed that DSPP levels were significantly up-regulated with recombinant MEPE treatment during osteogenic differentiation of human primary dental pulp cells (hDPCs) (Wei et al. 2007). Furthermore, adenoviral vector overexpression of MEPE in hDPCs induced odontogenic differentiation, which led to an increase in DSPP. However, it should be noted that, with excess MEPE, a critical threshold is reached, which causes a dampening of DSPP expression in the long term (post 14 days of culture). In this study, when Mepe is completely eliminated from the mouse tooth, Dspp expression is reduced by 20%.
In conclusion, the present study illustrates MEPE distribution during the development of the mineralized tissues of the craniofacial complex, namely bone, cartilage, and teeth. These expression profiles will serve as a reference for future studies that assess the individual functions of MEPE cleavage peptides in the formation and mineralization of ECMs. Additionally, we present the dental findings of the Mepe-/- mouse, which exhibited increases in the thicknesses of tooth matrix layers and a decreased expression of SIBLING transcripts. Although we were able to demonstrate the potential Mepe regulation of tooth matrix formation and mineralization, it still remains unclear whether this is via direct or indirect signaling events. Importantly, the data we have shown provide novel insight into the types of molecular associations that MEPE may be regulating in pathological mineralization states of excess MEPE, such as in X-linked hypophosphatemia (Salmon et al. 2013) and deficient MEPE as seen in hypophosphatasia (Rodrigues et al. 2012).
Footnotes
Acknowledgements
The authors of this project received the following funding related to this work: F30 DE021945 to AG, the UAB GC-CODED and the UAB SOD IOHR.
Author Contributions
AG performed experiments and analyzed the data related to the null mouse, performed immunohistochemistry (IHC) and wrote the initial paper draft, JGH performed the in situ hybridization, SP performed IHC on wildtype animals, PS prepared the histology and photographs, AU performed the promotor studies, SC managed the experiments and analyzed the molecular biology studies and MM designed and managed the entire study and edited the final version. All authors have read and approved the final manuscript.
Competing Interests
The authors declared no potential competing interests with respect to the research, authorship, and/or publication of this article.
Funding
The authors disclosed receipt of the following financial support for the research, authorship, and/or publication of this article: The authors of this project received the following funding: NIDCR F30 F30 DE021945 (AG), UAB School of Dentistry Institute of Oral Health Research (MM).
The authors of this project received the following funding related to this work: F30 DE021945 to AG, the UAB GC-CODED and the UAB SOD IOHR.