
Abstract
MicroRNA-21 (miR-21) is the most consistently over-expressed microRNA (miRNA) in malignant gliomas. We have previously reported that miR-21 is upregulated in glioma vessels and subsets of glioma cells. To better understand the role of miR-21 in glioma angiogenesis and to characterize miR-21-positive tumor cells, we systematically stained consecutive serial sections from ten astrocytomas for miR-21, hypoxia-inducible factor-1α (HIF-1α), vascular endothelial growth factor (VEGF), phosphatase and tensin homolog (PTEN), octamer-binding transcription factor 4 (Oct4), sex-determining region Y box 2 (Sox2) and CD133. We developed an image analysis-based co-localization approach allowing global alignment and quantitation of the individual markers, and measured the miR-21 in situ hybridization signal against the immunohistochemical staining of the six different markers. miR-21 significantly co-localized with the hypoxia- and angiogenesis-associated markers HIF-1α (p=0.0020) and VEGF (p=0.0096), whereas the putative miR-21 target, PTEN, was expressed independently of miR-21. Expression of stem cell markers Oct4, Sox2 and CD133 was not associated with miR-21. In six glioblastoma cultures, miR-21 did not correlate with the six markers. These findings suggest that miR-21 is linked to glioma angiogenesis, that miR-21 is unlikely to regulate PTEN, and that miR-21-positive tumor cells do not possess stem cell characteristics.
Introduction
Malignant astrocytomas are primary brain tumors with astrocyte-like morphology. Histopathological evaluation subdivides astrocytomas into World Health Organization (WHO) grades I–IV, where grade IV tumors, the glioblastomas, are the most frequent and most malignant (Louis 2007).
MicroRNAs (miRNAs) are short, single-stranded, non-coding RNAs involved in post-transcriptional regulation of numerous different target messenger RNAs (mRNAs). Accumulating evidence suggests miRNA involvement in the initiation and progression of a wide range of cancers (Lujambio and Lowe 2012). Certain miRNAs are commonly deregulated in malignant astrocytomas and therefore hold a noticeable role as potential biomarkers (Hermansen and Kristensen 2013). One miRNA in particular, microRNA-21 (miR-21), is consistently overexpressed in cancer and is referred to as an oncoMir, as it targets tumor suppressor gene transcripts related to angiogenesis, apoptosis, proliferation and invasion (Selcuklu et al. 2009; Hermansen and Kristensen 2013). Several studies have identified the tumor suppressor phosphatase and tensin homolog (PTEN) as a target of miR-21, and functional studies have confirmed that miR-21 can bind to the 3’-untranslated region (UTR) of the PTEN transcript (Meng et al. 2007; Zhang et al. 2010) and regulate the expression of PTEN in breast (Han et al. 2012), lung (Zhang et al. 2010), and hepatocellular cancer (Meng et al. 2007). A similar relationship has not been demonstrated in astrocytic tumors and cell cultures.
Solid tumors require angiogenesis for expansion, as the tumor will not grow without a supply of nutrition and oxygen, and glioblastomas have a very high degree of vascularization (Louis 2007). In our previous study of miR-21 expression in gliomas, we found that miR-21 often is highly expressed in tumor-associated vessels and in perinecrotic areas (Hermansen et al. 2013). Studies of astrocytoma angiogenesis have identified vascular endothelial growth factor (VEGF) as a key player in the angiogenesis process (Shweiki et al. 1992; Plate et al. 1994). Overexpressing miR-21 in cancer cell lines increases the expression of hypoxia-inducible factor 1α (HIF-1α) (Liu et al. 2011), which regulates VEGF expression through transcriptional activation (Forsythe et al. 1996). The proposed mechanism is that miR-21 targets PTEN and results in the activation of Akt and extracellular signal-regulated kinase 1/2 (ERK1/2), which then enhances HIF-1α and VEGF expressions (Liu et al. 2011). Thus, miR-21 may be an important regulator of (PTEN-directed) angiogenesis in astrocytomas upstream of HIF-1α.
In our previous study, we found that miR-21 is expressed in tumor cells in addition to tumor-associated vessels (Hermansen et al. 2013). Using quantitative image analysis, we found that the miR-21-positive tumor cells, rather than the vessels, gave an unfavorable prognostic value, suggesting a particular aggressive characteristic of miR-21-positive tumor cells. Studies of miR-21 expression in cancer stem cells (CSCs) (Bao et al. 2011; Bao et al. 2012; Han et al. 2012) have placed miR-21 in the early stages of tumor development, as CSCs have the ability to self-renew and generate the various cells comprising the tumor (Reya et al. 2001; Visvader 2011). Indeed, it has been reported that miR-21 may play an important role in CSCs of various tumor types (Bao et al. 2011; Bao et al. 2012; Han et al. 2012) but the results have been ambiguous concerning brain tumors (Fang et al. 2011; Ma et al. 2012; Põlajeva et al. 2012). Difficulties in the precise molecular characterization of CSCs using immunohistochemical (IHC) markers may contribute to the poor reproducibility and lack of consensus among published studies (Hermansen et al. 2011; Dahlrot et al. 2013) and this suggests that several markers should be applied for the identification of CSCs in situ. Commonly used markers for identifying putative CSCs in astrocytomas include octamer-binding transcription factor 4 (Oct4) (Du et al. 2009); sex-determining region Y box 2 (Sox2) (Ma et al. 2008; Phi et al. 2008; Wan et al. 2011) and CD133 (Ma et al. 2008; Christensen et al. 2008; Pallini et al. 2008; Zeppernick et al. 2008; Zhang et al. 2008a; Thon et al. 2010; Pallini et al. 2011).
To better understand the role of miR-21 in astrocytomas, we developed an image analysis-based co-localization approach. This approach allowed global alignment and quantitation of the individual molecular markers, and an assessment of the miR-21 in situ hybridization (ISH) signal against the IHC staining of VEGF, HIF-1α, PTEN, Oct4, Sox2 and CD133.
Materials & Methods
Patients
Expression data generated in a previous miR-21 ISH study performed on 193 gliomas (Hermansen et al. 2013) were used to select astrocytomas eligible for miR-21 co-localization studies. Formalin-fixed and paraffin-embedded (FFPE) tumor samples from the ten patients with the highest miR-21 expression levels were selected, resulting in inclusion of eight glioblastomas (WHO grade IV) and two anaplastic astrocytomas (WHO grade III) in this study. Patient characteristics are shown in Table 1. All included patients underwent initial surgical resection between January 2005 and December 2009 at the Department of Neurosurgery, Odense University Hospital, Denmark, and had received no treatment prior to surgical resection. Eligible astrocytomas had to have sufficient tissue left in the block for subsequent analysis. Two neuropathologists agreed on the diagnoses of all tumor samples in accordance with the WHO 2007 guidelines (Louis 2007). The scientific ethical committee and the Data Protection Authority approved the study.
Characteristics of the Ten Patients Included in the Present Study.
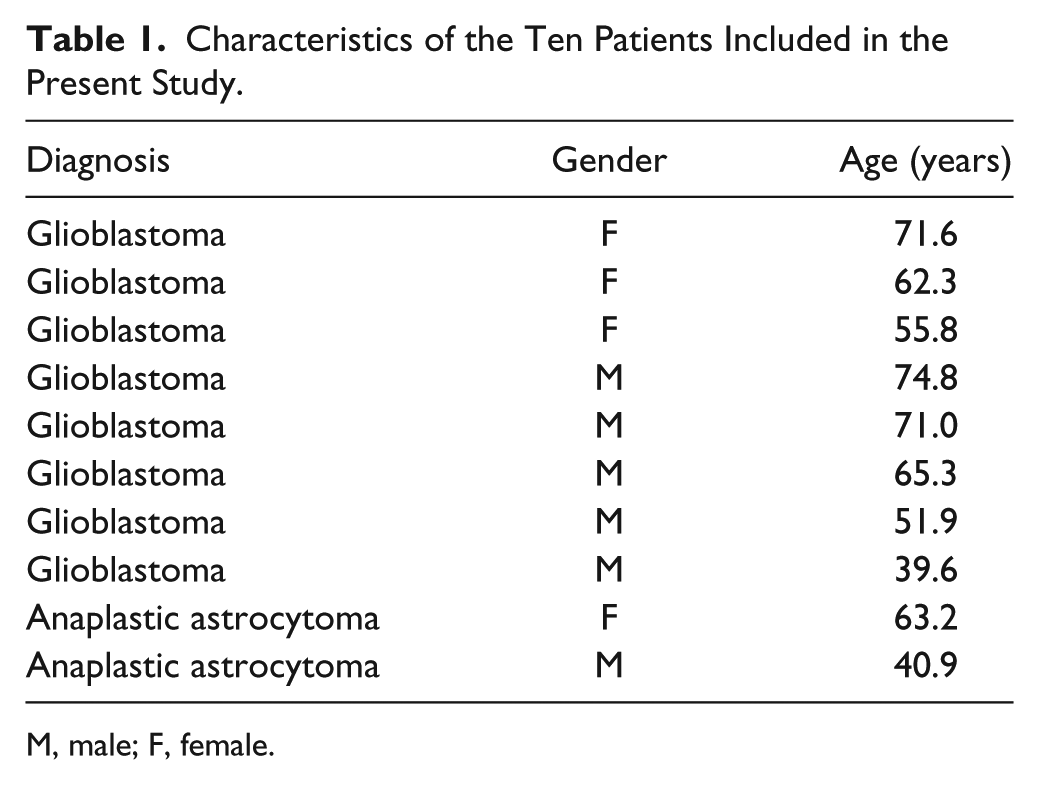
M, male; F, female.
Cell Cultures
In the present study, we used three glioblastoma short-term cultures (T78, T86, T87) established and characterized in our own laboratory (Jensen et al. 2013) and three commercial glioblastoma cell lines (A172, U87, T98G (ECACC, UK)). PTEN is deleted in the A172 cell line (Zhang et al. 2008b; Fan et al. 2002). Cells were cultured under normal in vitro culturing conditions in serum-free stem cell medium and grew as spheroids, as previously described (Hermansen et al. 2011).
Tissue and Cell Culture Preparation
Fresh tissue biopsies and cell cultures were fixed in 4% neutral-buffered formaldehyde and subsequently paraffin embedded. For minimal intra-slide variation, we used 6-µm sections for ISH, as recommended by the manufacturer (miRCURY LNA microRNA ISH Optimization Kit (FFPE) with Instruction manual v.2.0 (Exiqon; Vedbaek; Denmark)); 3-µm sections were used for conventional IHC. Sections were all mounted on Superfrost Plus slides (Thermo Scientific; Wilmington, DE).
In Situ Hybridization
For co-localization analyses, consecutive sections were obtained and stained for miR-21 and molecular markers, as described below (Fig. 1A). For miRNA ISH, slides were processed as recommended by the manufacturer using the miRCURY LNA microRNA ISH Optimization Kit (FFPE) with Instruction manual v.2.0 (Exiqon). The optimal proteinase-K condition was 15 µg/ml for 20 min at 37°C. For detection of miR-21, we used a full-length 22’mer (tcaacatcagtctgataagcta, RNA-Tm 84°C) double digoxigenin (DIG)-labeled miRCURY LNA miRNA detection probe (Exiqon). For process control, we used a single DIG-labeled probe for U6 small nuclear RNA (snRNA) (cacgaatttgcgtgtcatcctt, RNA-Tm 84°C). The performance of these probes has been described in detail previously (Jorgensen et al. 2010; Nielsen et al. 2011; Hermansen et al. 2013).
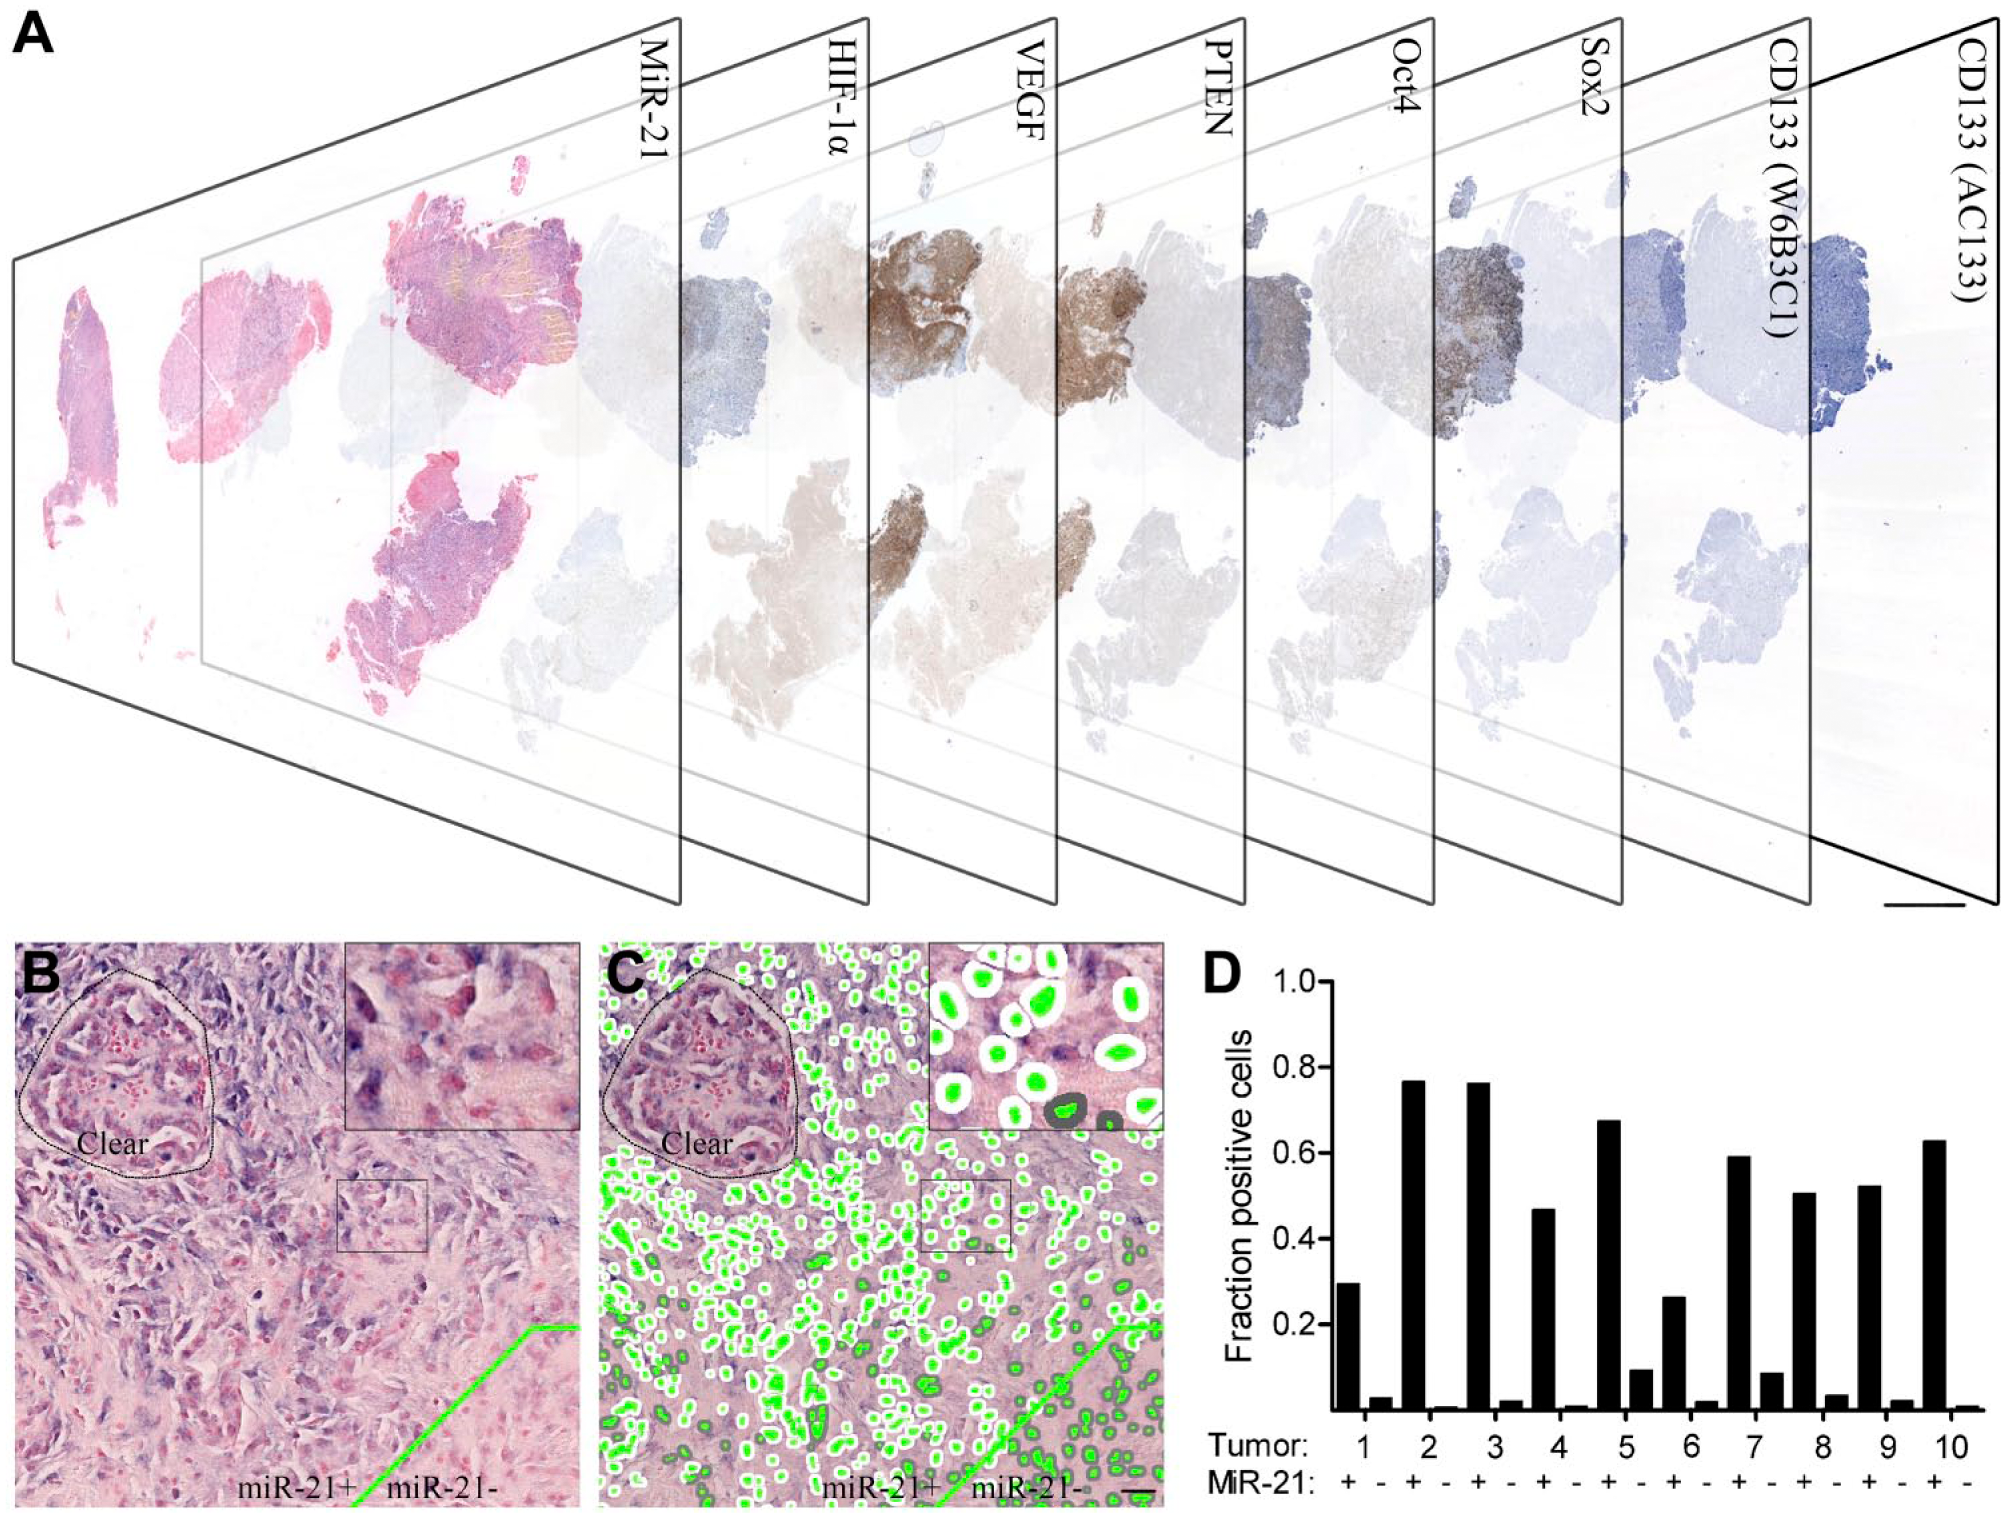
Co-localization setup using consecutive sections. Consecutive sections of ten high miR-21-expressing malignant astrocytomas stained with (reading from left to right) miR-21, HIF-1α, VEGF, PTEN, Oct4, Sox2, CD133 (W6B3C1) and CD133 (AC133) (A). MiR-21-positive and -negative areas (indicated by delineation of the two compartments) were identified and aligned to the same areas on consecutive sections; medium-to-large sized vessels were excluded (B). All tumors were classified with marker-specific pixel classifiers estimating the fraction of positive cells for each case, here illustrated by the miR-21 staining. The classifier successfully identified nuclei (green), positive cytoplasm (white) and negative cytoplasm (grey) (C). Quantitative fraction estimates were obtained for miR-21-positive and -negative areas in all ten tumors (D). Scale bar in (A) is 250 µm and scale bar in (B, C) is 100 µm.
Immunohistochemistry
The 3-µm paraffin sections were dewaxed with xylene and rehydrated in ethanol. Endogenous peroxidase activity was quenched by incubating slides in 1.5% hydrogen peroxide. The sections were then incubated for 60 min with primary antibodies diluted in EnVision FLEX Antibody Diluent (Dako; Glostrup, Denmark). See Table 2 for details on antibody clones, vendors and applied dilutions. Antigen-antibody complexes were visualized with peroxidase-based detection systems (Table 2) using diaminobenzidine (DAB) as a substrate, which develops into a dark brown precipitate. Sections were then counterstained with Mayer’s hematoxylin (Bie & Berntsen; Herlev, Denmark) for 2 min and coverslips were mounted with Aquatex (Merck; Darmstadt, Germany). Omitting primary antibodies served as negative controls as well as controls for nonspecific staining related to the detection systems alone. For each of the molecular markers, appropriate tissue(s) were used for positive controls (Table 2). Positive and negative controls were included in every run. IHC for the markers HIF-1α, VEGF (Zhang et al. 1998), Oct4, Sox2, CD133 (W6B3C1) and CD133 (AC133) was carried out on the Dako Autostainer Universal Staining System; PTEN (Lotan et al. 2011) IHC was carried out on the BenchMark Ultra instrument (Ventana Medical Systems Inc.; Tucson, AZ). At present, the identification of CD133 is controversial and we therefore included two commonly used primary CD133 antibodies. We have described and characterized the staining for CD133 in detail previously (Hermansen et al. 2011). The PTEN D4.3 antibody employed in this study was reported to outperform a number of PTEN antibodies and showed 100% sensitivity and 97.8% specificity for detecting genomic alterations in an array of 60 different cancer cell lines (The NCI-60 cell line panel; Lotan et al. 2011). Additionally, the staining matched the PTEN allele status in cancer cells and corresponded well with results obtained from patient samples examined with fluorescent ISH (FISH), the current gold standard for evaluating PTEN status.
Immunohistochemistry.
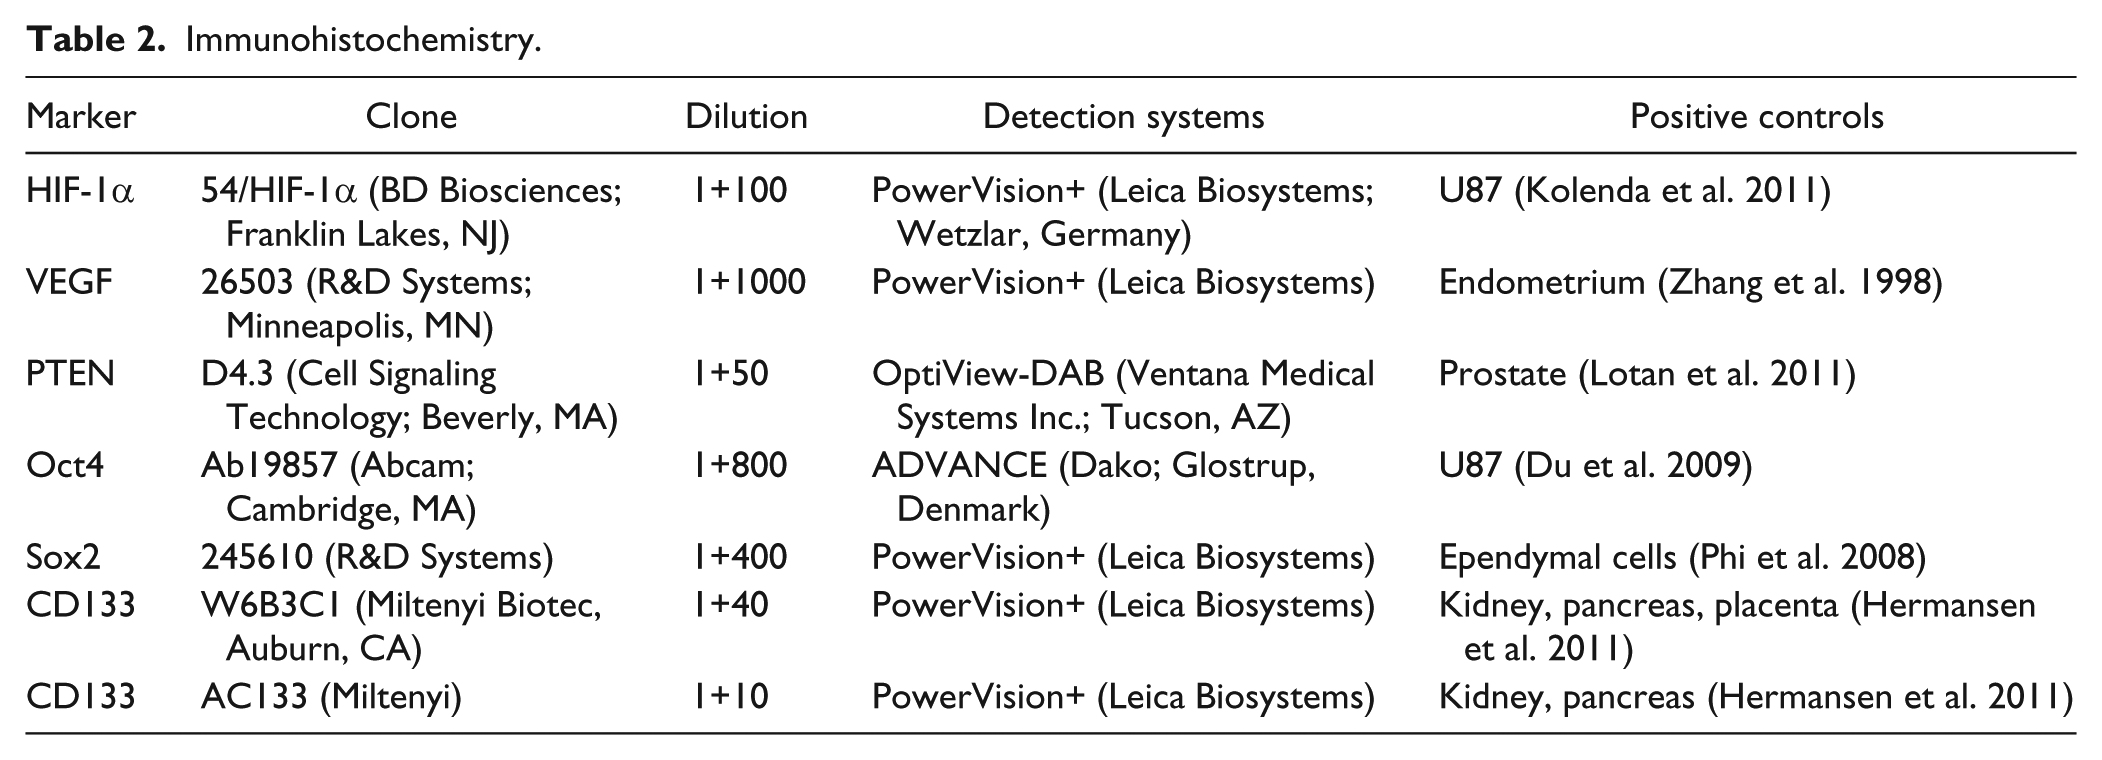
Image Analysis and Quantitation
Digital whole slides were obtained using the Nanozoomer 2.0-HT (Hamamatsu, Japan). For image analysis, the digital whole slides were processed using the Tissuemorph DP software (Visiopharm; Hørsholm, Denmark) (see Fig. 1). Two approaches were used to obtain estimates of the level of co-localization, a cell fraction estimate and a tumor fraction estimate, where the cell fraction estimate is related to individual tissue compartments and the tumor fraction estimate is considered global. The cell fraction estimates are based on the prevalence of marker-positive cells within predefined tumor areas (miR-21-positive and -negative areas). The tumor fraction estimates represent the total number of marker positive cells within the whole tumor area.
Pixel Classifiers
For each of the markers miR-21, HIF-1α, VEGF, PTEN, Oct4, Sox2 and CD133, a pixel classifier was developed using the Tissuemorph DP software tools. The classifiers can quantitate the amount of cells whose nuclei or cytoplasm exceed a predefined intensity threshold in the blue ISH signal or the brown IHC DAB stain. An appropriate intensity threshold was established for each marker. The classifiers were designed to first identify all cell nuclei, then to create a 3–4-µm broad cytoplasmic perimeter around all nuclei. Segregation of positive and negative cells was then based on intensity thresholds in the perimeter using the color bands representing NBT-BCIP (blue) or DAB (brown). The same procedure was used for markers with a nuclear distribution, except that segregation of positive and negative nuclei was based on staining intensity in the nuclei themselves.
Tissue Identification and Refinement
The consecutive digital slides were aligned (Fig. 1a). The tumor area (>25 mm2) was encircled on all of the virtual slides and areas, avoiding or excluding normal brain parenchyma, necrotic tissue, tissue artefacts and staining artefacts. Also, large-sized blood vessels were excluded to avoid interference with tumor cell-derived miR-21 expression. In the cell cultures, co-localization measurements were obtained by identifying miR-21-positive and -negative spheroids and aligning them on consecutive sections.
Quantitative Assessment
To obtain cell fraction estimates relative to miR-21 expression, the miR-21-positive and -negative areas were defined and aligned to the same areas on the consecutive sections stained with IHC biomarkers (Fig. 1A, 1B). Note that for miR-21, not all cells in the miR-21-positive areas were miR-21 positive, and therefore the miR-21-positive cell fraction varied from tumor to tumor (Fig. 1C, 1D). Similarly, cell fraction estimates were obtained for the individual IHC markers in the miR-21-positive and -negative tumor areas. To obtain tumor fraction estimates, the total number of positive and negative cells was counted in the entire tumor area. The tumor fraction estimates were then calculated as the number of positive cells relative to the total number of cells.
Statistical Analysis
Statistical analysis was carried out using Prism 5.0 (Graphpad Software; La Jolla, CA) with an overall significance level of p<0.05. D’Agostino and Pearson omnibus normality test was used to test for Gaussian distribution. Differences between the means of expression estimates were computed using paired t-tests and Wilcoxon matched-pairs test. Correlation between study variables was calculated using the Spearman’s rank correlation coefficients for nonparametric distribution.
Results
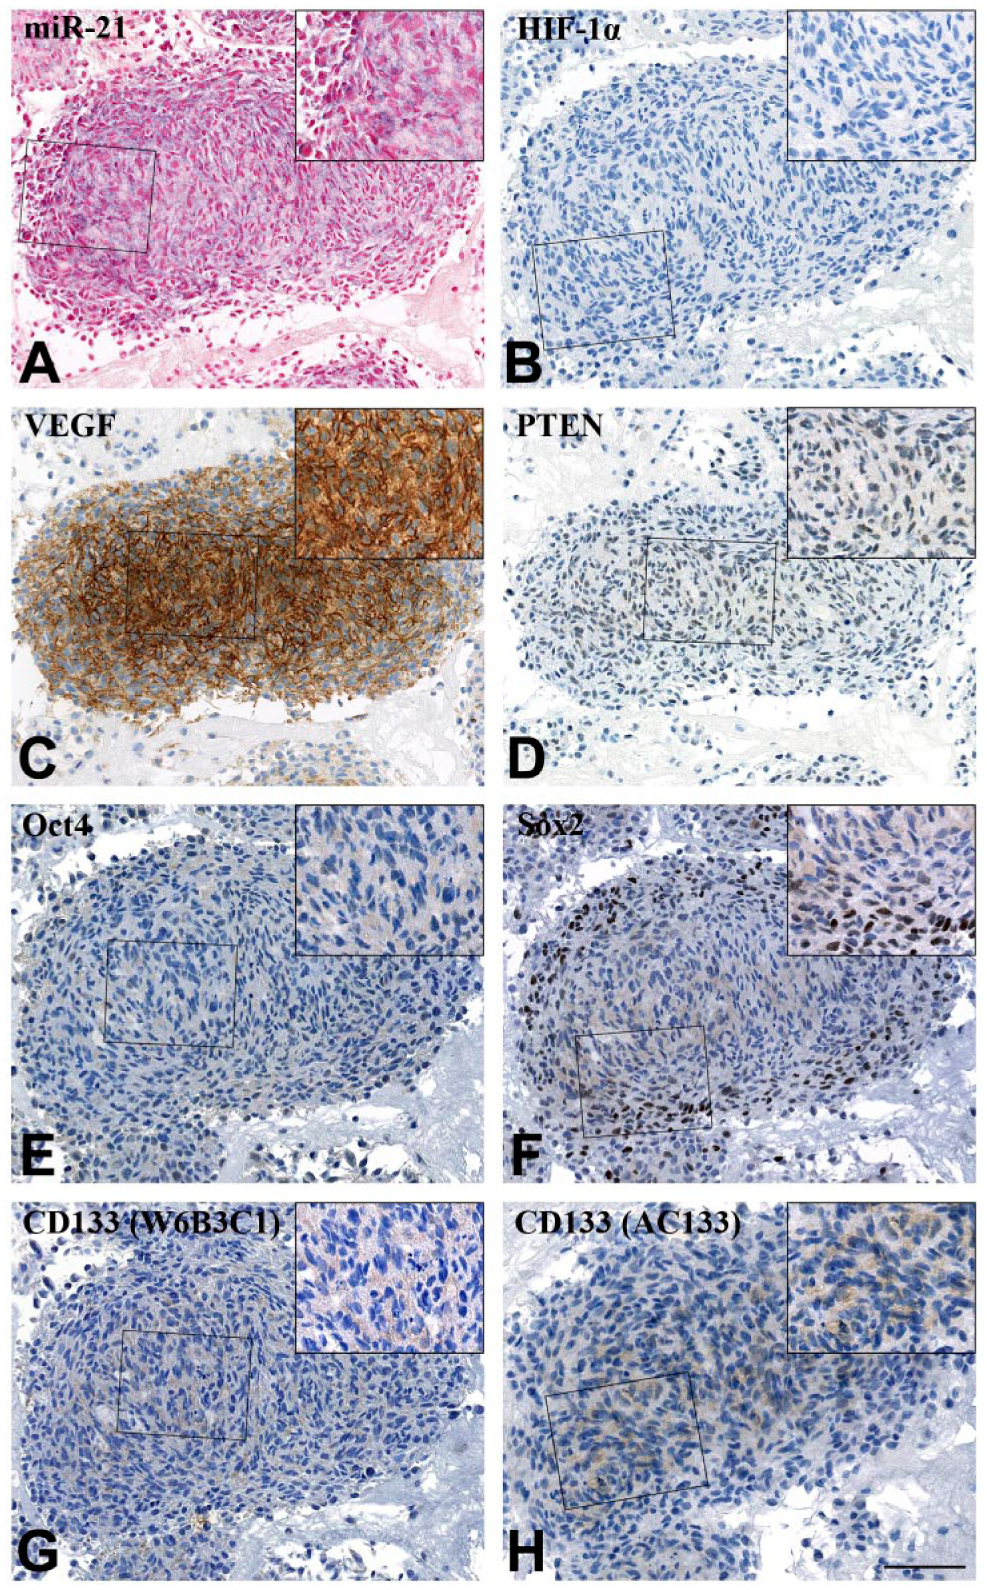
In general, the miR-21 ISH signal localized to the cytoplasm of distinct populations of tumor cells and tumor-associated blood vessels (Fig. 2A). Increased miR-21 staining intensity in tumor cells was often seen around necrotic foci. We have described the miR-21 expression pattern in gliomas in detail previously (Hermansen et al. 2013). HIF-1α IHC staining was selectively seen in the nuclei of tumor cells, and these positive cells often surrounded necrotic areas (Fig. 2B). VEGF IHC staining was seen in both nuclei and cytoplasms of tumor and endothelial cells as well as in the surrounding extracellular matrix, corresponding to secreted VEGF. An intense VEGF staining pattern was often observed in endothelial cells and, similar to HIF-1α, VEGF staining was often intense near necrotic areas, as previously reported (Shweiki et al. 1992) (Fig. 2C). PTEN staining was seen in the nucleus and cytoplasm of both tumor cells and blood vessels as well as in the extracellular matrix, as also described by others (Sano et al. 1999; Carico et al. 2012) (Fig. 2D). The putative stem cell markers showed diverse expression patterns. Oct4 staining was seen in the nucleus and cytoplasm of a subset of tumor cells (Fig. 2E), whereas Sox2 staining was seen in the majority of cells with an intense nuclear signal (Fig. 2F). The two antibodies against CD133 (W6B3C1 and AC133) both displayed a cytoplasmic and/or membranous staining, with positive cells occasionally located in perivascular niches (Fig. 2G, 2H), as we previously have described (Hermansen et al. 2011).
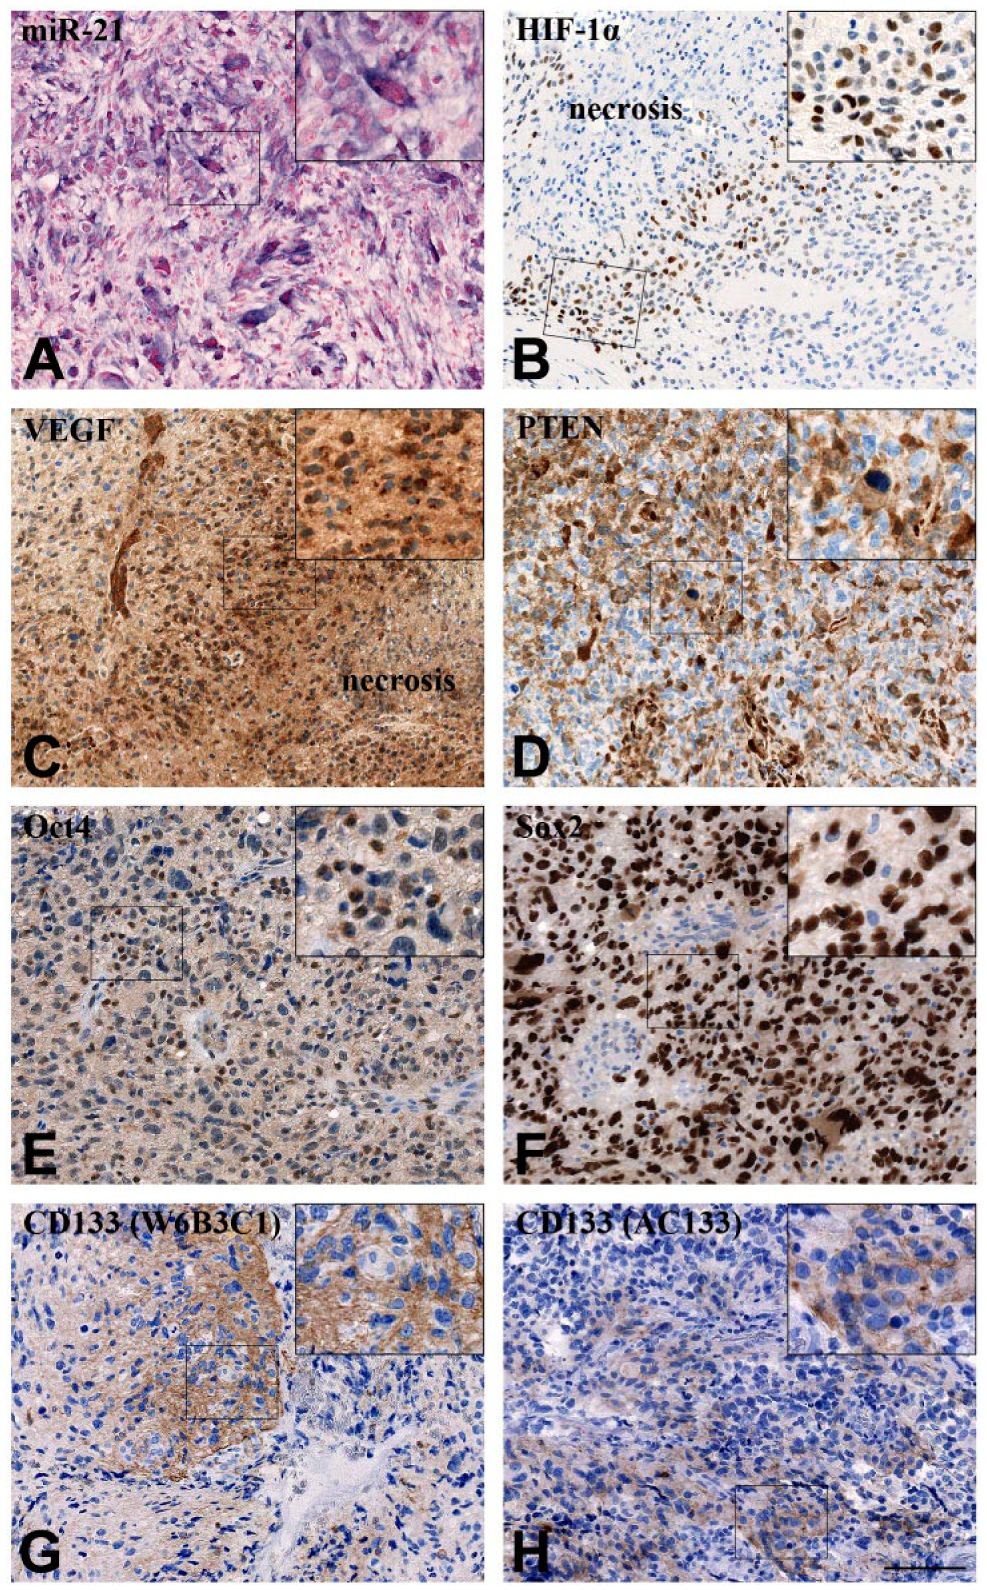
Representative staining patterns for miR-21 and the molecular markers HIF-1α, VEGF, PTEN, Oct4, Sox2, CD133 (W6B3C1) and CD133 (AC133) in glioblastoma. (A) miR-21 signal was mainly localized to the cytoplasm of distinct populations of tumor cells. (B) HIF-1α had a clear nuclear localization with positive cells often near necrotic areas. (C) VEGF localized to the nucleus and cytoplasm of tumor and endothelial cells with a large part of the signal being extracellular. VEGF staining was often intense near necrotic areas. (D) PTEN localized to the nucleus and cytoplasm of tumor and endothelial cells, with part of the signal being extracellular. (E) Oct4 localized to the nucleus and cytoplasm of some tumor cells. (F) Sox2 staining was mainly nuclear and seen in virtually all cells. (G–H) CD133, detected with the two antibody clones (G) W6B3C1 and (H) AC133 was seen as a cytoplasmic staining, with positive cells occasionally located in perivascular niches. Scale, 100 µm.
We then performed an image analysis-based co-localization analysis allowing global alignment and quantitation of the individual molecular markers, and assessment of the miR-21 ISH signal against the IHC staining obtained with the seven different antibodies.
Cell Fraction Estimates
Cell fraction estimates represent the fraction of positive cells for each marker out of the total number of cells in miR-21-positive and miR-21-negative areas, respectively. The cell fraction estimates were successfully obtained for all the eight markers in all samples: miR-21, HIF-1α, VEGF, PTEN, Oct4, Sox2, CD133 (W6B3C1) and CD133 (AC133). The miR-21-positive tumor cells showed a significant degree of co-localization with HIF-1α (p=0.0020) and VEGF (p=0.0096) across the ten malignant astrocytomas (Fig. 3A). Looking exclusively at the glioblastomas, the same co-localization pattern emerged for miR-21 with HIF-1α (p=0.0078) and VEGF (p=0.0108) (Fig. 3B). The significant co-localization of miR-21 with HIF-1α or VEGF was remarkably clear (Fig. 4) and suggests a linkage between miR-21 and glioblastoma angiogenesis. Interestingly, we did not see lower levels of PTEN in the miR-21-positive areas, suggesting that PTEN downregulation mediated by miR-21 may not be the central mechanism for elevated HIF-1α/VEGF levels in gliomas. We did not see co-localization between miR-21 and any of the stem cell markers in the ten tumors, suggesting a minor role for miR-21 in maintaining stemness.
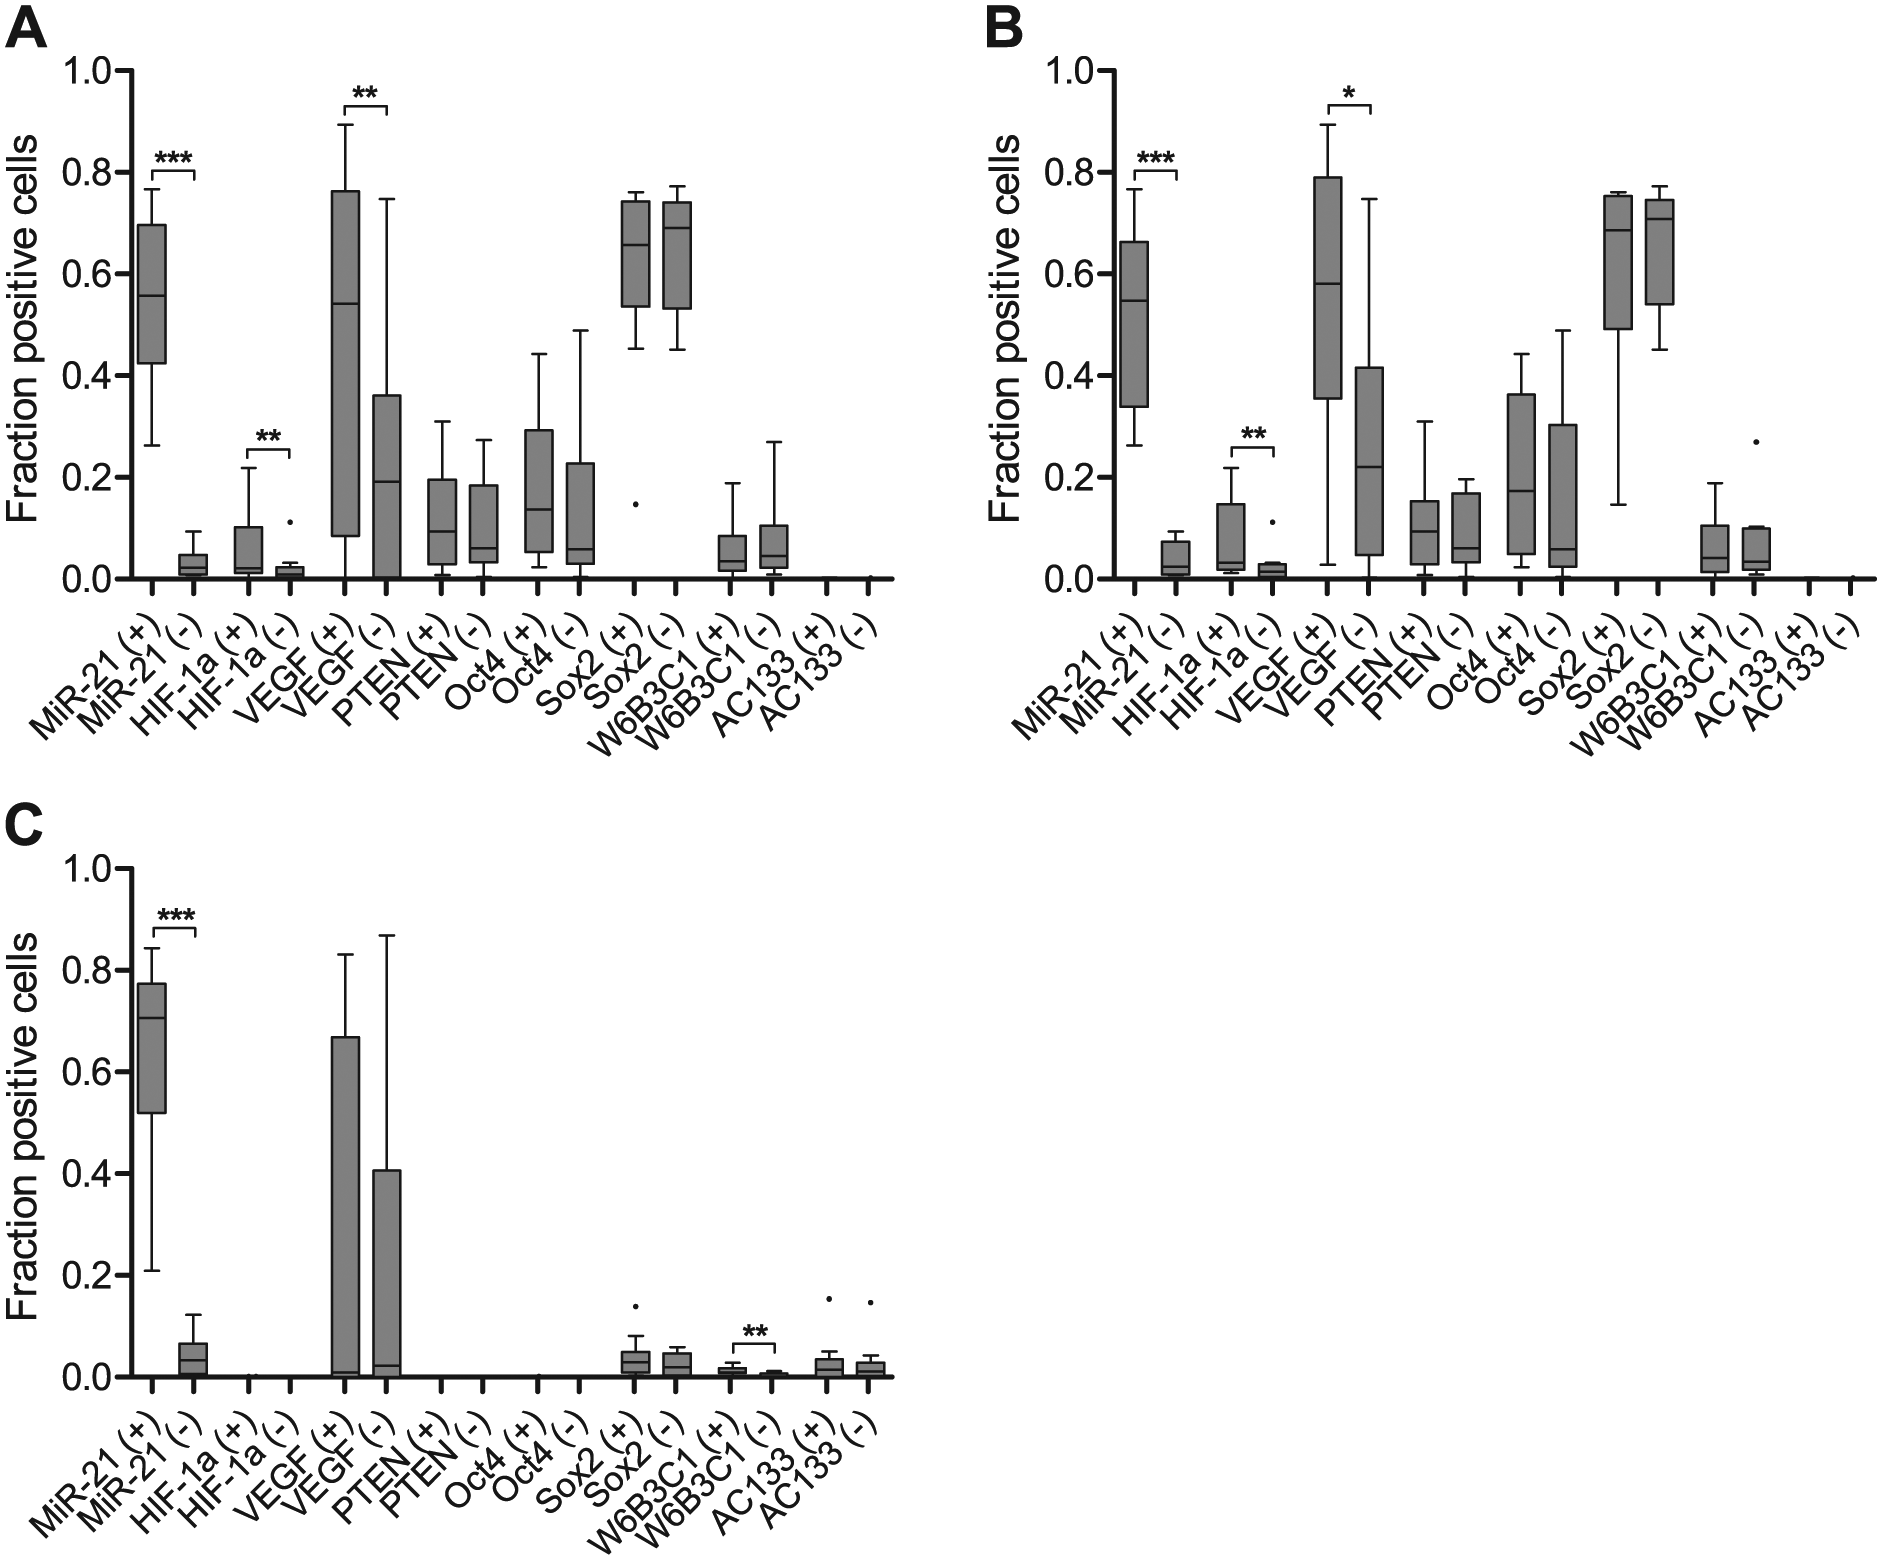
Quantitative estimates reflect significant co-localization of miR-21 with HIF-1α or VEGF. (A–B) miR-21 co-localized significantly with HIF-1α and VEGF in all (A) astrocytic tumors and (B) glioblastomas. This relationship was not apparent in the PTEN-deleted glioblastoma cell line, A172 (C). A172 showed a significant relation between miR-21 and CD133 when investigated with the W6B3C1 antibody. Plus (+) and minus (-) denote miR-21-positive and miR-21-negative areas, respectively. The illustration was carried out using Tukey box-plots with whiskers that go 1.5 times the interquartile range (data beyond are shown as points). ***p<0.001, **p<0.01, *p<0.05.
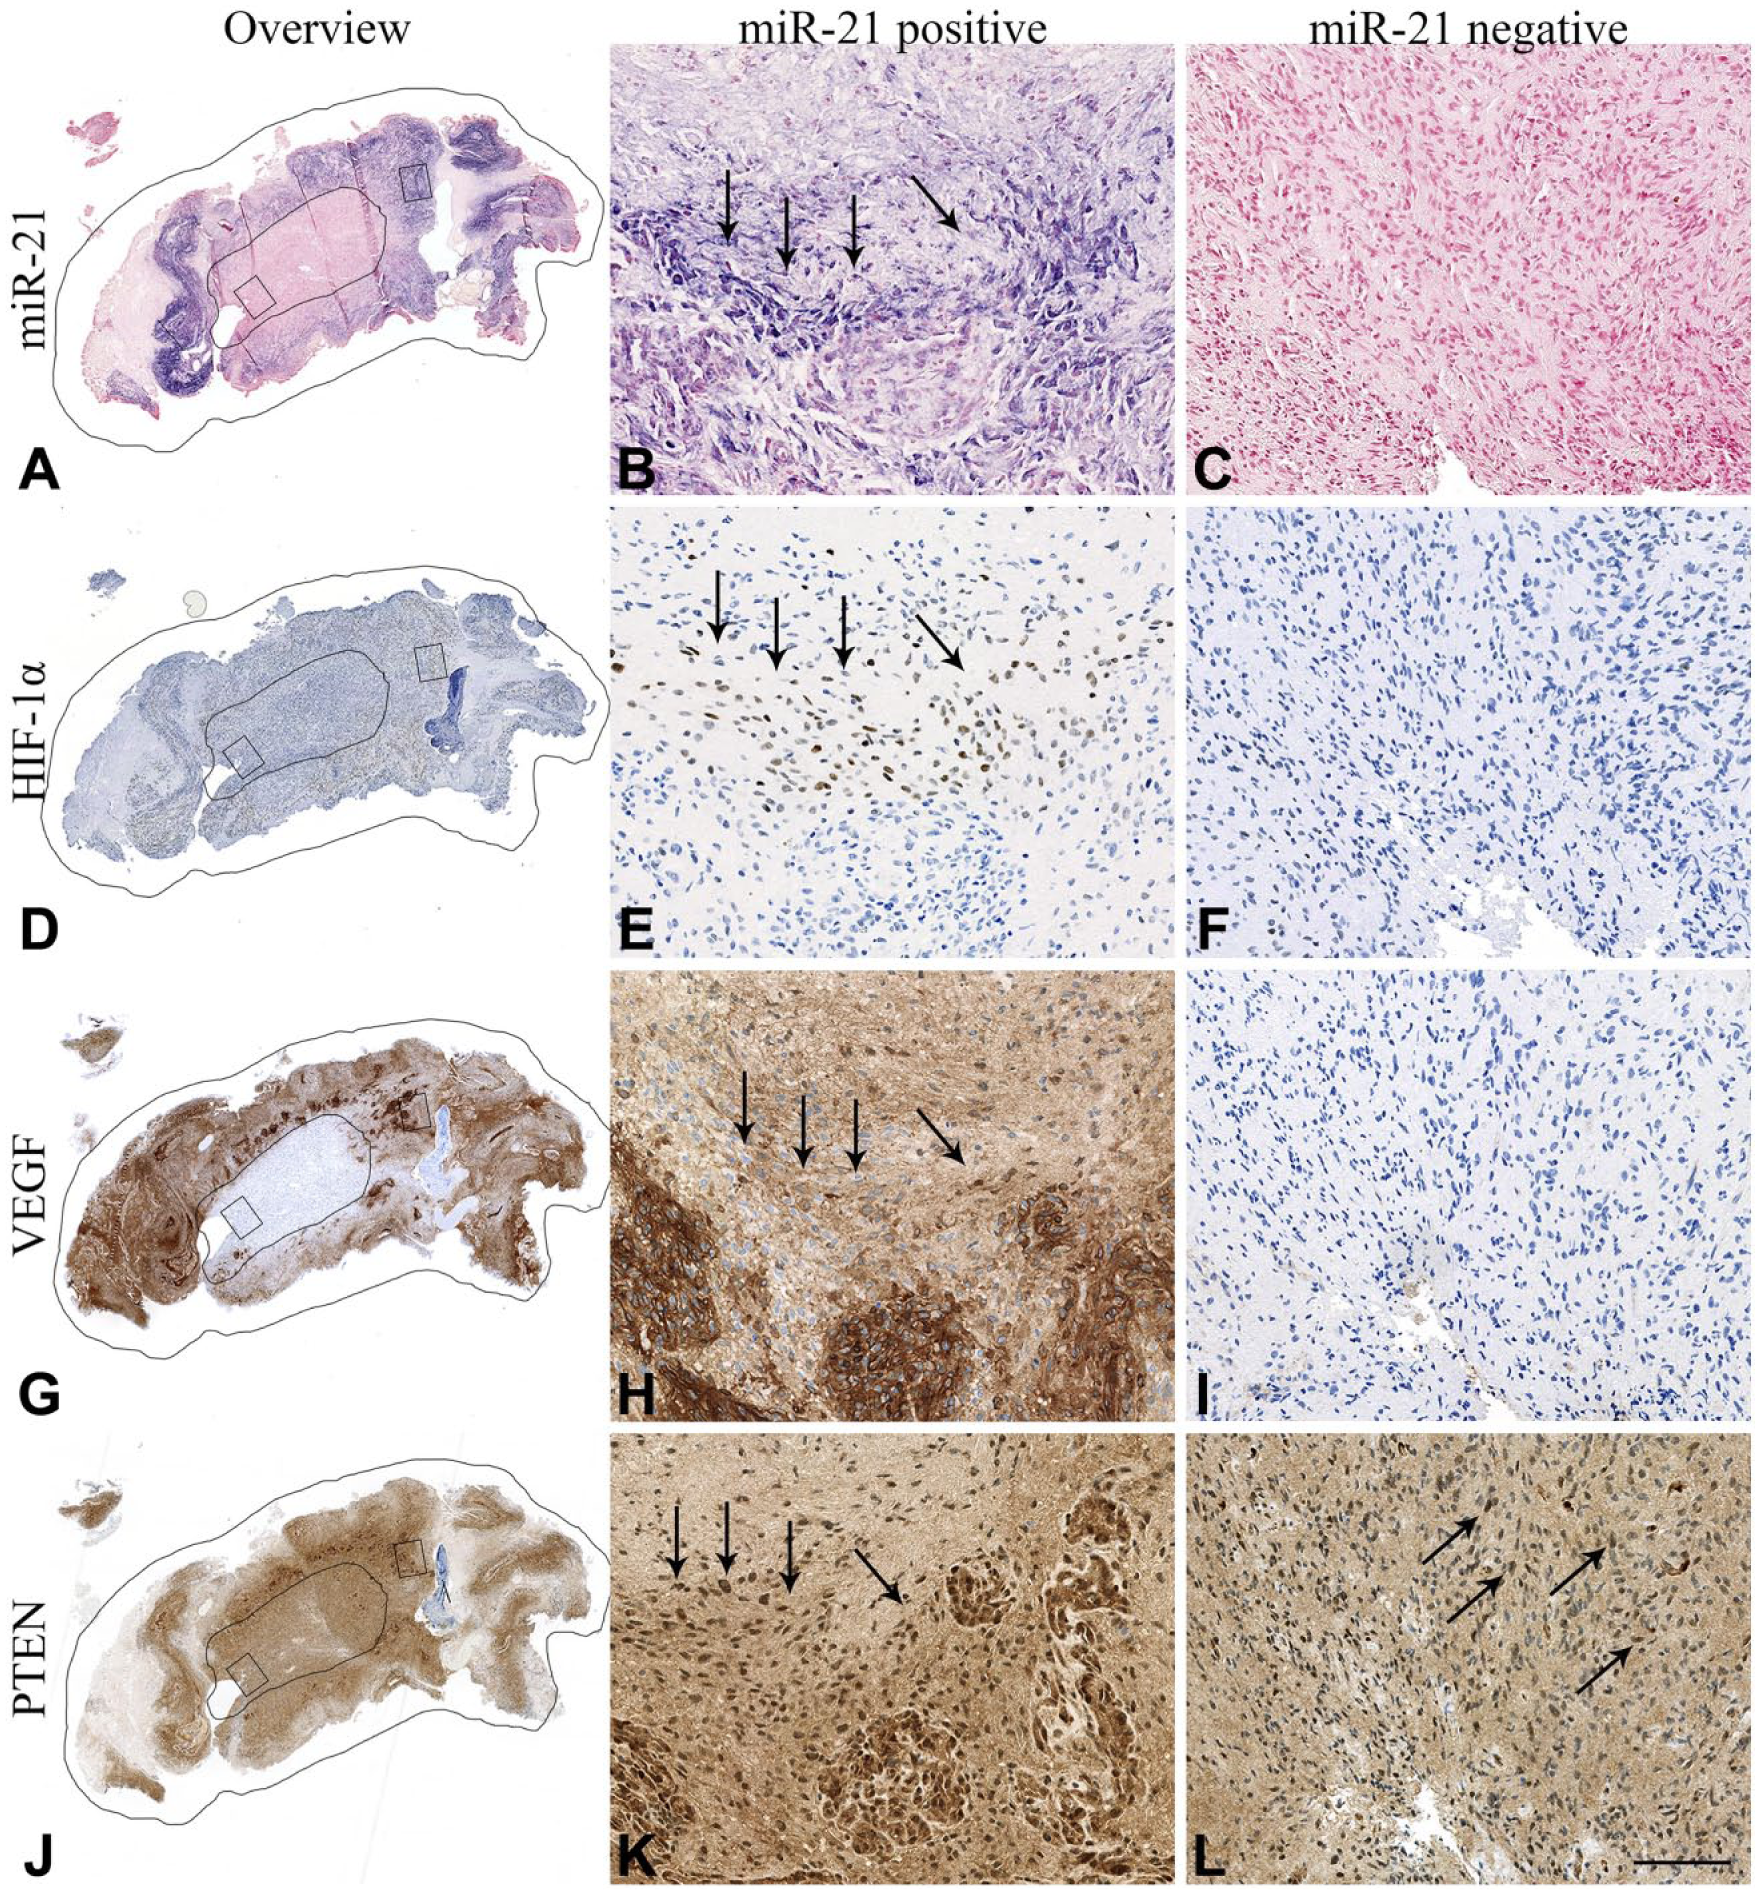
miR-21 is co-localized with angiogenic markers. Overviews together with high-magnification images illustrate co-localization between miR-21 (A–C) and angiogenic markers HIF-1α (D–F) and VEGF (G–I). Downregulation of the miR-21 target, PTEN, was not observed in the miR-21-positive areas (J–L). miR-21-positive/negative areas and high-magnification areas are delineated in the overview images (A, D, G, J). Arrows point to areas with positive cells. Scale, 100 µm.
Three glioblastoma short-term cultures (T78, T86, T87) and three commercial glioblastoma cell lines (A172, U87, T98G) were stained for miR-21. Only A172 was miR-21 positive and could thus be included for co-localization studies (Fig. 5). No significant associations to HIF-1α, VEGF or the putative target PTEN in the A172 tumor cell spheroids were found (Fig. 3C). PTEN is deleted from the A172 cell line (Fan et al. 2002; Zhang et al. 2008b), and this matches our quantitative estimates (Fig. 3c). A172 was also negative for HIF-1α and Oct4. Significant co-localization was only apparent between miR-21 and CD133 when stained with the W6B3C1 antibody (p=0.0035). This was not observed with any of the other stem cell markers.
Molecular markers visualized on consecutive sections of the same A172 glioblastoma cell line spheroid. (A–D) The particular spheroid was positive for miR-21 and VEGF but negative for HIF-1α and PTEN. (E–H) Few A172 cells were positive for putative CSC markers Oct4, Sox2, CD133 (W6B3C1) and CD133 (AC133). However, cells covering the edge of the spheroid were Sox2+ (F). Scale, 100 µm.
Tumor Fraction Estimates
Tumor fraction estimates represent the fraction of positive cells for a given marker out of all cells in the entire tumor, and would reveal the existence of an overall correlation between the tumor expression of miR-21 and the tumor expression of any included marker. This analysis showed that none of the tumor fraction estimates of individual protein markers correlated with the fraction estimates of miR-21 (Table 3).
Overall Correlations between the Tumor Expression of miR-21 and the Tumor Expression of Any Included Marker for All Ten Tumors.
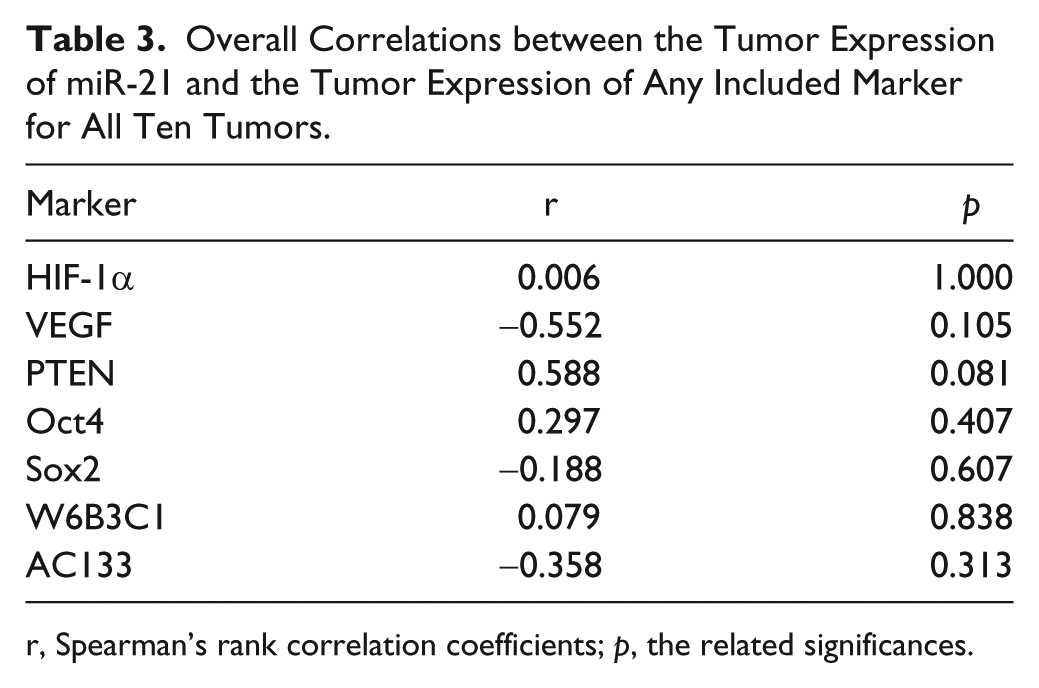
r, Spearman’s rank correlation coefficients; p, the related significances.
Discussion
miR-21 is highly upregulated in malignant gliomas, with the highest expression associated with poor prognosis both when measured with RT-qPCR and ISH analyses (Hermansen and Kristensen 2013). By ISH analysis, we previously reported that miR-21 is associated with two major cellular compartments: vessels and tumor cells (Hermansen et al. 2013). In these cell compartments, miR-21 expression was not consistently expressed, but showed highly variable levels within the same tumor as well as in different tumors, indicating dynamic molecular activities in the tumors. Identification of particularly high levels of miR-21 in glioma vasculature and in tumor cells bordering necrotic areas, suggested involvement in glioma angiogenesis. In this study, we investigated the co-localization of miR-21 and the angiogenesis markers HIF-1α and VEGF and found that miR-21 is significantly co-localized with these two markers. The lack of (negative) correlation with the miR-21 target PTEN in the same tissue compartment suggested that PTEN plays a minor role in the link between miR-21 and PTEN’s downstream effectors HIF-1α and VEGF.
To study the relationship between miR-21 and various molecular markers, we performed image analysis-based co-localization, which allowed for global alignment and quantitation of the individual markers. In the tissue compartments of interest, here miR-21-positive and miR-21-negative, we measured the IHC staining obtained with specific antibodies. To analyze hypoxic areas, we employed antibodies against HIF-1α and VEGF. Glioblastomas, a subgroup of malignant astrocytomas, are among the most vascularized tumors and have increased expression of many pro-angiogenic factors, including VEGF, a key player in tumor angiogenesis (Kim et al. 1993; Pietsch et al. 1997). HIF-1α is a key regulator of VEGF and is upregulated in hypoxic tissue, particularly in cells located at necroses, which are frequent in malignant tumors. Downregulation of PTEN, which can be mediated by miR-21 (Meng et al. 2007; Zhang et al. 2010; Han et al. 2012), can activate the PI3K/Akt/mTOR pathway and thereby induce production of HIF-1α and VEGF (Cancer Genome Atlas Research Network 2008; Karar and Maity, 2011). Thus, it appeared obvious to test in more detail the link between miR-21 and HIF-1α, and miR-21 and VEGF. Our image analysis based-comparison of staining intensities and distribution, showed a significant co-localization between miR-21 and both HIF-1α and VEGF, supporting the assumption that miR-21 is involved in hypoxia induced vascularization of brain tumors (Forsythe et al. 1996; Liu et al. 2011)
Interestingly, we found no inverse expression between miR-21 and PTEN. There may be several explanations as to why we were unable to identify such an expression pattern. First, studies have suggested that miR-21 directly mediates PTEN downregulation by binding to the PTEN 3’-UTR (Meng et al. 2007; Zhang et al. 2010; Liu et al. 2011; Han et al. 2012). Although some binding can be established to the PTEN 3’-UTR in reporter gene assays (Zhang et al. 2010), recent miRNA target prediction algorithms do not predict a miR-21 binding site in that region (Reczko et al. 2012; Paraskevopoulou et al. 2013). Also, alternative PTEN splice variants lacking a potential miR-21 binding site will make PTEN expression independent of miR-21, or PTEN pseudogenes may possess sponge activity for miR-21, causing a reduction in miR-21 activity towards a functional PTEN transcript (Wang et al. 2013). Furthermore, the PTEN gene is located at 10q23.3, and loss of heterozygosity (LOH) at 10q is frequent in primary glioblastoma (70%) (Louis 2007); however, the homozygous deletion of PTEN is rare (<2%) (Knobbe and Reifenberger 2003). PTEN is mutated in approximately 25% of glioblastomas (Duerr et al. 1998; Tohma et al. 1998; Knobbe et al. 2002; Louis 2007) and, if mutated PTEN is identified alongside functional PTEN, then quantitative estimates could be overstated. Thus, in the present setup, bias could be introduced regarding cases with homozygous PTEN-deleted tumors, because PTEN would be lacking and therefore cannot be regulated by miR-21. Finally, the lack of an inverse relationship between miR-21 and PTEN may be related to the PTEN antibody employed in this study. We used a PTEN antibody that has been reported to accurately reflect PTEN allele status in FFPE cancer cell lines containing or lacking intact PTEN alleles (Lotan et al. 2011), indicating a high level of specificity for this antibody. Taken together, PTEN IHC is not easily interpretable, and better tools to identify PTEN target transcripts in situ would be needed to address a role of miR-21 in the regulation of PTEN expression.
In this study, we also addressed the possibility that miR-21-positive tumor cells may comprise a group of CSCs. Because the miR-21-positive tumor cell tissue compartment was found to be associated with poor prognosis in our ISH study of primary gliomas (Hermansen et al. 2013), we hypothesized that the miR-21-positive tumor cells may comprise a particularly aggressive subset of tumor cells. In relation to studies of CSCs obtained from various tumor types that implicate miR-21 in cancer cell stemness, it was tempting to address miR-21 expression in relation to CSC markers in malignant astrocytomas. Using our image analysis setup, we compared the miR-21 ISH signal with that of the IHC staining of putative stem cell markers Oct4, Sox2 and CD133. Notably, these three CSC markers showed variable expression patterns, indicating that the CSCs are not a well-defined cellular entity. For identification of CD133, we even employed two different primary antibodies. Taken together, our analyses do not suggest any correlation between miR-21 and the staining obtained with any of these four antibodies. However, because of the lack of specific CSC markers, it cannot be excluded that the miR-21-positive cancer cells possess CSC properties.
The relatively high VEGF expression observed in the A172 cell line could be explained by growing cells in epidermal growth factor (EGF)-enriched media, because activation of the EGF receptor is known to stimulate the production of VEGF (Goldman et al. 1993; Maity et al. 2000; Pore et al. 2003). The A172 cell line was grown at normoxia and did not express HIF-1α. In these conditions, miR-21 did not co-localize with VEGF, which is in line with results suggesting that HIF-1α is central for miR-21-induced upregulation of VEGF (Liu et al. 2011). Thus, assessing angiogenesis in in vitro models, where the growth medium is commonly enriched with growth factors and where cells are grown under normoxic conditions, might hide the principal angiogenic mechanism utilized by astrocytoma cells in the actual tumors. We speculate that the relatively high miR-21 expression in A172 cells might be related to an upholding of the anti-apoptotic and proliferative machinery.
In conclusion, we have developed an image analysis-based co-localization approach allowing global alignment and quantitation of miR-21 against individual markers specific for various cellular entities. This approach may prove useful for the systematic analysis of miRNA expression in general and parallel discovery of their cellular functions and their putative target pathways. Here, we found a significant correlation for miR-21 with HIF-1a and VEGF, implying a link between miR-21 and glioblastoma angiogenesis.
Footnotes
Acknowledgements
We acknowledge the excellent laboratory work done by technicians Helle Wohlleben and Tanja Dreehsen Højgaard.
Author Contributions
SKH performed the in situ hybridization and the immunohistochemical stainings. SKH, BSN, CA and BWK interpreted and analyzed the in situ hybridization and the immunohistochemical stainings. SKH, BSN, and BWK designed the study and drafted the manuscript. All authors have read and approved the final manuscript.
Competing Interests
The authors declared no potential conflicts of interest with respect to the research, authorship, and/or publication of this article.
Funding
The authors disclosed receipt of the following financial support for the research, authorship, and/or publication of this article: The work was supported by the Region of Southern Denmark, The Research Council for Health and Disease, The Ministry of Higher Education and Science, The grant of Else and Aage Grønbæk-Olsen, The Foundation of Merchant M. Kristian Kjær and wife Margrethe Kjær born la Cour-Holmen, The grant of fmr. Dir. Leo Nielsen and wife Karen Margrethe Nielsen for medical basic research, The Beckett Foundation, Research Foundation of University of Southern Denmark, The Foundation of Fam. Hede Nielsen, The Foundation of Margot and John Friberg, The Foundation of Dir. Jacob Madsen and wife Olga.